Article

Study of the Sorption Properties of Natural Zeolite in Relation to Indium(III) and Gallium(III) Cations on the Model Systems

by
Gita Sultanbayeva
,
Aktolkyn Agatayeva
,
Raushan Kaiynbayeva
,
Nazym Kozhabekova
,
Raisa Chernyakova
* and
Umirzak Jussipbekov
A.B. Bekturov Institute of Chemical Sciences JSC, 106 Sh. Ualikhanovstr., Almaty 050010, Kazakhstan
*
Author to whom correspondence should be addressed.
Crystals 2022, 12(9), 1220; https://doi.org/10.3390/cryst12091220
Submission received: 25 July 2022 / Revised: 4 August 2022 / Accepted: 11 August 2022 / Published: 29 August 2022
(This article belongs to the Special Issue Recent Developments of Inorganic Crystalline Materials)

Abstract

:
This paper presents the systematic studies of the sorption capacity of natural zeolite with respect to In3+ and Ga3+ cations in the model systems “natural zeolite–In3+–H2O” and “natural zeolite–In3+–Ga3+–H2O”, while varying a number of the main process factors. The patterns of sorption of In3+ and Ga3+ cations by the natural zeolite of the Shankanai deposit are revealed, depending on the zeolite vs. solution ratio, temperature, and time. It is shown that the sorption of In3+ cations by natural zeolite can be controlled by the process duration. The longer the process, the less the sorption by natural zeolite. It has been found that the sorption of In3+ cations in the “natural zeolite–In3+–Ga3+–H2O” model system depends on the amount of zeolite and temperature, and the sorption of Ga3+ cations depends on the temperature and time. The physicochemical characteristics of the spent sorbents confirm the sorption of the cations, present in the systems under study.

1. Introduction

The production of elemental phosphorus by electrothermal processing of phosphates is associated with the formation of various phosphorus-containing industrial wastes, including the HPV cottrel “milk”, which is a hard-to-destroy emulsion of variable composition, stabilized by highly active pollutants [1]. Its processing is difficult for a number of reasons. As a result, liquid phosphorus wastes are stored in settling tanks, and significant amounts of commercial phosphorus are lost. The presence of cottrel “milk” in phosphorus plants, operating on sintering raw materials, along with phosphorus and Ag, In, Ga and cyan-containing components, makes it possible to consider it as a cheap raw material source for obtaining rare and precious metals and ferrocyanides from a number of metals, which are not produced in the Republic of Kazakhstan, but are widely used [2,3]. Gallium and indium (Ga, In) are used in the electronic industry as conductors, superconductors, optical and magnetic materials, etc. There is practically no production of the above metals in Kazakhstan, they are purchased from abroad. From the analysis of the scientific and patent literature, it has been revealed that, firstly, the production of indium and gallium is a laborious, multi-stage process, often carried out at elevated temperatures and pressures, using expensive organic reagents. Secondly, there is a very limited number of published works on the extraction of these metals from mineral phosphorus-containing raw materials, including phosphorus production waste.
Taking into account the significant reserves of phosphorus production waste in Kazakhstan, the development of new methods for extracting a number of precious metals on the basis of domestic raw materials is very relevant.
In recent years, sorption methods have been widely used to purify the aqueous media, industrial effluents, and industrial wastes, where natural materials with high sorption properties, in particular zeolites, are used as sorbents [4].
The efficiency of the practical use of zeolite as a sorption raw material is stipulated by the peculiarities of the crystal structure, which consists of a three-dimensional structure of SiO4 and AlO4 tetrahedrons with channels, ranging in size from 3 to 20 Å, and has a negative charge [5]. A feature of the structure of the silicon–aluminum–oxygen frameworks of zeolites is the presence of a system of regular channels and communicating cavities, capable of holding ions, atoms and molecules of the substances, whose size corresponds to that of free space. Alkaline and alkaline-earth cations, which compensate for the negative charges of the aluminum–oxygen tetrahedrons of the framework, are located in these voids of the crystal lattice, occupying only a relatively small part of their volume. Depending on the temperature, zeolites are able to absorb water and many harmful substances (radionuclides, heavy metals, pesticides, nitrates). The results of a comparative study of copper ion extraction from aqueous solutions, using a natural zeolite of the Honguruu deposit (Yakutia), are presented in the work [6]. The high selectivity in ion exchange is associated with the ratio of the sizes of the exchanged ions, and the sizes of the cavities in the structure of zeolites [7].
The sorption capacity of zeolites from the Shankanai deposit (the Republic of Kazakhstan, the Almaty region) with respect to NH4+ ions, heavy and nonferrous metals has been shown in a number of works [8,9,10]. Natural zeolite from the Shankanai deposit is promising for the purification of aqueous media from iron ions [11,12], zinc, copper, and lead [13]. The possibility of groundwater purification from the ions of heavy and nonferrous metals with natural zeolite from the Shankanai deposit has been experimentally confirmed [13]. It has been established that, under static conditions, the degree of purification from zinc, copper, and lead cations is 3.75–4.0 times higher than that under dynamic ones. Indium is quite effectively extracted by the sorption method from the industrial wastes of mining and metallurgical enterprises [14]. According to information in the scientific literature, it can be assumed that the natural zeolite, during the purification of cottrel “milk”(CM) filtrate, will sorb the In3+ and Ga3+ cations present in the liquid phase of the CM. In this regard, systematic studies of the sorption capacity of natural zeolite with respect to the In3+ and Ga3+ cations have been carried out depending on a number of main process factors (temperature, time, and component ratio) in the “natural zeolite–In3+–H2O”and “natural zeolite–In3+–Ga3+–H2O” model systems.
Moreover, the purpose of this work describes the extraction of rare metals (In3+ and Ga3+) from phosphorus production wastes (cottrel“milk”), using natural zeolite from the Shankanai deposit.

2. Materials and Methods

For the experiment in this work, we used zeolite from the Shankanai deposit, with the content of the main components, wt.%: K2O—1.38; Na2O—0.95; Fe2O3—0.16; Al2O3—10.81; CaO—2.32; MgO—0.93; SiO2—65.28, and losses upon ignition—18.15. Natural zeolites of the Shankanai deposit (the Republic of Kazakhstan, the Almaty region) are composed of up to 80% geylandite-clinoptilolite [15]. The main properties of the porous structure of natural zeolite: sorption exchange capacity (SEC) for iodine—3.67 mg-eq/g, EC of the cation exchanger—0.997 mg-eq/g, SEC of the anion exchanger—0.4985 mg-eq/g, total pore volume—0.07 g/cm3 [16,17].
The specified concentration of cations was created by introducing the calculated amount of In(NO3)3∙3H2O and Ga(NO3)3∙3H2O salts into the solution. The initial and residual concentration of metals in the filtrate after their sorption was determined on a Perkin ElmerA Analyst 400 atomic absorption spectrometer (AAS) (PerkinElmer, Waltham, MA, USA). To quantify the multifactorial experiment, we used the method of mathematical planning (orthogonal rotatable 3-factor experiment of the 2nd order) [18,19,20].
The variable factors of the process in this study were: X1–the consumption rate of natural zeolite, i.e., the “natural zeolite (T): indium-, gallium-containing solution(L)”ratio, from 0.5 to 3 g per 100 g; X2—temperature, from 25 to 60 °C, andX3—time, which varied from 5 to 60 min (Table 1).
The constant factors were the concentrations of the In3+ and Ga3+ cations (100 mg/L), pH 4.
Sorption extraction of Ga(III) and In(III) cations by zeolite was carried out in a thermostat upon stirring. The sample was weighed on an analytical balance to the exactness of the fourth decimal place, quantitatively transferred into a 250 ml volumetric flask, and filtered. In the resulting filtrate, the content of the In3+ and Ga3+ cations was determined. The degree of sorption (R, %) was calculated by Formula (1):
R = C o C p C o · 100 %
where Co is the initial concentration of metal ions in the solution, mg/L; Cp is the concentration of metal ions in the solution after the interaction with the sorbent, mg/L.
The determined parameter was the residual content of In3+/Ga3+ (mg/L) in the systems under study after the sorption—YIn3+/Ga3+.
The experiment planning area was set, using the inequality:
−1 < xi < +1
where i = 1, 2, … n. Here х = −1 is the minimum value of the variable factor; х = +1 is the maximum value of the variable factor, i.e., xmid = (xmin+ xmax)/2.
The values of variables from the natural form to the encoded one were transformed according to the formula:
Xi = zi−zi0/Δzi
where zi—the value of the factors in natural terms at the lower or upper levels; zi0—the value of the factors at zero level (in the plan center); Δzi—an interval of variation along the axis.
The specific values of the planning factors and the results of the experiments are shown in Table 2.
Using computer processing of the experimental data, the following regression analysis was carried out. The accuracy of the results (dispersion of reproducibility) was determined by the formula:
S res 2 = i = 1 m ( y i y i ) 2 m l
To identify the zeolitesamples (before and after the sorption) the following physical research methods were used: scanning electron microscopy (SEM) JEOL brand “JXA-8230” (JEOL, Tokyo, Japan), IR spectroscopic analysis on a SpecordM-80 spectrophotometer in the spectral region 400–4000 cm−1, thermal analysis (DTA) was filmed with a Shimadzu DTG-60 (Shimadzu Scientific Instruments, Inc., Columbia, SC, USA), Philips FW 1700 X-ray diffraction analysis (XRD) (Amsterdam, The Netherlands).

3. Results and Discussion

3.1. Study of the Sorption Process in the “Zeolite–In3+–H2O” Model System

The study of the sorption capacity of natural zeolite with respect to indium (III)ions was carried out on the “natural zeolite–In3+–H2O”model system according to the planning matrix (Table 1).
The results obtained are presented in Table 2, the processing of which has made it possible to obtain the regression Equation (5), describing the effect of the (S:L) ratio, temperature, and time on the residual content of the In3+ cations (YIn, mg/L), as well as the degree of their sorption in the system under study at the end of the process.
As a result of processing the experimental data, the regression Equation (5) wasobtained, which makes it possible to calculate the residual content of the In(III) cations (YIn, mg/L) in the solution at the end of the sorption process by the zeolite, with various combinations of the main factors:
YIn = 62.811 + 12.704X3
The adequacy of the regression equation has been checked by the Fisher criterion by the ratio of variances:
F = S res 2 S repr
In this case, the residual variance is equal to:
S res 2 = i = 1 N ( y i y i ) 2 N l
where l is the number of significant coefficients in the regression equation, equal to 5.
It has been found that F < F1-р(f1,f2) = YIn 4.294 < 4.699, i.e., the equation adequately describes the experiment.
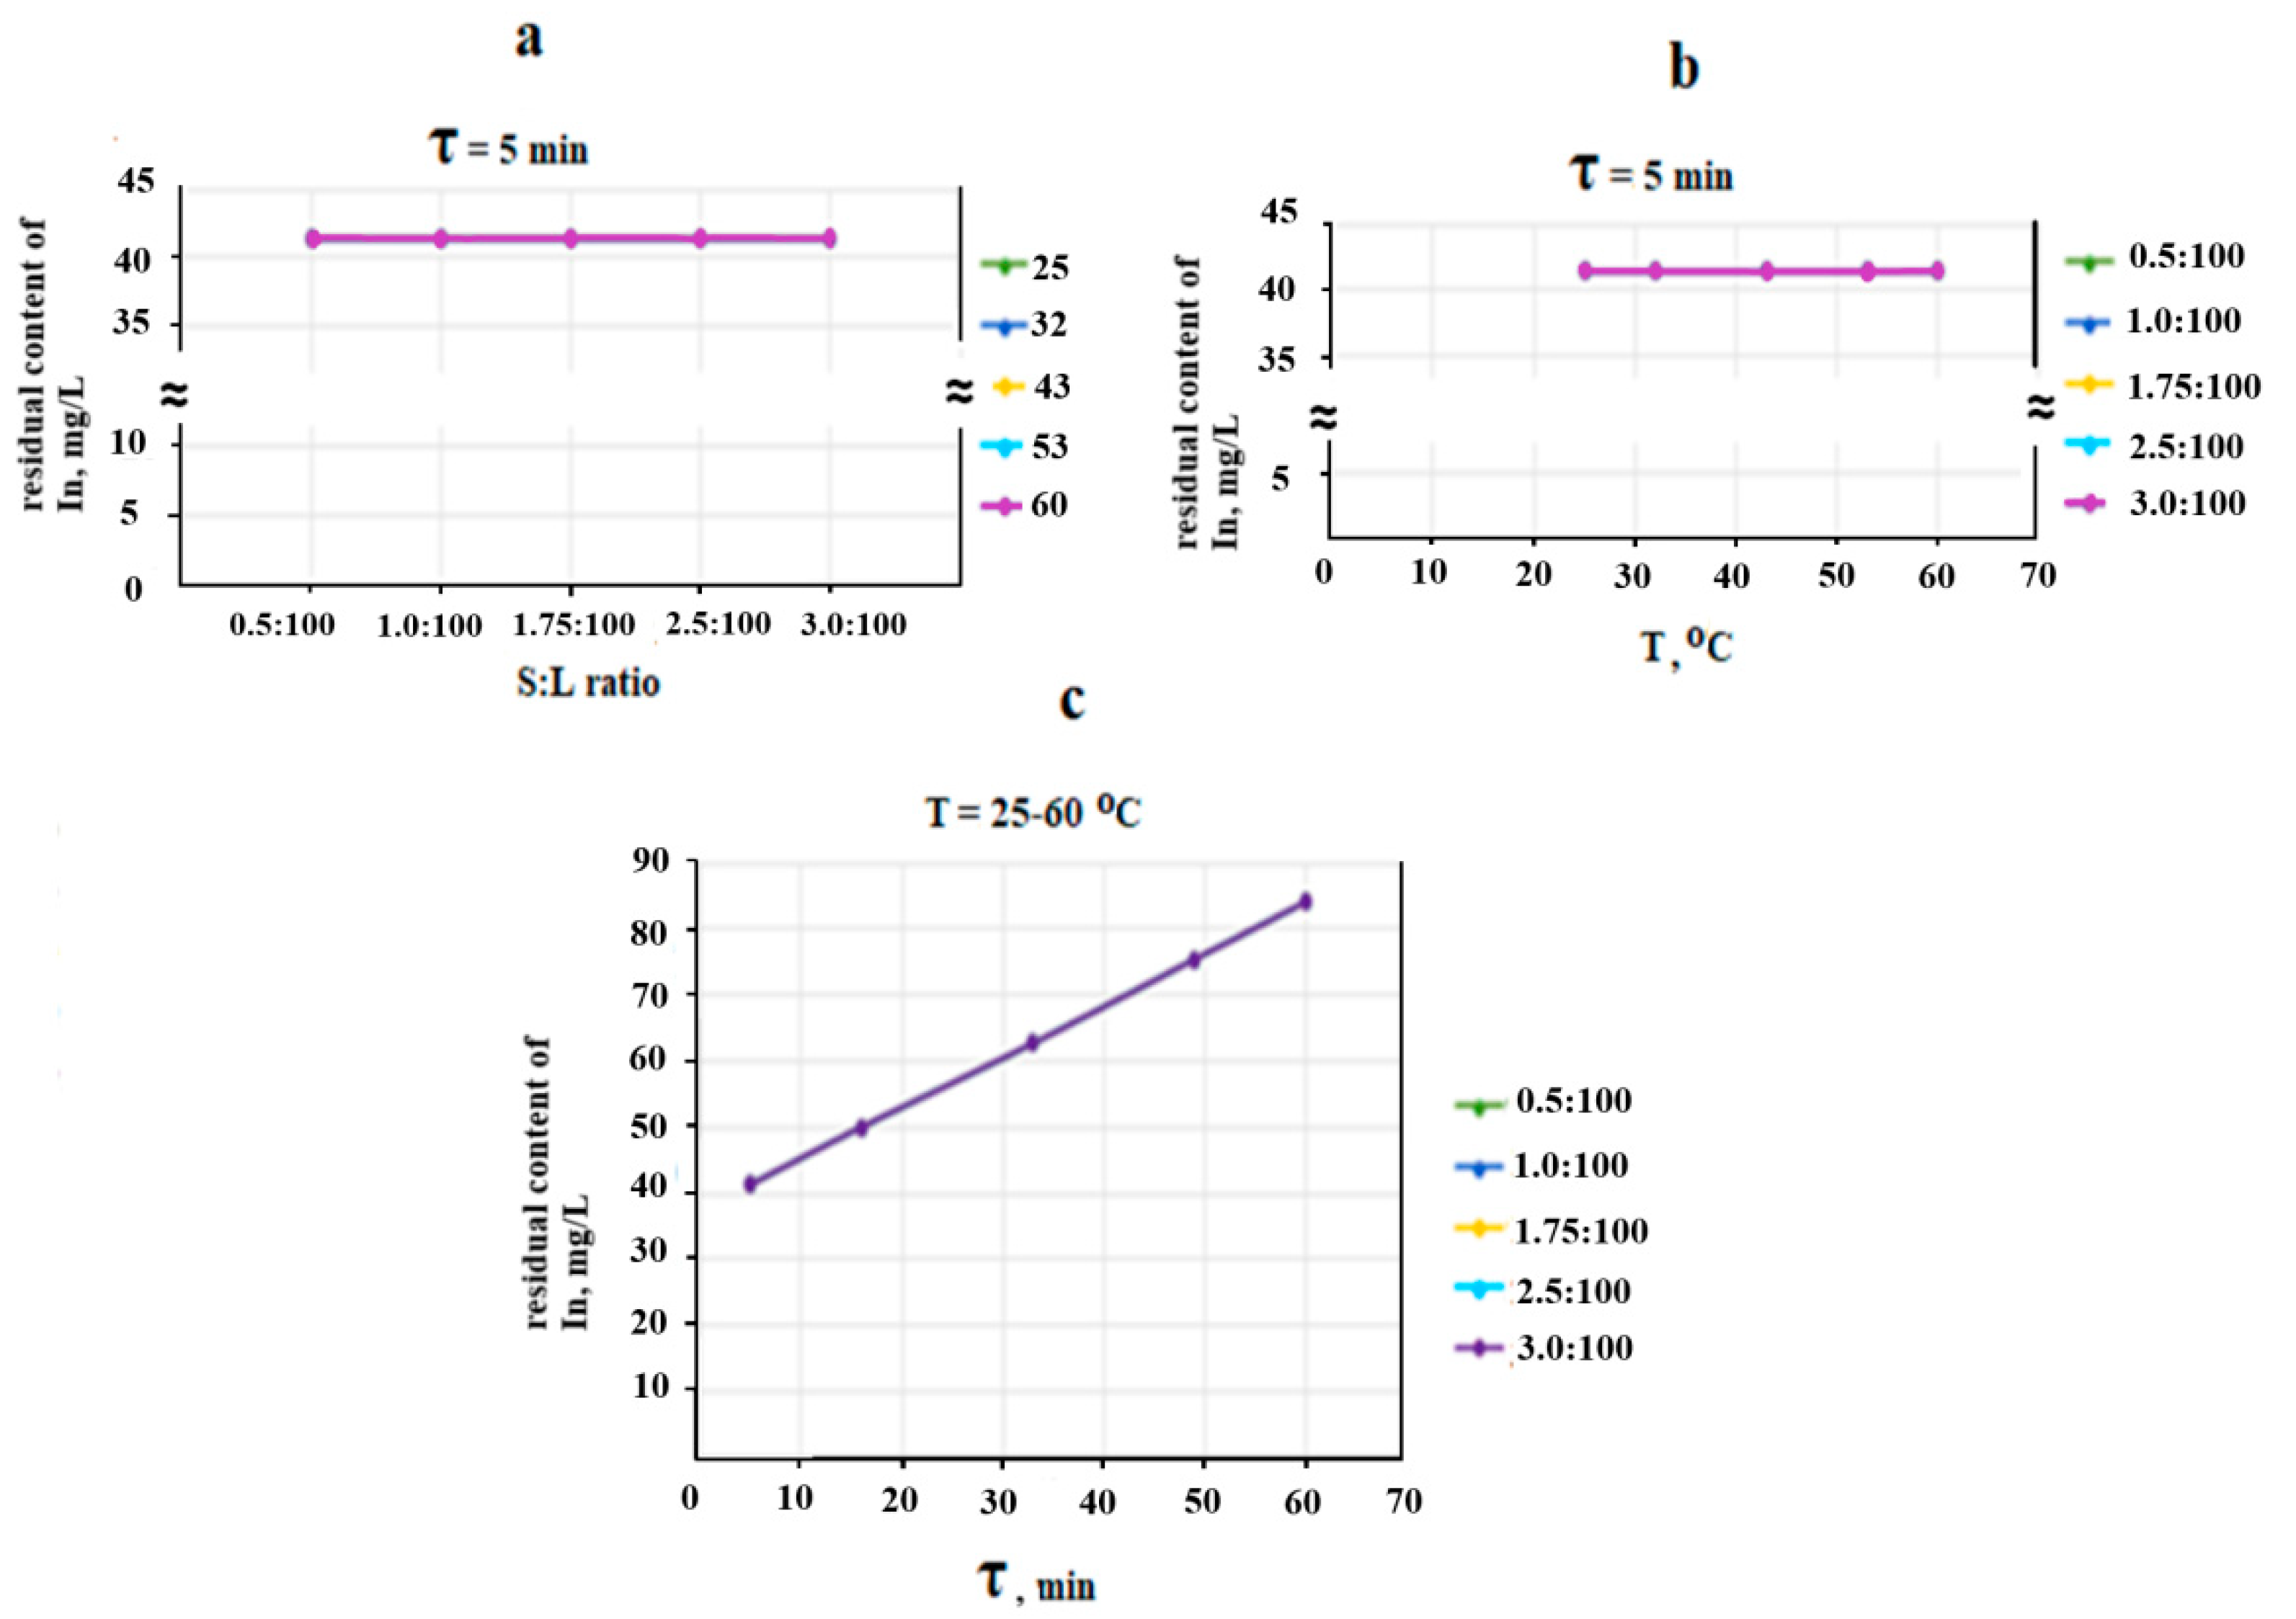
An analysis of the regression Equation (5), which describes the sorption of the In3+ cations by natural zeolite, has shown that the process is determined by only one factor:time. As time increases, the residual content of the In3+ cations in the liquid phase of the system increases; the sorption degree decreases due to the desorption of the absorbed indium from zeolite into the liquid phase of the system (Figure 1c).
The sorption curves of indium on the amount (the S:L ratio) of the sorbent and temperature have a rectilinear form, and are located parallel to the abscissa axis (Figure 1a,b). Both factors under study do not affect the process of sorption of the In3+ cations by natural zeolite. A high degree of sorption of theIn3+ ions, which practically remains constant with an increase in time, is achieved already within 5–10 min and approaches 58.6% at any zeolite:solution ratio.
An analysis of the obtained data regarding the sorption of the In3+ cations by natural zeolite has shown that the sorption of indium can be controlled by the process time; the longer the process, the less it is sorbed by natural zeolite.

3.2. Study of the Sorption Process in the “Zeolite–In3+–Ga3+–H2O” Model System

Since the In3+ and Ga3+ cations are simultaneously present in the liquid phase of the CM, the study of a natural zeolite sorption capacity with respect to these ions under the conditions of their simultaneous presence has been carried out on the “natural zeolite–In3+–Ga3+–H2O”model system according to the planning matrix (Table 2), with the same values of variables (S:L; Т, °C; τ, min). The process of sorption of the cations has been carried out under the conditions of constant and equal concentrations of the In3+ and Ga3+ cations (100 mg/L) at pH 4.
The results are presented in Table 3, the processing of which made it possible to obtain the regression Equations (3) and (4), describing the effect of the zeolite amount, temperature, and time on the residual content of the In3+ (YIn mg/L) and Ga3+ (YGa mg/L) cations, as well as on the degree of their sorption in the examined system at the end of the process.
The sorption of the In3+ cations in the presence of the Ga3+ ions, depending on the (zeolite:solution) ratio, temperature and time of the process, is described by an adequate (F < F1-р(f1.f2) = YIn 4.471 < 4.699) equation:
YIn = 73.851 − 13.986X1− 9.594X22
An analysis of the regression Equation (8) has shown that only the coefficients b0, b1 and b2 (S:L, T °C) were significant. The residual content of the In(III) cations after the sorption by natural zeolite is a function of the sorbent rate (X1) and temperature (X2). The numerical value of the X1 coefficient is higher than that of the X2 coefficient, which indicates its greater influence on the output parameter. At the same time, the negative value at the X1 coefficient in the regression Equation (8) shows that an increase in the consumption of zeolite will increase the sorption of the indium cations.
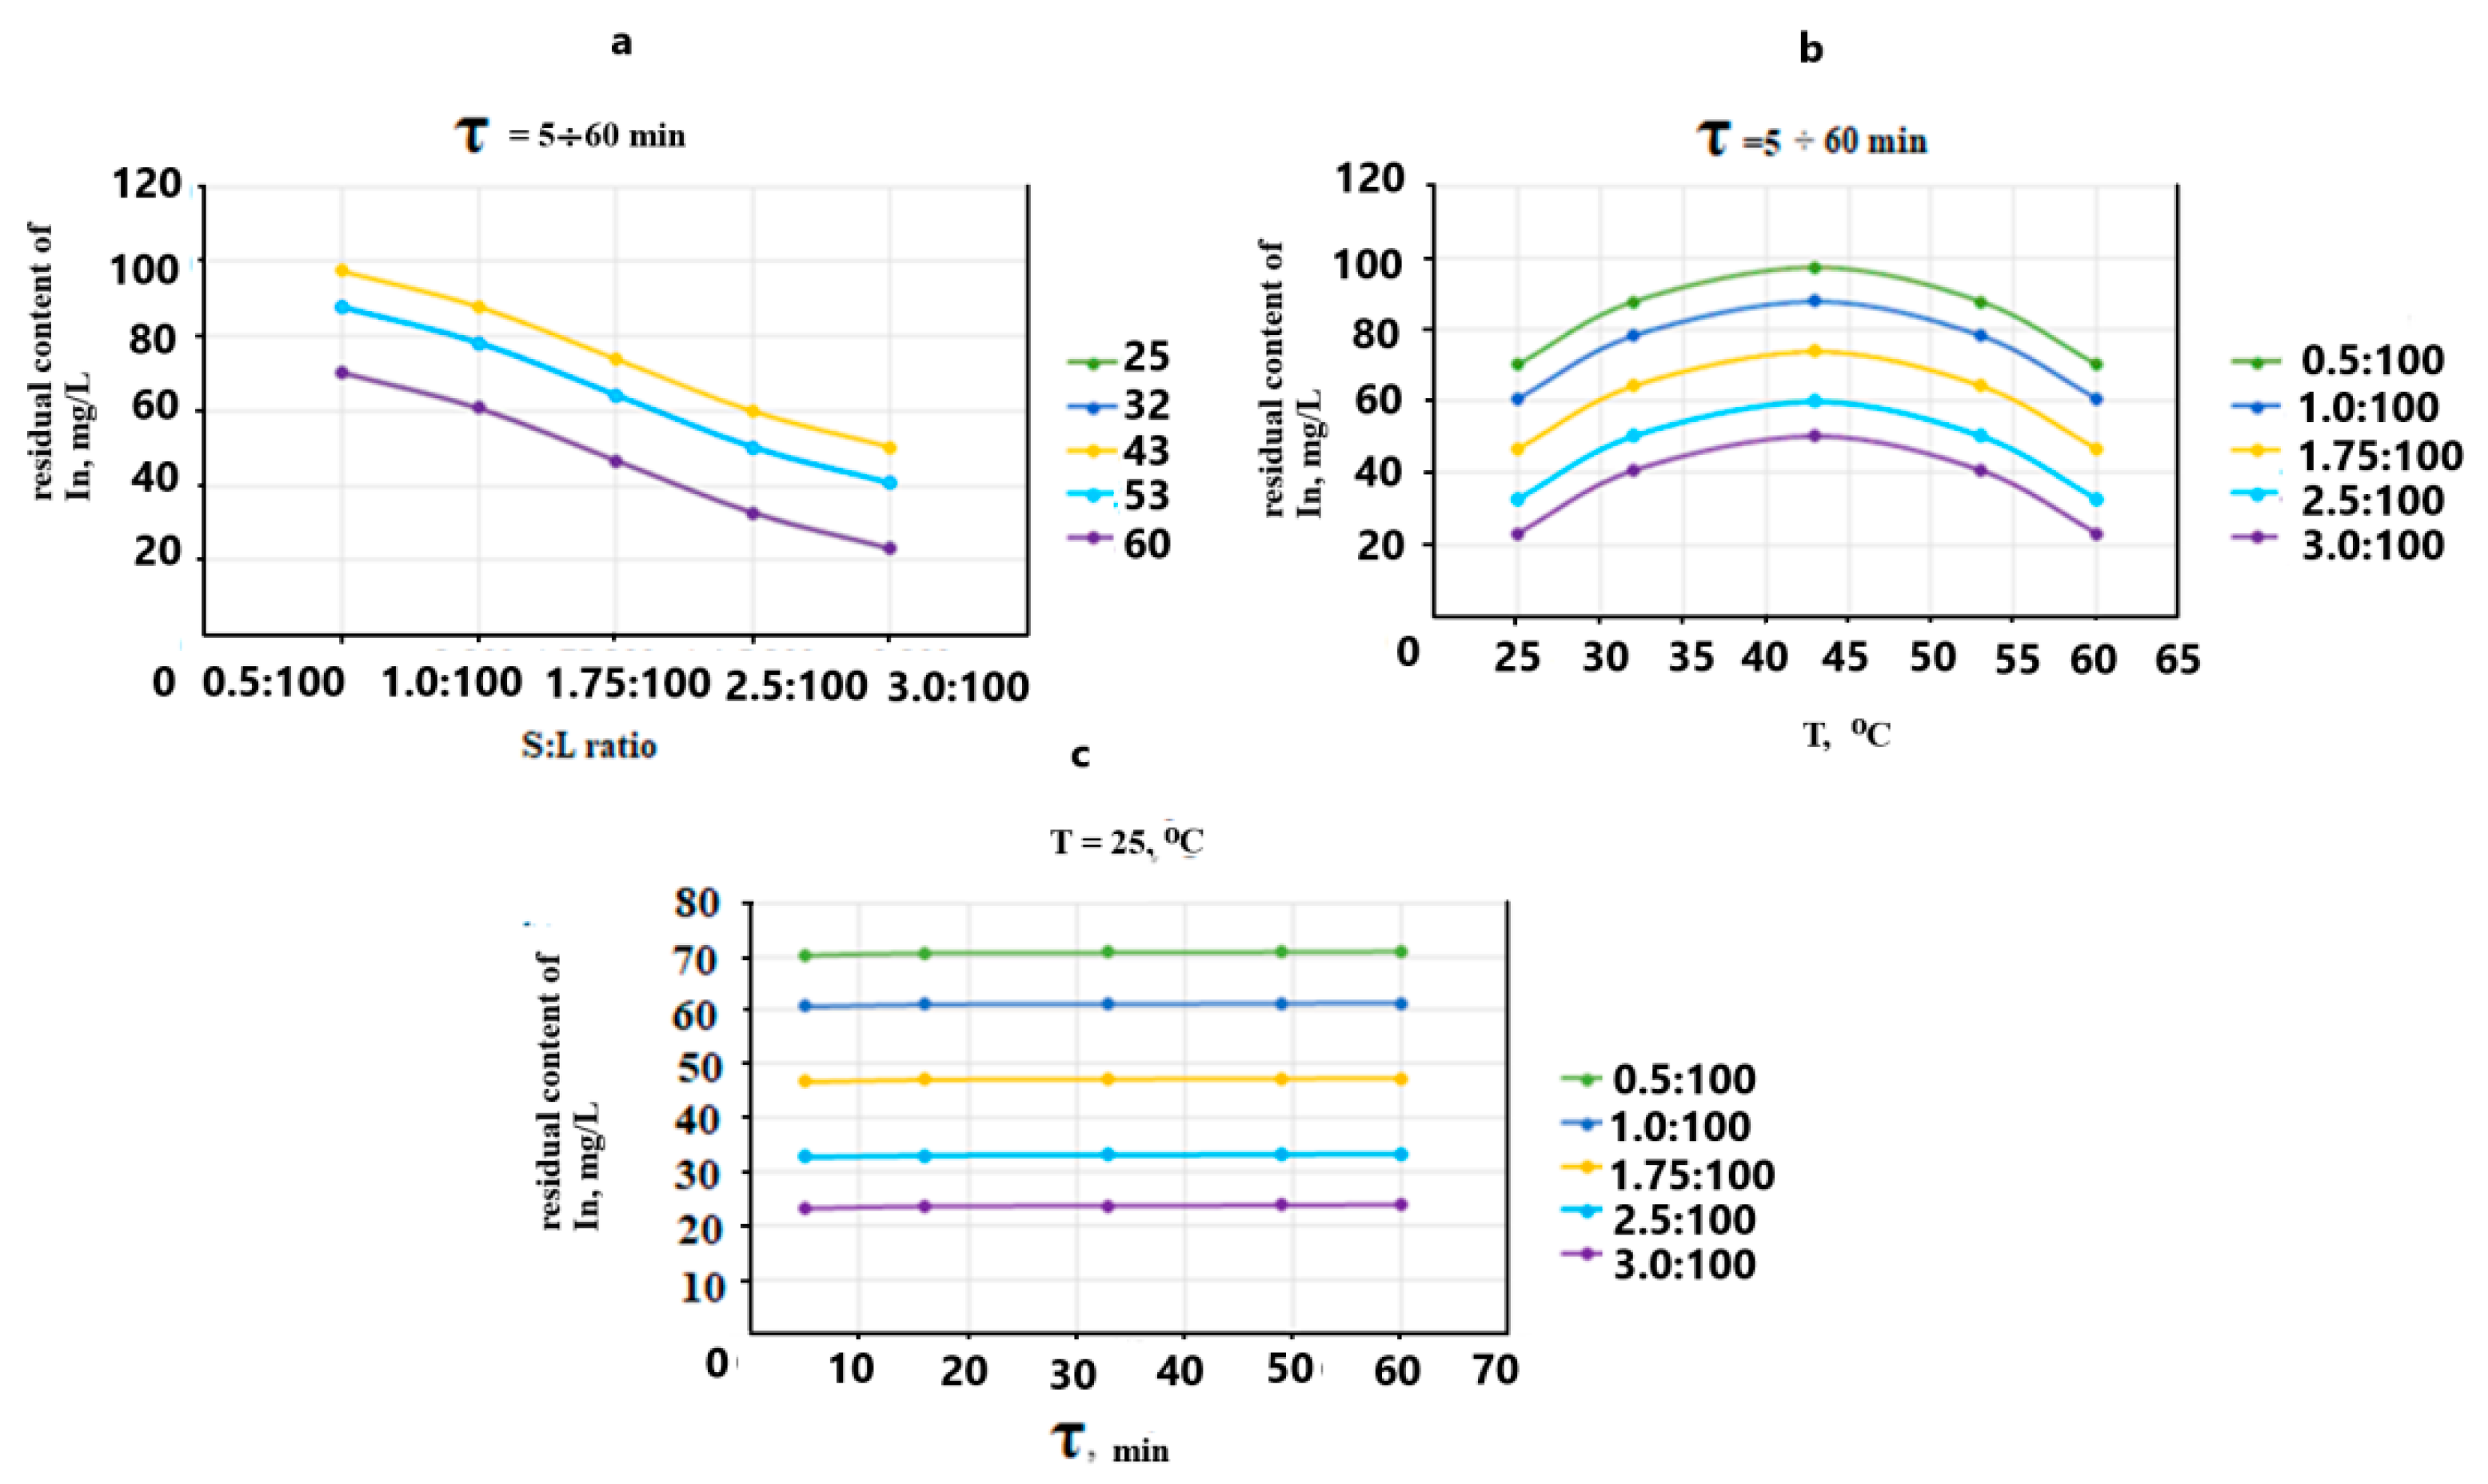
An analysis of the sorption curves of the In3+ cations in the presence of the Ga3+ cations has shown that the sorption curves in the block for each of the studied factors, regardless of the other two factors, are similar to each other. We present a graphical representation for each factor in one Figure 2.
Figure 2a shows that, in the entire time interval under study for all temperatures, the residual content of the In3+ cations in the liquid phase of the system under study decreases with an increase in the zeolite amount, and, accordingly, the sorption degree increases. For example, at 43 °C and the sorbent consumption of 0.5 g per 100 g of the solution, the degree of sorption of the In3+ cations is 0.6%, at a consumption of 1 g of the sorbent per 100 g of the solution, the sorption degree increases up to 11%, and at a rate of 3 g per 100 g of the solution, up to 50%.
The second significant factor affecting the sorption of the In3+ cations is temperature (X2). In the regression Equation (2), the effect of temperature is represented by the negative quadratic term. The sorption curves of indium (III) in the entire studied time interval for all S:L ratios are extreme in nature, with a pronounced maximum in the region of 43 °C (Figure 2b). The residual content of the In3+ cations increases with an increase in the temperature up to 43 °C, and decreases above this temperature; the degree of their sorption decreases and then increases. So, at S:L = 0.5:100 at 25 °C, the sorption degree is 30%, at 32 °C-11%, at 43 °C-0.05%, and at 60 °C-29.5%. The appearance of a maximum in the indium sorption curves may be due to the physical adsorption of a part of the In3+ cations, and may also be a consequence of the competing effect between the cations for the vacant exchange centers in the zeolite structure, or the tendency of the system to equilibrium.
The sorption curves of the indium (III) cations, from time to time, have a rectilinear character and are located parallel to the abscissa axis (Figure 2с). The time factor does not affect the process of sorption of the In3+ cations by natural zeolite. Thus, a high degree of their sorption is already achieved in 5 min and remains almost constant.
The least of the In3+ cations in the presence of the Ga3+ ions, regardless of time, is sorbed in the range of 40–45 °C at the S:L ratio = 0.5:100 (Ks = 0.8%), and the most of all is sorbed at 25 and 60 °C, at S:L = 3:100 (Ks = 71%).
As for the sorption of the Ga3+ cations in the presence of the In3+ ions, the process is described by the Equation (9):
YGa = 72.649 − 9.218X22 − 12.709X32
The adequacy of the resulting regression equation is confirmed by the inequality F < F1-p(f1,f2) = YGa 4.642 < 4.699.
From the resulting regression Equation (9) it can be seen that, as in the case of the indium (III) sorption, three coefficients b0, b22 and b32 (T, °C and time) have turned out to be significant.
The comparison of the coefficient values of the regression Equation (9) has shown that the process time has the greatest influence on the output parameter, but the negative sign at the X3 coefficient shows that an increase or decrease in the value of this factor will not increase the sorption capacity of natural zeolite with respect to the Ga3+ ions. The same will be the case for the coefficient relating to the process temperature, which has a negative sign (X22).
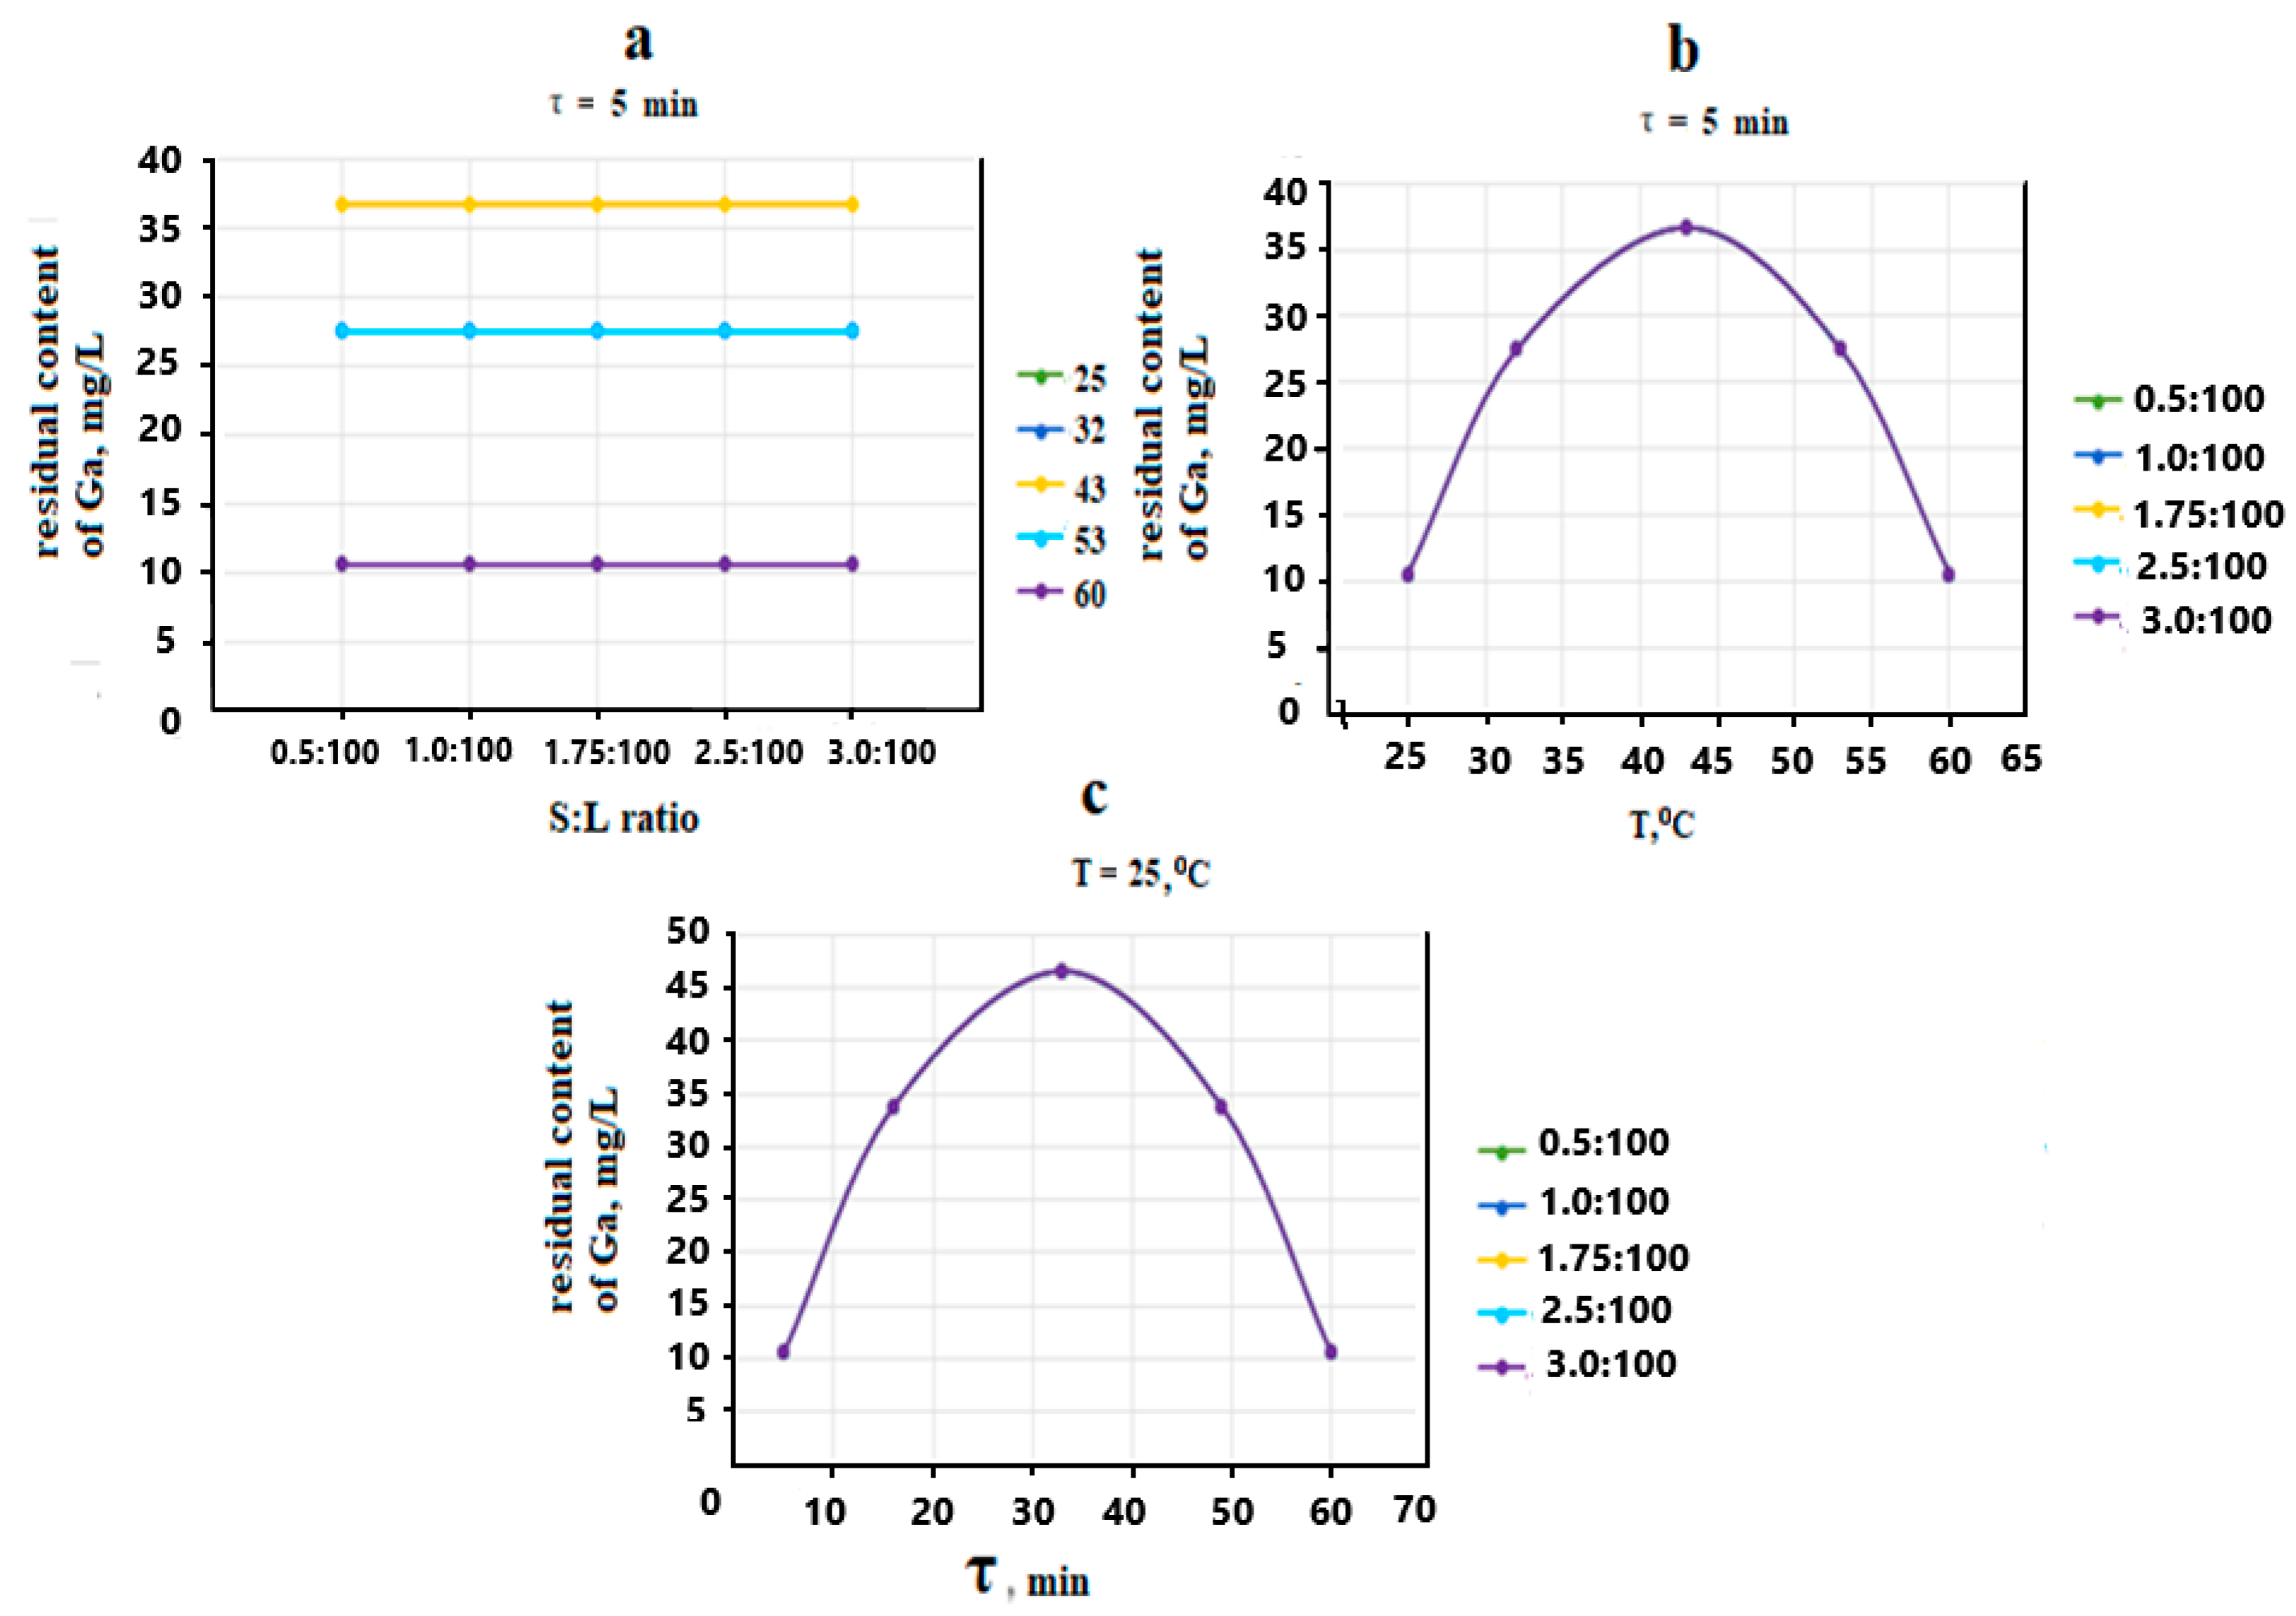
An analysis of the sorption curves of the Ga3+ cations in the presence of the In3+ cations has shown that, as in the case of the sorption of the In3+ cations, in each block of the studied factor, regardless of the other two factors, the sorption curves have the same character. Therefore, as an example, one Figure is given for each process factor (Figure 3).
The kinetic curves of the sorption of the Ga(III) cations on the sorbent amount for all temperatures and in the entire studied time interval are rectilinear (Figure 2a). As seen in this Figure, the norm of the sorbent has no effect on the process of sorption of the Ga3+ cations by natural zeolite. For example, in 5 min process at S:L = (0.5–3):100 and 25 °C, 63.3% is sorbed.
The temperature has a significant effect on the sorption capacity of natural zeolite with respect to the gallium (III) cations. As seen in Figure 3b, the sorption curves are extreme in nature with a maximum in the temperature region of 43 °C, similar to the In3+ sorption curves (Figure 2b). As the temperature rises to the specified value, the residual content of gallium in the solution increases and then decreases. Accordingly, the degree of sorption decreases, then increases. For example, 90% Ga3+ is sorbed at 25 °C, 63.5% Ga3+ at 43 °C, and 90% Ga3+ at 60 °C, over the entire time interval and the S:L ratios under study.
The sorption curves of the Ga(III) cations versus time, as well as temperature, are extremal in nature, with a maximum at 33 min (Figure 3c). Accordingly, with an increase in time up to the specified value, the degree of sorption decreases and then increases. So, for all S:L ratios at 25 °C for 5 min 90.5% Ga3+ is sorbed, in 33 min—51.9% and in 60 min—90.5%.
The minimum degree of sorption of the Ga3+ cations, regardless of the S:Lratio, can be obtained at 43 °C in 33 min (Ks = 53%), and the highest degree of sorption for all S:L ratios at 25 °C for the 10 and 60 min process (Ks = 90%). The influence of the nature of the cations present in the system affects the sorption of the In3+ ions. At a consumption rate of zeolite of 3 g per 100 g of the indium-and gallium-containing solution and 60 °C for 60 min, the maximum amount of the In3+ (Ks = 80%) and Ga3+ (Ks = 90%) cations is sorbed, and at S:L equal to 0.5:100 and 43 °C (1–2)% In3+ and (48–50)% Ga3+.
Based on the fact that in this work, natural zeolite is used to concentrate the In3+ and Ga3+ cations in the liquid phase of the cottrel “milk” by purifying it from all other impurity ions, for example, such as Ca, Mg, Si, K, as well as PO43− anions-, SO42−, etc., located in the CM filtrate, the optimal conditions are those that correspond to the minimum absorption of all cations present in the system.

3.3. Physicochemical Study of Zeolite, Isolated after the Sorption of the Trivalent Cations

To elucidate the structural changes in zeolite occurring during the sorption of the In3+ and Ga3+ cations, a physicochemical analysis of zeolites, isolated from the studied systems under the conditions of their maximum and minimum absorption, has been carried out.
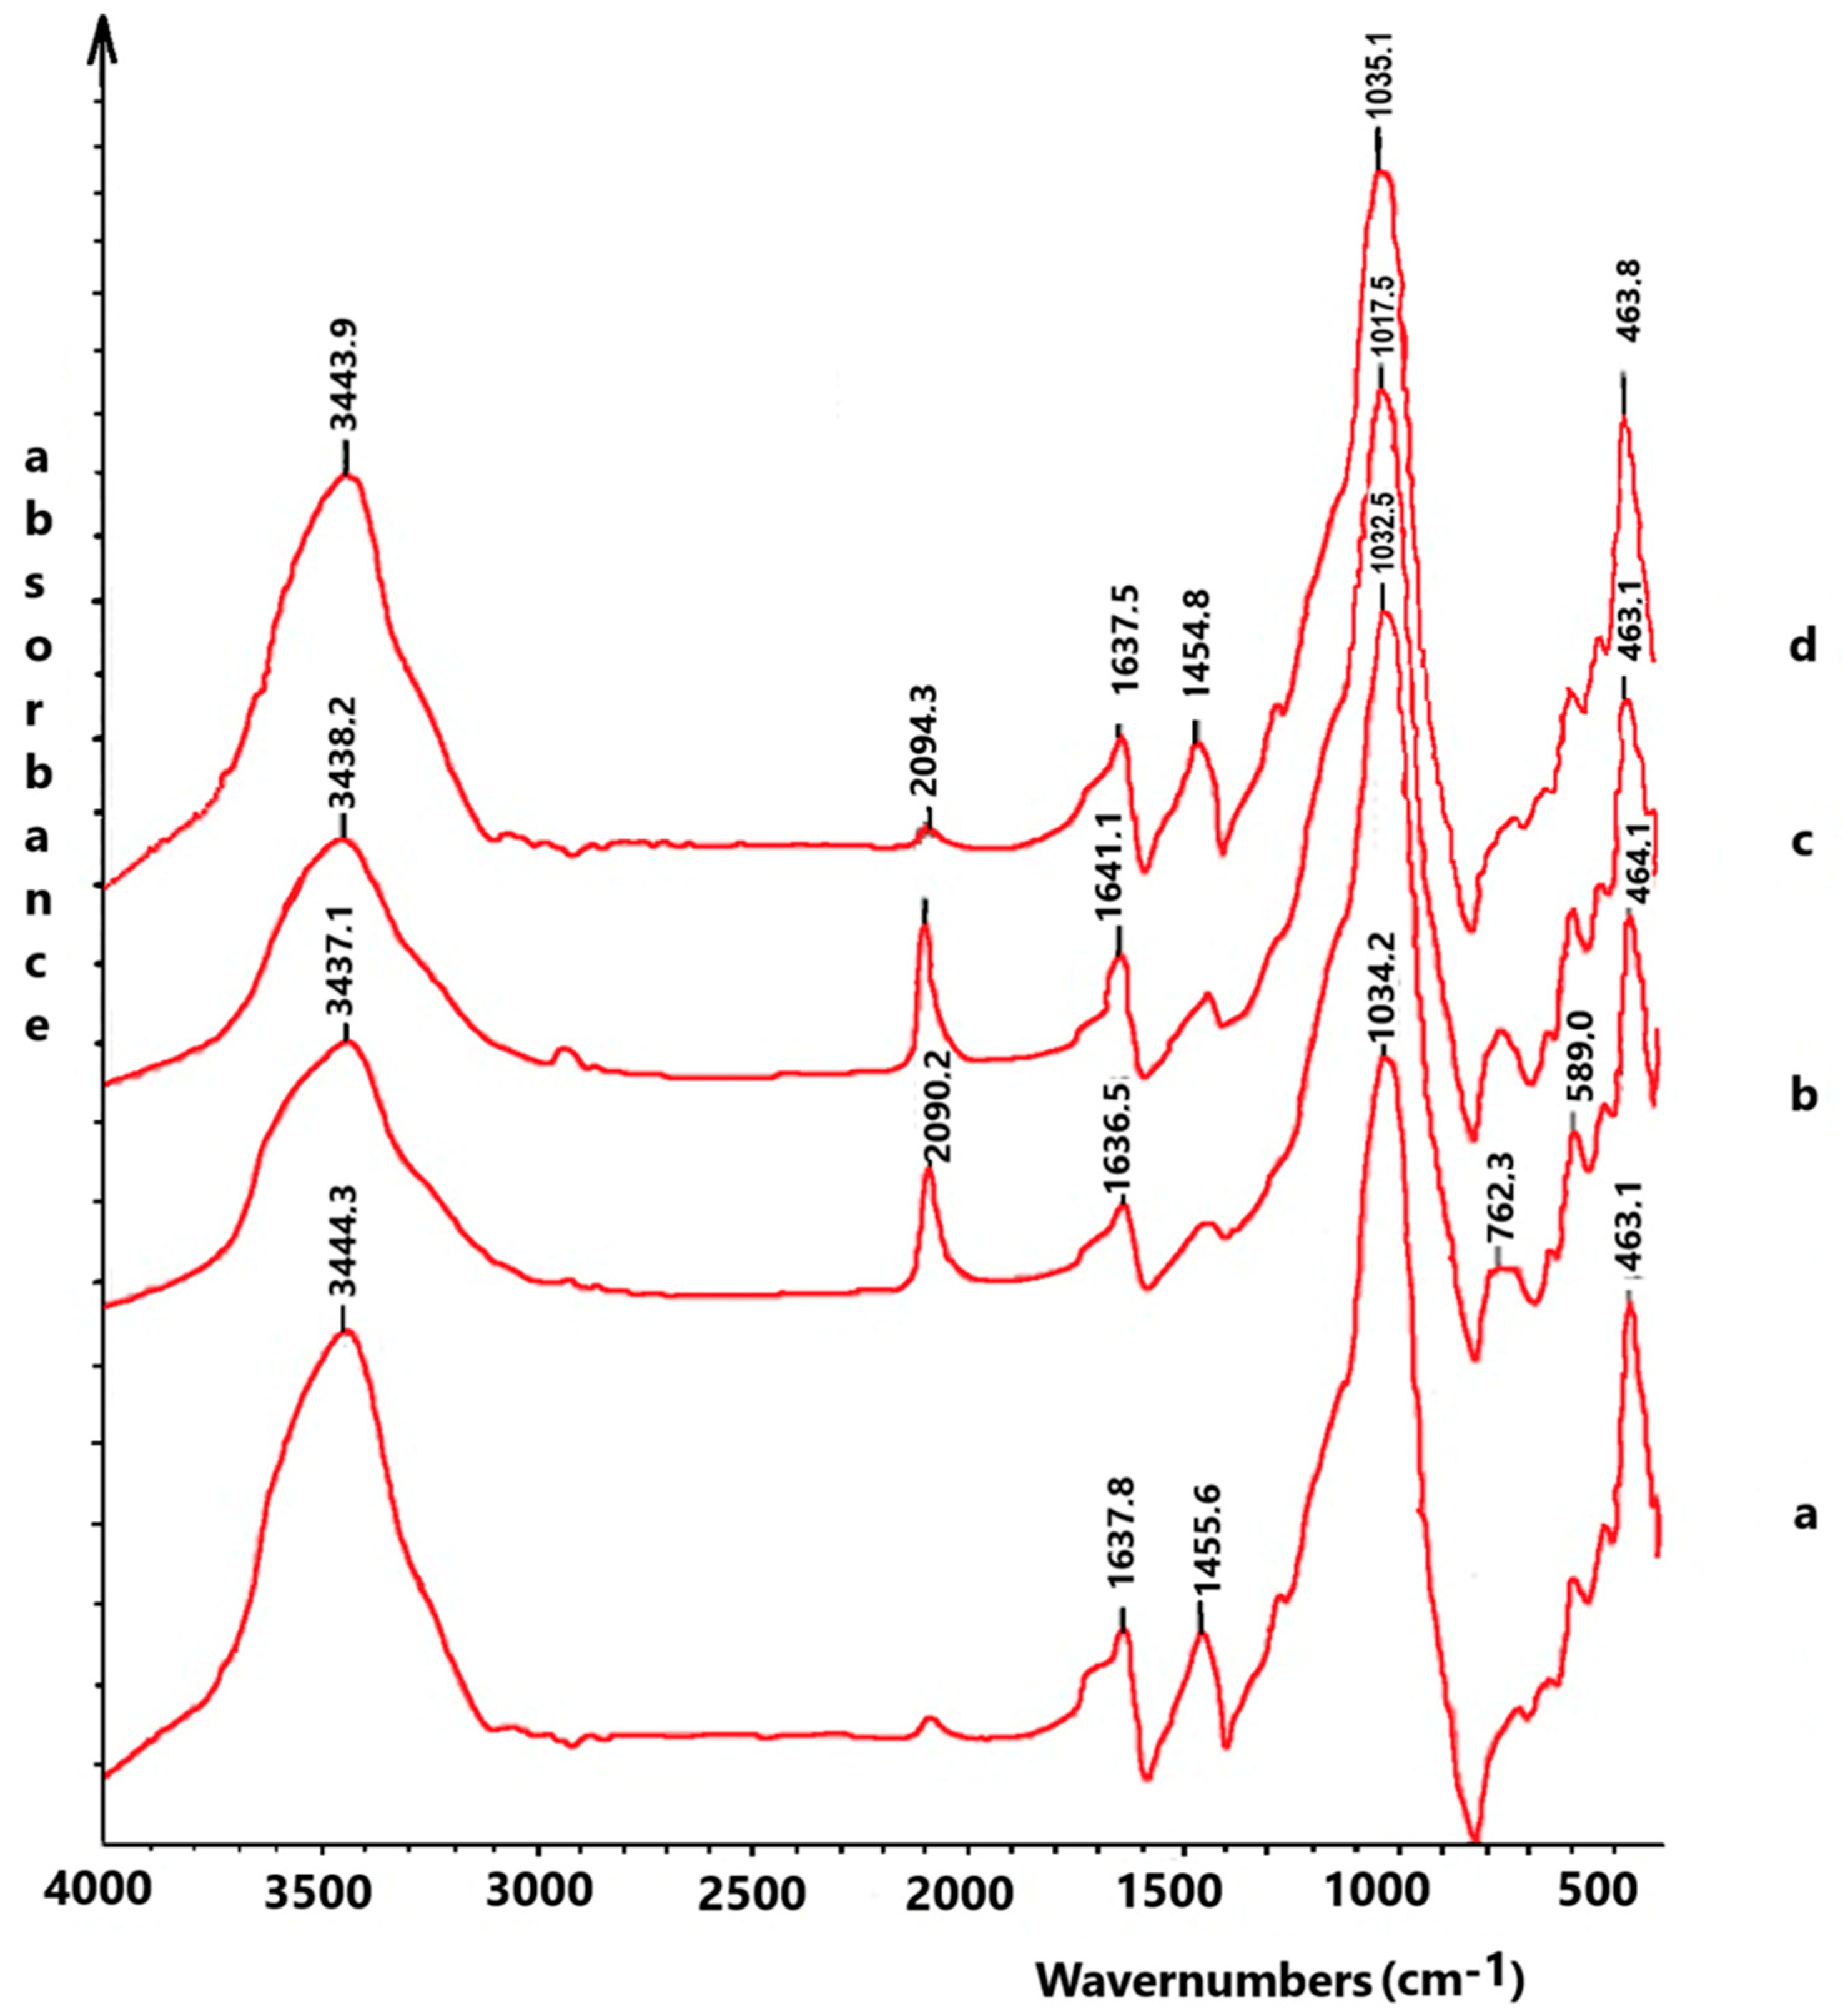
A comparative analysis of the IR spectrum of natural zeolite (Figure 4a) with the IR spectra of zeolites, isolated from the “natural zeolite–In3+–H2O” and “natural zeolite–In3+–Ga3+–H2O”systems under the conditions of the most complete absorption of the cations (Figure 4b–d) has shown that, after the sorption of cations in the IR spectra, the frequency, characterizing the region of stretching vibrations of water 3444.7 cm−1, broadens and its intensity decreases, and the maximum shifts: 3444.7 cm−1 → 3433.2 cm−1 → 3437.1 cm−1 → 3438.2 cm−1.
In the water deformation vibrations, the transition of the absorption bands presents in the spectrum of natural zeolite 1637.8 cm−1 and 1455 cm−1 (Figure 4a) into one frequency in the region of 1641.1…1636.6 cm−1 and this is observed in the spectrum of metal-containing zeolites (curves b−d), indicating the sorption of the cations present in the systems. The strengthening of its intensity and the shift to the high-frequency region 1637.8 cm−1 → 1638.4 cm−1 → 1636.5 cm−1 → 1641.1 cm−1 is due to the sorption of the In3+ and then the sorption of the In3+ and Ga3+ cations in the “natural zeolite–In3+–Ga3+–H2O” system.
In the IR spectra of the metal-containing zeolites, a new frequency appears in the high-wave region 2094.3–2090.2 cm−1, and the new low-frequency components in the region 760…762.3 cm−1 and 589…590 cm−1, the intensity of which increases with increasing diversity types of the sorbed cations in the system, which indicates an increase in the vibrations of the Me–O bonds [21], and is a consequence of the formation of the In–O bond in zeolite, and also the Ga–O bond in the indium-gallium-containing zeolite.
As for the IR spectrum of zeolite isolated from the “natural zeolite–In3+–Ga3+” system under the conditions of the lowest absorption of cations (Figure 4d), its spectrum practically approaches the IR spectrum of natural zeolite (Figure 4a). This suggests that, under these conditions, natural zeolite practically does not adsorb cations.
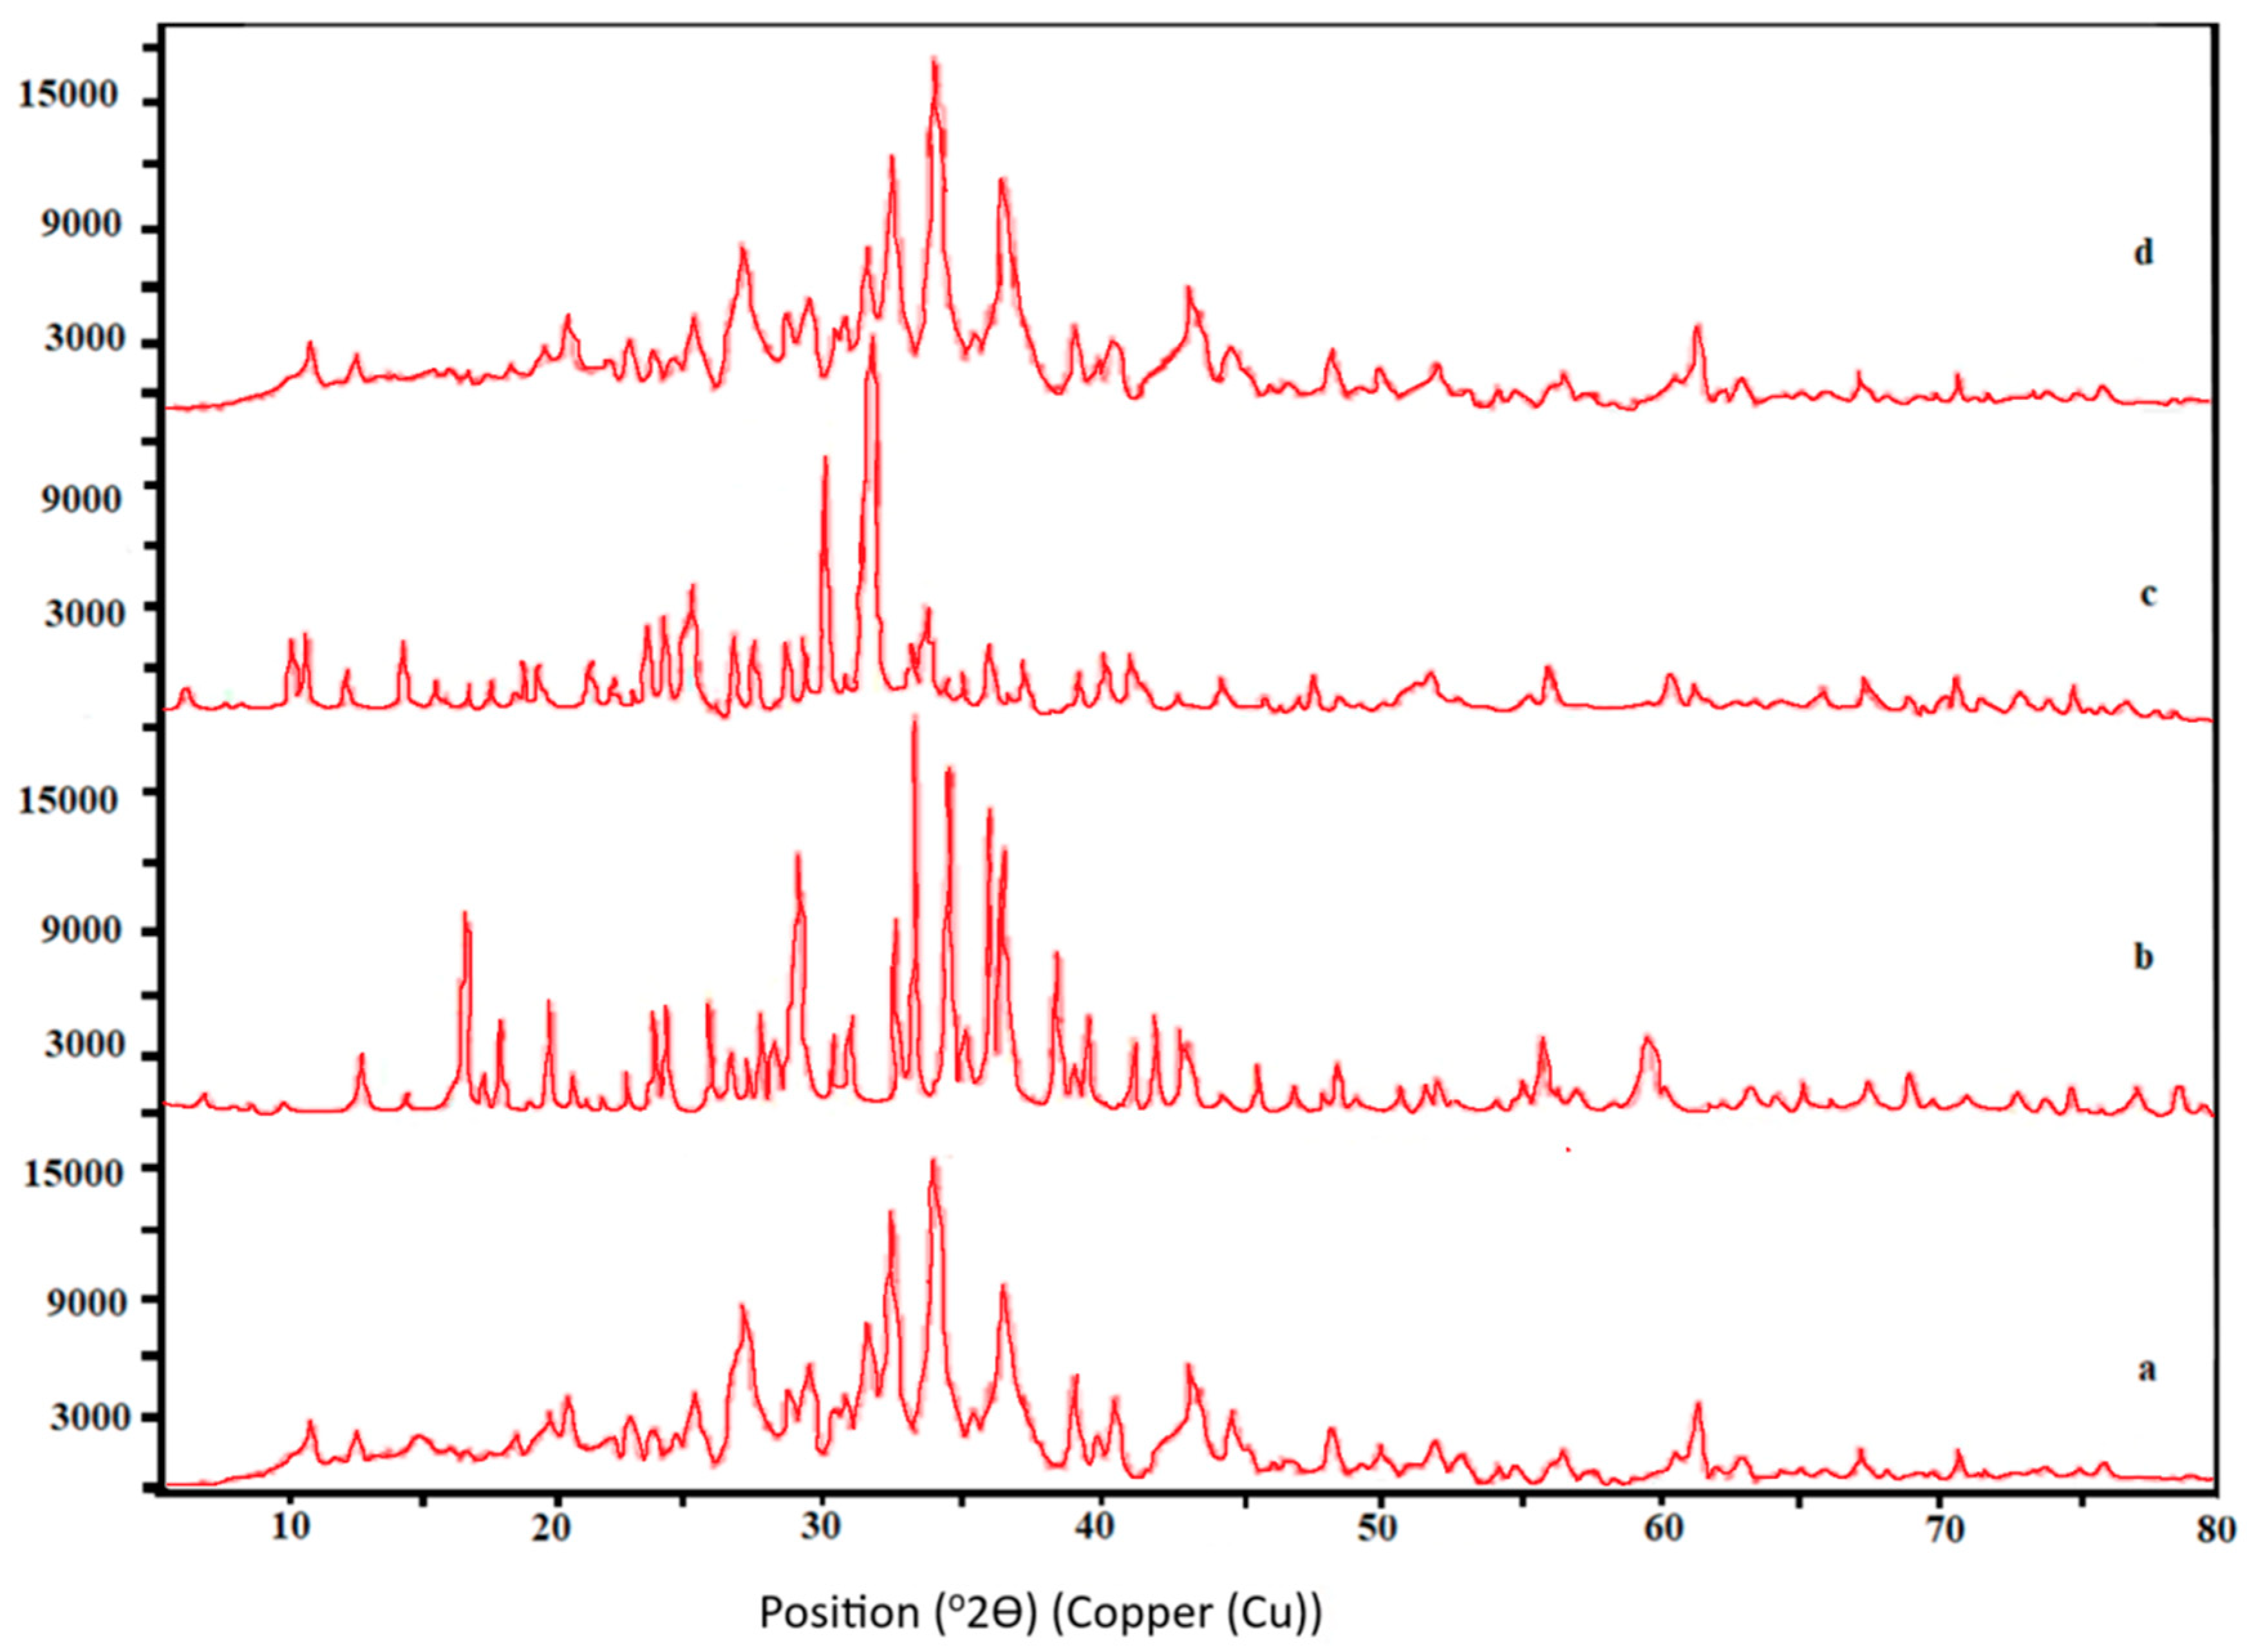
An X-ray phase analysis has shown a number of intense diffraction maxima: 6.71 Å (22.3%); 4.0 Å (15.4%); 3.4 Å (20.4%); 3.3 Å (100%); 2.9 Å (38.2%); 2.8 Å (26.1%); 2.7 Å (14.2%); 1.8 Å (12.8%) and 1.7 Å (6.5%), which are registered on the X-ray pattern of natural zeolite (Figure 5a).
In the X-ray pattern of the zeolite, isolated from the “natural zeolite–In3+–H2O” system (Figure 4b), the diffraction maxima with dα = 4.1 Å (23.5%); 4.0 Å (18%); 3.3 Å (100%); 2.9 Å (1%); 2.8 Å (25.3%); 1.8 Å (11%) and 1.7 Å (8%) are identical to the similar reflections fixed on the X-ray diffraction pattern of natural zeolite (Figure 5a). It is necessary to note the coincidence in the positions of such diffraction maxima as 5.1 Å (18.9%); 4.66 Å (20%); 3.9 Å (58%); 3.8 Å (29.3%); 3.6 Å (16.1%); 3.4 Å (46.3%) and 3.0 Å (54.3%) in the studied and natural zeolites, but in this case, their intensities are redistributed. Thus, for these reflections, the intensity of the diffraction pattern of zeolite after the sorption of the In3+ cations increases by 8.9%, respectively; 9.2%; 6.3%; 19.2%; 4.8% and 18.6%. At the same time, the diffraction maxima with dα = 3.7; 2.7; 2.3; 2.0; 1.89 Å are not recorded on the X-ray pattern of the studied zeolite, fixed on the X-ray pattern of natural zeolite, but a new intense diffraction maximum appears with dα = 3.2 Å (73.7%). Moreover, the X-ray diffraction pattern of the zeolite, isolated from the “natural zeolite–In3+–H2O” system (Figure 5b) becomes more complicated compared to the X-ray diffraction pattern of the natural one (Figure 5a). The revealed changes in the X-ray diffraction pattern of the indium-containing zeolite are due to the sorption of trivalent In.
In the X-ray pattern of the zeolite, isolated from the “natural zeolite–In3+–H2O” system (Figure 5b), the diffraction maxima with dα = 4.1 Å (23.5%); 4.0 Å (18%); 3.3 Å (100%); 2.9 Å (1%); 2.8 Å (25.3%); 1.8 Å (11%) and 1.7 Å (8%) are identical to the similar reflections fixed in the X-ray diffraction pattern of natural zeolite (Figure 5a). It is necessary to note the coincidence in the positions of such diffraction maxima as 5.1 Å (18.9%); 4.66708 Å (20%); 3.9 Å (58%); 3.8 Å (29.3%); 3.6 Å (16.1%); 3.4 Å (46.3%) and 3.0 Å (54.3%) in the investigated and natural zeolites, but in this case, their intensities are redistributed. Thus, for these reflections, the intensity of the diffraction pattern of zeolite after the sorption of the In3+ cations, increases by 8.9%, respectively; 9.2%; 6.3%; 19.2%; 4.8% and 18.6%. Moreover, the X-ray pattern of the zeolite, isolated from the “natural zeolite–In3+–H2O” system (Figure 5b) becomes more complicated in comparison with the X-ray pattern of the natural one (Figure 5a). The revealed changes in the X-ray diffraction pattern of the indium-containing zeolite are due to the sorption of the trivalent In cations.
An analysis of the X-ray diffraction pattern of the zeolite, isolated from the “natural zeolite–In3+–Ga3+” system (Figure 5c), has shown that the height of the most intense diffraction maximum with dα = 3.3 Å (100%), fixed on the diffraction patterns of natural and two previous zeolites, decreases by 31.8%. New intense peaks with dα = 4.2 Å (17.5%) are registered in the X-ray pattern of the indium-gallium-containing zeolite; 3.7 Å (14%); 2.7 Å (7.2%) and a very strong diffraction maximum of 3.1 Å (100%). The reflections with dα = 4.0 Å (1.9%); 3.80 Å (29.3%) and 3.0 Å (54.3%), fixed in the diffraction pattern of the indium-containing zeolite, are not prescribed. Coinciding with the diffraction patterns of the investigated indium-containing zeolites the positions of a number of the diffraction maxima, such as 4.6 Å; 4.1 Å; 3.9 Å; 3.6 Å; 3.4 Å; 3.2 Å; 2.9 Å; 2.8 Å and 2.5 Å after the simultaneous sorption of the In3+ and Ga3+ cations decreases by 12%, respectively; 4.8%; 28.6%; 5.0%; 33.8%; 54.6%; 18.9%; 12.6% and 6%. These changes in the X-ray diffraction pattern of the zeolite, isolated from the “natural zeolite–In3+–H2O” system, are due to the sorption of the In3+ and Ga3+ cations.
The comparison of the X-ray diffraction pattern of the zeolite, isolated from the “natural zeolite–In3+–H2O” system under the conditions of the highest residual content of all cations (Figure 5d) has shown that almost all reflections on it coincide with the diffraction maxima of natural zeolite (Figure 5a). The noted slight decrease in the intensity of the diffraction peaks dα = 6.71 Å by 0.4%; 4.0 Å by 0.7%; 3.9 Å by 0.8% and 1.8 Å by 0.5% and the appearance of a very low intensity of reflections with dα = 4.3 Å (1.5%) and 3.1 Å (0.9%) indicates a very slight sorption of cations, present in the system. An X-ray phase analysis has confirmed the data of IR spectroscopy.
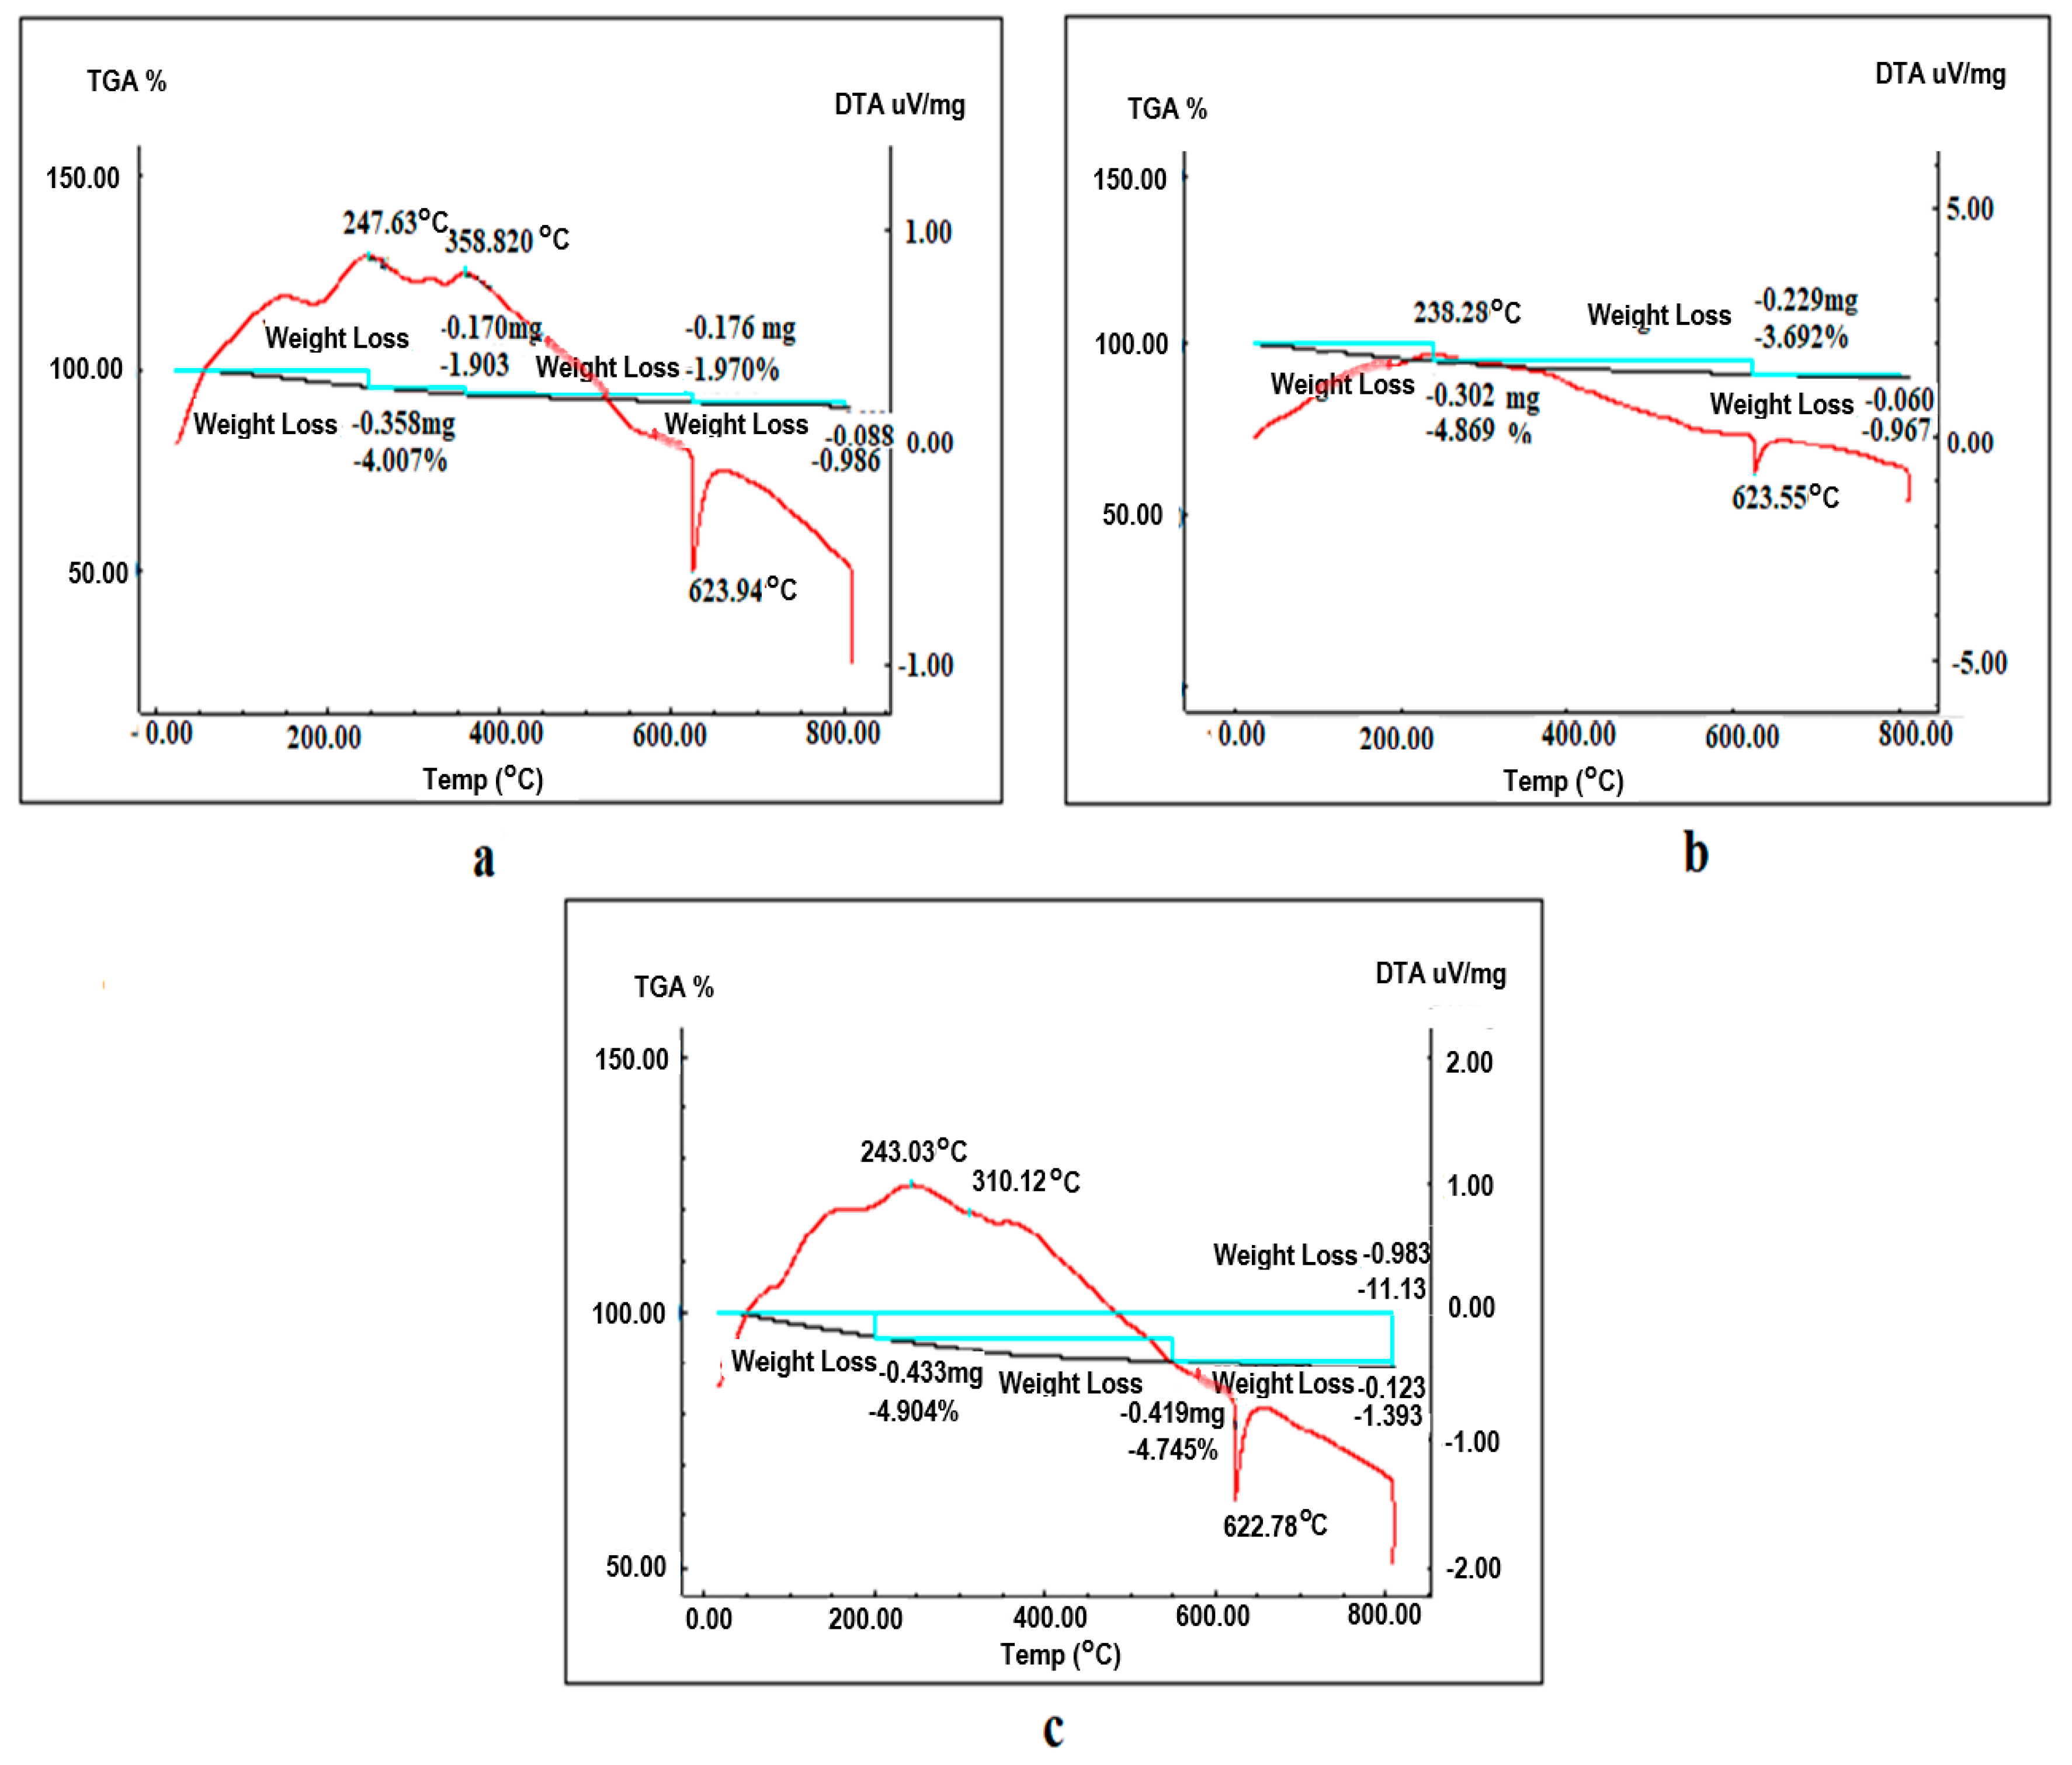
A derivatographic analysis of the zeolite, isolated from the “natural zeolite–In3+–H2O” system under the conditions of the most complete adsorption of cations has shown that the DTA curve shows a weak exoeffect at 238.8 °C and a narrow endothermic effect at 623.55 °C (Figure 6b), but less intensive. The revealed changes in the derivatogram of the studied zeolite indicate the sorption of the In3+ cations.
The total weight loss for the zeolite, isolated after the sorption of the indium (III) cations is 3.692%.
The derivatogram of a zeolite with the minimum content of cations from the “natural zeolite–In3+–Ga3+” system (Figure 6c) approaches the derivatogram of natural zeolite (Figure 6a) by the nature of the DTA curve and by the total weight loss of the sample. The obtained results of the derivatographic analysis confirm the data of IRS and X-ray.
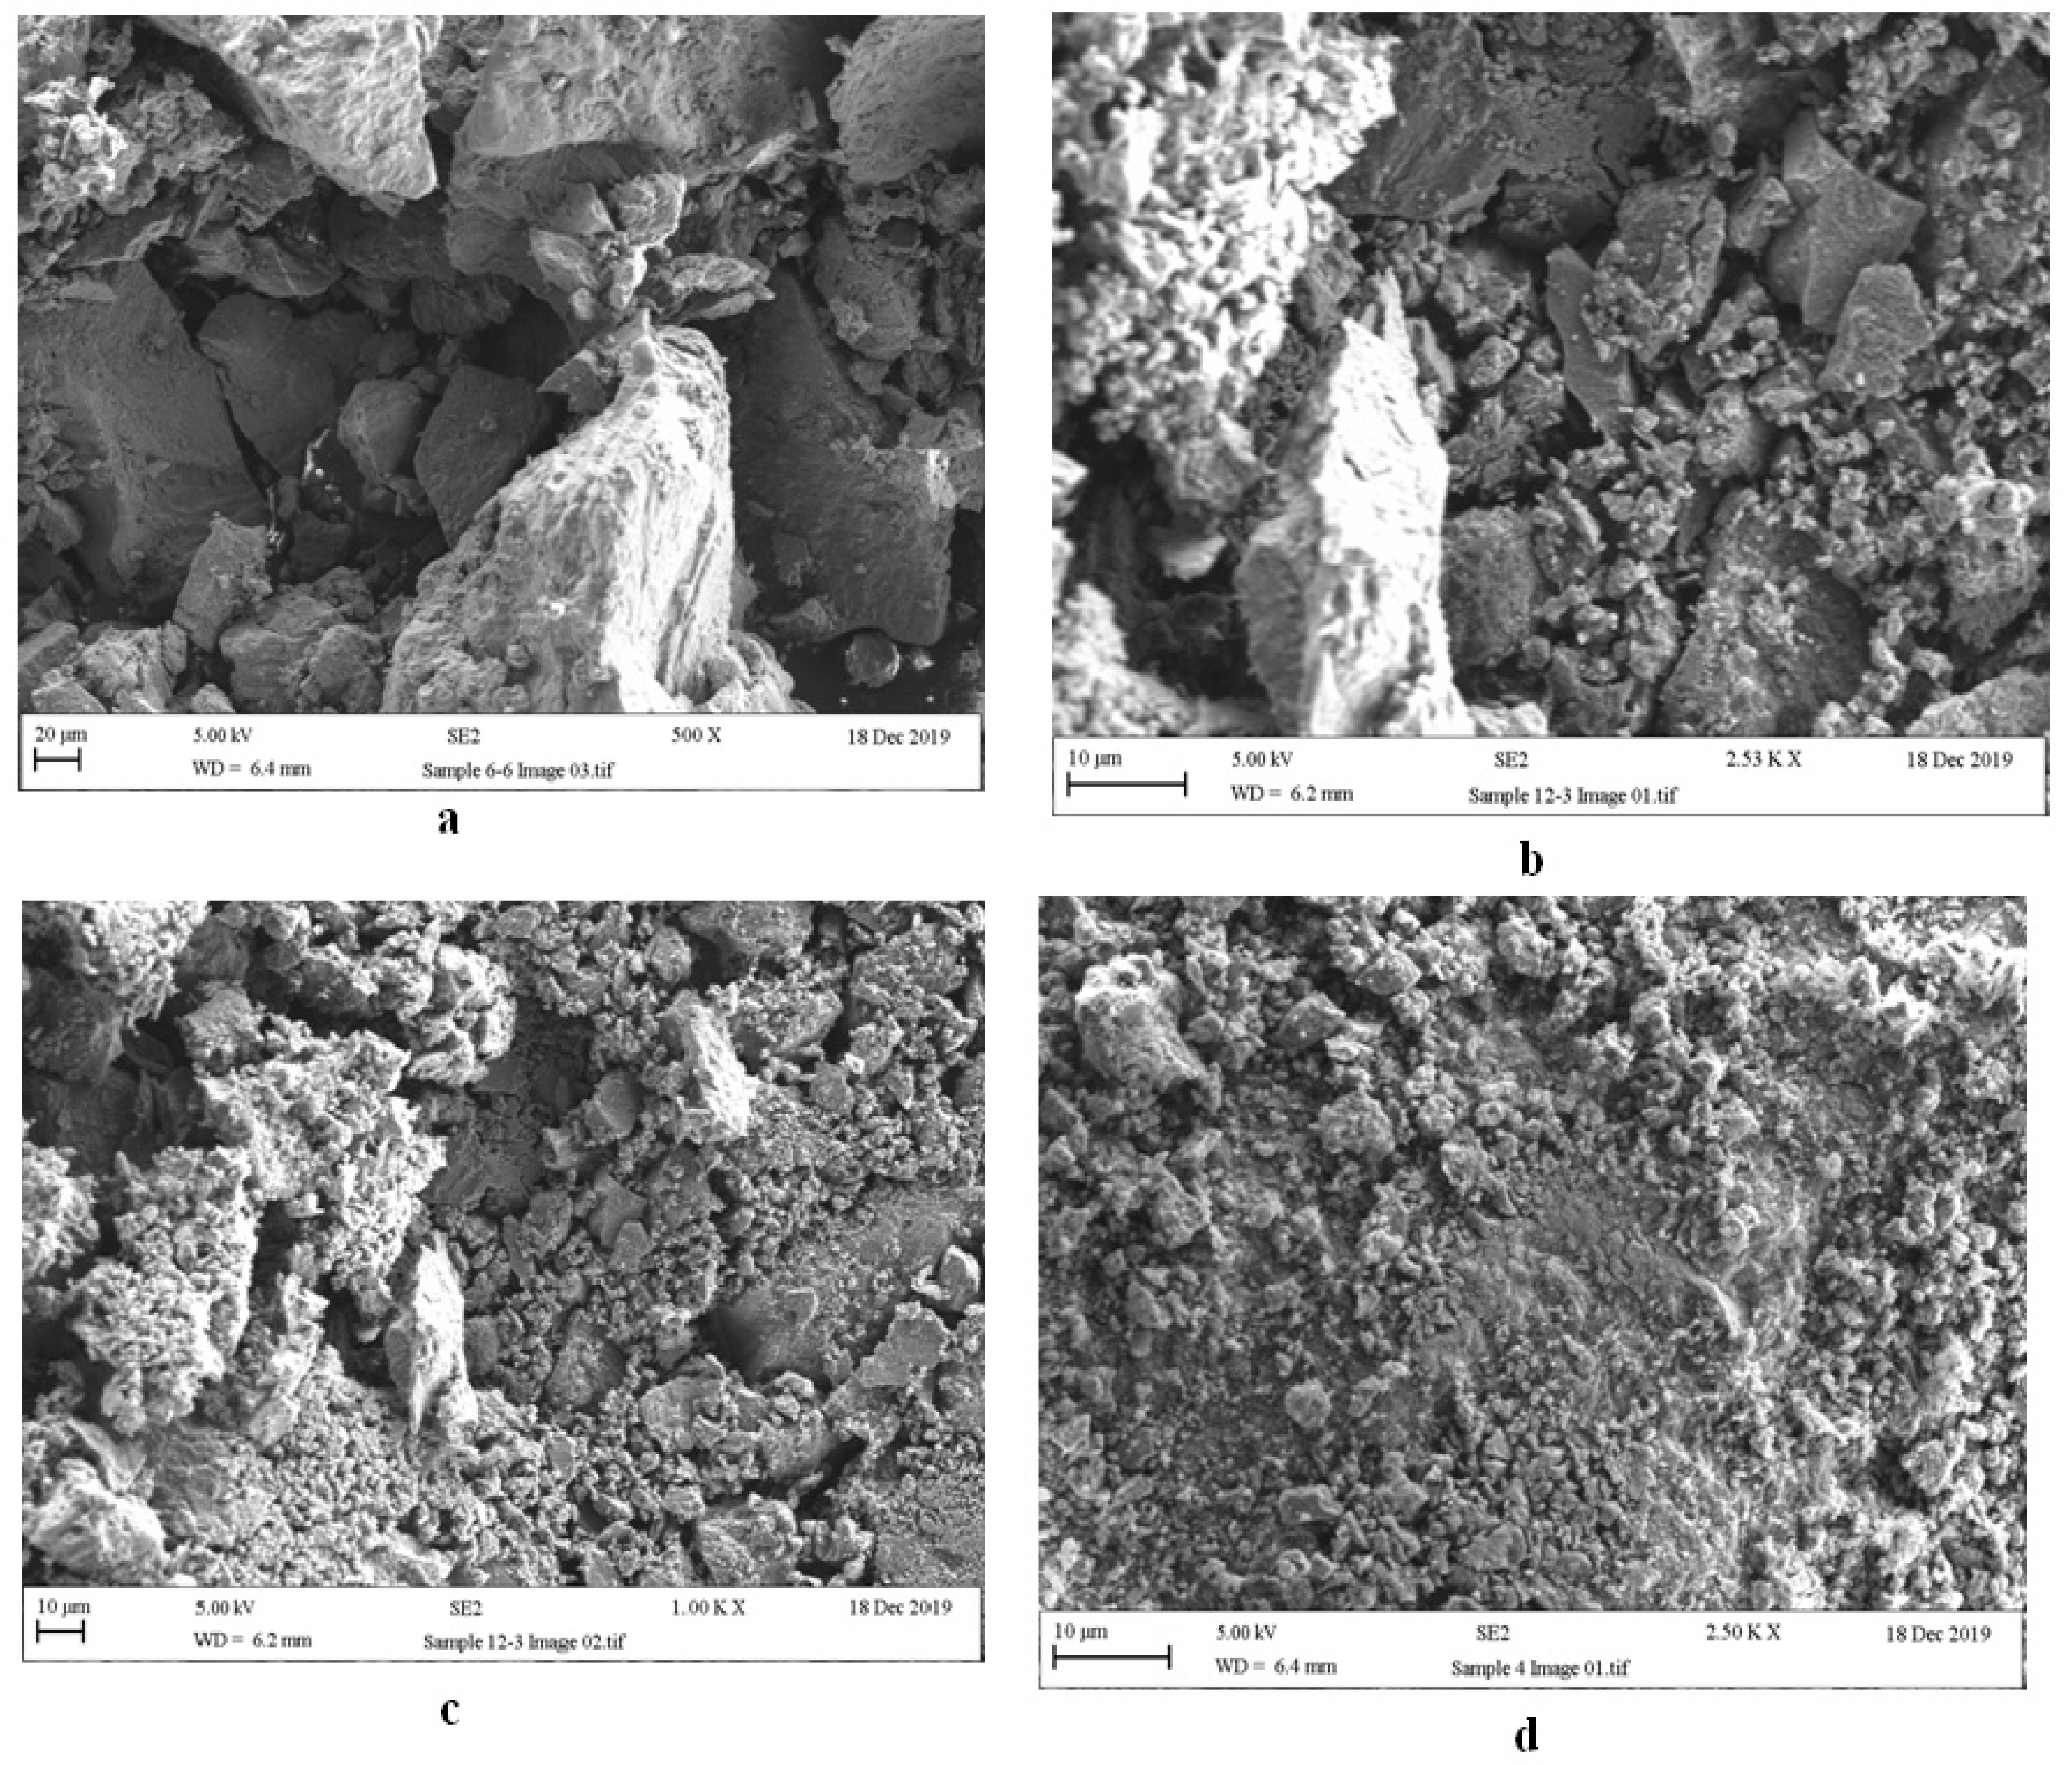
The micrographs of the natural and obtained samples after the sorption are presented in Figure 6. The surface of the indium-containing zeolite (Figure 7b) becomes less crystalline and more homogeneous; the number of pores decreases because there is a greater filling of the exchange centers, channels, and pores with the sorbed In3+ cations. After simultaneous sorption of the In3+ and Ga3+ cations, the sorbent surface morphology (Figure 7c) changes. Its surface becomes even more homogeneous, but still composed of various very small particles, held together quite tightly and evenly distributed throughout the structure (Figure 7c).
As seen from the SEM data, as the presence of cations in the system that differ in nature (valency, charge) increases, the number of free and active centers in the sorption processes, as well as voids and channels in the zeolite structure after the sorption, noticeably decreases, and the surface becomes more and more homogeneous.
As for the zeolite, isolated from the “natural zeolite–In3+–Ga3+” system with the minimum content of the sorbed cations (Figure 7d), its surface approaches the surface of natural zeolite (Figure 7a), i.e., in this case, there is no sorption of the In3+ and Ga3+ cations present in the system, which confirms the above methods of analysis.

4. Conclusions

The patterns of sorption of the In3+ and Ga3+ cations by the natural zeolite of the Shankanai deposit depending onthe S:L ratio (zeolite:solution), temperature, and time have been revealed.
In a system that simultaneously contains the In3+ and Ga3+ cations in equal concentrations, the sorption of the In3+ cations depends on the zeolite amount and temperature, and the Ga3+ cations depend on the temperature and time.
A physicochemical analysis (IR, XPA, DTA, SEM) of the zeolites, isolated from the “natural zeolite–In3+–H2O” and “natural zeolite–In3+–Ga3+”systems under the conditions of the most complete adsorption of cations, has shown that, as the diversity of types of the sorbed cations increases, the physicochemical characteristics of the spent sorbents change noticeably, which confirms the sorption of the cations, present in the systems under study. It has been shown that the physicochemical characteristics of the zeolite, isolated from the “natural zeolite–In3+–Ga3+”system under the conditions of their lowest sorption, are almost identical to the characteristics of natural zeolite, which indicates the absence of cation sorption by the sorbent.
Taking into account the cationic composition of the solution and selecting the conditions of the sorption process, it is possible to use natural zeolite for the purposeful purification of the filtrate of cottrel “milk” from the In and Ga impurities.

Author Contributions

Investigation, formal analysis, writing—original draft preparation, G.S., A.A., R.K. and N.K., visualization R.C., writing—review and editing G.S. and R.C., funding acquisition, project administration, supervision U.J. and R.C. All authors have read and agreed to the published version of the manuscript.

Funding

This work has been fully supported by the Ministry of Education and Science of the Republic of Kazakhstan under the project BR10965255.

Institutional Review Board Statement

Not applicable.

Informed Consent Statement

Not applicable.

Data Availability Statement

These data can be obtained free of charge via https://www.ncste.kz/ru/main (accessed on 25 July 2022).

Conflicts of Interest

The authors declare no conflict of interest.

References

  1. Migutin, G.V.; Maslyashova, G.A.; Dzhussipbekov, U.Z. Peculiarities of the formation of the alkaline environment of cottrel “milk” during the operation of electric furnaces on sinter. Chem. Ind. 1989, 10, 749–750. [Google Scholar]
  2. Petrov, N.F.; Zakirova, V.M. Utilization of cottrel “milk” in the production of double superphosphate. Phosphorus Ind. M. 1972, 5, 3–5. [Google Scholar]
  3. Abetayeva, S.A.; Dzhussipbekov, U.Z.; Chernyakova, R.M.; Dzhunussbekova, G.B. Utilization of cottrel“milk” for cyan-containing products. In Proceedings of the International Conference “Industrial Ecology and Geoecological Problems”, Pavlodar, Kazakhstan, 13–14 March 2006; p. 138. [Google Scholar]
  4. Turp, S.M.; Turp, G.A.; Ekinci, N.; Özdemir, S. Enhanced adsorption of methyleneblue from textile wastewater by using natural and artificial zeolite. Water Sci. Technol. 2020, 82, 513–523. [Google Scholar]
  5. Inglezakis, V.J.; Loizidou, M.D.; Grigoropoulou, H.P. Ion exchange of Pb2+, Cu2+, Fe3+, and Cr3+ on natural clinoptilolite: Selectivity determination and influence of acidity on metal uptake. J. Colloid Int. Sci. 2003, 261, 49–54. [Google Scholar] [CrossRef]
  6. Dagayeva, E.V.; Valinurova, E.R. Sorption of copper (II) ions on natural and modified zeolites of the Honguruu deposit. Bull. Bashkir Univ. 2019, 24, 71–75. [Google Scholar] [CrossRef]
  7. Kolesnikova, L.G.; Lankin, S.V.; Yurkov, V.V. Ionic Transport in Clinoptilolite; BSPU: Blagoveshchensk, Russia, 2007; 113p. [Google Scholar]
  8. Kats, E.M.; Nikashina, V.A.; Bychkova, Y.V. Sorption of heavy metals Ni, Cd, Cr, Zn, Cu from surface water on natural and modified clinoptilolites. Sorpt. Chromatogr. Process. 2013, 13, 808–815. [Google Scholar]
  9. Nikashina, V.A.; Serova, I.B.; Kats, E.M. Purification of artesian drinking water from ammonium ions on natural clinoptilolite-containing tuff. Mathematical modeling and calculation of the sorption process. Sorpt. Chromatogr. Process. 2008, 8, 23–29. [Google Scholar]
  10. Sultanbayeva, G.S.; Holze, R.; Chernyakova, R.M.; Dzhussipbekov, U.Z. Removal of Fe2+, Cu2+, Al3+ and Pb2+-ions from phosphoric acid by sorption on carbonate-modified natural zeolite and its mixture with bentonite. Microporous Mesoporous Mater. 2013, 170, 173–180. [Google Scholar] [CrossRef]
  11. Zhantuarov, S.R.; Martemiyanov, D.V.; Levchenko, O.N. Influence of the fractional composition of zeolites on the efficiency of extraction of iron ions from solutions. In Proceedings of the Chemistry and Chemical Technology in the XXI Century: Abstracts, Report XIV All-Russian Scientific-Practical Conference, Tomsk Polytechnic University, Tomsk, Russia, 15–17 October 2013; Volume 2, pp. 190–192. [Google Scholar]
  12. Zhantuarov, S.R.; Umirzakov, A.G.; Martemiyanov, D.V. Determination of the sorption characteristics of natural zeolites from various deposits by extracting iron ions from aqueous media. In Proceedings of the XI International Conference Prospects of Fundamental Sciences Development of Fundamental Sciences, Tomsk, Russia, 6–7 May 2013; pp. 312–314. [Google Scholar]
  13. Adryshev, A.K.; Strunnikova, N.A.; Karibayeva, M.K. Extraction of metal ions from contaminated groundwater with zeolites. Bull. EKSTU Ecol. 2008, 2, 102–108. [Google Scholar]
  14. Timofeyev, K.L. Sorption Extraction of Non-Ferrous and Rare Metals from Industrial Solutions of Mining and Metallurgical Enterprises. Ph.D. Thesis, Ural Federal University, Yekaterinburg, Russia, 2021; 382p. Available online: https://elar.urfu.ru/handle/10995/100768 (accessed on 25 July 2022).
  15. Sultanbayeva, G.S.; Chernyakova, R.M.; Dzhussipbekov, U.Z.; Oshakbayev, M.T. Physicochemical Studies of the Zeolite of the Shankanai Deposit and the Study of Phosphate Ions Sorption. News Minist. Educ. Sci. RK Chem. Ser. 2003, 6, 75–79. [Google Scholar]
  16. Smirnov, A.D. Sorption Water Purification. Leningrad: “Chemistry”. 1982. 168p. Available online: https://cv01.studmed.ru/7bf5e7feb48/716633a.jpg (accessed on 25 July 2022).
  17. Toroptseva, A.M. Laboratory Workshop on Chemistry and Technology of Macromolecular Compounds; L.: “Chemistry”. 1972. 416p. Available online: https://cv01.studmed.ru/fa88dbe33b9/1439f77.jpg (accessed on 25 July 2022).
  18. Akhnazarova, S.L.; Kafarov, V.V. Optimization of Experiment in Chemistry and Chemical Technology; Higher School: Moscow, Russia, 1985; p. 327. [Google Scholar]
  19. Akhnazarova, S.L.; Drazdova, V.I.; Konovalova, N.V.; Kafarov, V.V. Mathematical modeling of nitric acid decomposition of “cotrel milk”. Chem. Ind. 1984, 7, 428–430. [Google Scholar]
  20. Kafarov, V.V. Methods of Cybernetics in Chemistry and Chemical Technology; Mir: Moscow, Russia, 1971; 496p, Available online: https://rusneb.ru/catalog/002072_000044_ARONB-RU_Архангельская+ОНБ_DOLIB_-309863/ (accessed on 25 July 2022).
  21. Nakamoto, K. Infrared Spectra of Inorganic and Coordination Compounds; Peace: Moscow, Russia, 1991; 536p, Available online: http://www.ncm.unn.ru/files/2021/01/Nakamoto-IK-spektry-i-spektry-KR-nerganicheskih-i-koordinatsionnyh-soedinenij.pdf (accessed on 25 July 2022).
Figure 1. Influence of the studied factors on the residual content of In3+ in the liquid phase of the “natural zeolite–In3+–Н2О”system.(a) S:L ratio; (b) temperature, °С; (c) time, min.
Crystals 12 01220 g001
Figure 2. Influence of the studied factors on the residual content of In3+ in the liquid phase of the “natural zeolite–In3+–Ga3+” system. (a) zeolite norm (S:L); (b) temperature, °C; (c) time, min.
Crystals 12 01220 g002
Figure 3. The influence of the studied factors on the residual content of Ga3+ in the liquid phase of the “natural zeolite–In3+–Ga3+” system. (а) the S:L ratio; (b) temperature, °С; (c) time, min.
Crystals 12 01220 g003
Figure 4. TheIR spectra of zeolites. Zeolites: a—natural; with the maximum content of cations: b and c—In3+ and Ga3+; d—with the minimum content of the In3+ and Ga3+ cations.
Crystals 12 01220 g004
Figure 5. TheX-ray patterns of zeolites. Zeolites: a—natural; zeolite with the maximum content of the cations: b—In3+; c—In3+ and Ga3+; d—zeolite with the minimum content of the In3+ and Ga3+ cations.
Crystals 12 01220 g005
Figure 6. The derivatograms of zeolites. Zeolites: (a) natural; with the maximum content of cations: (b) In3+; (c) with a minimum content of the In3+ cations.
Crystals 12 01220 g006
Figure 7. The micrograph of zeolites. Zeolites: (a) natural; with the maximum cation content: (b) In3+; (c) In3+ and Ga3+; (d) with the minimum content of the In3+ and Ga3+ cations.
Crystals 12 01220 g007
Table 1. Plan center coordinates, variation levels.
Coded ValueNatural Value
Х1, S:L, gХ2, Т (°С)Х3, τ (min)
Upper level (+1)2.55349
Plan center-Level Zero (zi0)1.7542.532.5
Lower level (−1)1.03216
Axis spacing (Δzi)1.52133
Axial distance (+1682)3.06060
Axial distance (−1682)0.5255
Table 2. The output parameters of the experiment on the sorption of the In(III) cations in the “natural zeolite-In3+-H2O” system.
#Coded ValueParametersResults
Z1, S:L (g)Z2, Т (°С)Z3, τ (min)Х1, S:L (g)Х2, Т (°С)Х3, τ(min)In(III)
Residual Content In3+ (mg/L)Degree of Sorption (%)
1–1–1–11:100321669.031.0
2+1–1–12.5:100321648.052.0
3–1+1–11:100531636.064.0
4+1+1–12.5:100531654.046.0
5–1–1+11:100324962.038.0
6+1+1+12.5:100324976.024.0
7–1+1+11:100534971.029.0
8+10+12.5:100534979.021.0
9–1.682000.5:100433386.014.0
10+1.682003:100433348.052.0
110–1.68201.75:100253375.025.0
120+1.68201.75:100603367.033.0
1300–1.6821.75:10043558.042.0
1400+1.6821.75:100436038.062.0
150001.75:100433350.050.0
160001.75:100433352.048.0
170001.75:10043358.042.0
180001.75:100433373.027.0
190001.75:100433355.045.0
200001.75:100433359.041.0
Table 3. Planning matrix and results of the experiment of the cation sorption in the “natural zeolite–In3+–Ga3+–H2O” system.
ParametersResults
Х1, S:LХ2, Т (°С)Х3,τ(min)In(III)Ga(III)
Residual Content In3+ (mg/L)Degree of Sorption (%)Residual Content Ga3+ (mg/L)Degree of Sorption (%)
11:100321676246337
22.5:100321649515347
31:100531681194159
42.5:100531651495050
51:100324987135941
62.5:100324958425347
71:100534982185644
82.5:100534961395743
90.5:100433380205248
103:100433328725446
111.75:100253336646139
121.75:100603351494357
131.75:10043560406337
141.75:100436062385050
151.75:100433373277525
161.75:100433370307030
171.75:100433358425842
181.75:100433371297822
191.75:100433372287426
201.75:100433373277129
Publisher’s Note: MDPI stays neutral with regard to jurisdictional claims in published maps and institutional affiliations.

