Article

Microstructure and Mechanical Behavior of Cu–Al–Ag Shape Memory Alloys Processed by Accumulative Roll Bonding and Subsequent Annealing

by
Parinaz Seifollahzadeh
1,
Morteza Alizadeh
1,*,
Ábel Szabó
2,
Jenő Gubicza
2,* and
Moustafa El-Tahawy
2,3
1
Department of Materials Science and Engineering, Shiraz University of Technology, Modarres Blvd., Shiraz 71557-13876, Iran
2
Department of Materials Physics, Eötvös Loránd University, P.O. Box 32, H-1518 Budapest, Hungary
3
Department of Physics, Faculty of Science, Tanta University, Tanta 31527, Egypt
*
Authors to whom correspondence should be addressed.
Crystals 2022, 12(8), 1167; https://doi.org/10.3390/cryst12081167
Submission received: 25 July 2022 / Revised: 13 August 2022 / Accepted: 14 August 2022 / Published: 19 August 2022
(This article belongs to the Special Issue Mechanical Properties of Advanced Metallic Materials)

Abstract

:
Ultrafine-grained Cu/Al/Ag composites were processed by an accumulative roll bonding (ARB) technique from pure copper and aluminum sheets and a silver powder. The Al content was fixed to 11 wt.% while the silver concentration was 1, 2, or 3 in wt.%. The ARB-processed samples were heat treated at different temperatures between 750 and 1050 °C for 60 min and then quenched to room temperature (RT) for producing Cu–Al–Ag alloys. The effect of the addition of different Ag contents and various heat treatment temperatures on the structural evolution was investigated. The ARB-processed samples were composed of Cu and Al layers with high dislocation density and fine grain size (a few microns). During heat treatment of the ARB-processed samples, new intermetallic phases formed. For the lowest Ag content (1 wt.%), the main phase was a brittle simple cubic Al4Cu9, while for higher Ag concentrations (2 and 3 wt.%), the quenched samples contain mainly an orthorhombic β1-AlCu3 martensite phase. The martensite phase consisted of very fine lamellas with a thickness of one micron or less. The heat treatment increased the microhardness and the strength of the samples at RT due to the formation of a fine-grained hard martensite phase. For 2 and 3% Ag, the highest martensite phase content was achieved at 850 and 950 °C, respectively. The annealed and quenched samples exhibited good shape memory behavior at RT.

1. Introduction

In recent years, composites with ultrafine-grained (UFG) microstructures have attracted significant attention due to their improved mechanical properties [1,2,3]. UFG microstructure can be fabricated by severe plastic deformation (SPD) methods such as equal channel angular pressing (ECAP) [4,5], high-pressure torsion (HPT) [6,7], repetitive corrugation and straightening (RCS) [8], and accumulative roll bonding (ARB) [9,10,11]. Among all of these methods, ARB is the easiest way to apply in an industrial environment since it can be performed by conventional rolling apparatuses. During ARB processing, rolling, cutting, and stacking steps are applied consecutively on a sheet in order to achieve grain refinement without reduction in the thickness of the workpiece [12]. If a sandwich-like material consisting of different metallic layers is processed by ARB, a layered composite structure forms [1]. Post-processing heat treatment of layered composite structures obtained by ARB can yield multiphase alloys [13].
UFG Cu–based alloys with different compositions have already been produced by ARB in the literature [14,15,16,17,18]. The as-processed alloys have advantageous properties such as excellent wear resistance, high mechanical strength, and good corrosion resistance, which make them potential candidates as raw materials in electronic and automotive industries [19,20]. In addition, some Cu–based compositions exhibit a shape memory effect (SME). SME occurs due to martensitic thermoelastic transformation [21,22]. Binary Cu–Al and Cu–Zn alloys are the two main systems of Cu–based shape memory alloys (SMAs). In both systems, the main phase must be the β-phase for exhibiting SME. However, it has been reported that binary Cu–Al alloys exhibit a weak SME; therefore, attempts were made for improving SME by adding a third alloying element [23]. For example, Zn and Mn have been added to Cu–Al alloys, and then processed by ARB [24,25]. It was reported that the type and concentration of alloying elements influence the microstructure evolution during ARB and the properties of Cu–based SMAs. It has also been shown that the addition of Ag to Cu–based SMAs fabricated by casting not only yields a higher degree of martensitic transformation but also improves the ductility and increases the martensitic transformation temperature [23,26]. Namely, Cu–Al alloys containing Ag exhibit martensitic transformation temperatures well above 200 °C, while the most commonly used Cu–Ni–Ti and Cu–AI–Ni SMAs can be used only below 200 °C. For obtaining the best SME in Cu–Al–Ag alloys, the silver content and the heat treatment conditions must be optimized. For this purpose, experiments must be conducted for studying the phase evolution in Cu–Al–Ag SMAs during thermal cycling between martensite finish (Mf) and austenite finish (Af) temperatures.
The classical methods for the fabrication of SMAs are casting and powder metallurgy. In casting methods, oxidation or evaporation of some elements can occur, resulting in a change in the alloy composition. To avoid this effect, the application of vacuum or shielding gases is necessary. Moreover, casting results in a coarse-grained material, and additives are needed to refine the grain size. Powder metallurgy leads to porosity inside the samples at the end of processing [24]. Thus, in order to obtain fine-grained SMAs with high strength, SPD-processing routes are suggested to be used instead of the conventional casting technique. ARB is a non-expensive SPD method that can result in a fine-grained material with no or little porosity. However, this is a two-step method since first a layered composite of the constituents (e.g., Cu and Al) forms and then the ARB-processed sandwich material must be heat treated in order to obtain SMA.
In the present work, UFG multilayered Cu–Al–Ag materials with three different Ag contents were fabricated by ARB. The as-processed multilayered samples were subjected to heat treatment processes in order to produce Cu–Al–Ag SMAs for investigating the effect of different heat treatments and Ag contents on the martensite phase evolution in these alloys. Immediately after ARB, the UFG microstructure in the major Cu phase was studied by X-ray line profile analysis (XLPA) in order to reveal the microstructure evolution due to SPD processing. The microstructure and the phase composition were investigated by scanning electron microscopy (SEM), electron backscatter diffraction (EBSD), and X-ray diffraction (XRD) for the ARB-processed and the subsequently heat-treated specimens. The effect of the Ag content and the annealing temperature on the phase composition and the mechanical behavior is discussed in detail.

2. Materials and Methods

2.1. Starting Materials and ARB Processing of Multi-Layered Composites

Cu/Al/Ag composites with three different compositions were produced by ARB. In this process, pure copper (>99.9 wt.%) and aluminum (>99 wt.%) in sheet form and pure silver powder (>99 wt.%) with a particle size of <5 μm were used as starting materials. The initial thicknesses of the Cu and Al sheets were 0.5 and 0.3 mm, respectively. These sheets and the Ag powder were ARB-processed for 1, 5, and 9 cycles [27] in order to obtain layered composites. The silver powder was placed between the Cu and Al layers before ARB. The samples have a constant amount of Al with three different Ag concentrations as Cu/11 wt.% Al/x wt.% Ag (x = 1, 2, or 3). It should be noted that the chemical composition of the as-processed composites depends on the thicknesses and the numbers of the Cu and Al sheets as well as the fraction of the Ag powder. These data before the first ARB cycle are listed in Table 1.
A surface preparation process was performed on Cu and Al sheets for a better bonding between the layers. The following steps were carried out:
  • Degreasing the sheets with acetone in order to remove surface contaminations.
  • Scratching the sheets with a stainless-steel brush in order to promote cold welding between the layers during the ARB process.
  • Sectioning the sample into two halves.
  • Stacking them again, repeating the ARB process up to nine passes.
The diameters of the brush and its wires were 100 mm and 0.3 mm, respectively. During the preparation of the samples for ARB, oxidation of the sheets may occur. To avoid this effect, attention must be paid to the time gap between the surface preparation and the next ARB cycle. In this research, the time gap was less than 10 min. The Cu layers were considered as the matrix and the Al layers and the silver powder were placed between them. The rolling speed, the load, and the diameter of the rolls were 10 rpm, 30 tons, and 30 cm, respectively. In this study, the following coding is used for labeling the as-prepared samples. The code consists of one letter and two numbers. The letter (C) stands for the word “composite” denoting the ARB-processed samples, the first number shows the amount of Ag in wt.% and the last number indicates the number of ARB cycles. For example, C11 is the composite with 1 wt.% Ag processed by one cycle of ARB and C35 is the composite sample with 3 wt.% Ag after the 5th ARB cycle. It should be noted that the presence of silver powder hinders the development of bonding between the Cu and Al layers. To overcome this problem, the magnitude of cross-section reduction was increased in the first ARB cycle. Namely, three rolling steps were applied; during the first rolling step the thickness reduction was 65%, while in the next two steps, the thickness reduction during each rolling was 50%. These three rolling steps were considered as the first cycle of ARB. During the subsequent ARB processing, one cycle corresponds to 50% thickness reduction as usual.

2.2. Alloy Fabrication from the ARB-Processed Layered Composites via Heat Treatment

For obtaining alloys from the ARB-processed layered composites, the samples processed by 9 passes were heat treated at temperatures between 750 and 1050 °C for 60 min, and then quenched into an ice/water mixture to produce a martensite phase. According to the Cu–Al phase diagram [28], Cu with 11 wt.% Al can reach the β-phase region in this temperature range; therefore, we selected this range for our study. It should be noted that the adding of Ag may change slightly the temperatures of interest. The martensite phase plays an important role in SMEs. In this regard, martensite start temperature (Ms) is a very important parameter. It is essential to find alloys with high transformation temperatures for high-temperature applications. Most Cu–based shape memory alloys, with Cu–Al–Ni being the most common one, can be used at temperatures up to 200 °C. It has been shown that for Cu–Al–Ag alloys containing different amounts of Ag (fabricated by casting), Ms is well above 200 °C [26]. Among all concentrations of Ag, 2 and 3 wt.% yielded the highest Ms. Thus, three different Ag concentrations below 3 wt.% were chosen in the present study. A coding system was also used for the annealed samples. In this system, the letter A stands for the word “alloy” (or “annealed samples”). The number next to it reveals the wt.% of Ag constituent, the second number shows the annealing temperature in °C, and the last one indicates the holding time in minutes (60 min for all studied specimens). For example, a sample with the code of “A2–950–60” indicates the alloy with 2 wt.% Ag, which was heat treated at 950 °C for 60 min.

2.3. Characterization of the Phase Composition and the Microstructure

The phase composition of the ARB-processed composites and the heat-treated samples was determined by XRD using a powder diffractometer (type: Smartlab, manufacturer: Rigaku) with Bragg–Brentano geometry and a D/Tex detector (applying CuKα radiation with a wavelength of λ = 0.15418 nm). The diffractograms were evaluated with the PDXL2 program using the ICDD-2018 database.
The microstructure of the Cu phase in the ARB-processed samples was studied by XLPA. The X-ray diffraction patterns were measured by a high-resolution rotating anode diffractometer (type: RA-MultiMax9, manufacturer: Rigaku) using CuKα1 radiation (wavelength, λ = 0.15406 nm). The X-ray diffraction peak profiles were evaluated by the convolutional multiple whole profile (CMWP) fitting procedure [29]. In this method, the diffraction pattern is fitted by the sum of a background spline and the convolution of the theoretical line profiles related to crystallite size and dislocations. The first eight reflections of Cu were used in the evaluation. These peaks can be found in the diffraction angle (2θ) range between 40 and 155°. The area-weighted mean crystallite size (<x>area) and the dislocation density (ρ) were determined by the CMWP fitting evaluation procedure of the diffraction patterns. The value of <x>area is calculated as <x>area = m.exp (2.5σ2), where m is the median and σ2 is the lognormal variance of the crystallite size distribution. As an example, Figure 1 shows the CMWP fitting for the sample containing 1% Ag and ARB-processed for 9 cycles. More details about the XLPA evaluation can be found in [30].
The ARB-processed and the annealed microstructures were studied on the cross sections of the samples by SEM using an FEI Quanta 3D microscope (manufacturer: Thermo Fisher Scientific, Waltham, MA, USA). Each surface was mechanically polished with 1200, 2500, and 4000 grit SiC abrasive papers, and then the polishing was continued with a colloidal silica suspension (OP-S) first with a particle size of 1 micron and then 40 nm. Finally, the surface was electropolished at 5 V and 0.5 A using an electrolyte D2 from Stuers. EBSD images were taken with a step size between 35 and 250 nm, depending on the magnification, and evaluated using OIM software (manufacturer: TexSem Laboratories). The grain size was taken as the size of the volumes bounded by high-angle grain boundaries (HAGBs) with misorientation angles higher than 15°. Only those areas were taken as grains that contained at least 4 pixels. The area-weighted mean grain size was used for the characterization of the microstructure. Energy dispersive X-ray spectroscopy (EDS) was applied for the analysis of the chemical composition using the same electron microscope (FEI Quanta 3D).

2.4. Mechanical Characterization

The Vickers microhardness of the samples was measured by a Wolpert Wilson hardness tester (manufacturer: Buehler, Düsseldorf, Germany) in accordance with ASTM E384 standard. The measurements were carried out with a load of 100 g and a loading time of 10 s. In order to increase the reliability of hardness measurement, several indents were placed in different parts of the samples and their average was used as the final hardness number.
The strength, ductility, and shape memory behavior of the samples were studied by tension using an STM-50 universal testing machine (manufacturer: Santam, Tehran, Iran). For this experiment, 1/5 miniaturized JIS-5 tensile test specimens were prepared by a wire cut machine. The longitudinal axis of the tensile samples was parallel to the rolling direction of ARB processing. The length, width, gauge length, and gauge width of the tensile test specimens were 50, 15, 10, and 5 mm, respectively. During the tensile tests, a constant cross-head velocity of 0.5 mm/min was applied, which corresponded to an initial strain rate of about 10−3 s−1.

3. Results and Discussion

3.1. Microstructure of the ARB-Processed and the Subsequently Annealed Samples

3.1.1. Microstructure of the Sandwich-like Specimens Obtained by ARB

Figure 2 shows the XRD patterns obtained for the samples with three different Ag contents processed by nine ARB cycles. In all samples, besides the main Cu phase, the peaks of face-centered cubic (FCC) Al and Ag are visible in the diffractograms. The reflections of Ag are very weak due to its small volume fraction. It can be concluded that no reaction occurred between the constituents during ARB owing to the low temperature of the ARB process. Although the temperature of the ARB samples usually increases from room temperature (RT) to about 100 °C due to the friction between the strips and the rolls in non-lubricant conditions [31], this temperature is not enough for a considerable diffusion of the alloying elements into the Cu matrix during ARB processing. Therefore, the phase composition of the ARB-processed multilayered Cu–Al–Ag materials is far from equilibrium, since the phase diagram predicts the existence of intermetallic compounds for the studied compositions even at low temperatures. For instance, if the Ag content is neglected then for Cu–11 wt.% Al composition between RT and 100 °C, an ordered FCC Cu3Al phase must form according to the equilibrium phase diagram.
In order to characterize the microstructure of the ARB-processed samples, the XRD peaks of the main Cu phase were evaluated for the crystallite size and the dislocation density using the XLPA method. Table 2 shows the effect of the ARB cycles and the Ag contents on the crystallite size (<x>area) and the dislocation density (ρ). The crystallite size varied between ~65 and ~103 nm while the dislocation density was about 7 × 10¹⁴ m−2 for the different samples. It is obvious that the crystallite size is small and the dislocation density is high even after the first cycle of ARB, which is not in accordance with the expected gradual development of the microstructure versus the number of ARB cycles. The observed fast microstructural refinement can be attributed to the addition of Ag powder to the Cu–Al system and the corresponding modification of the ARB process. Namely, the presence of silver powder between Cu and Al layers hinders the development of bonding between them [32]. To achieve a proper bonding strength between the layers, either the number of rolling cycles or the magnitude of cross-section reduction should be increased. In this study, three rolling steps were used during the first cycle of ARB as described in Section 2.1. Since several rolling steps were required to achieve a proper bonding strength between the layers due to the presence of the silver powder, the density of dislocations became high and the crystallite size had a low value even in the early stage of ARB (i.e., immediately after the first cycle). Therefore, the crystallite size and the dislocation density only slightly changed with increasing the number of ARB cycles. The XLPA results also suggest that the Ag content has only a marginal effect on the microstructural parameters. Most probably, the silver particles at the interfaces of the Cu and Al layers cannot influence the microstructure inside the Cu layers considerably. Since the number of ARB cycles has no significant effect on the microstructural parameters determined by XLPA, an SEM study on the grain structure was performed only for the highest applied ARB cycle (e.g., for nine cycles). These results are shown in the next paragraphs.
The backscattered SEM images in Figure 3 illustrate the microstructures obtained on the cross section of the samples containing different Ag contents and processed for nine cycles of ARB. The bright and dark areas correspond to Cu and Al phases, respectively. It can be seen that the samples contain thick Cu and thin Al layers or their fragments, which are elongated in the rolling direction (direction RD). After the first ARB cycle, the samples consist of four Cu and three Al layers. The number of layers increases with increasing the number of ARB cycles and at the end of the ninth cycle, the composites contain 1792 layers. However, it should be noted that the determination of the number of layers in the micrographs is difficult due to their fragmentation and deformation caused by ARB straining. With increasing the number of cycles, the thickness of the layers decreases (not studied here). The thickness reduction may be different for the various layers, depending on their mechanical properties [24]. Some ARB processing parameters, such as the load, also affect the thickness reduction [33]. Figure 3 revealed that there is a broad thickness distribution for the layers of the copper matrix.
Figure 4a shows a large Cu layer fragment from the center of the backscattered SEM image in Figure 3a obtained on the ARB-processed sample C19. The contrast differences inside the Cu layer suggest a fine-grained microstructure. Indeed, the inverse pole figure (IPF) map in Figure 4b taken on the same area reveals an average grain size of a few microns on the top and bottom part of the layer (zone “b” in Figure 4a) while the UFG microstructure with an average grain size of several hundreds of nanometers exists in the middle of the Cu layer (indicated by the letter “a” in Figure 4a). The much smaller grain size in the middle region may be caused by a recrystallization due to the severe deformation during ARB. Indeed, former studies suggested that in metals with low and medium stacking fault energies (SFEs), recrystallization is the dominant mechanism of grain refinement during ARB, leading to nanostructured or UFG microstructures [31,34]. However, grain subdivision is the dominant mechanism in metals with high SFEs [31,32]. Since the values of SFEs for copper and aluminum are 78 and 166 mJ/m2, respectively [35], it is suggested that recrystallization and grain subdivision are the dominant mechanisms for copper and aluminum, respectively. In the grain subdivision mechanism, dislocations are formed at the beginning of SPD processing, which are clustered into dislocation cell walls at a later stage of deformation [36]. In the present material, Cu and Al co-exist; therefore, both mechanisms contributed to the structural refinement. It should be noted that in ARB processing, in addition to the high applied strain, other factors also contribute to the structural refinement [2,37,38]. For instance, friction between the rolls and the samples, as well as scratch brushing of the surface, can increase the dislocation density and refine the grains. In addition, the interfaces between the layers are strong obstacles against dislocation motion, thereby inducing a more intense dislocation multiplication and thus contributing to grain refinement. The difference between the thermal expansion coefficients of Cu, Al, and Ag can also yield dislocation generation if the increase in temperature during ARB is considered [37].
Inhomogeneities in the grain structure were found not only for specimen C19 but also for the samples containing 2% and 3% Ag and processed by 9 cycles of ARB, as shown in Figure 4c,d. The average grain size was in the range of 2–5 µm for the three samples with different Ag contents and ARB-processed for nine cycles. It was also found that most grains in the Cu matrix are elongated in the rolling direction. It is worth noting that the crystallite size obtained by XLPA is much smaller than the grain size determined by microscopic methods such as EBSD, which is a usual effect in SPD-processed metallic materials [19]. This difference can be explained by the sensitivity of the XLPA method on misorientations inside the grains since volumes even with very low orientation differences (a few tenths of degrees) scatter X-rays incoherently. Therefore, the XLPA method measures the size of subgrains or dislocation cells in severely deformed metals rather than the grain size. The microstructure in the minor Al phase in the ARB-processed samples was not studied either XLPA or EBSD due to its very low fraction.

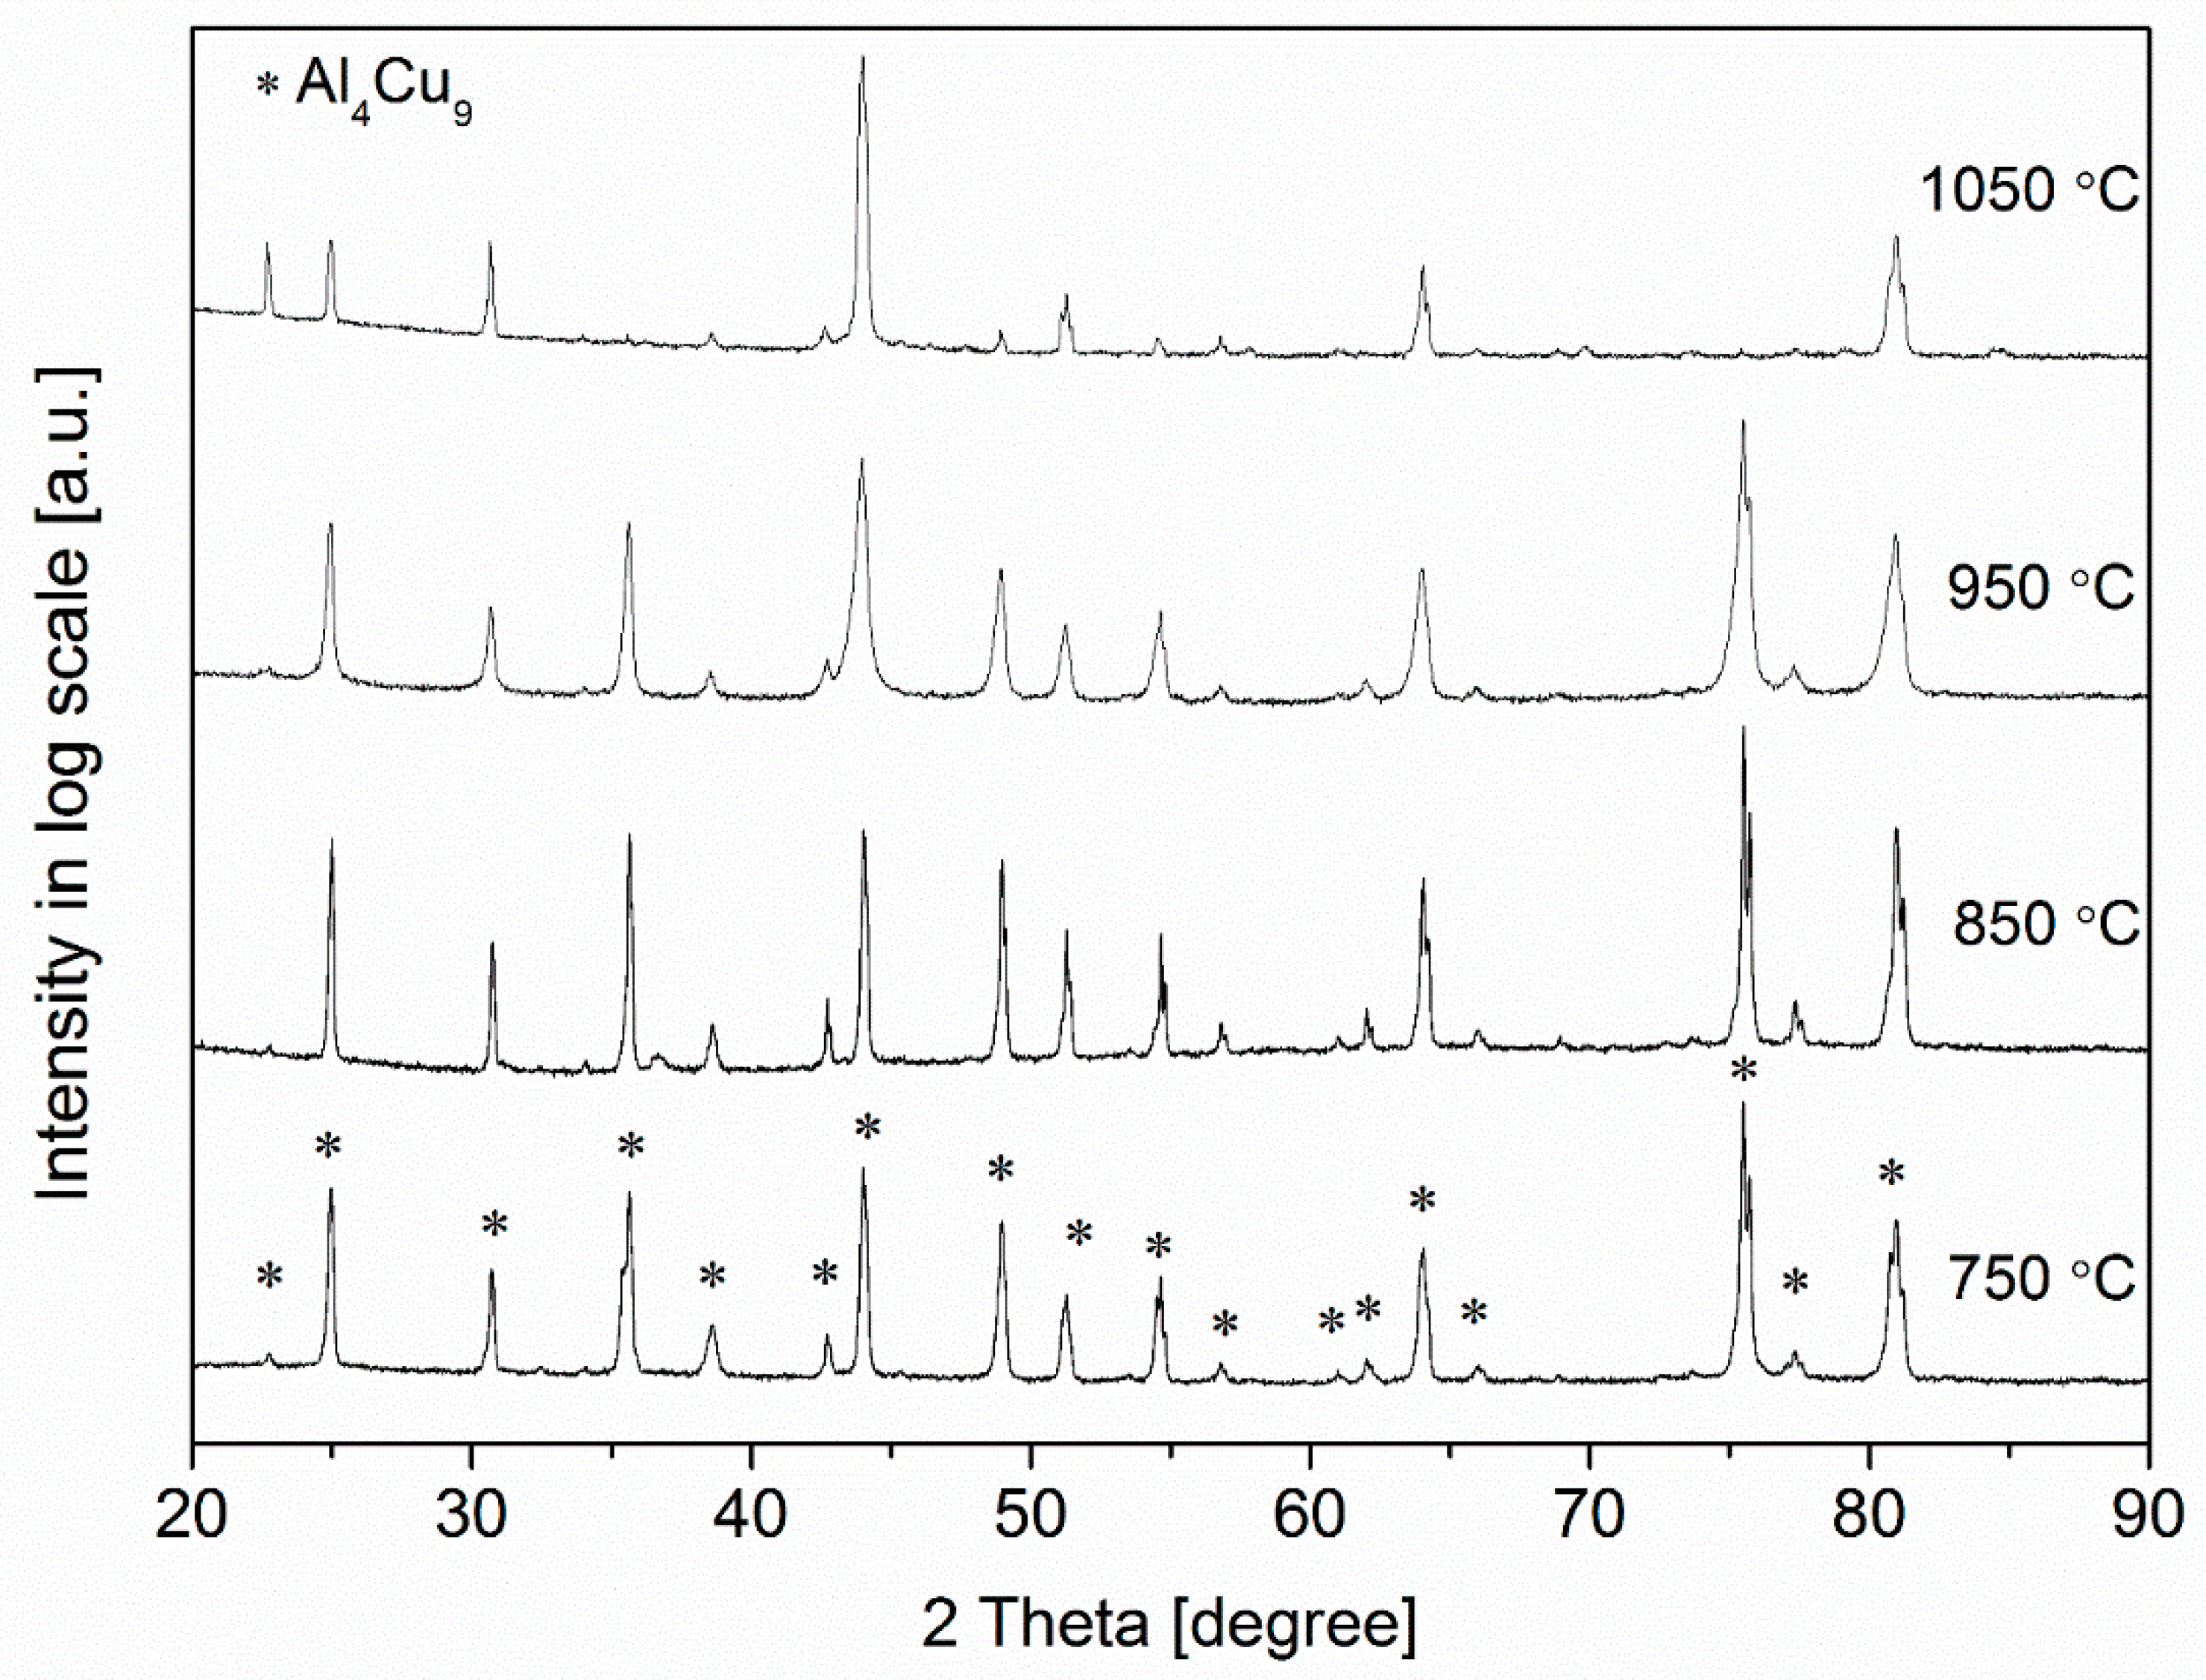
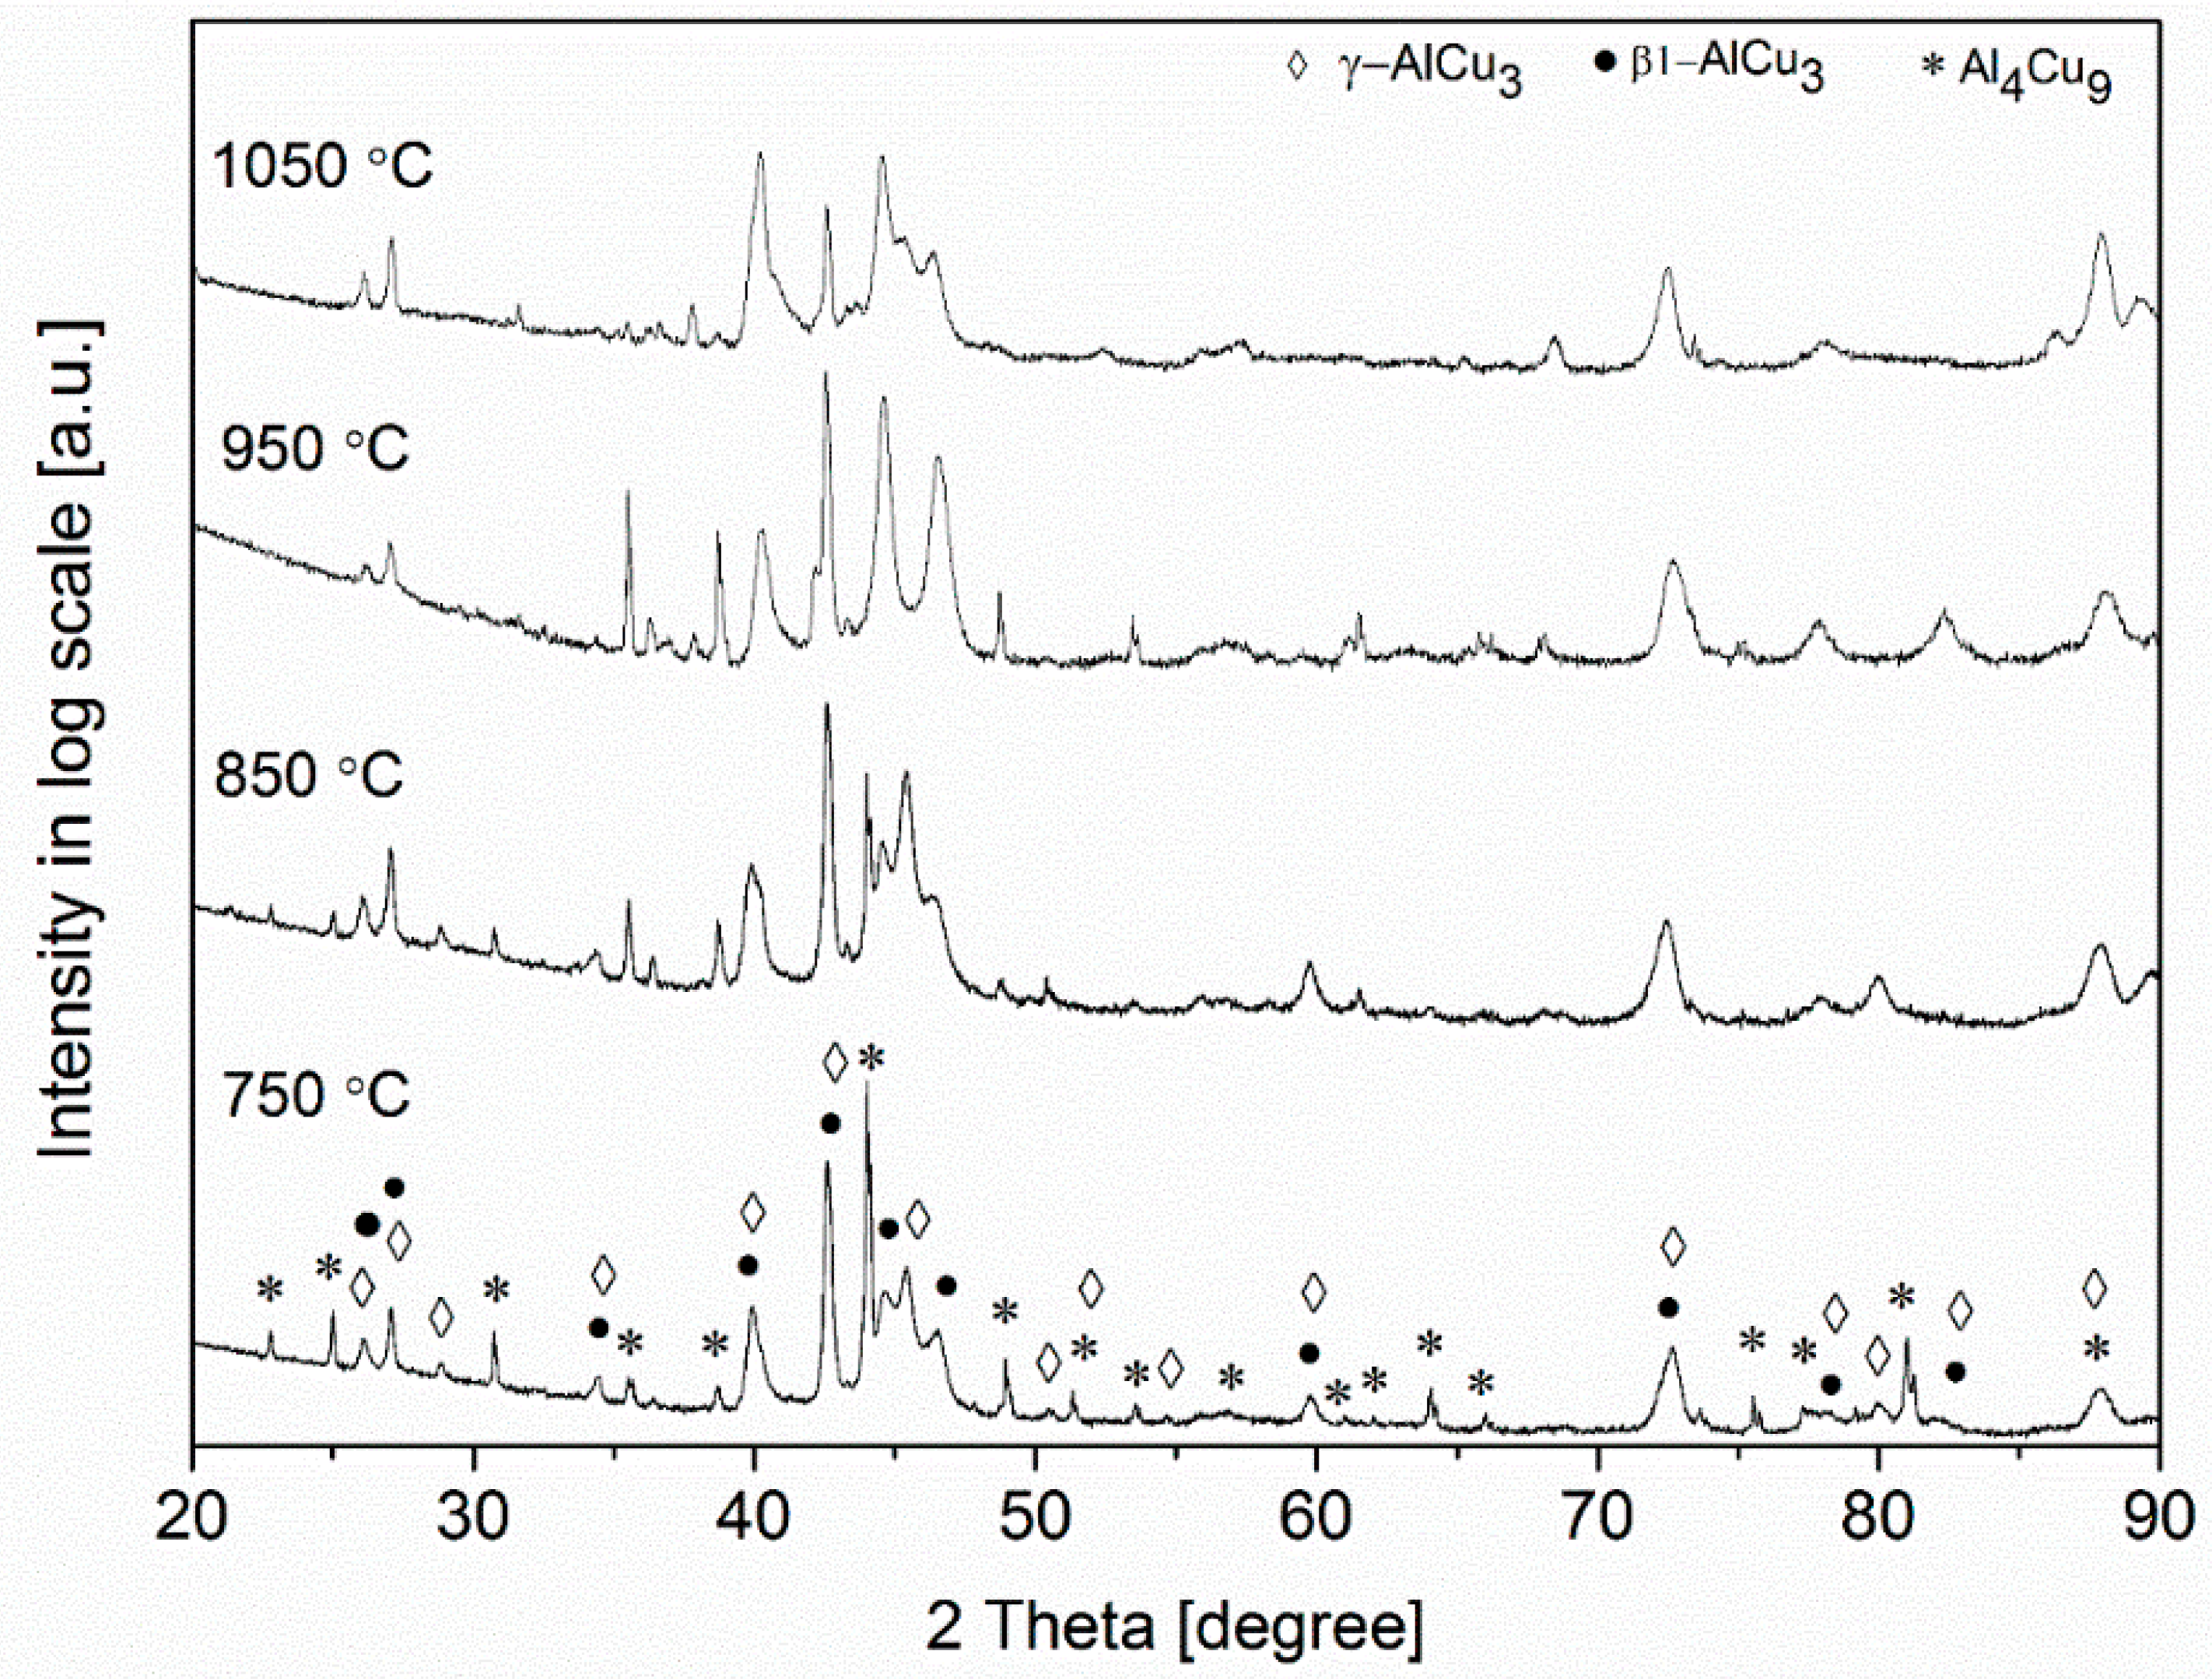
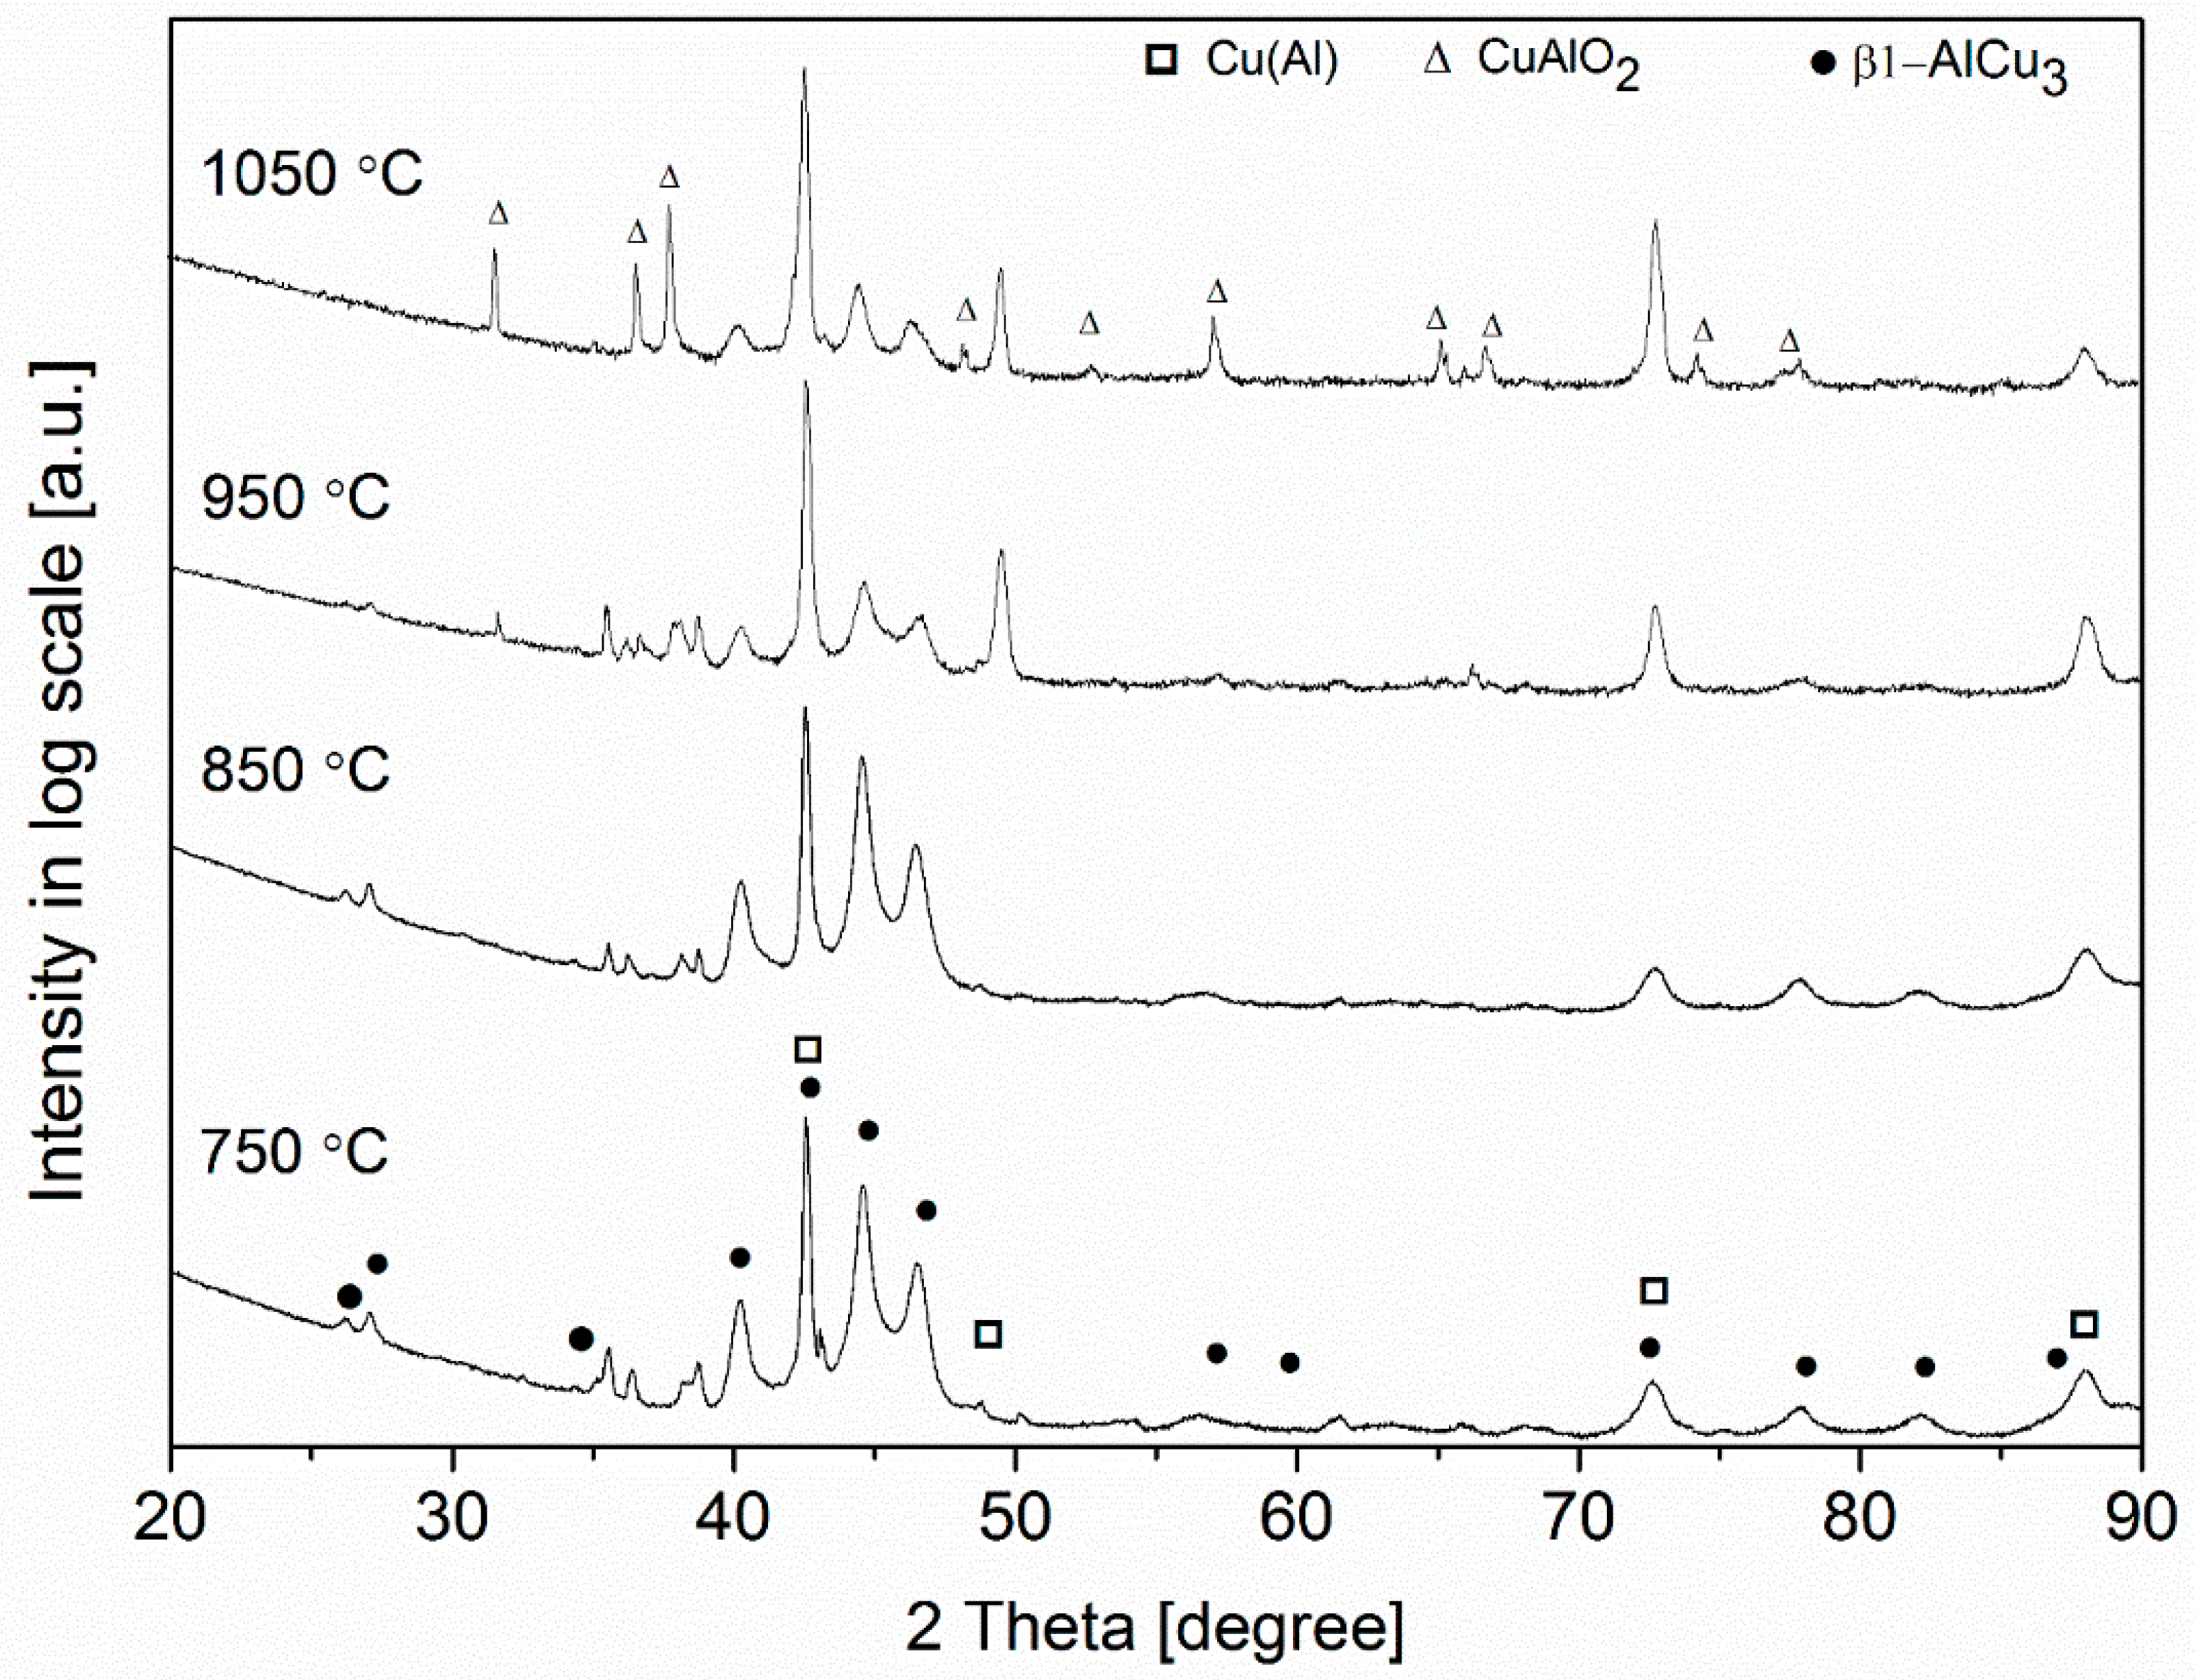
3.1.2. XRD Study of the Evolution of the Phase Composition during Annealing of the ARB-Processed Samples

The ARB-processed samples were heat treated at different temperatures for 60 min in order to induce the formation of the β-phase with good SME. In the selection of the annealing conditions, it was considered that Cu–based SMAs exhibit their shape memory features in the zone of the β-phase. The shape memory characteristics of these alloys depend mainly on the properties of the β-phase. During cooling of the β-phase from 565 °C, usually, an eutectoid decomposition of β → α + γ2 occurs. However, high cooling rates are able to prevent this phase from eutectoid decomposition and enable the martensitic transformation [39]. Thus, the authors decided to study the effect of annealing at different temperatures of 750, 850, 950, and 1050 °C for 60 min on the phase composition of the present ARB-processed Cu–Al–Ag materials. Since the number of ARB cycles has no considerable effect on the phase composition of the studied samples immediately after ARB (see Section 3.1.1), the annealing experiments were performed only for the specimens processed by nine cycles of ARB.
The phase composition for all the three silver contents changed during the annealing of the ARB samples as revealed by XRD. For the sample containing 1% Ag and processed by nine passes of ARB, the material transformed into a single phase simple cubic Al4Cu9 (PDF card number: 01-075-6862), irrespective of the annealing temperature, as shown in Figure 5. It should be noted, however, that the composition of the Al4Cu9 phase corresponds to an Al content of 31 at. % while the nominal Al content in the studied materials is only 23 at. % (11 wt.%). Therefore, a part of Al sites in the present Al4Cu9 simple cubic structure must be occupied by Cu atoms; i.e., the real composition of this phase most probably deviates from Al4Cu9. It is also worth noting that former studies have shown that the formation probability of the Al4Cu9 intermetallic compound depends on the Cu content as well as the time and temperature of annealing [40]. According to the equilibrium Cu–Al phase diagram, this phase forms between 360 and 570 °C for the Al content of 11 wt.%. At the temperatures of the present heat treatments (between 750 and 1050 °C), the stable phase is the β-phase. Therefore, the Al4Cu9 intermetallic compound most probably formed from the β-phase when the temperature fell below 570 °C during cooling even if the samples were quenched. Since Cu–based alloys with Al4Cu9 as a major phase do not show SME and exhibit a low ductility (i.e., they are very brittle), this material is not suitable for shape memory applications.
The phase compositions of the samples containing 2% Ag, processed by nine ARB passes, and subsequently annealed, are shown in Table 3. The corresponding XRD patterns are presented in Figure 6. It is revealed that the specimen heat treated at 950 °C for 60 min contains the highest fraction of the β1-AlCu3 phase (~82%). It has been reported [39] that in Cu–based SMAs with an Al content of 11 wt.% or more, the body-centered cubic (BCC) structure transformed to a DO3-type superlattice by transferring the β to an ordered β1-phase prior to martensitic transformation. In this case, the martensite “inherits” the ordered structure. When the Al content is between 11 and 13 wt.%, β′1 martensite having a monoclinic 18R1 structure prevails. When Al content exceeds 13 wt.%, orthorhombic 2H-type 𝛾′1 martensite forms. Our results suggest that the increase in Ag content from 1 to 2% stabilizes the β1-AlCu3 phase during cooling. This effect can be attributed to the reduced diffusion rate caused by the addition of a third alloying element such as Ag [39,41,42]. The slower diffusion can hinder the decomposition of the β1-phase during cooling. In addition, large Ag solute atoms or silver particles can hinder the motion of phase boundaries, thereby impeding the development of equilibrium phase composition during quenching. According to the Cu–Al phase diagram during the cooling of the β-phase below 564 °C, an eutectoid decomposition of β → α + γ2 or β → α + γ1 occurs [39]. Silva et al. [42] suggested that Ag addition hinders these reactions and promotes β → β1 ordering during cooling; therefore, the amount of the β1 phase increases in accordance with the results of the present study. It is noted that oxide phases also developed in the samples heat treated at very high temperatures (950 and 1050 °C), which can be explained by the high rate of oxidation at elevated temperatures.
For the specimens containing 3% Ag processed by nine passes of ARB and subsequently annealed at different temperatures, the phase composition obtained after annealing is listed in Table 4. The XRD patterns of these samples are shown in Figure 7. Table 4 reveals that β1-AlCu3 is the major phase for all studied annealing temperatures. It seems that with increasing Ag content, the main phase changed from Al4Cu9 to β1-AlCu3. The highest fraction of the β1 phase was obtained at 850 °C (~95%). For the samples A3–950–60 and A3–1050–60, an FCC Cu (Al) phase was also detected. For this phase, the lattice constant was about 0.3677 ± 0.0002 nm, which is much larger than that of pure Cu (0.3615 nm). The high lattice constant was most probably caused by the solute Al and Ag atoms, which have a higher size than that of Cu. Thus, it can be concluded that the optimal annealing temperatures for obtaining the highest fraction of the β1-AlCu3 phase are 950 and 850 °C for 2 and 3% Ag, respectively. Therefore, in the next section, the microstructure is investigated only for the samples annealed at 850 and 950 °C for both silver concentrations. It is worth mentioning that other researchers have also reported these temperatures as the optimum for processing Cu–Al–Ag SMAs by other methods than ARB [42].

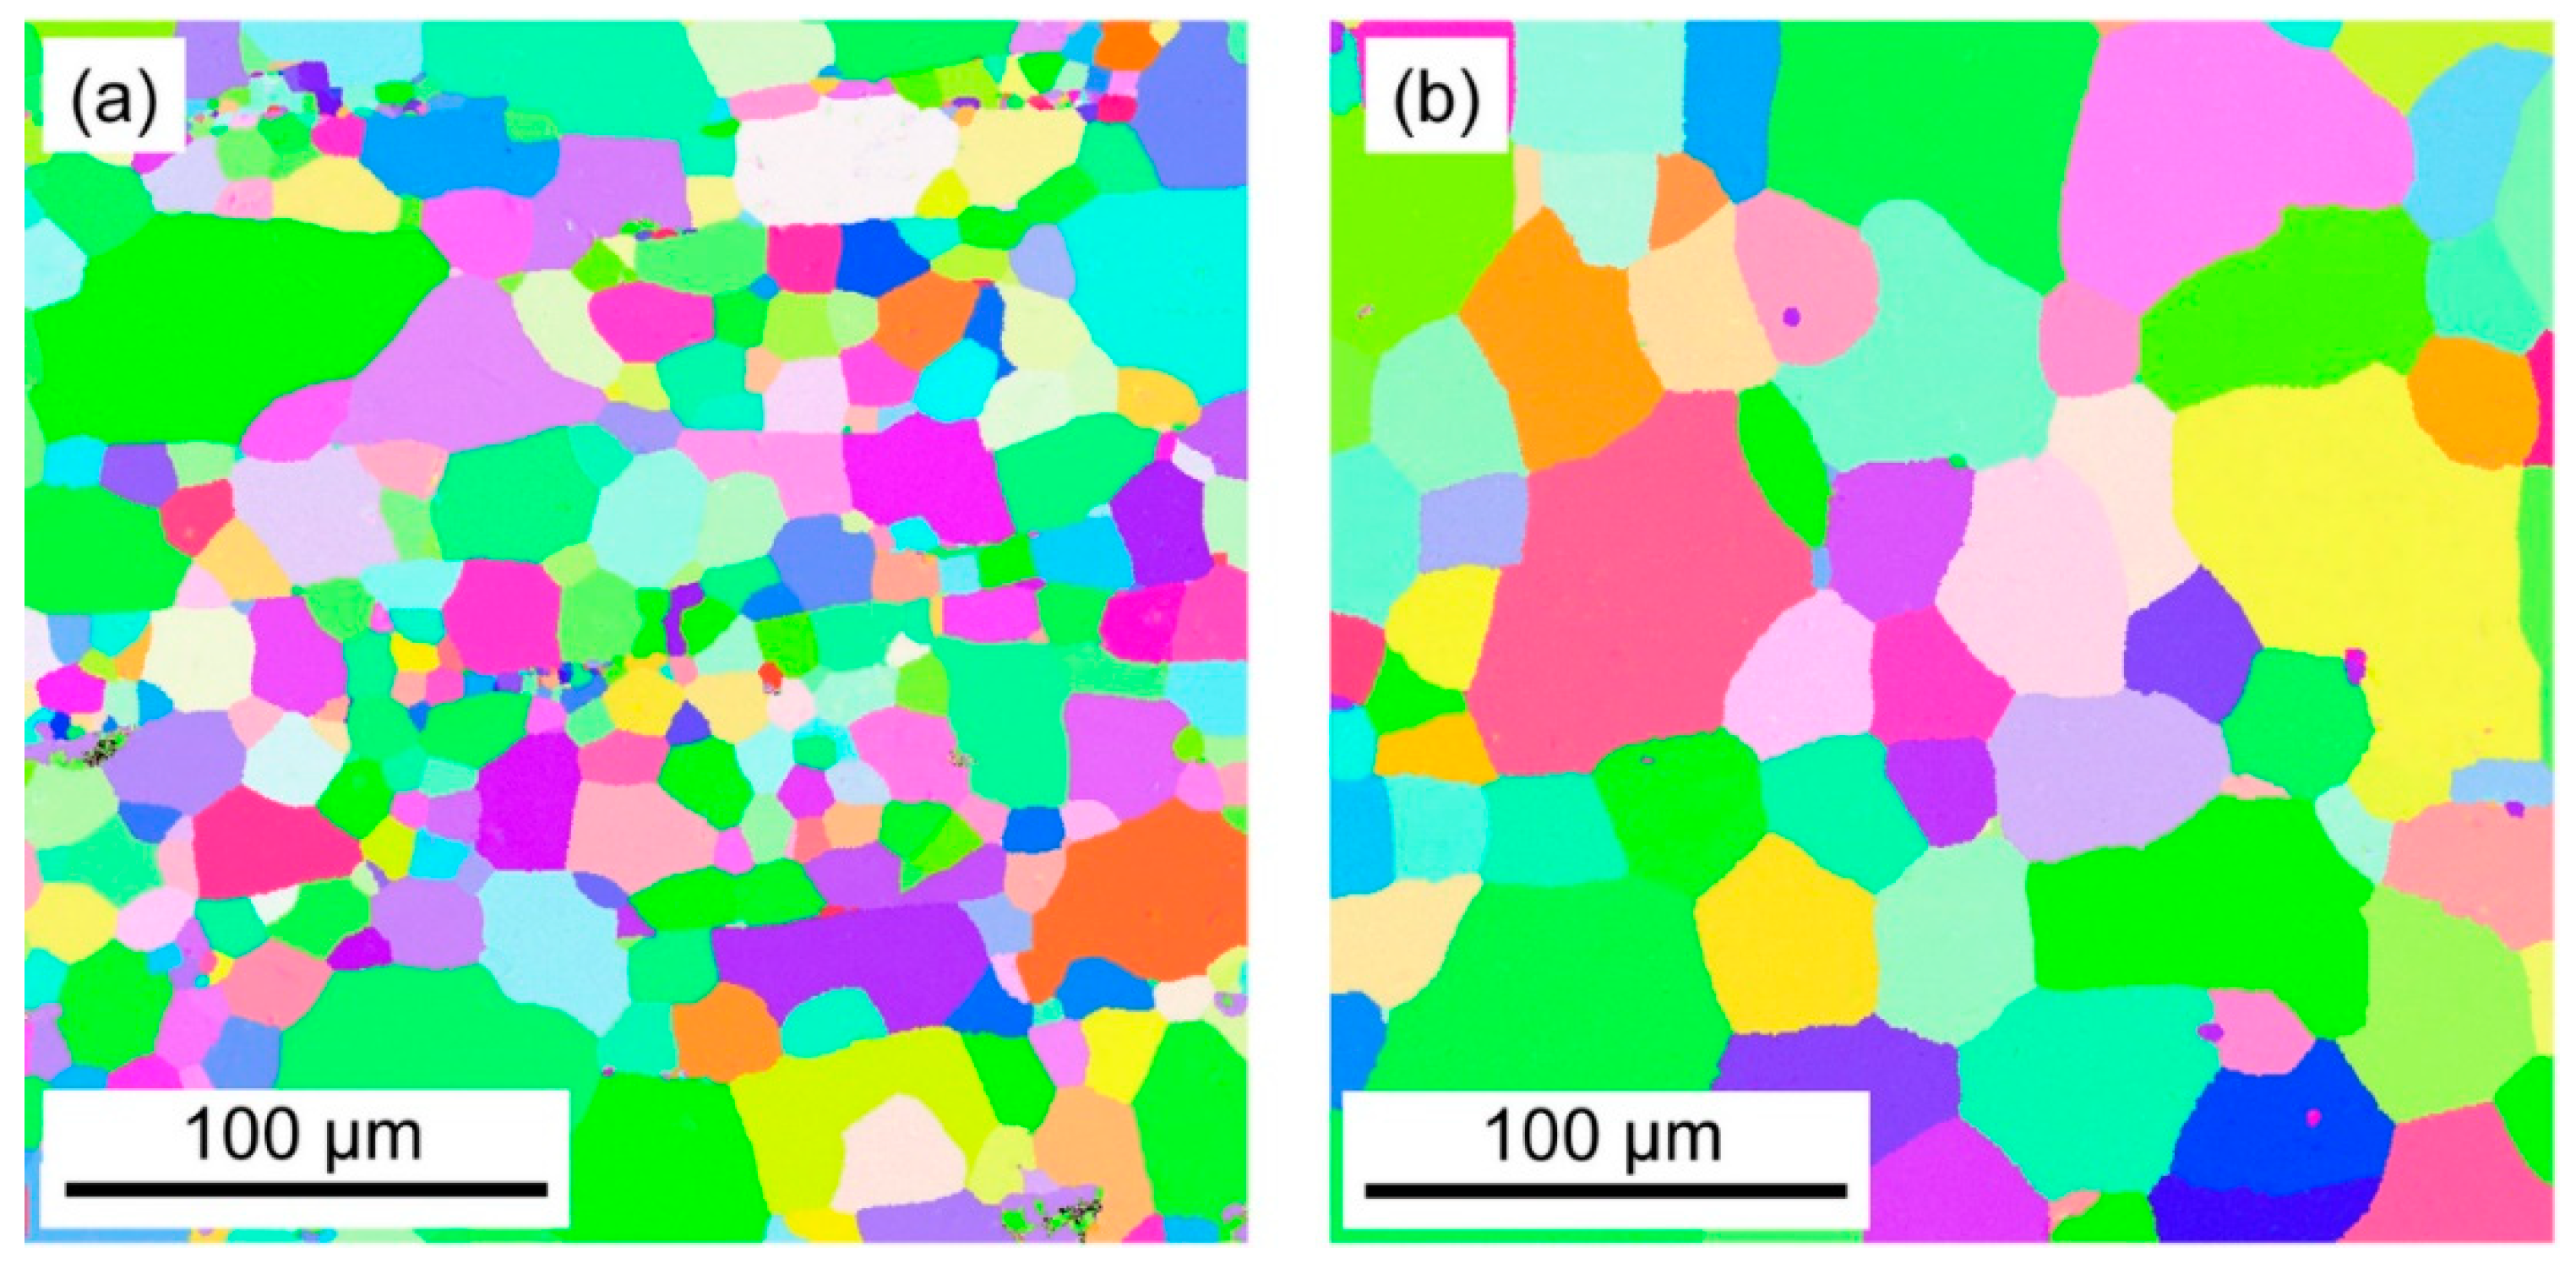
3.1.3. Microstructure Analysis of the Annealed Samples

Figure 8a,b show EBSD IPF maps for samples with 1 wt.% Ag annealed at 850 °C and 950 °C for 60 min and quenched in ice/water mixture, respectively. For both temperatures, the grain shape is rather equiaxial compared to the elongated morphology in the ARB-processed state (see Figure 3). These materials are single-phase simple cubic structures (Al4Cu9 type), which formed during cooling from the β-phase regime. By comparing Figure 8a,b, it can be concluded that the grain size was enhanced by increasing the annealing temperature. The average grain size was about 14 µm for sample A1–850–60, while it was about 30 µm for sample A1–950–60.
Figure 9a,b show EBSD IQ maps for the samples containing 2% Ag processed by nine ARB passes and then annealed at 850 and 950 °C for 60 min, respectively (samples A2–850–60 and A2–950–60). EBSD IPF color maps were not prepared for these specimens since they are multiphase materials and the β1-phase structure was not available in the database used by the indexing OIM software. Nevertheless, the IQ images are suitable for the determination of the size and morphology of grains. Namely, it can be seen that after quenching the samples below, the martensite finish temperature (Mf) spear/needle-like martensite is formed. It has been reported [43] that martensite is usually formed in two morphologies in Cu–based alloys: plates and thin needles. The martensite plates form as self-accommodation variant groups. The self-accommodation phenomenon is characterized by a zero apparent change in the shape of SMAs when they transform from the high-temperature austenite to the low-temperature martensite phase. During martensitic transformation, the crystalline lattice of the high-temperature phase (austenite) undergoes a shearing parallel to a particular crystallographic plane and with a shearing vector in a particular crystallographic direction [44]. The crystal variants of martensite have different potential orientations in which the shearing can be produced. For both samples, although the mean grain/packet size is tens of microns, the grains/packets contain lamellas with a thickness of about 3 and 1 µm for samples A2–850–60 and A2–950–60, respectively.
Figure 10 shows EDS elemental maps for alloy A2–950–60 exhibiting the highest β1-phase fraction among the annealed specimens with 2% Ag content. Considerable chemical inhomogeneities cannot be observed.
Figure 11a, b show EBSD IQ maps for the material containing 3% Ag, processed by nine passes of ARB and then annealed at 850 and 950 °C for 60 min, respectively (samples A3–850–60 and A3–950–60). It can be seen from Figure 11a that in specimen A3–850–60 the grain size is about 15 µm. These grains contain lamellas with a thickness of about 0.5 µm. From Figure 11b, it is obvious that the microstructure consists of martensite and the grain size increased to about 30 µm for sample A3–950–60 due to the increase in annealing temperature. The grains contain lamellas with a thickness between 0.1 and 0.7 µm. The lamellar microstructure inside the yellow square in Figure 11b is shown with a higher magnification in Figure 11c where a martensitic structure with different lamella sizes is visible.
Figure 12 shows SEM-EDS elemental maps for sample A3–850–60, which has the highest β1-phase fraction among the annealed specimens with 3% Ag content. Considerable chemical inhomogeneities were not detected.
As it can be seen from Figure 9 and Figure 11, the as-quenched structures for the alloys with 2 and 3 wt.% Ag are composed of a spear or needle-like grains of the β1-phase. This type of microstructure is commonly observed in as-quenched Cu-based SMAs [43]. There is a slight change in martensite needle size with increasing the Ag content from 2 to 3 wt.%, suggesting that nucleation and growth of the martensite phase are influenced by the alloying elements’ concentration [45]. For instance, Ag particles can reduce the mobility of interfaces during the growth of the newly nucleated β1-phase grains, resulting in a finer microstructure. In addition, the alloying elements may have an effect on the nucleation of the martensite phase since they influence the martensite transformation temperature. For example, it has been found that with increasing the concentration of Ti and Zr, the martensite transformation temperature decreased and increased, respectively [46]. The addition of Ag to Cu–Al alloys also influences the transformation temperature. Namely, Cu–Al–Ag SMAs exhibit higher transformation temperatures than other Cu–based alloys. It was also reported that with increasing silver content, the Ms temperature changed from 370 to 257 °C [23].
For 2 and 3% Ag concentrations, the samples heat treated at 950 and 850 °C, respectively, exhibit a compromise between high β1-phase content and low grain size. For higher temperatures (e.g., at 1050 °C), grain growth is expected to be more pronounced without increasing the amount of the β1-phase; i.e., annealing at this temperature is not beneficial for our goal (to obtain SMA with high strength). Therefore, in the study of the mechanical behavior, we focused on these optimal microstructures (i.e., samples A2–950–60 and A3–850–60).

3.2. Effect of Phase Composition and Microstructure on Mechanical Properties

3.2.1. Microhardness of the ARB-Processed and the Subsequently Annealed Samples

It is obvious that mechanical properties are structure sensitive [47]; thus, the number of ARB cycles and the heat treatment conditions should play an important role in the mechanical behavior of the studied samples. Table 5 shows the effect of ARB cycles on the Vickers microhardness of Cu–Al–Ag multilayered materials with different Ag contents. During the first cycle, the Cu and Al layers were completely separated in the samples; therefore, their microhardness values are reported individually in Table 5. Since the microhardness of Cu and Al layers did not depend on the Ag content, only a single hardness value is reported for each layer, which is valid for samples C11, C21, and C31. For five and nine cycles of ARB, the microhardness values in Table 5 characterize the whole sample. The data in Table 5 show that the microhardness increases with increasing the number of ARB cycles. Since the dislocation density saturated in the main Cu phase even after the first cycle as revealed by XLPA (see Table 2), the hardness increase is most probably caused by the refinement of the microstructure [48]. On the other hand, it is evident that the thickness of the elongated Cu and Al layers decreases gradually with increasing the number of ARB cycles (even if it was not monitored experimentally in the present study), and these interfaces are strong obstacles against dislocation motion; therefore, they considerably contribute to hardening. The Ag content has only a marginal effect on the hardness of the ARB-processed materials. Most probably, the Ag particles are located at the Cu/Al interfaces; therefore, besides the strengthening effect of interfaces, they have no significant contribution to the hardness.
Table 6 lists the microhardness values for the alloys with different Ag contents that were processed by nine cycles of ARB and then heat treated at 850 °C and 950 °C for 60 min. It is revealed that the microhardness was enhanced during the annealing of the ARB-processed samples due to the formation of hard phases such as Al4Cu9 and martensite. In addition, the martensite microstructure contains very fine lamellas (see Figure 11c), which also contributes to hardening. Although, it has been reported that the addition of Ag to the Cu–Al binary alloys increases their microhardness by influencing the nucleation rate and the activation energy of the eutectoid decomposition reaction [49], in the present study this effect is marginal compared to other hardening contributions (e.g., grain size).

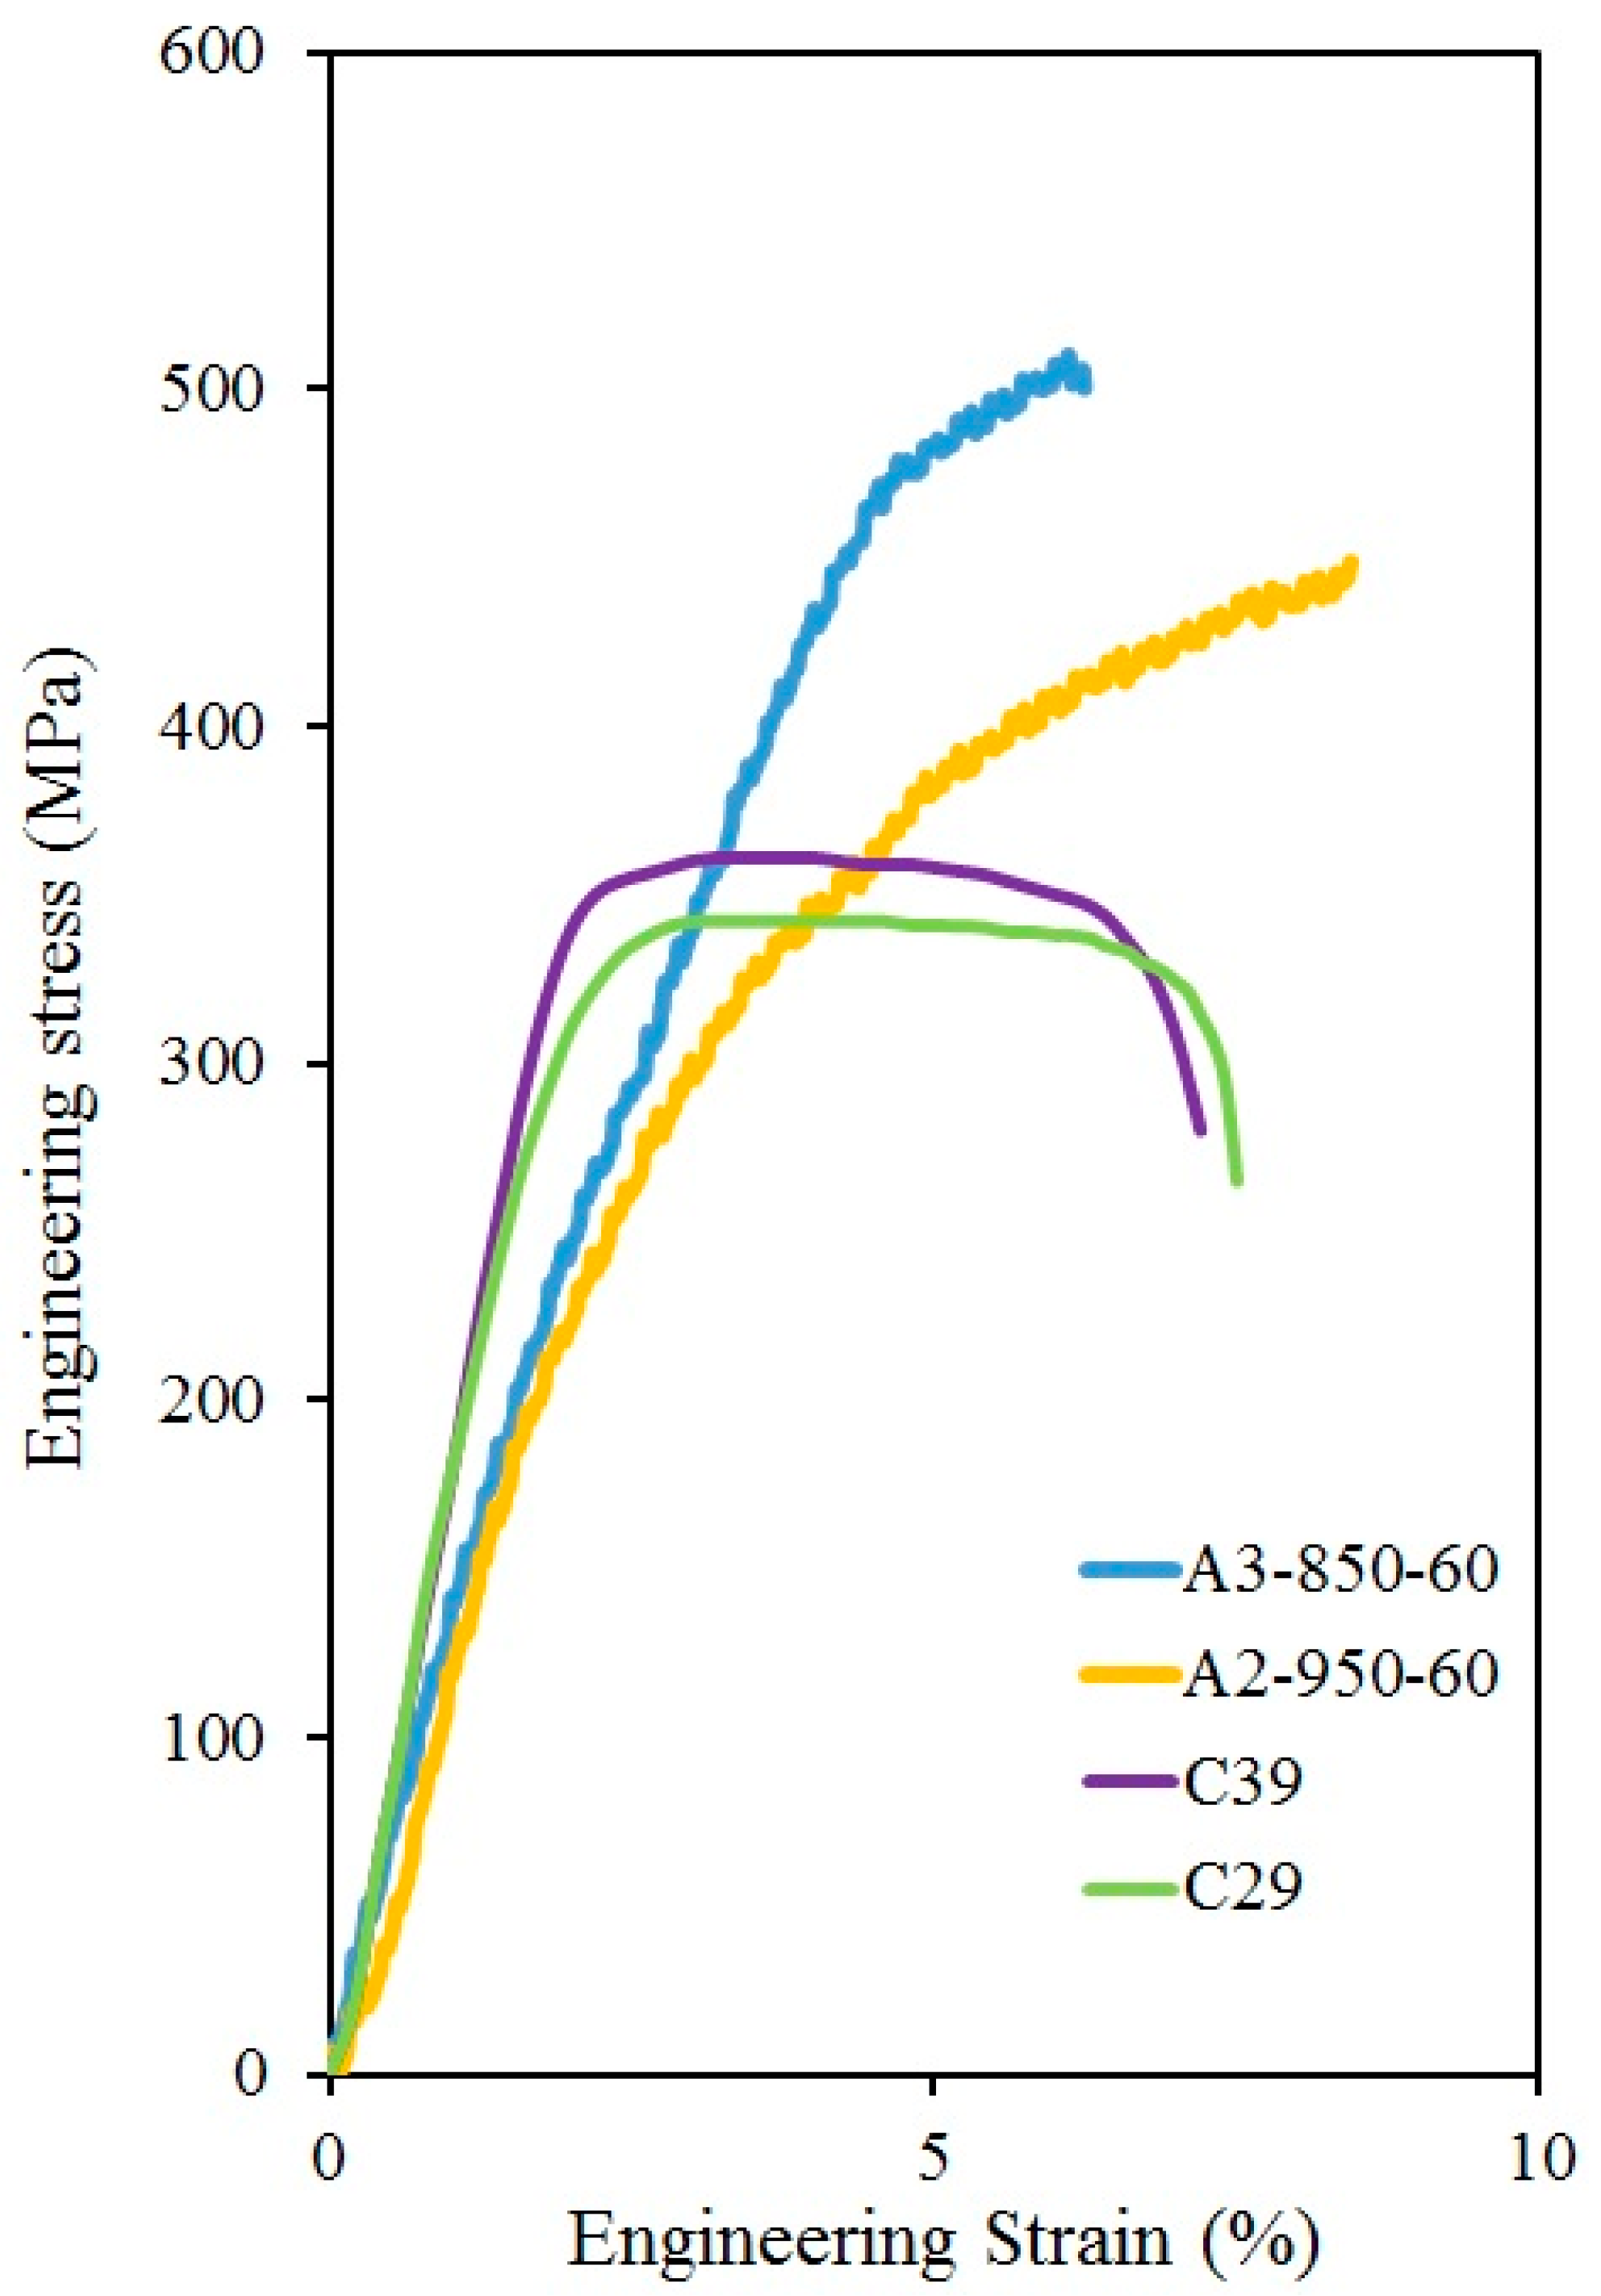
3.2.2. Tensile Testing

The tensile behavior of the materials containing 1 wt.% Ag was not studied since after annealing the samples became very brittle due to the formation of the Al4Cu9 phase; therefore, a reasonable stress–strain curve cannot be detected. Figure 13 shows the engineering stress–strain curves for the samples containing 2 and 3 wt.% Ag. The ultimate tensile strength of the ARB-processed multilayered samples was close to each other: ~340 and ~360 MPa for specimens C29 and C39, respectively. The elevated tensile strength is a consequence of different hardening effects, such as dislocations formed during ARB, grain refinement, and strong interfaces between the layers [33,50]. Another phenomenon that influences the tensile strength of the multilayered ARB-processed samples is the strain incompatibility. As a result of the co-existence of Cu and Al layers with different mechanical properties (elastic modulus, yield strength, etc.), a strain incompatibility phenomenon occurs between the constituents during ARB. Due to this effect, strain gradients and geometrically necessary dislocations near the interfaces can develop, resulting in an additional back-stress hardening [33,51].
As it can be seen from Figure 13, the heat treatment at 950 °C for 60 min yielded an increase in the tensile strength for the samples containing 2 wt.% Ag and ARB-processed for nine cycles. For sample A2–950–60, the strength reached a value as high as ~460 MPa with a good ductility (about 9%). For sample with 3 wt.% Ag, a similar increase in tensile strength occurred at 850 °C. The strength of sample A3–850–60 is even higher (~520 MPa) than that for specimen A2–950–60. The improvement of the tensile strength due to annealing can be explained by the formation of a hard martensite phase with fine microstructure as discussed in Section 3.1. Former studies have also reported improvement in tensile behavior of Cu alloys with decreasing grain size [52,53]. Indeed, Cu–based SMAs with coarse grains are not appropriate for commercial applications [54,55,56]. The grain refinement in Cu–Al SMAs can be achieved by increasing the Al content or adding other alloying elements [57,58]. The solute atoms and the secondary phase particles can hinder the interface motion, thereby stabilizing the martensite phase exhibiting good SME [59]. It is also worth noting that the fine-grained microstructure developed during ARB had both direct and indirect effects on the microstructure and the mechanical properties of the studied Cu–Al–Ag alloys. First, this microstructure yielded a higher strength in comparison with the counterparts processed by casting [60] due to the Hall–Petch strengthening effect caused by the low grain size [61]. In addition, dislocations and grain boundaries in the ARB-processed samples are fast diffusion paths, which facilitate the formation of the martensite phase during annealing. Thus, the annealing time can be shortened, thereby minimizing the grain growth during the heat treatment (the effect of annealing time on the microstructure was not studied here). Moreover, dislocations and grain boundaries are preferred sites for nucleation of new phases during phase transformation; therefore, their high amount in the ARB-processed samples can yield a finer martensite microstructure.

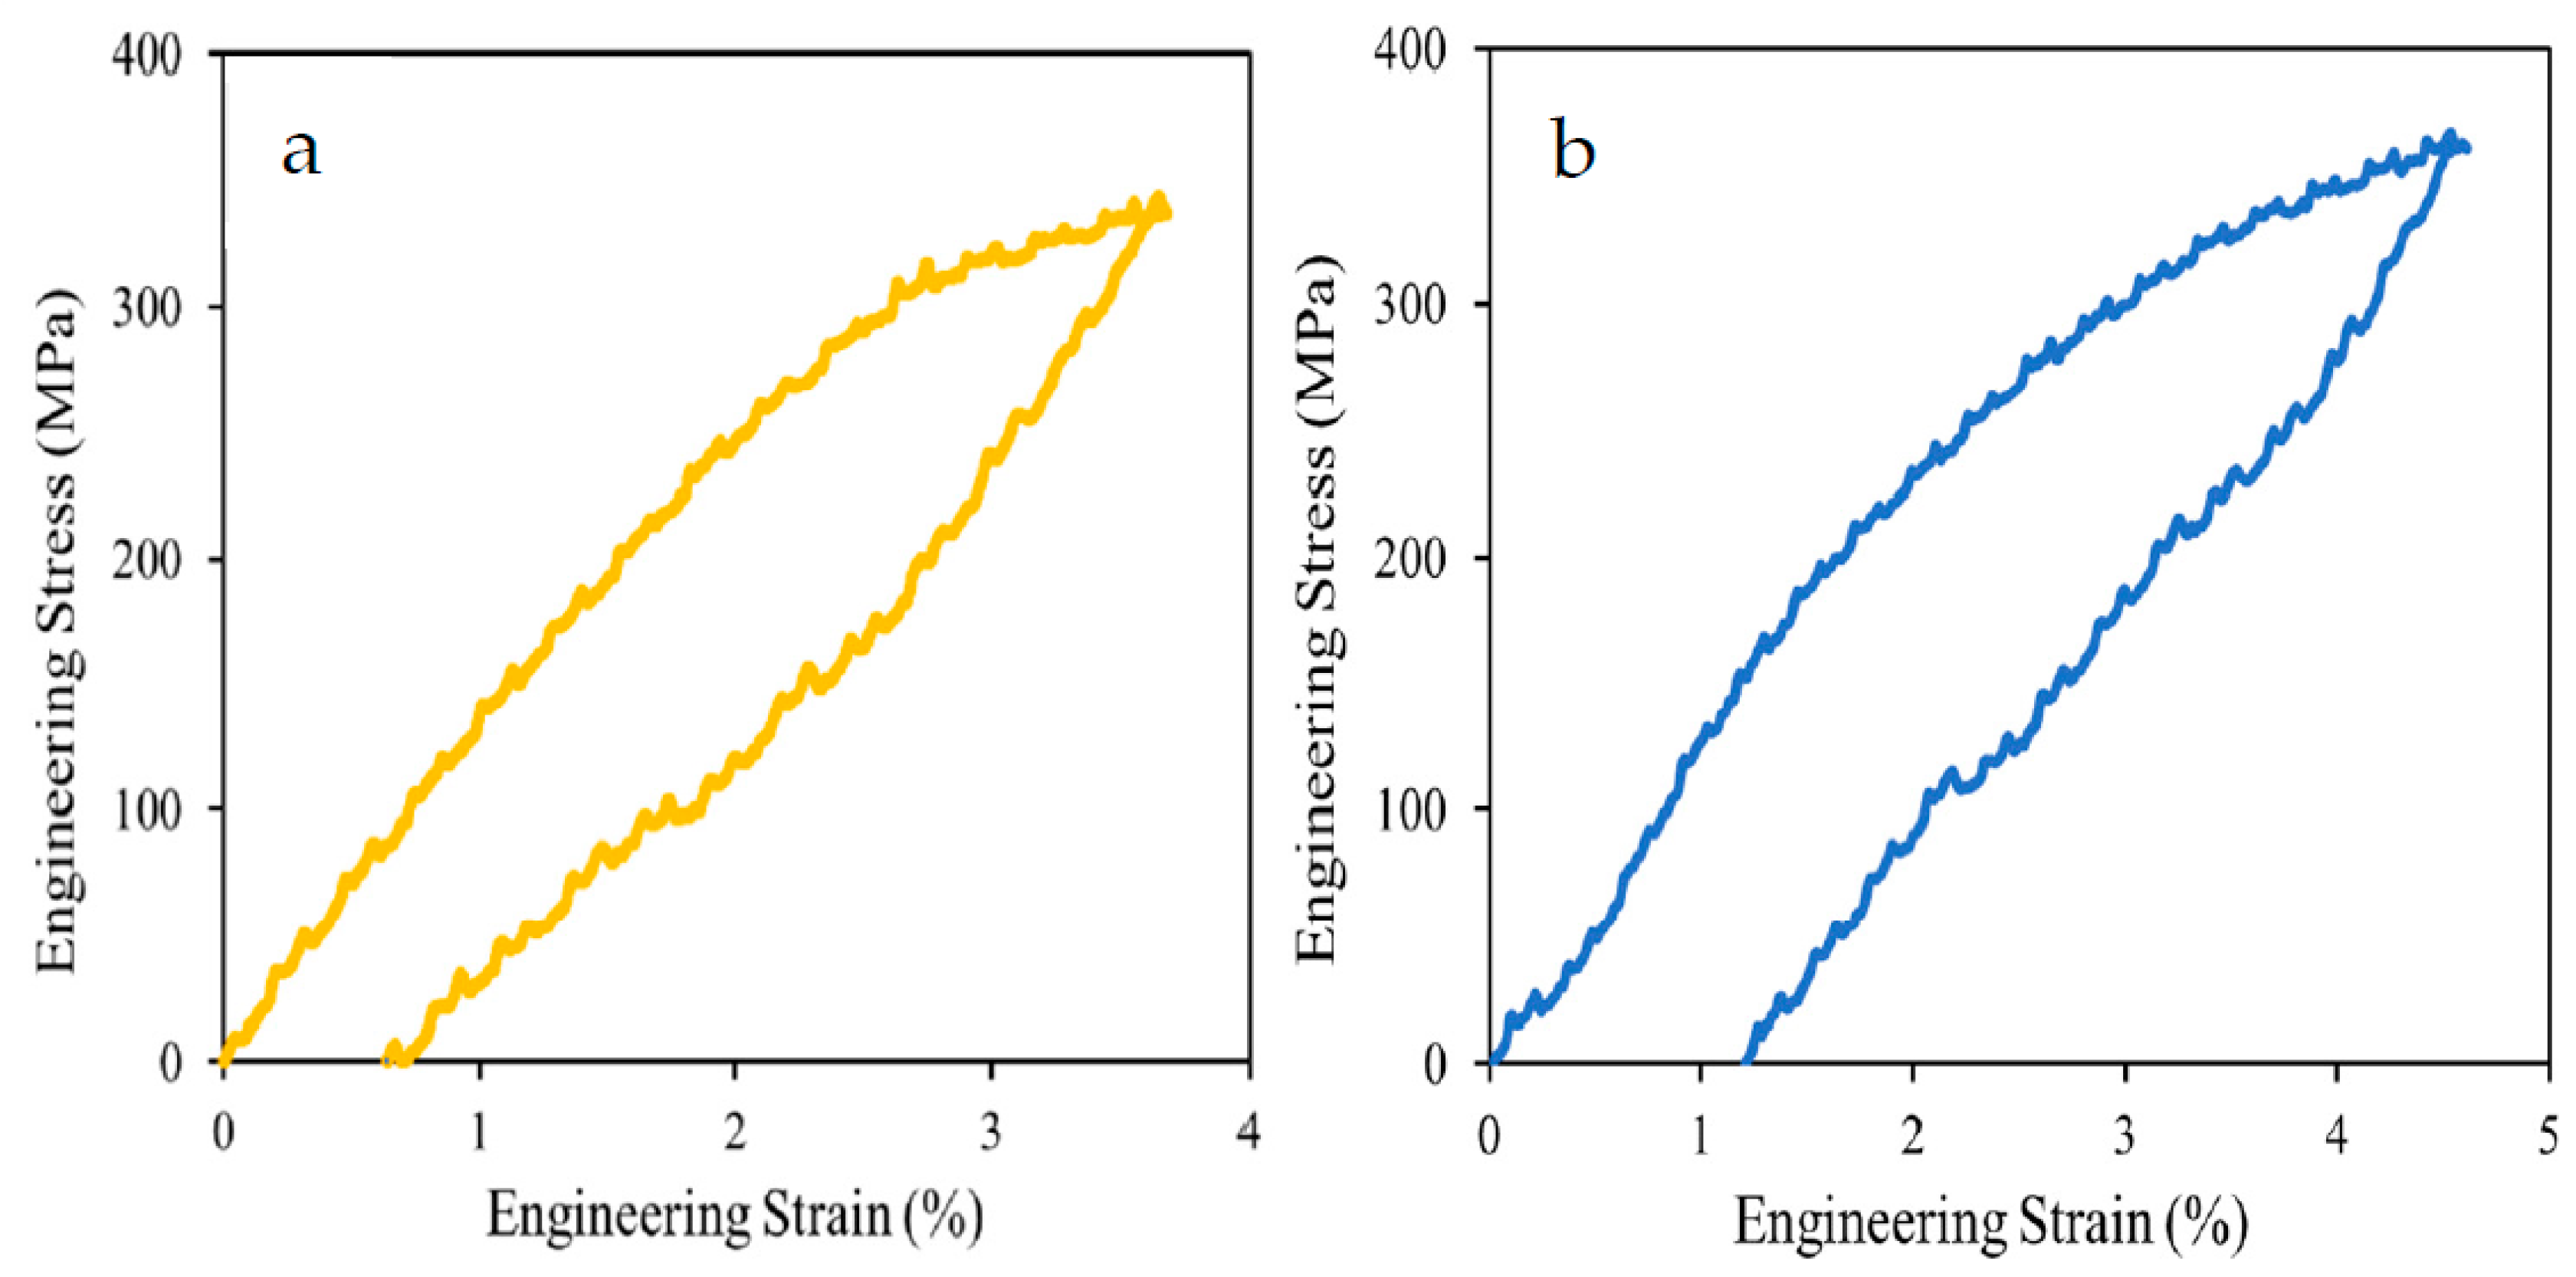
3.2.3. Shape Memory Behavior of the Alloys Containing a High Fraction of the β-Phase

The shape memory behavior of the specimens containing the highest fraction of the β1-phase (i.e., for specimens A2–950–60 and A3–850–60) was characterized by the magnitude of the strain recovered during unloading of the samples tensile tested for small plastic strains (about 1%). Figure 14a, b shows the loading–unloading tensile stress–strain curves for the annealed alloys A2–950–60 and A3–850–60. According to Figure 14a, the retained plastic strain and the recovered strain for sample A2–950–60 were 0.7% and 3.0%, respectively. For sample A3–850–60, the values of retained and recovered strains were 1.2% and 3.4%, respectively. The high recovered strains for both samples can be attributed to the large β1-phase fraction (82–95% as shown in Table 3 and Table 4). The slightly better shape memory behavior for sample A3–850–60 can be explained by the higher amount of the β1-phase. These two alloys showed a better SME than other Cu–based SMAs. For instance, it has been reported that Cu–Al–Ni SMAs have lower flow stress (~200 MPa) and recovered strain (~1.5%) values after being treated for SME [39]. The strength of Cu–Al–Ni SMAs was improved to about 400 MPa with the addition of 0.4 wt.% Ti; however, the recovered strain remained only ~1.5% [39]. The strength and the recovered strain obtained for a Cu–Al–Mn SMA with the composition of Cu72Al17Mn11 [19] were lower than the values determined for the present ARB-processed and annealed Cu–Al–Ag sample with 3 wt.% Ag (sample A3–850–60). It was tried to improve both the strength and the recovered strain of a Cu–Al–Mn SMA by adding more Mn alloying elements, but they could not improve both properties simultaneously. For example, the alloy (Cu72Al17Mn11)99.8–B0.2 showed a strength of about 400 MPa; however, the recovered strain was only about 1%. On the other hand, the addition of a small amount of Co to Cu–Al–Mn SMA (yielding the composition of (Cu72.5Al17Mn10.5)99.5–Co0.5) increased the recovered strain to about 7%, but the strength decreased to ~150 MPa simultaneously.

4. Conclusions

Experiments were conducted for the study of the microstructure and mechanical behavior of Cu–11 wt.% Al–x wt.% Ag (x = 1, 2, or 3) SMAs processed by ARB and subsequent annealing at different temperatures. The following conclusions were drawn from the results:
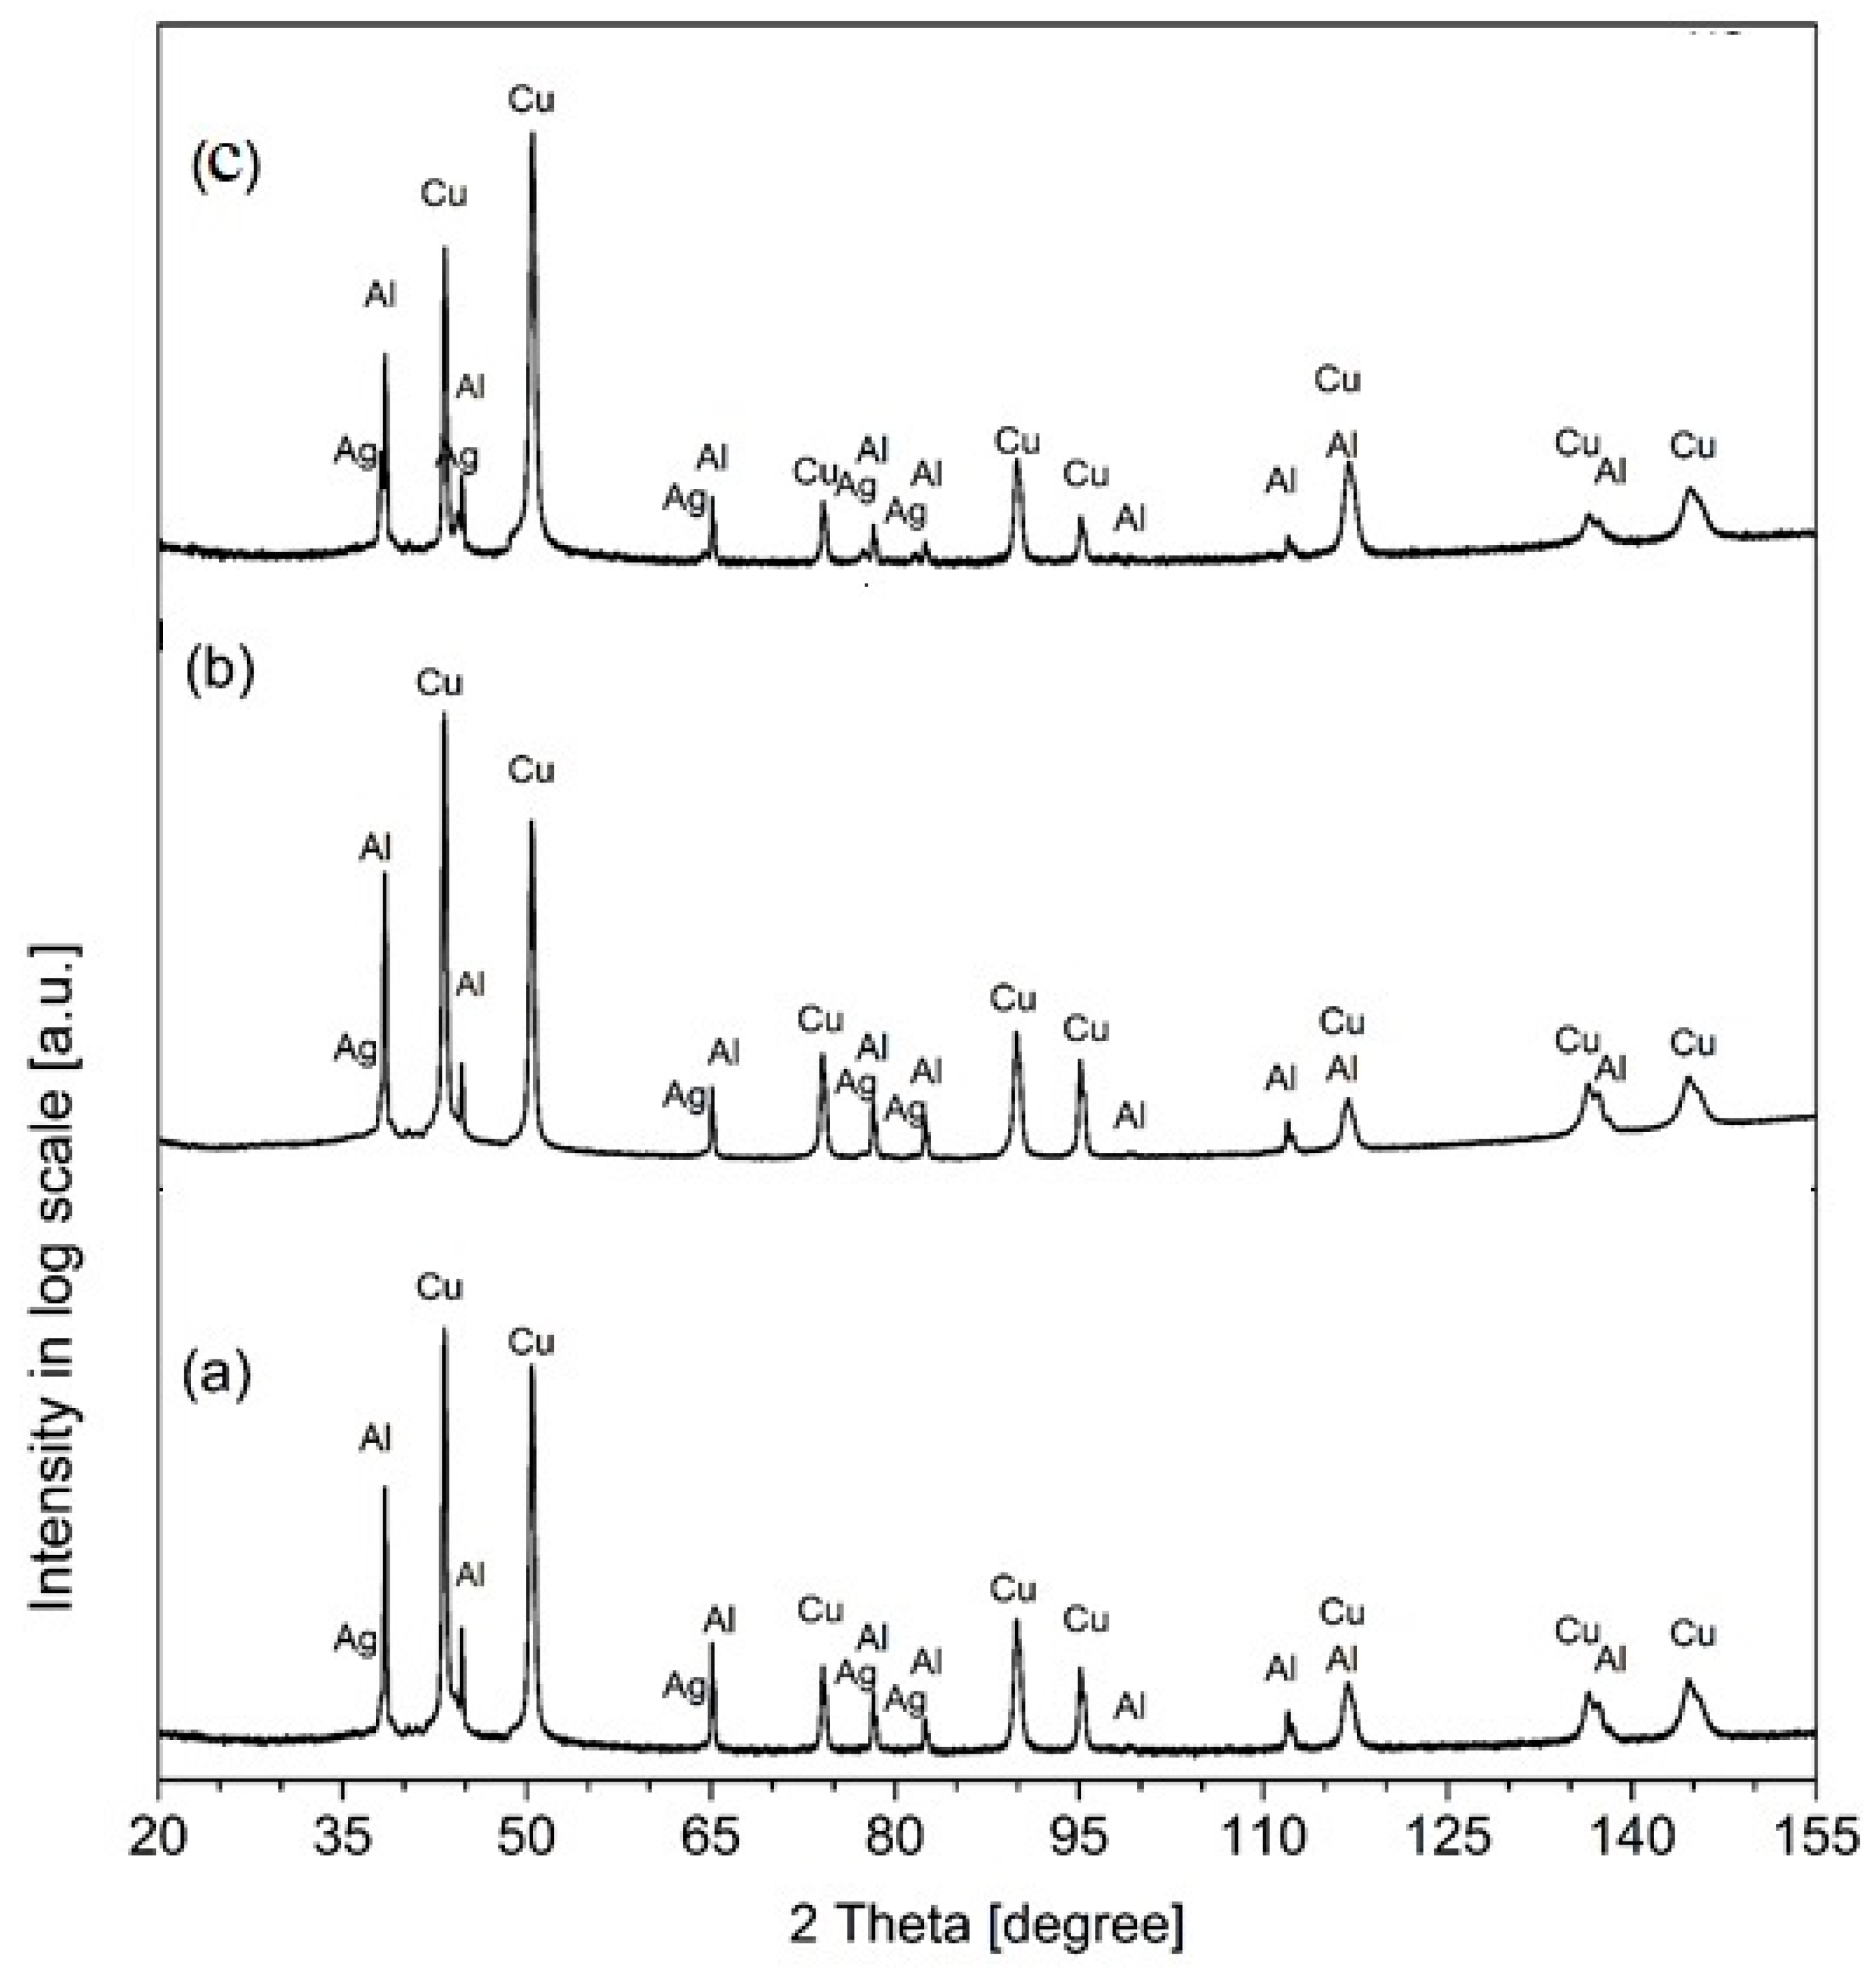
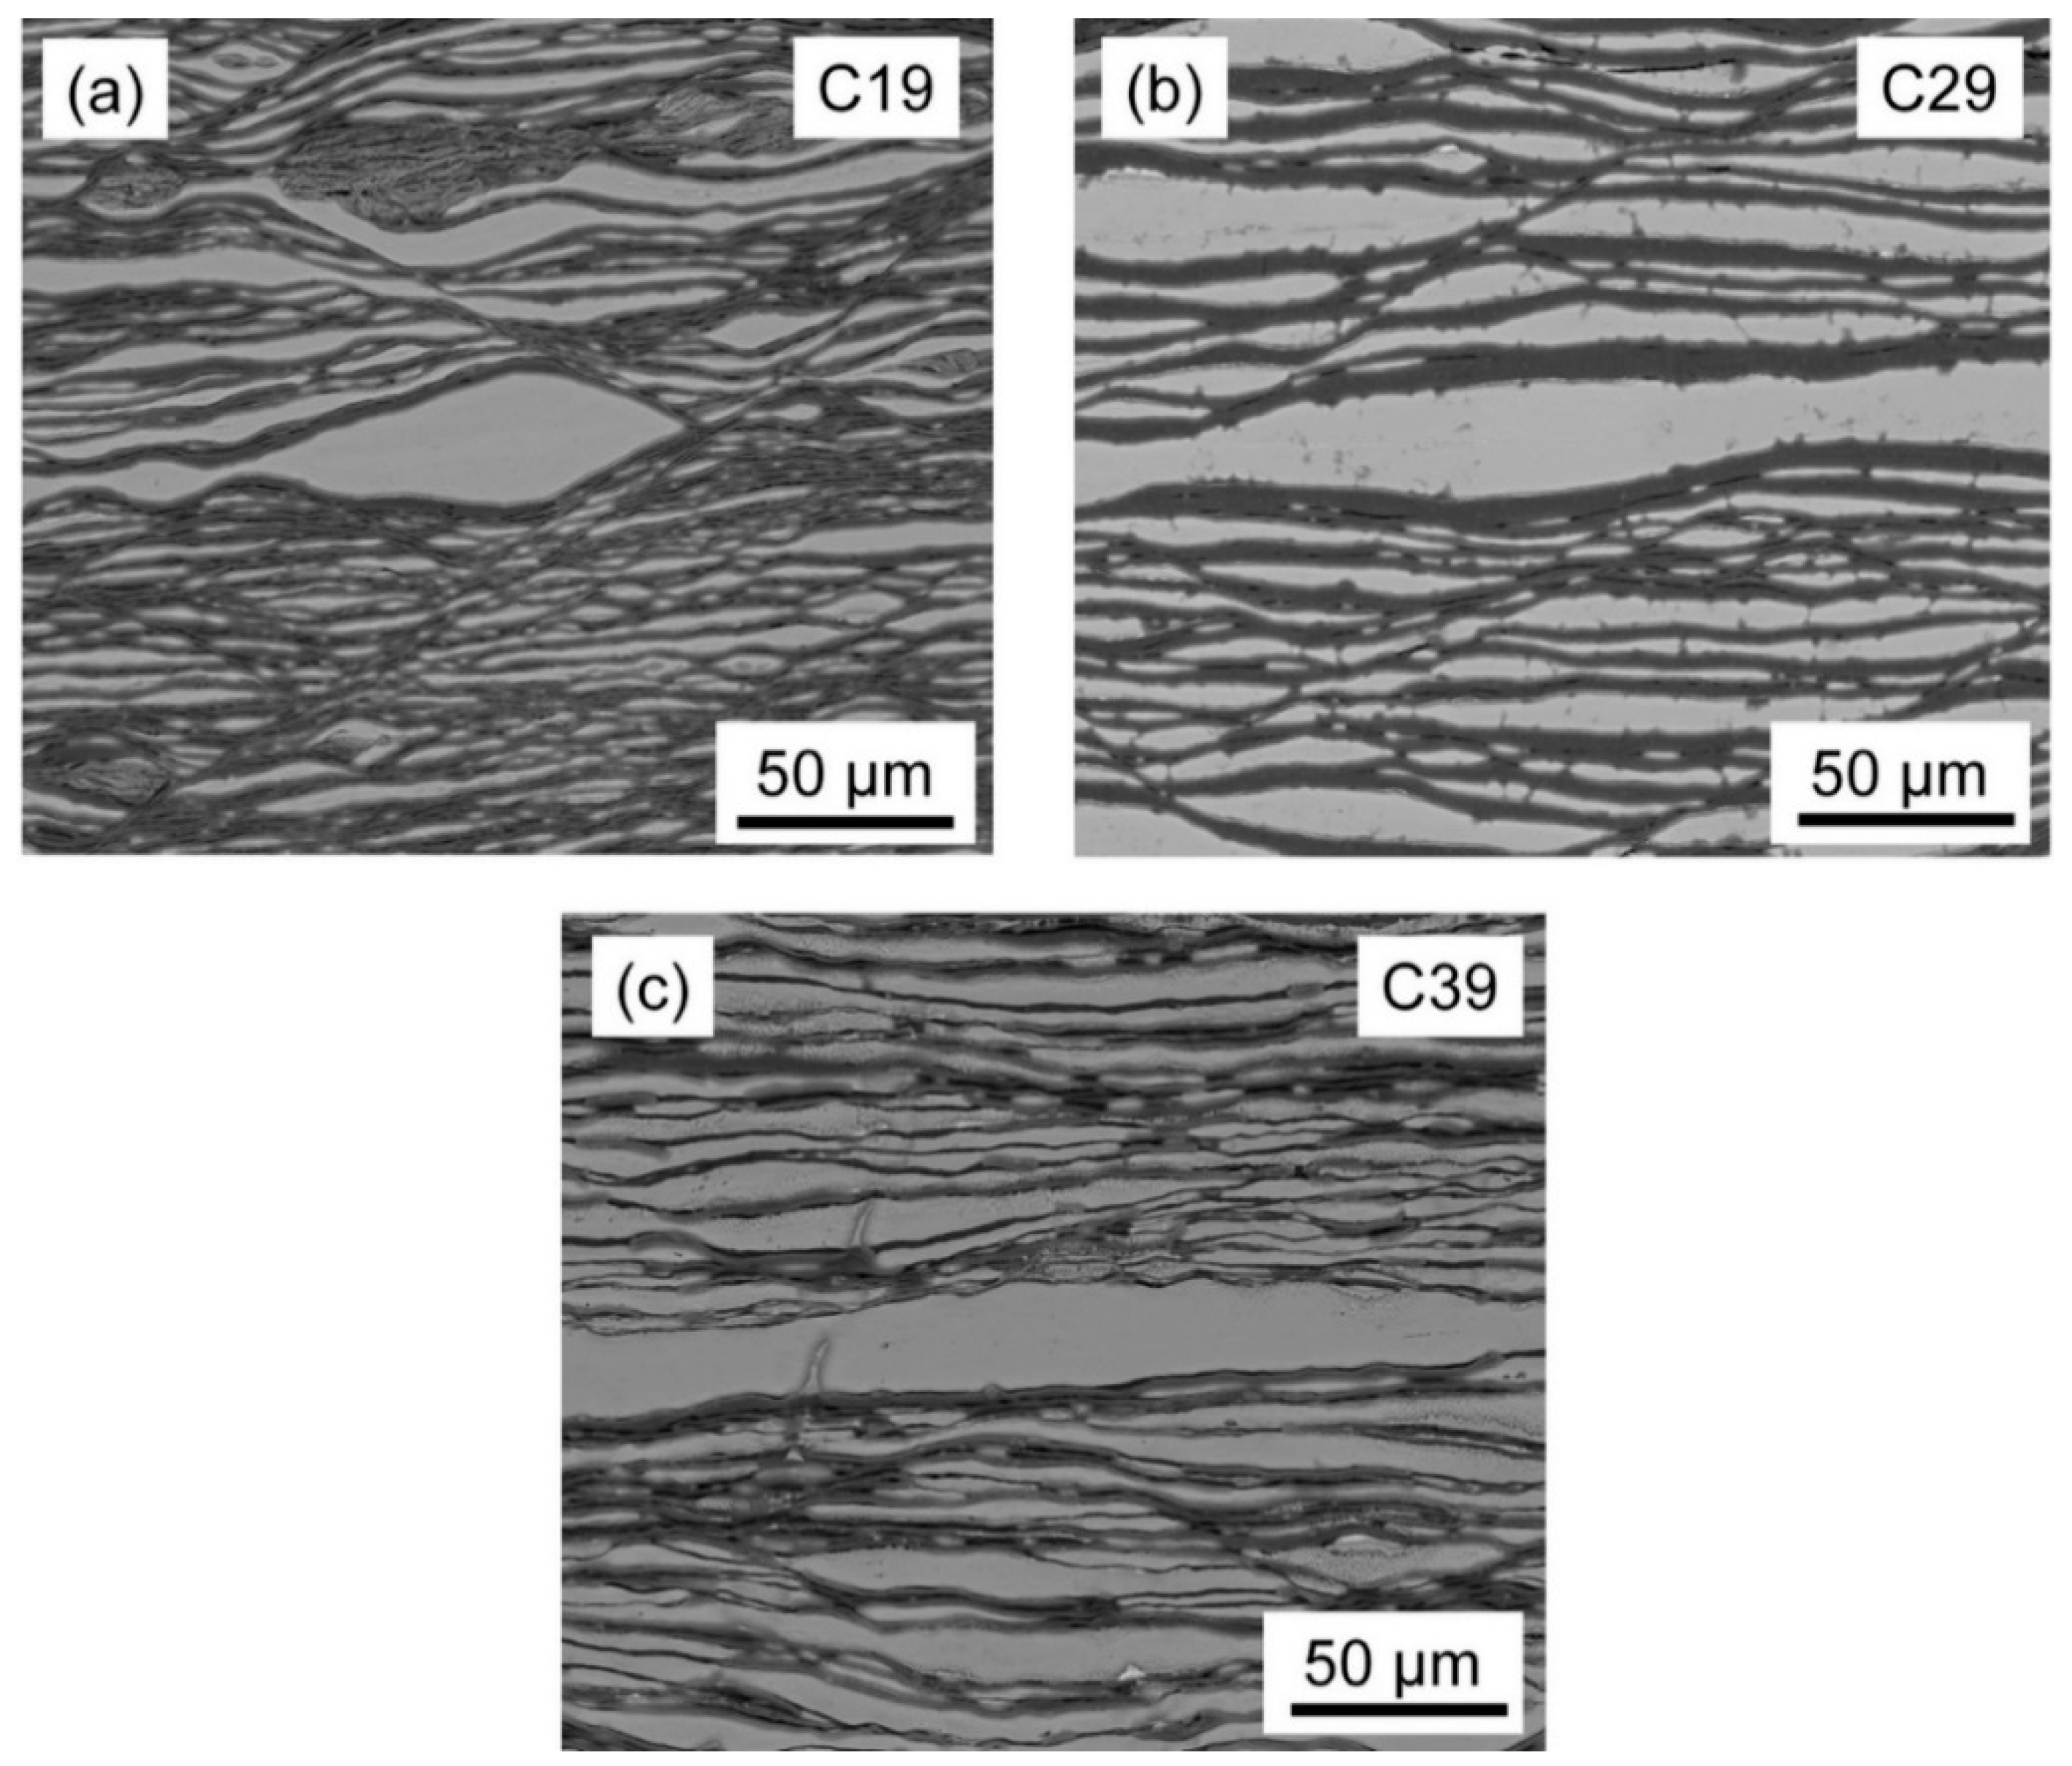
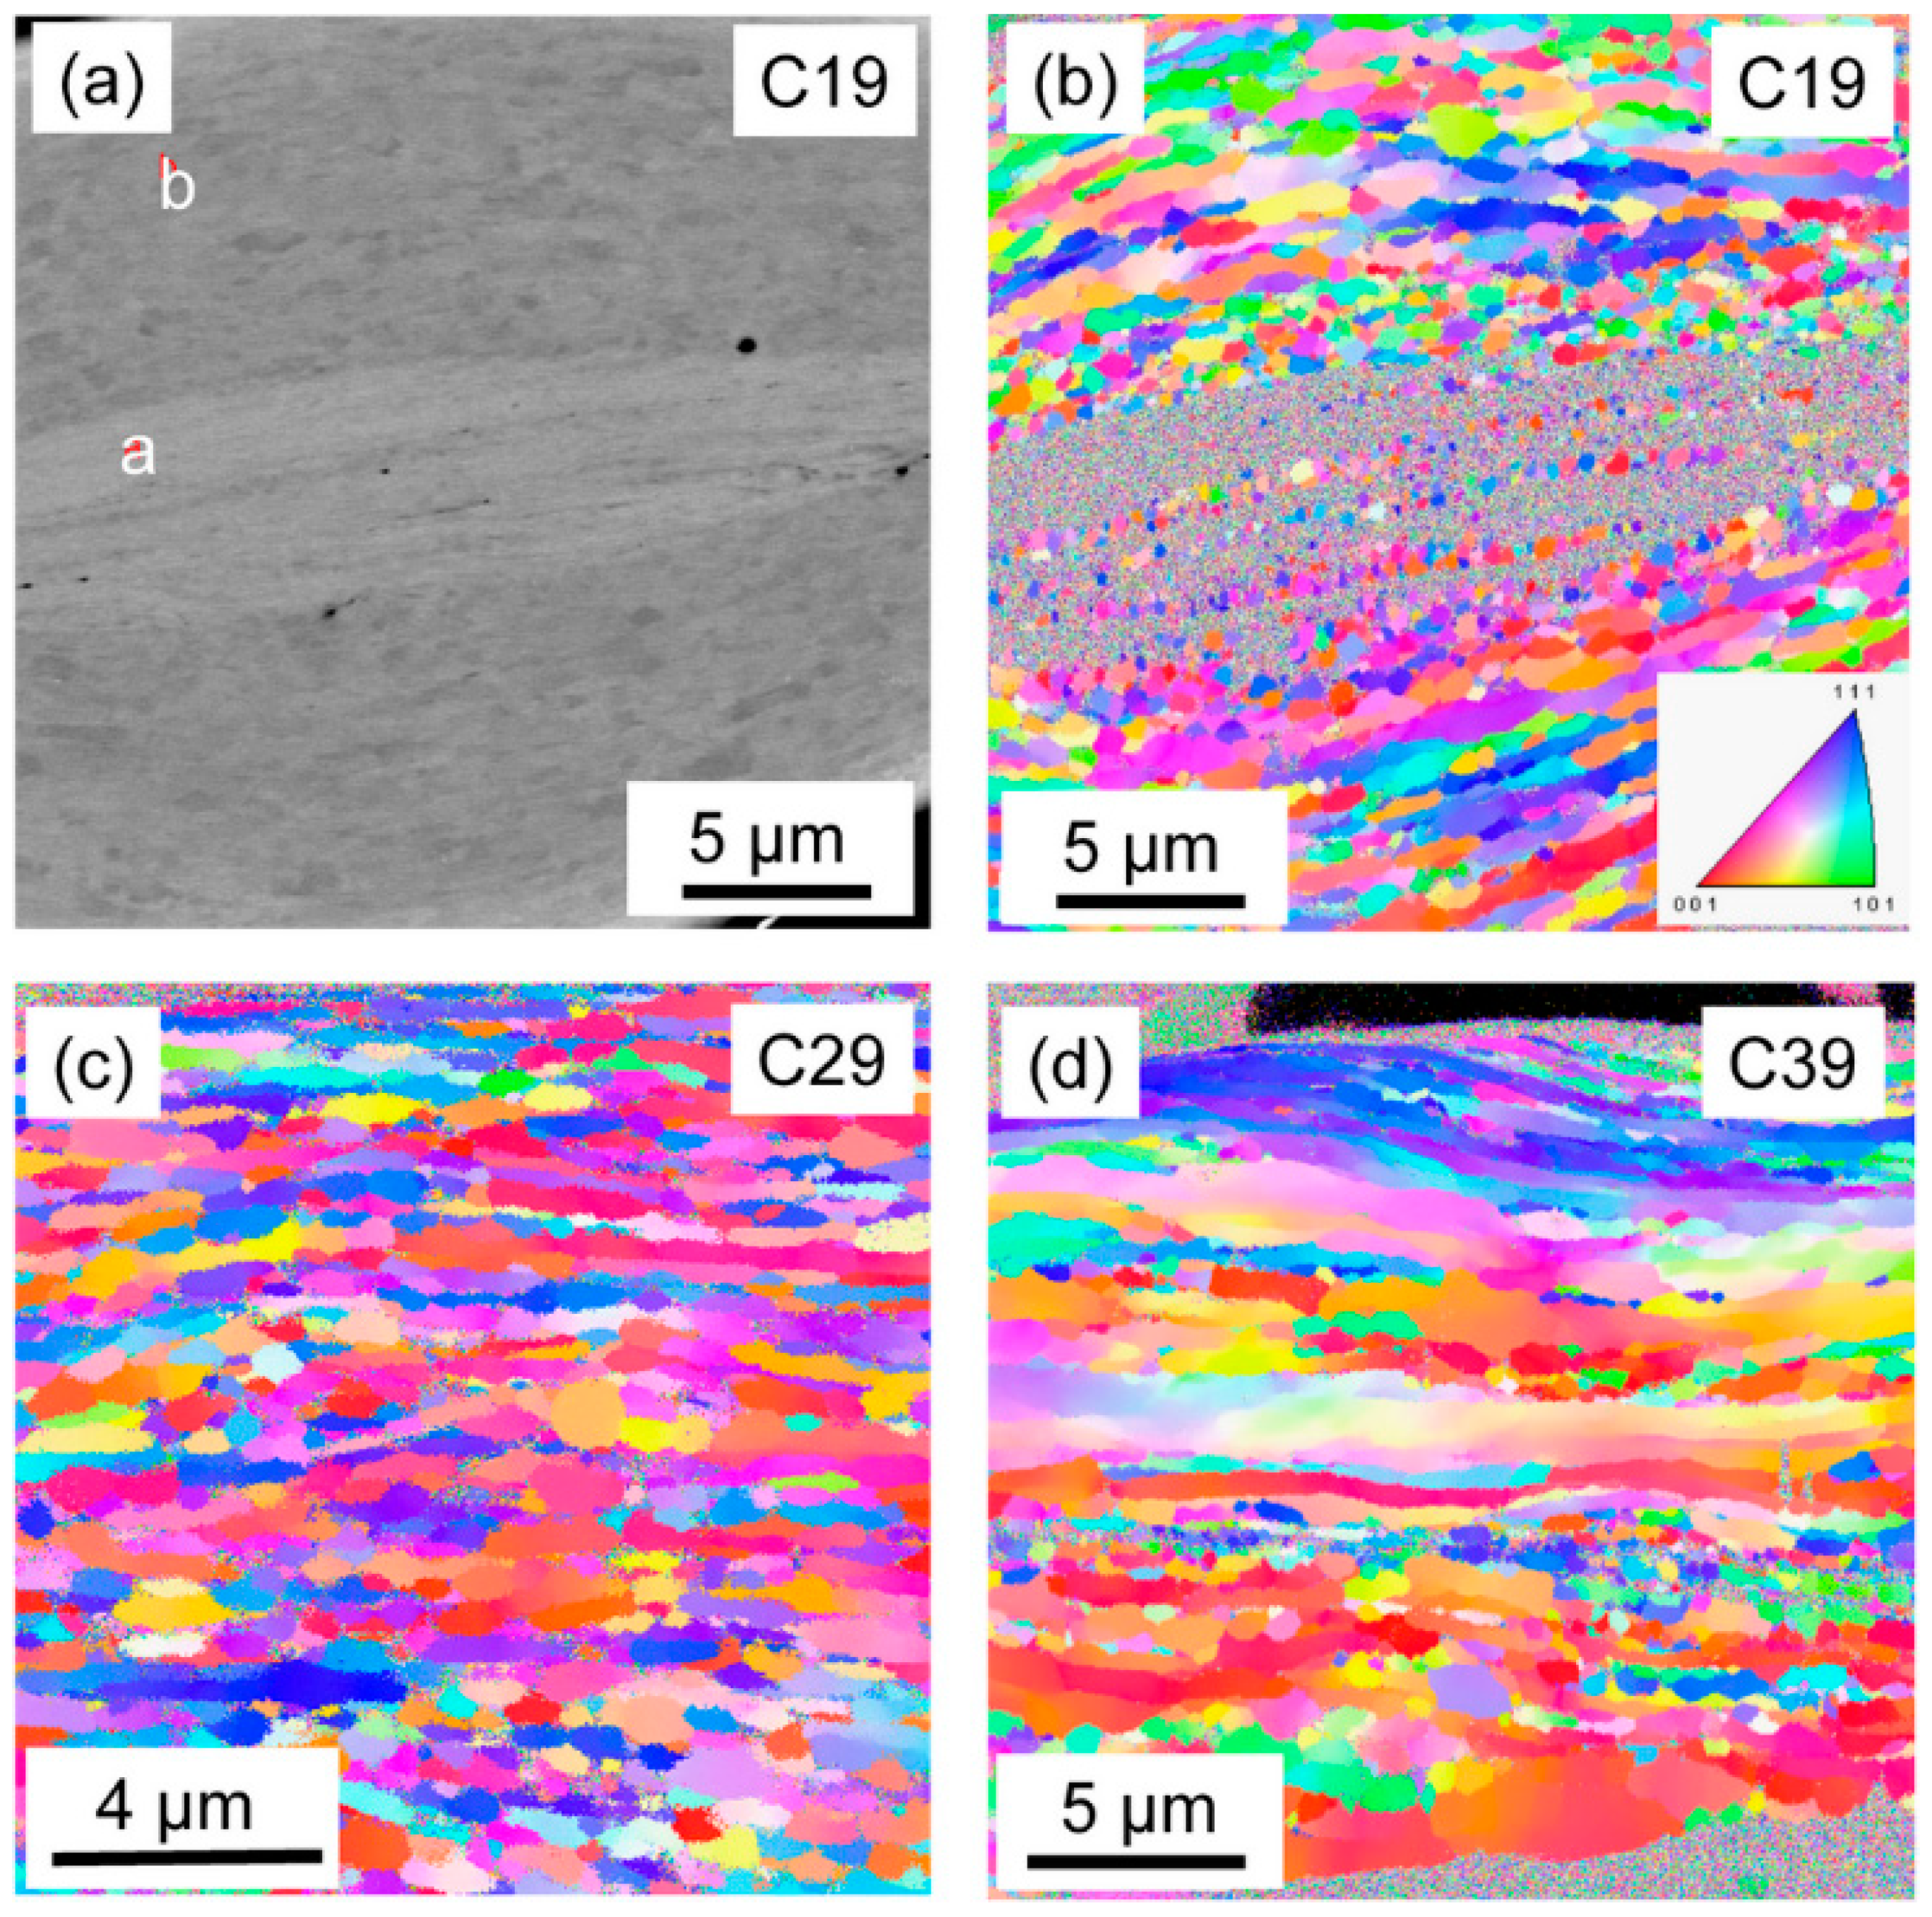
  • The ARB-processed samples contain Cu and Al layers or layer fragments since intermetallic phases were not formed due to the slow diffusion of Cu and Al at room temperature. The dislocation density in the main Cu phase was about 7 × 10¹⁴ m−2, irrespective of the number of ARB cycles and the Ag content. The early saturation of the dislocation density can be attributed to the addition of Ag powder to the Cu–Al system and the corresponding modification of the ARB process. Namely, the presence of silver powder between Cu and Al layers hindered the development of bonding between them. Therefore, three rolling steps were used during the first cycle of ARB and the density of dislocations became high even after the first cycle. The grain size after nine cycles was a few microns.
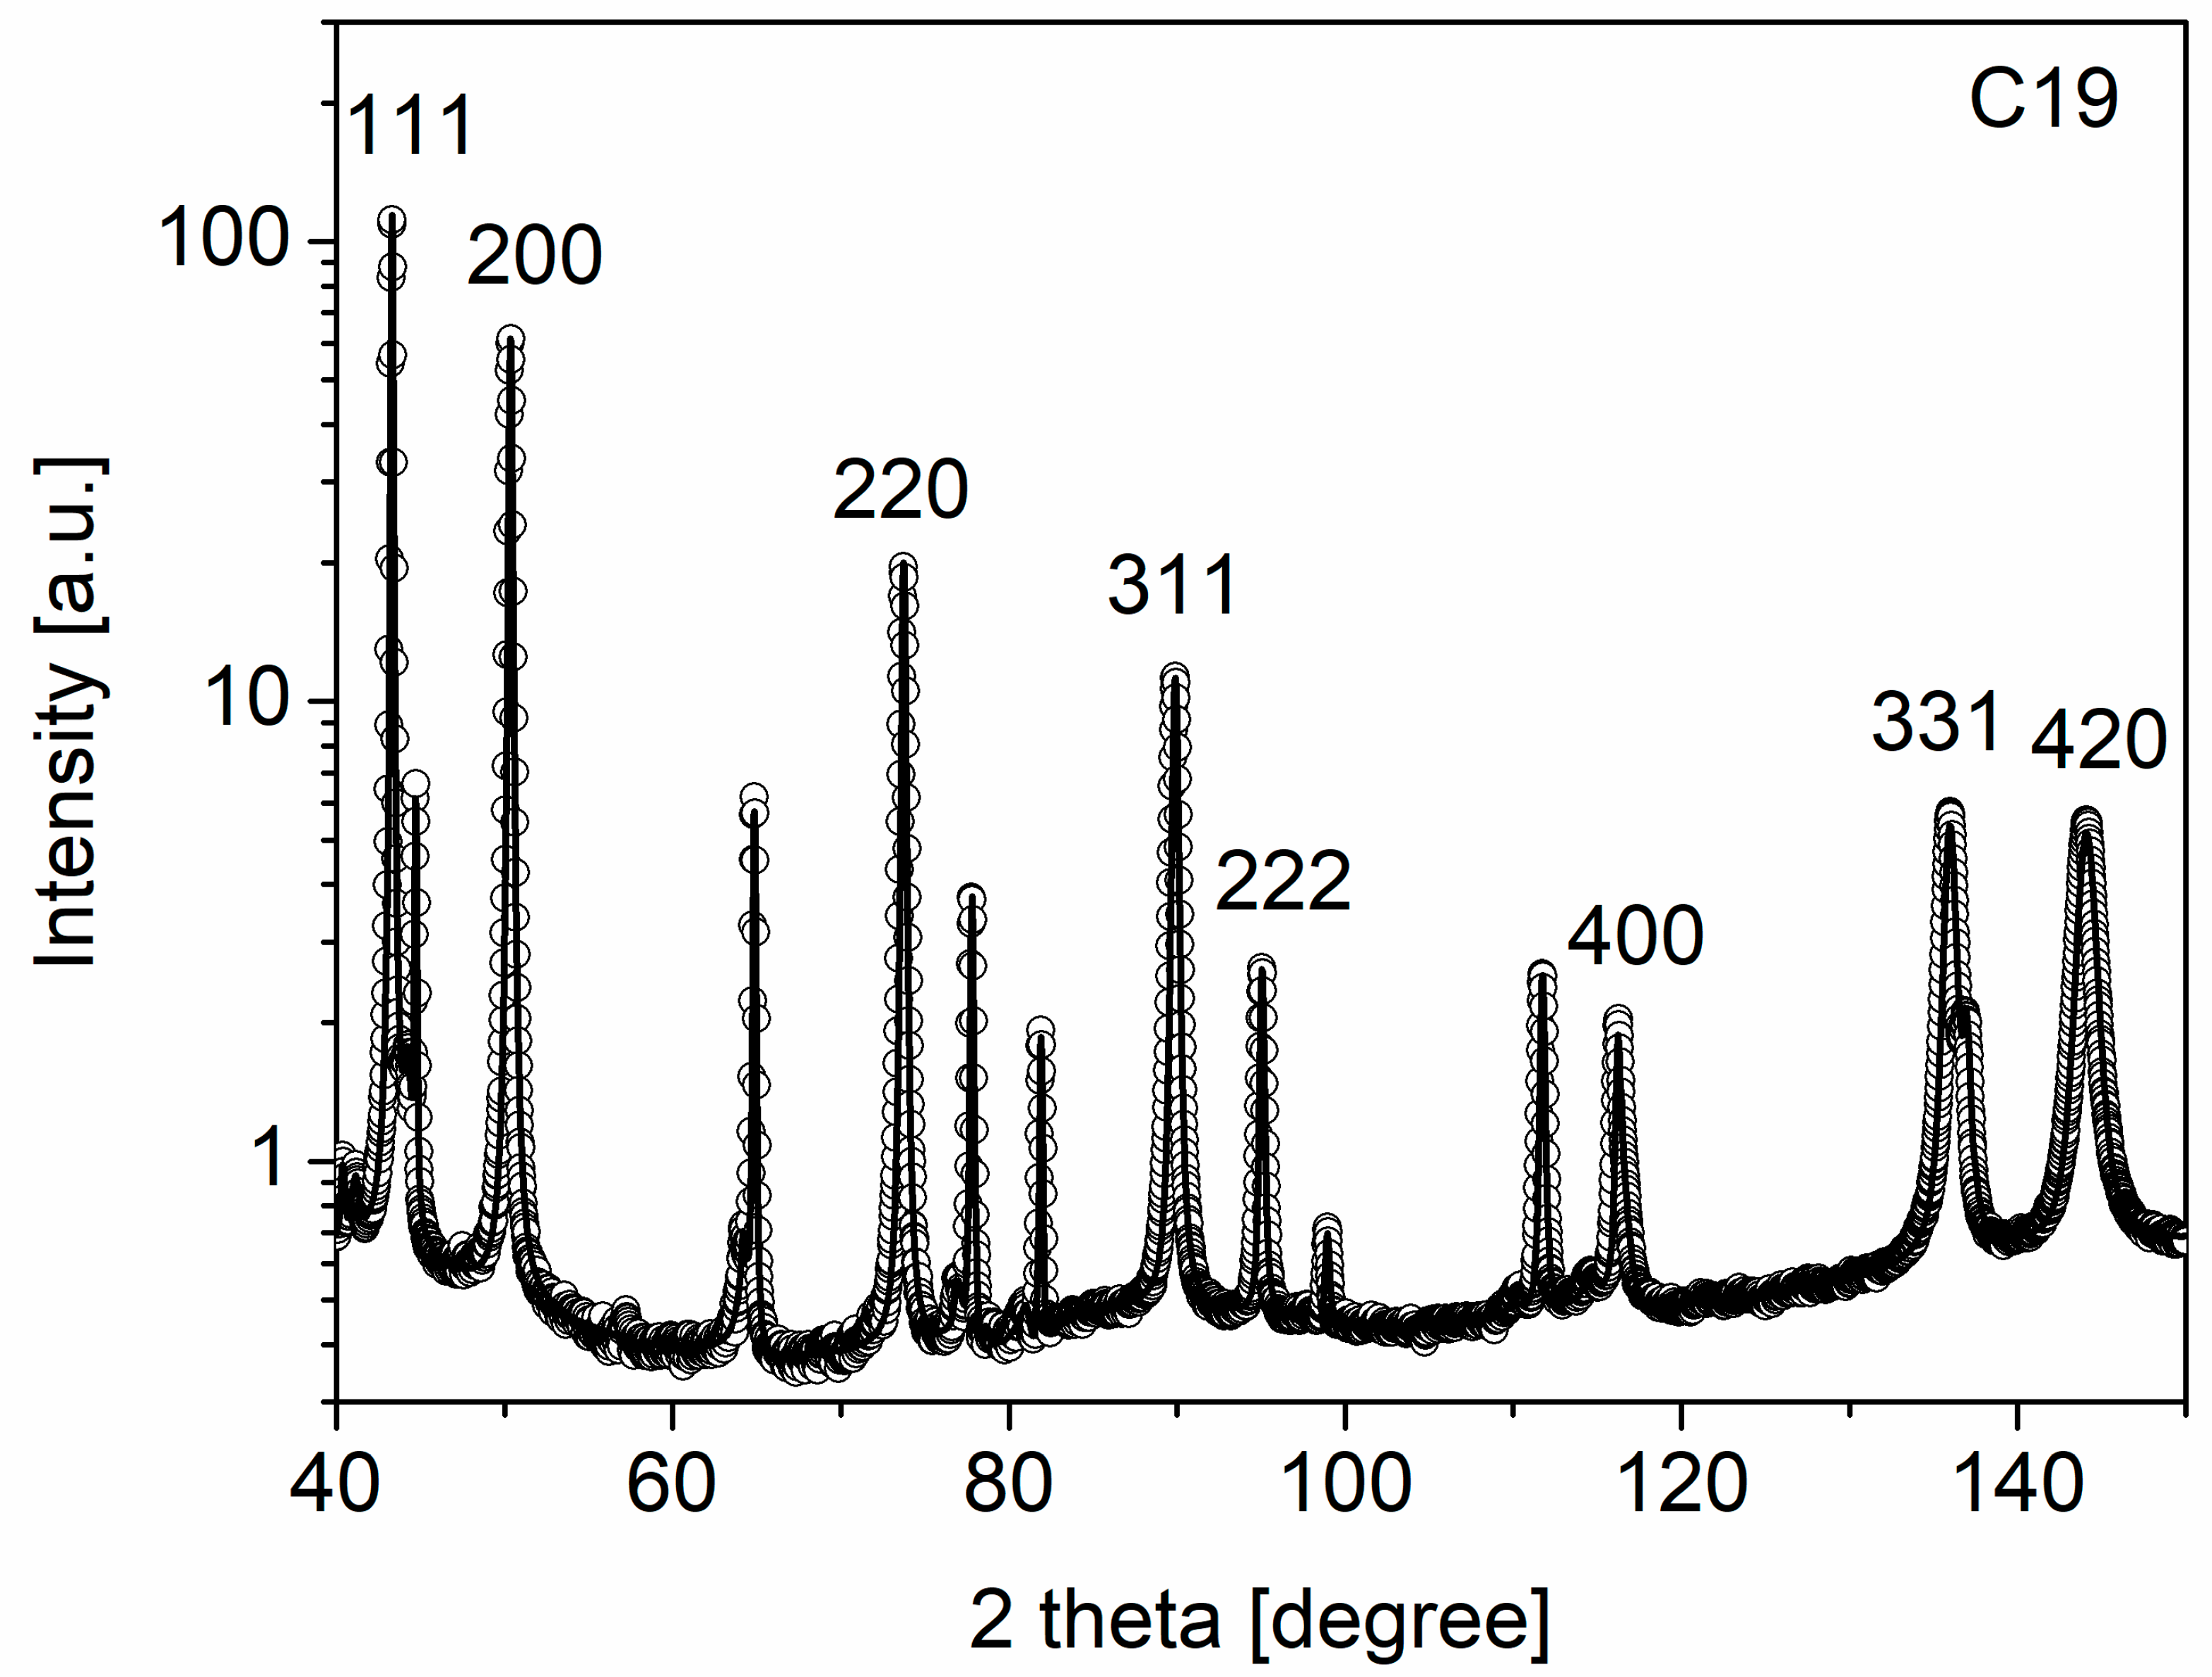
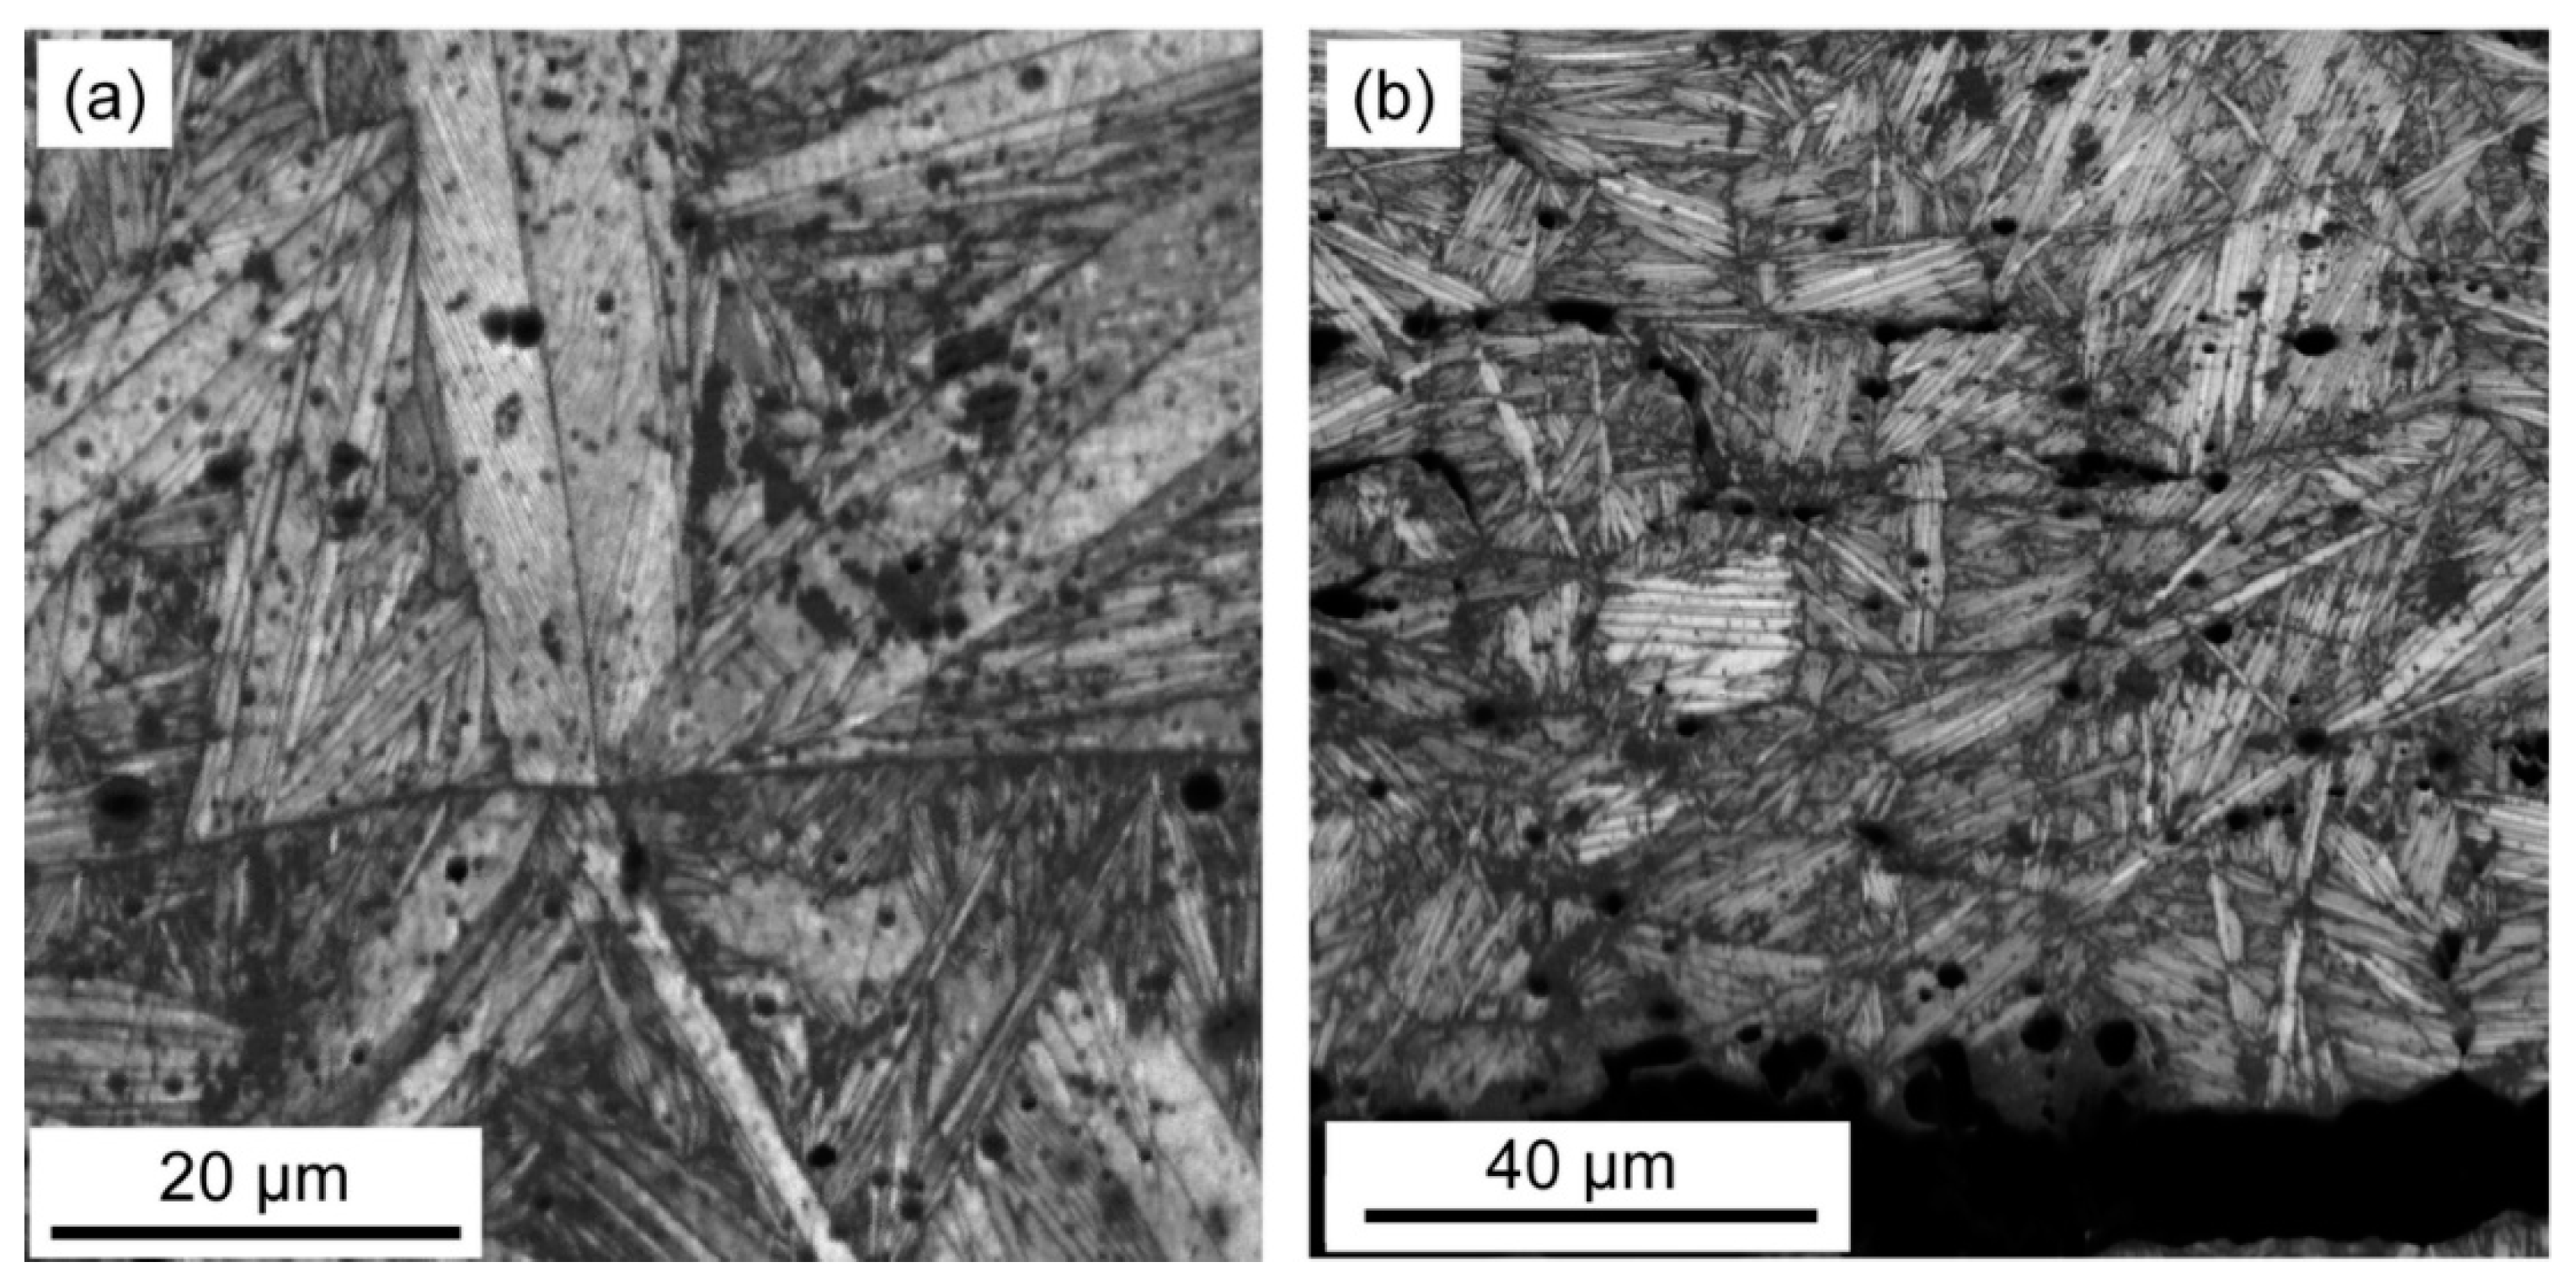
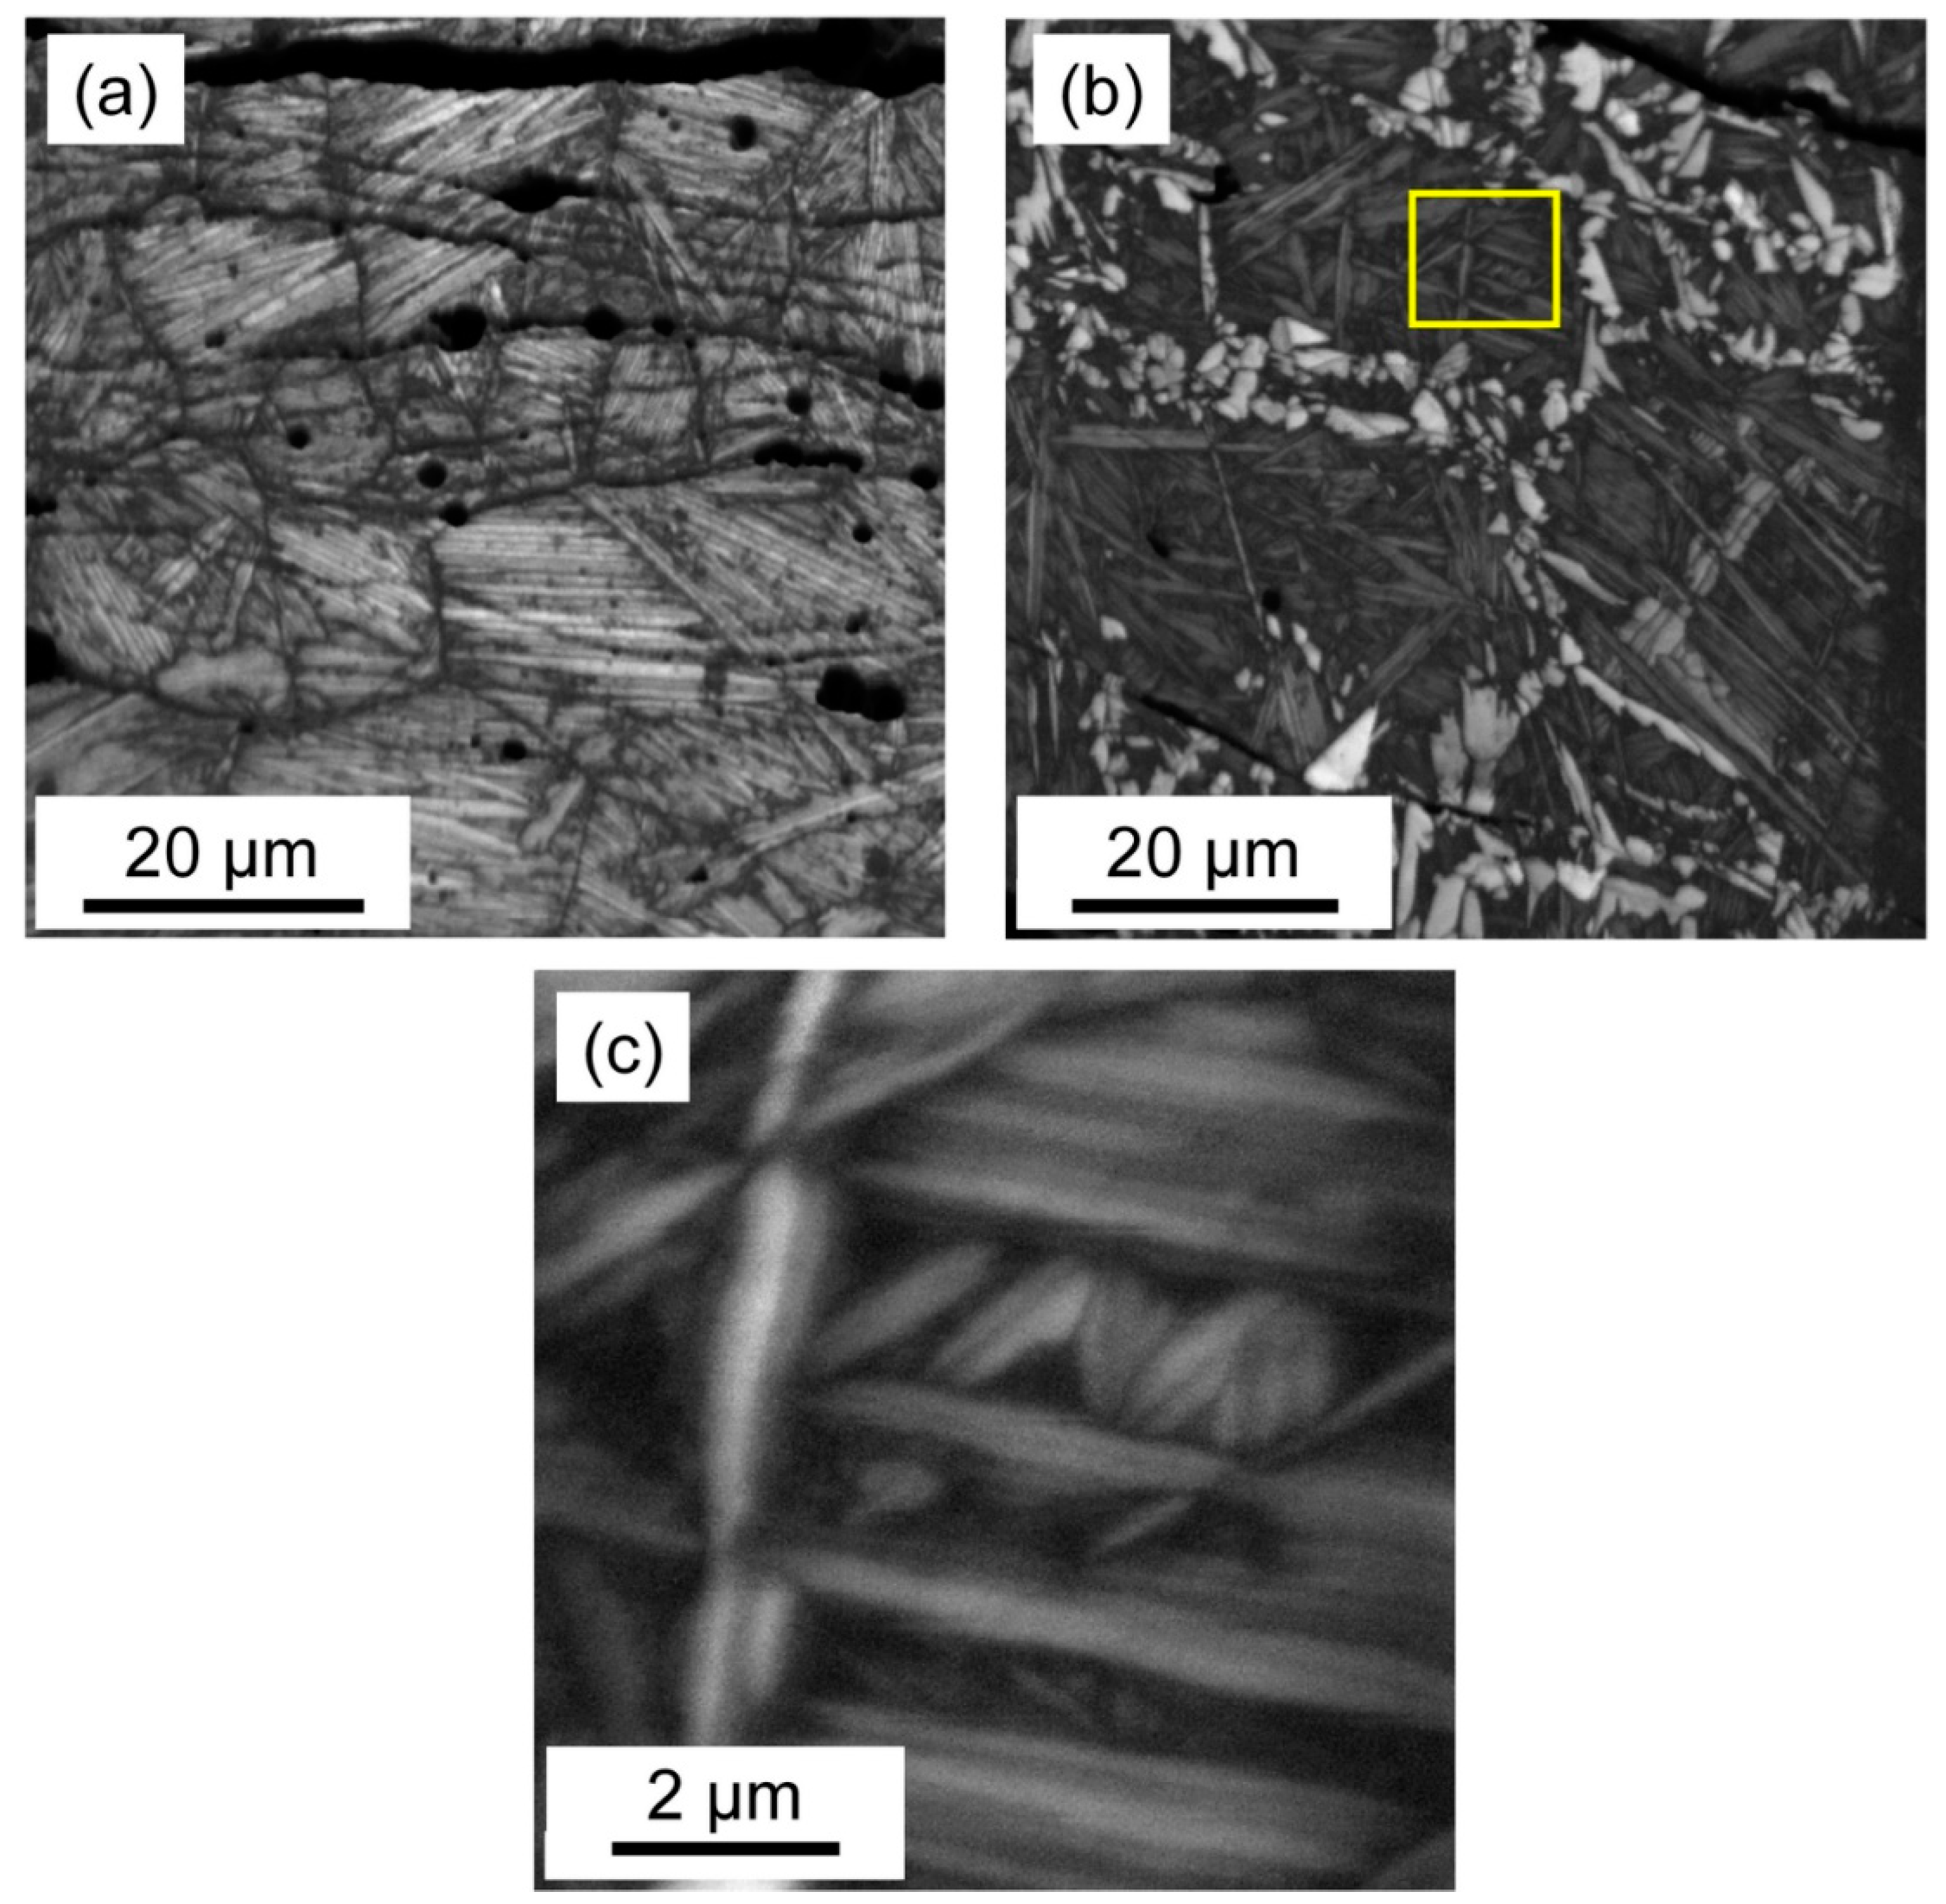
  • During heat treatment of the ARB-processed samples, new intermetallic phases such as β1-AlCu3, Al4Cu9, and γ-AlCu3 were formed. For the lowest Ag content (1 wt.%), the main phase was the brittle Al4Cu9, irrespective of the temperature of heat treatment. For higher Ag concentrations (2 and 3 wt.%), the annealed samples contain mainly the β1-AlCu3 phase. After 60 min of annealing, the best phase compositions were achieved at 950 and 850 °C for the samples containing 2 and 3 wt.% Ag, respectively. The martensite phase consisted of very fine lamellas with a thickness of one micron or less. Since dislocations and grain boundaries facilitate the nucleation of new phases, ARB processing must have a significant role in obtaining fine-grained martensite microstructure during annealing.
  • The heat treatment at 850 and 950 °C for 60 min increased the microhardness and the strength of the presently studied Cu–Al–Ag alloys due to the formation of fine-grained hard intermetallic phases. For the samples containing 2–3 wt.% Ag, annealing at 950 and 850 °C for 60 min after nine cycles of ARB increased the hardness from about 130 to 280 HV and the tensile strength from 340–360 to 460–520 MPa.
  • The alloys containing 2 and 3 wt.% Ag, processed by nine ARB cycles and then annealed at 950 and 850 °C for 60 min, respectively, exhibited a good SME. The recovered strain was about 3% while the tensile strength was as high as ~500 MPa. These values are outstanding among the Cu–based SMAs.

Author Contributions

Conceptualization, P.S. and M.A.; methodology, P.S., M.A. and J.G.; validation, P.S., M.A. and J.G.; formal analysis, P.S., Á.S., J.G. and M.E.-T.; investigation, P.S., Á.S. and M.E.-T.; resources, M.A. and J.G.; data curation, P.S., Á.S. and M.E.-T.; writing—original draft preparation, P.S., M.A. and J.G.; writing—review and editing, P.S., M.A. and J.G.; visualization, P.S., M.E.-T. and J.G.; supervision, M.A. and J.G.; funding acquisition, M.A. and J.G. All authors have read and agreed to the published version of the manuscript.

Funding

This research received no external funding.

Institutional Review Board Statement

Not applicable.

Informed Consent Statement

Not applicable.

Data Availability Statement

The evaluated data presented in this study are available in the tables of this paper. The raw measured data of this study are available on request from the corresponding author.

Acknowledgments

M.E.-T. thanks the cultural affairs and missions sector of Egypt for providing a postdoc fellowship to the Eötvös Loránd University, Budapest, Hungary.

Conflicts of Interest

The authors declare no conflict of interest.

References

  1. Mahdavian, M.; Ghalandari, L.; Reihanian, M. Accumulative roll bonding of multilayered Cu/Zn/Al: An evaluation of microstructure and mechanical properties. Mater. Sci. Eng. A 2013, 579, 99–107. [Google Scholar] [CrossRef]
  2. Eizadjou, M.; Kazemitalachi, A.; Daneshmanesh, H.; Shahabi, H.S.; Janghorban, K. Investigation of structure and mechanical properties of multi-layered Al/Cu composite produced by accumulative roll bonding (ARB) process. Compos. Sci. Technol. 2008, 68, 2003–2009. [Google Scholar] [CrossRef]
  3. Ghalandari, L.; Moshksar, M. High-strength and high-conductive Cu/Ag multilayer produced by ARB. J. Alloys Compd. 2010, 506, 172–178. [Google Scholar] [CrossRef]
  4. Mathis, K.; Gubicza, J.; Nam, N. Microstructure and mechanical behavior of AZ91 Mg alloy processed by equal channel angular pressing. J. Alloys Compd. 2005, 394, 194–199. [Google Scholar] [CrossRef]
  5. Reihanian, M.; Ebrahimi, R.; Tsuji, N.; Moshksar, M. Analysis of the mechanical properties and deformation behavior of nanostructured commercially pure Al processed by equal channel angular pressing (ECAP). Mater. Sci. Eng. A 2008, 473, 189–194. [Google Scholar] [CrossRef]
  6. Sakai, G.; Horita, Z.; Langdon, T.G. Grain refinement and superplasticity in an aluminum alloy processed by high-pressure torsion. Mater. Sci. Eng. A 2005, 393, 344–351. [Google Scholar] [CrossRef]
  7. Horita, Z.; Langdon, T.G. Microstructures and microhardness of an aluminum alloy and pure copper after processing by high-pressure torsion. Mater. Sci. Eng. A 2005, 410–411, 422–425. [Google Scholar] [CrossRef]
  8. Huang, J.; Zhu, Y.; Alexander, D.J.; Liao, X.; Lowe, T.C.; Asaro, R.J. Development of repetitive corrugation and straightening. Mater. Sci. Eng. A 2004, 371, 35–39. [Google Scholar] [CrossRef]
  9. Saito, Y.; Utsunomiya, H.; Tsuji, N.; Sakai, T. Novel ultra-high straining process for bulk materials—Development of the accumulative roll-bonding (ARB) process. Acta Mater. 1999, 47, 579–583. [Google Scholar] [CrossRef]
  10. Tsuji, N.; Ito, Y.; Saito, Y.; Minamino, Y. Strength and ductility of ultrafine grained aluminum and iron produced by ARB and annealing. Scr. Mater. 2002, 47, 893–899. [Google Scholar] [CrossRef]
  11. Eizadjou, M.; Manesh, H.D.; Janghorban, K. Microstructure and mechanical properties of ultra-fine grains (UFGs) aluminum strips produced by ARB process. J. Alloys Compd. 2009, 474, 406–415. [Google Scholar] [CrossRef]
  12. Borhani, E.; Jafarian, H.; Terada, D.; Adachi, H.; Tsuji, N. Microstructural Evolution during ARB Process of Al–0.2 mass% Sc Alloy Containing Al3Sc Precipitates in Starting Structures. Mater. Trans. 2012, 53, 72–80. [Google Scholar] [CrossRef]
  13. Rezaei, M.R.; Toroghinezhad, M.; Ashrafizadeh, F. Analysis of Strengthening Mechanisms in an Artificially Aged Ultrafine Grain 6061 Aluminum Alloy. J. Ultrafine Grained Nanostruct. Mater. 2017, 50, 152–160. [Google Scholar] [CrossRef]
  14. Takata, N.; Lee, S.-H.; Tsuji, N. Ultrafine grained copper alloy sheets having both high strength and high electric conductivity. Mater. Lett. 2009, 63, 1757–1760. [Google Scholar] [CrossRef]
  15. Nomura, K.; Miwa, Y.; Takagawa, Y.; Watanabe, C.; Monzen, R.; Terada, D.; Tsuji, N. Influence of Accumulative Roll Bonding and Cold Rolling Processes on the Precipitation Strengthening Properties for Cu-Ni-P Alloy. J. Jpn. Inst. Met. 2011, 75, 509–515. [Google Scholar] [CrossRef]
  16. Altenberger, I.; Kuhn, H.-A.; Gholami, M.; Mhaede, M.; Wagner, L. Ultrafine-Grained Precipitation Hardened Copper Alloys by Swaging or Accumulative Roll Bonding. Metals 2015, 5, 763–776. [Google Scholar] [CrossRef]
  17. Takagawa, Y.; Tsujiuchi, Y.; Watanabe, C.; Monzen, R.; Tsuji, N. Improvement in Mechanical Properties of a Cu–2.0 mass% Ni–0.5 mass% Si–0.1 mass% Zr Alloy by Combining Both Accumulative Roll-Bonding and Cryo-Rolling with Aging. Mater. Trans. 2013, 54, 1–8. [Google Scholar] [CrossRef]
  18. Kitagawa, K.; Akita, T.; Kita, K.; Gotoh, M.; Takata, N.; Tsuji, N. Structure and Mechanical Properties of Severely Deformed Cu-Cr-Zr Alloys Produced by Accumulative Roll-Bonding Process. Mater. Sci. Forum 2008, 584–586, 791–796. [Google Scholar] [CrossRef]
  19. Sutou, Y.; Omori, T.; Wang, J.J.; Kainuma, R.; Ishida, K. Characteristics of Cu–Al–Mn-based shape memory alloys and their applications. Mater. Sci. Eng. A 2004, 378, 278–282. [Google Scholar] [CrossRef]
  20. Otsuka, K.; Wayman, C.M. Shape Memory Materials; Cambridge University Press: Cambridge, UK, 1999. [Google Scholar]
  21. Hartl, D.; Lagoudas, D. Thermomechanical Characterization of Shape Memory Alloy Materials. In Shape Memory Alloys; Springer: Berlin/Heidelberg, Germany, 2008; Volume 1, pp. 53–119. [Google Scholar] [CrossRef]
  22. Mazzer, E.M.; da Silva, M.R.; Gargarella, P. Revisiting Cu-based shape memory alloys: Recent developments and new perspectives. J. Mater. Res. 2022, 37, 162–182. [Google Scholar] [CrossRef]
  23. Guilemany, J.M.; Fernandez, J.; Zhang, X.M. TEM study on the microstructure of Cu–Al–Ag shape memory alloys. Mater. Sci. Eng. A 2006, 438, 726–729. [Google Scholar] [CrossRef]
  24. Alizadeh, M.; Avazzadeh, M. Evaluation of Cu-26Zn-5Al shape memory alloy fabricated by accumulative roll bonding process. Mater. Sci. Eng. A 2019, 757, 88–94. [Google Scholar] [CrossRef]
  25. Alizadeh, M.; Dashtestaninejad, M.K. Fabrication of manganese-aluminum bronze as a shape memory alloy by accumulative roll bonding process. Mater. Des. 2016, 111, 263–270. [Google Scholar] [CrossRef]
  26. Guilemany, J.M.; Fernández, J.; Franch, R.; Benedetti, A.V.; Adorno, A.T. A new Cu-based SMA with extremely high martensitic transformation temperatures. Le J. Phys. IV 1995, 5, C2-361–C2-365. [Google Scholar] [CrossRef]
  27. Alizadeh, M.; Dashtestaninejad, M.K. Development of Cu-matrix, Al/Mn-reinforced, multilayered composites by accumulative roll bonding (ARB). J. Alloys Compd. 2018, 732, 674–682. [Google Scholar] [CrossRef]
  28. Swann, P.; Warlimont, H. The electron-metallography and crystallography of copper-aluminum martensites. Acta Met. 1963, 11, 511–527. [Google Scholar] [CrossRef]
  29. Ribárik, G.; Gubicza, J.; Ungár, T. Correlation between strength and microstructure of ball-milled Al–Mg alloys determined by X-ray diffraction. Mater. Sci. Eng. A 2004, 387–389, 343–347. [Google Scholar] [CrossRef]
  30. Gubicza, J. X-ray Line Profile Analysis in Materials Science; IGI Global: Hershey, PA, USA, 2014. [Google Scholar] [CrossRef]
  31. Jamaati, R.; Toroghinejad, M.R.; Dutkiewicz, J.; Szpunar, J.A. Investigation of nanostructured Al/Al2O3 composite produced by accumulative roll bonding process. Mater. Des. 2012, 35, 37–42. [Google Scholar] [CrossRef]
  32. Alizadeh, M.; Paydar, M.H.; Terada, D.; Tsuji, N. Effect of SiC particles on the microstructure evolution and mechanical properties of aluminum during ARB process. Mater. Sci. Eng. A 2012, 540, 13–23. [Google Scholar] [CrossRef]
  33. Jiang, S.; Jia, N.; Zhang, H.; He, T.; Zhao, X. Microstructure and Mechanical Properties of Multilayered Cu/Ti Composites Fabricated by Accumulative Roll Bonding. Mater. Trans. 2017, 58, 259–265. [Google Scholar] [CrossRef]
  34. Shaarbaf, M.; Toroghinejad, M.R. Nano-grained copper strip produced by accumulative roll bonding process. Mater. Sci. Eng. A 2008, 473, 28–33. [Google Scholar] [CrossRef]
  35. Maeda, M.Y.; Quintero, J.J.H.; Izumi, M.T.; Hupalo, M.F.; Cintho, O.M. Study of Cryogenic Rolling of FCC Metals with Different Stacking Fault Energies. Mater. Res. 2017, 20, 716–721. [Google Scholar] [CrossRef]
  36. Lee, S.; Saito, Y.; Tsuji, N.; Utsunomiya, H.; Sakai, T. Role of shear strain in ultragrain refinement by accumulative roll-bonding (ARB) process. Scr. Mater. 2002, 46, 281–285. [Google Scholar] [CrossRef]
  37. Alizadeh, M. Strengthening mechanisms in particulate Al/B4C composites produced by repeated roll bonding process. J. Alloys Compd. 2011, 509, 2243–2247. [Google Scholar] [CrossRef]
  38. Ghalandari, L.; Mahdavian, M.; Reihanian, M. Microstructure evolution and mechanical properties of Cu/Zn multilayer processed by accumulative roll bonding (ARB). Mater. Sci. Eng. A 2014, 593, 145–152. [Google Scholar] [CrossRef]
  39. Al-Humairi, S.N.S. Cu-Based Shape Memory Alloys: Modified Structures and Their Related Properties. In Recent Advancements in the Metallurgical Engineering and Electrodeposition; Al-Naib, U.B., Vikraman, D., Karuppasamy, K., Eds.; IntechOpen: London, UK, 2020. [Google Scholar] [CrossRef]
  40. Xu, H.; Liu, C.; Silberschmidt, V.V.; Pramana, S.S.; White, T.J.; Chen, Z.; Acoff, V.L. Behavior of aluminum oxide, intermetallics and voids in Cu–Al wire bonds. Acta Mater. 2011, 59, 5661–5673. [Google Scholar] [CrossRef]
  41. Adorno, A.T.; Silva, R.A.G. Effect of 4 mass% Ag addition on the thermal behavior of the Cu-9 mass% Al alloy. J. Therm. Anal. 2003, 73, 931–938. [Google Scholar] [CrossRef]
  42. Silva, R.A.G.; Cuniberti, A.; Stipcich, M.; Adorno, A.T. Effect of Ag addition on the martensitic phase of the Cu–10 wt.% Al alloy. Mater. Sci. Eng. A 2007, 456, 5–10. [Google Scholar] [CrossRef]
  43. Kim, H.W. A study of the two-way shape memory effect in Cu–Zn–Al alloys by the thermomechanical cycling method. J. Mater. Process. Technol. 2004, 146, 326–329. [Google Scholar] [CrossRef]
  44. Bhattacharya, K. Microstructure of Martensite: Why It Forms and How It Gives Rise to the Shape-Memory Effect; Oxford University Press: Oxford, UK, 2003. [Google Scholar]
  45. Alaneme, K.K.; Okotete, E.A.; Maledi, N. Phase characterisation and mechanical behaviour of Fe–B modified Cu–Zn–Al shape memory alloys. J. Mater. Res. Technol. 2017, 6, 136–146. [Google Scholar] [CrossRef]
  46. CM, W. Grain refinement of a Cu–Al–Ni shape memory alloy by Ti and Zr additions. Trans. Japan Inst. Met. 1986, 27, 584–591. [Google Scholar]
  47. Alaneme, K.K.; Anaele, J.U.; Okotete, E.A. Martensite aging phenomena in Cu-based alloys: Effects on structural transformation, mechanical and shape memory properties: A critical review. Sci. Afr. 2021, 12, e00760. [Google Scholar] [CrossRef]
  48. Liu, X.; Zhuang, L.; Zhao, Y. Microstructure and Mechanical Properties of Ultrafine-Grained Copper by Accumulative Roll Bonding and Subsequent Annealing. Materials 2020, 13, 5171. [Google Scholar] [CrossRef] [PubMed]
  49. Adorno, A.T.; Silva, R.A.G. Isothermal decomposition kinetics in the Cu–9% Al–4% Ag alloy. J. Alloys Compd. 2004, 375, 128–133. [Google Scholar] [CrossRef]
  50. Min, G.; Lee, J.-M.; Kang, S.-B.; Kim, H.-W. Evolution of microstructure for multilayered Al/Ni composites by accumulative roll bonding process. Mater. Lett. 2006, 60, 3255–3259. [Google Scholar] [CrossRef]
  51. Ohsaki, S.; Kato, S.; Tsuji, N.; Ohkubo, T.; Hono, K. Bulk mechanical alloying of Cu–Ag and Cu/Zr two-phase microstructures by accumulative roll-bonding process. Acta Mater. 2007, 55, 2885–2895. [Google Scholar] [CrossRef]
  52. Awan, I.Z.; Khan, A.Q. Fascinating Shape Memory Alloys. J. Chem. Soc. Pakistan. 2018, 40, 1–23. [Google Scholar]
  53. Punburi, P.; Tareelap, N.; Srisukhumbowornchai, N.; Euaruksakul, C.; Yordsri, V. Correlation between electron work functions of multiphase Cu-8Mn-8Al and de-alloying corrosion. Appl. Surf. Sci. 2018, 439, 1040–1046. [Google Scholar] [CrossRef]
  54. Oliveira, J.; Crispim, B.; Zeng, Z.; Omori, T.; Fernandes, F.B.; Miranda, R. Microstructure and mechanical properties of gas tungsten arc welded Cu-Al-Mn shape memory alloy rods. J. Mater. Process. Technol. 2019, 271, 93–100. [Google Scholar] [CrossRef]
  55. Yang, S.; Zhang, J.; Chen, X.; Chi, M.; Wang, C.; Liu, X. Excellent superelasticity and fatigue resistance of Cu-Al-Mn-W shape memory single crystal obtained only through annealing polycrystalline cast alloy. Mater. Sci. Eng. A 2019, 749, 249–254. [Google Scholar] [CrossRef]
  56. Tian, J.; Zhu, W.; Wei, Q.; Wen, S.; Li, S.; Song, B.; Shi, Y. Process optimization, microstructures and mechanical properties of a Cu-based shape memory alloy fabricated by selective laser melting. J. Alloys Compd. 2019, 785, 754–764. [Google Scholar] [CrossRef]
  57. Hussain, S.; Pandey, A.; Dasgupta, R. Designed polycrystalline ultra-high ductile boron doped Cu–Al–Ni based shape memory alloy. Mater. Lett. 2019, 240, 157–160. [Google Scholar] [CrossRef]
  58. Guniputi, B.N.; Murigendrappa, S. Influence of Gd on the microstructure, mechanical and shape memory properties of Cu-Al-Be polycrystalline shape memory alloy. Mater. Sci. Eng. A 2018, 737, 245–252. [Google Scholar] [CrossRef]
  59. Morris, M.; Günter, S. Effect of heat treatment and thermal cycling on transformation temperatures of ductile Cu-Al-Ni-Mn-B alloys. Scr. Met. Mater. 1992, 26, 1663–1668. [Google Scholar] [CrossRef]
  60. Dar, R.D.; Yan, H.; Chen, Y. Grain boundary engineering of Co–Ni–Al, Cu–Zn–Al, and Cu–Al–Ni shape memory alloys by intergranular precipitation of a ductile solid solution phase. Scr. Mater. 2016, 115, 113–117. [Google Scholar] [CrossRef]
  61. Hall, E.O. The Deformation and Ageing of Mild Steel: III Discussion of Results. Proc. Phys. Soc. Sect. B 1951, 64, 747–753. [Google Scholar] [CrossRef]
Figure 1. CMWP fitting for the sample containing 1% Ag and processed by 9 passes of ARB. The open circles and the solid line represent the measured and the calculated patterns in the case of the best fitting. The indices of the fitted Cu peaks are indicated in the figure. The non-indexed peaks are related to the Al phase.
Crystals 12 01167 g001
Figure 2. XRD patterns for the samples containing (a) 1%, (b) 2%, and (c) 3% Ag processed by 9 cycles of ARB.
Crystals 12 01167 g002
Figure 3. Backscattered SEM image of the microstructure obtained on the cross-section of the composites containing (a) 1 wt.%, (b) 2 wt.%, and (c) 3 wt.% Ag processed for 9 passes of ARB (denoted as C19, C29, and C39, respectively). The bright and dark areas correspond to Cu and Al phases, respectively.
Crystals 12 01167 g003
Figure 4. (a) Image quality (IQ) and (b) IPF color maps for the ARB-processed sample C19, as obtained by EBSD. In figure (a), the letters “a” and “b” indicate zones with average grain sizes of several hundreds of nanometers and a few microns, respectively. IPF color maps for the ARB-processed specimens (c) C29, and (d) C39.
Crystals 12 01167 g004
Figure 5. XRD patterns for the samples containing 1 wt.% Ag annealed at different temperatures for 60 min.
Crystals 12 01167 g005
Figure 6. XRD patterns for the samples containing 2 wt.% Ag annealed at different temperatures for 60 min.
Crystals 12 01167 g006
Figure 7. XRD patterns for the samples containing 3 wt.% Ag annealed at different temperatures for 60 min.
Crystals 12 01167 g007
Figure 8. EBSD IPF maps for the samples with 1% Ag processed by 9 passes of ARB and then annealed at (a) 850 and (b) 950 °C for 60 min.
Crystals 12 01167 g008
Figure 9. EBSD IQ maps for the material containing 2% Ag and processed by 9 passes of ARB and then annealed at (a) 850 and (b) 950 °C for 60 min, (samples A2–850–60 and A2–950–60, respectively).
Crystals 12 01167 g009
Figure 10. (a) Cu, (b) Al, (c) Ag, and (d) O elemental maps for sample A2–950–60 as obtained by SEM-EDS.
Crystals 12 01167 g010
Figure 11. EBSD IQ maps for the material containing 3% Ag and processed by 9 passes of ARB and then annealed at (a) 850 and (b) 950 °C for 60 min (samples A3–850–60 and A3–950–60, respectively). The lamellar microstructure inside the yellow square in (b) is shown with a higher magnification in (c).
Crystals 12 01167 g011
Figure 12. (a) Cu, (b) Al, (c) Ag, and (d) O elemental maps for sample A3–850–60 as obtained by SEM-EDS.
Crystals 12 01167 g012
Figure 13. Tensile stress–strain curves for the samples processed for 9 ARB cycles and containing 2 and 3 wt.% Ag (specimens C29 and C39) and their counterparts heat-treated at 950 °C and 850 °C for 60 min, respectively (samples A2–950–60 and A3–850–60).
Crystals 12 01167 g013
Figure 14. Engineering stress–strain curves obtained during loading and unloading in a tensile test performed for samples (a) A2–950–60 and (b) A3–850–60.
Crystals 12 01167 g014
Table 1. Dimensions, chemical composition, and number of layers before the first cycle of ARB-processing.
Starting MaterialsComposition
(wt.%)
Weight
(g)
Number of LayersDimensions of the Sheets (mm3)/Particle Size of the Powder (μm)
Cu sheetsPure Cu (>99.9)80.464150 × 30 × 0.5
Al sheetsPure Al (>99)10.9353150 × 30 × 0.3
Ag powderPure Ag (>99)5, 10, and 15-<5
Table 2. The crystallite size (<x>area) and the dislocation density (ρ) for the ARB-processed samples as obtained by XLPA.
Sample<x>area (nm)ρ (1014 m−2)
C11103 ± 129.2 ± 1.0
C1591 ± 106.4 ± 0.8
C1970 ± 97.4 ± 0.9
C2187 ± 106.8 ± 0.8
C2593 ± 107.3 ± 0.9
C2980 ± 96.4 ± 0.8
C3165 ± 86.2 ± 0.7
C3583 ± 96.8 ± 0.8
C3967 ± 87.4 ± 0.9
Table 3. XRD intensity fractions in % of the different phases for the samples with 2% Ag processed by 9 ARB passes and subsequently annealed at different temperatures. PDF card numbers: β1-AlCu3 (00-028-0005), Al4Cu9 (01-075-6862), γ-AlCu3 (01-074-6895), CuO (01-073-6023), Cu2O (01-080-7711), and CuAlO2 (01-075-2356).
Sample Nameγ-AlCu3β1-AlCu3Al4Cu9CuOCu2OCuAlO2
A2-750-60273241---
A2-850-60105139---
A2-950-60-82-1233
A2-1050-60-82-5-13
Table 4. XRD intensity fractions in % of the different phases for the samples with 3% Ag processed by 9 ARB passes and subsequently annealed at different temperatures for various times. PDF card numbers: β1-AlCu3 (00-028-0005), CuO (01-080-1916), CuAlO2 (01-075-2356), Cu (01-071-4610), and Ag (01-073-6977).
Sample Nameβ1-AlCu3CuOCu (Al)AgCuAlO2Cu2O
A3–750–608982--1
A3–850–60954-1--
A3–950–607951123-
A3–1050–6066-12-22-
Table 5. Effect of ARB cycles on the microhardness of Cu/Al/Ag samples with different Ag contents. The relative error of the hardness values is about 5%.
SampleCu LayersAl LayerC15C19C25C29C35C39
Microhardness (HV)5526101124109131108133
Table 6. Effect of heat treatment on the microhardness of Cu–Al–Ag alloys. The relative error of the hardness values is about 5%.
SampleA1–950–60A2–850–60A2–950–60A3–850–60A3–950–60
Microhardness
(HV)
210245270281266
Publisher’s Note: MDPI stays neutral with regard to jurisdictional claims in published maps and institutional affiliations.

