
Synthesis of One-Dimensional Titanium Oxide Nanowires for Polyvinylidene Fluoride Membrane Optimization


 , ,
, ,  , ,
, ,  , , and
Abstract
:1. Introduction
2. Materials and Methods
2.1. Materials and Methods
2.2. Preparation of TiO2 Nanowires
2.3. Pre and Post Calcination Coupling PVDF Membrane with TiO2 Nanowires
2.4. Coupling CNT Functionalized PVDF with TiO2 Nanowires
2.5. Characterization
3. Results
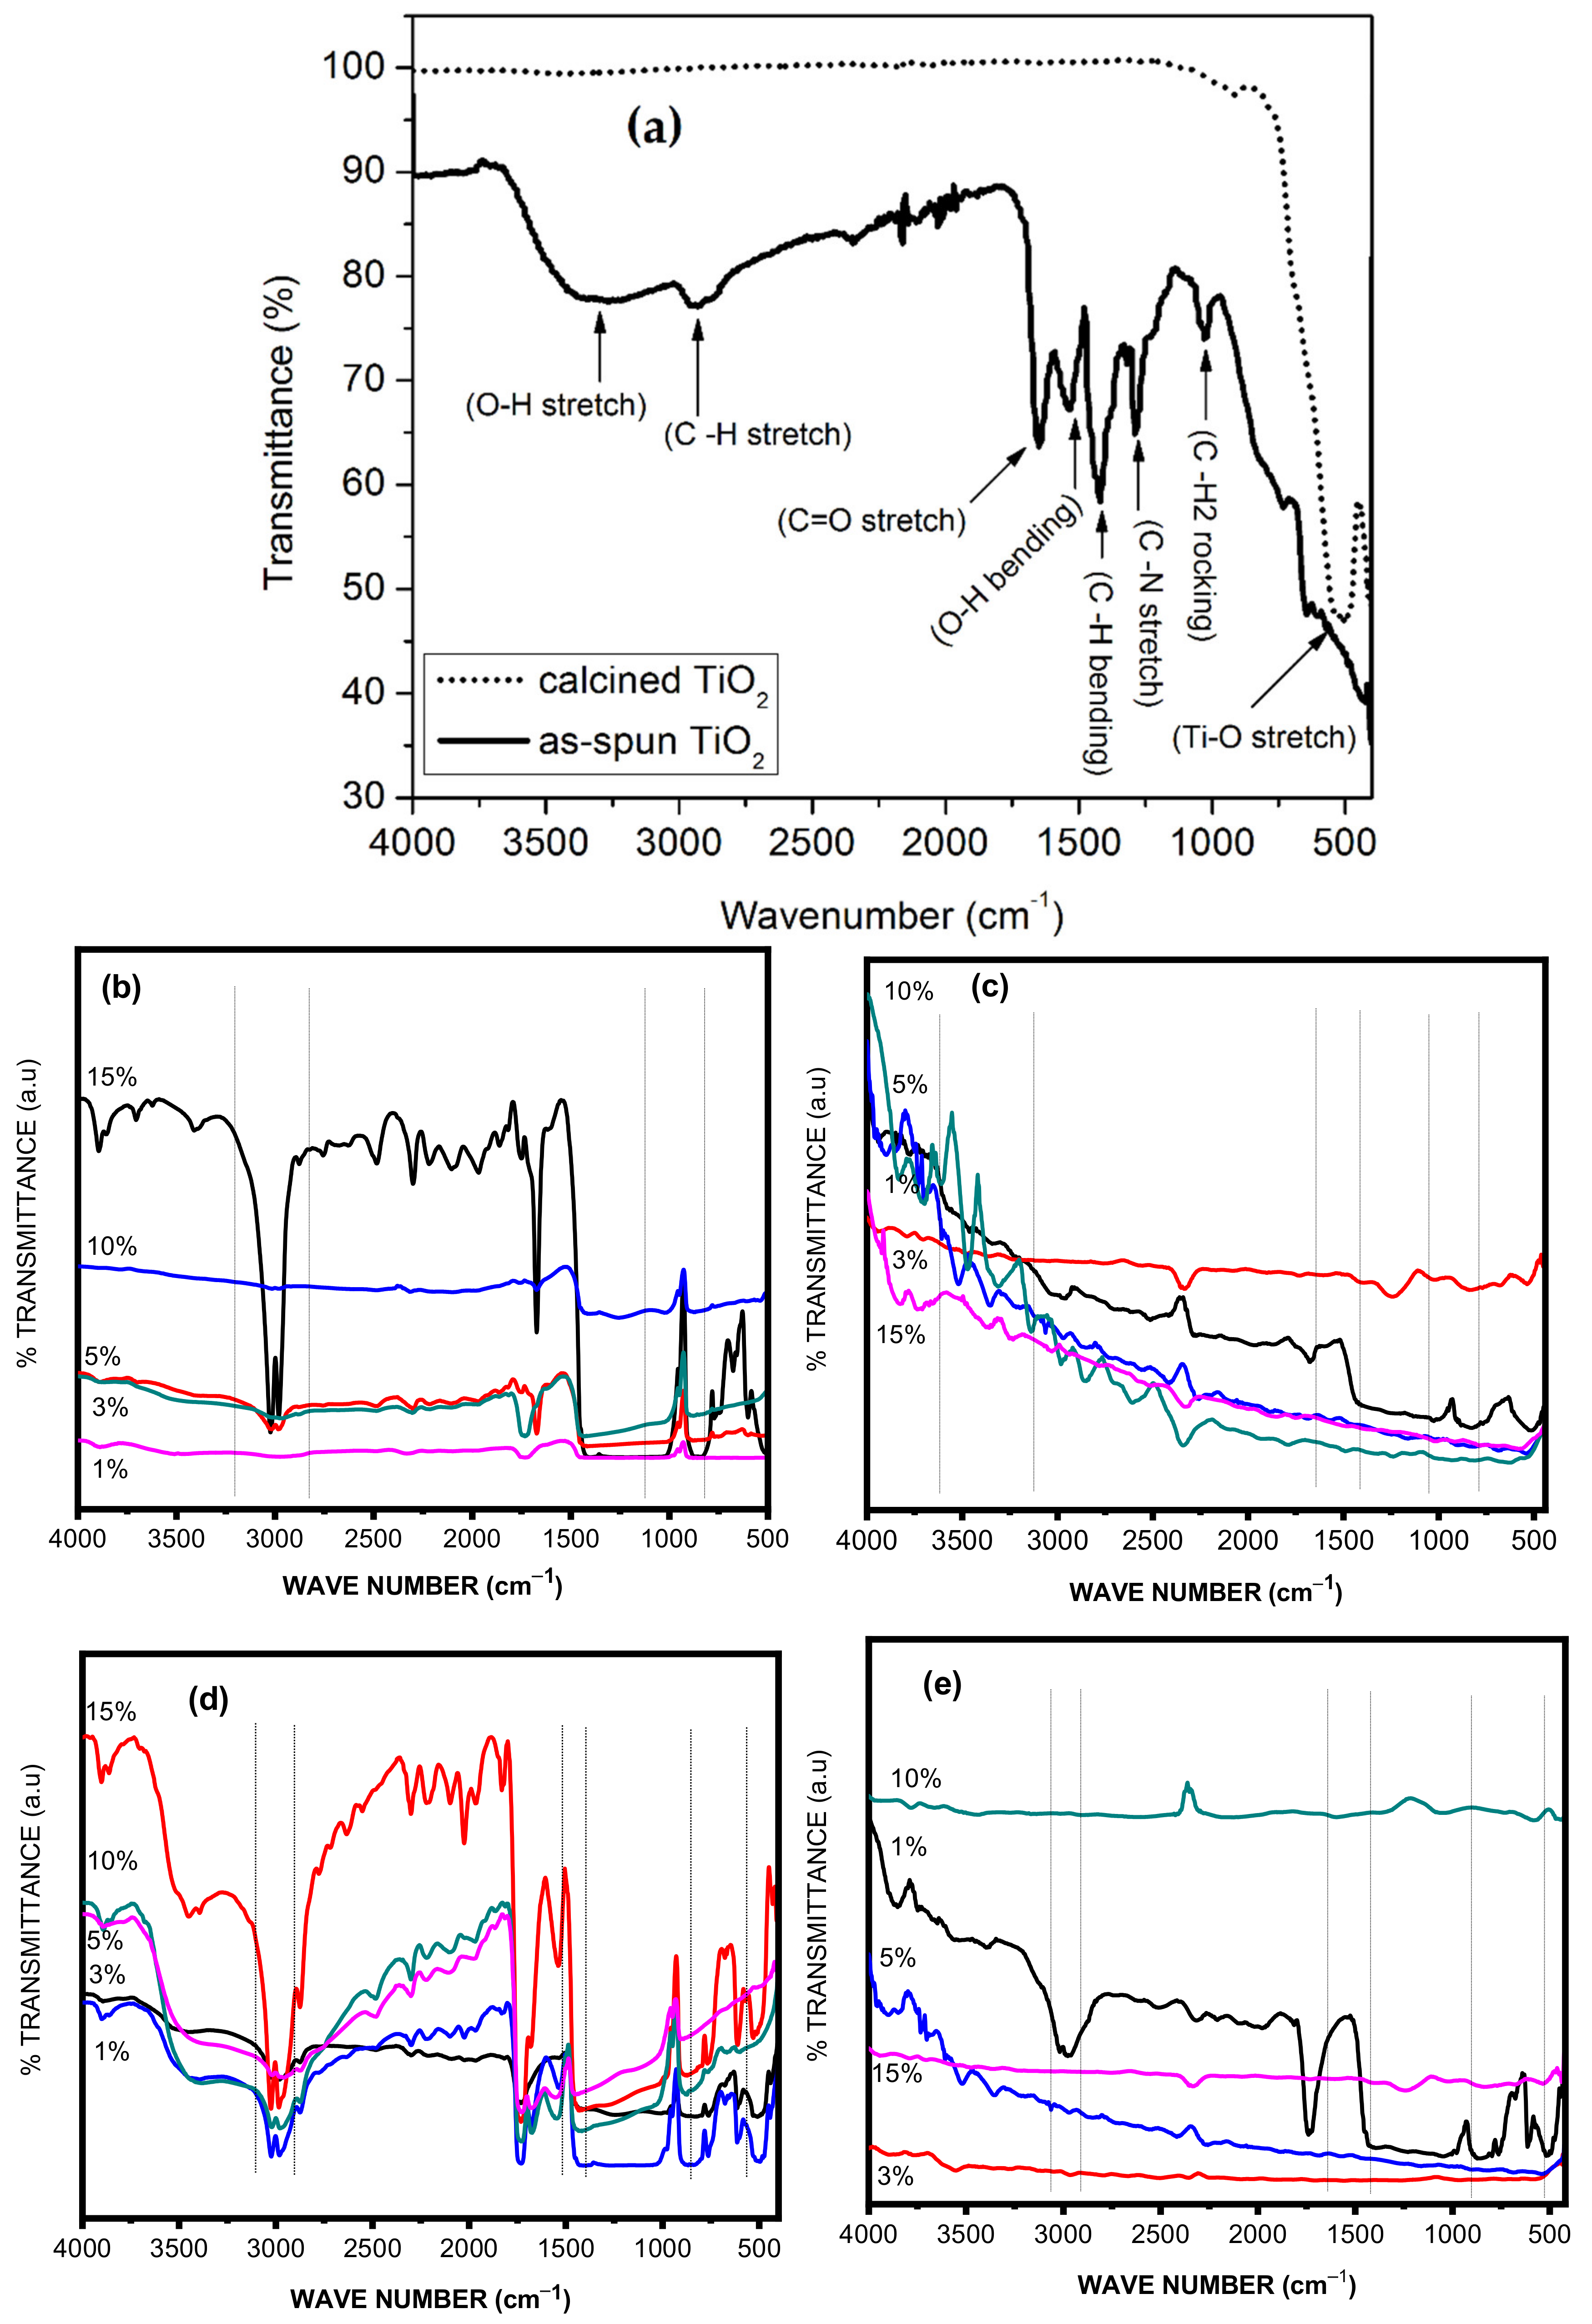
3.1. FTIR Analysis
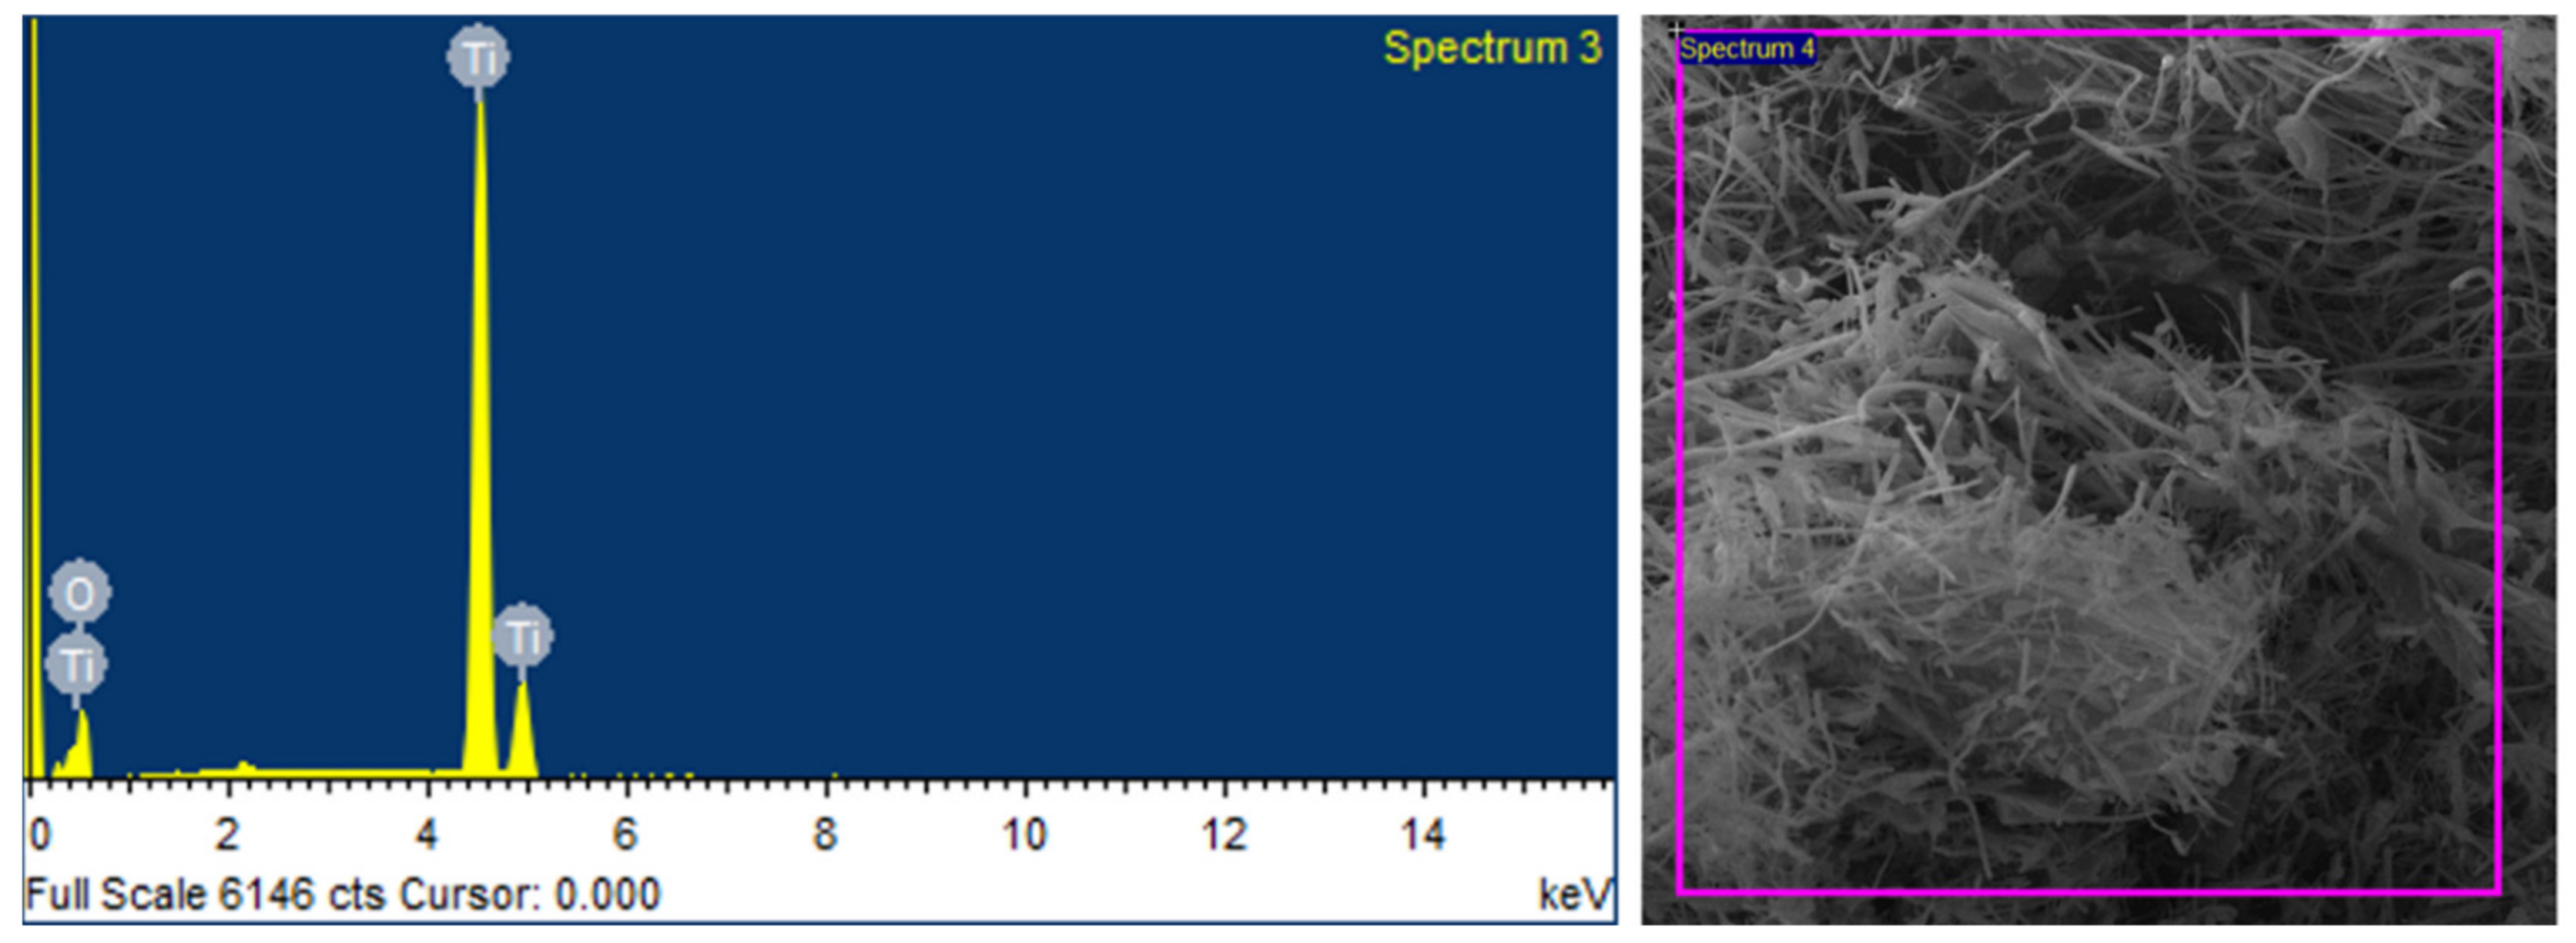
3.2. EDS Analysis
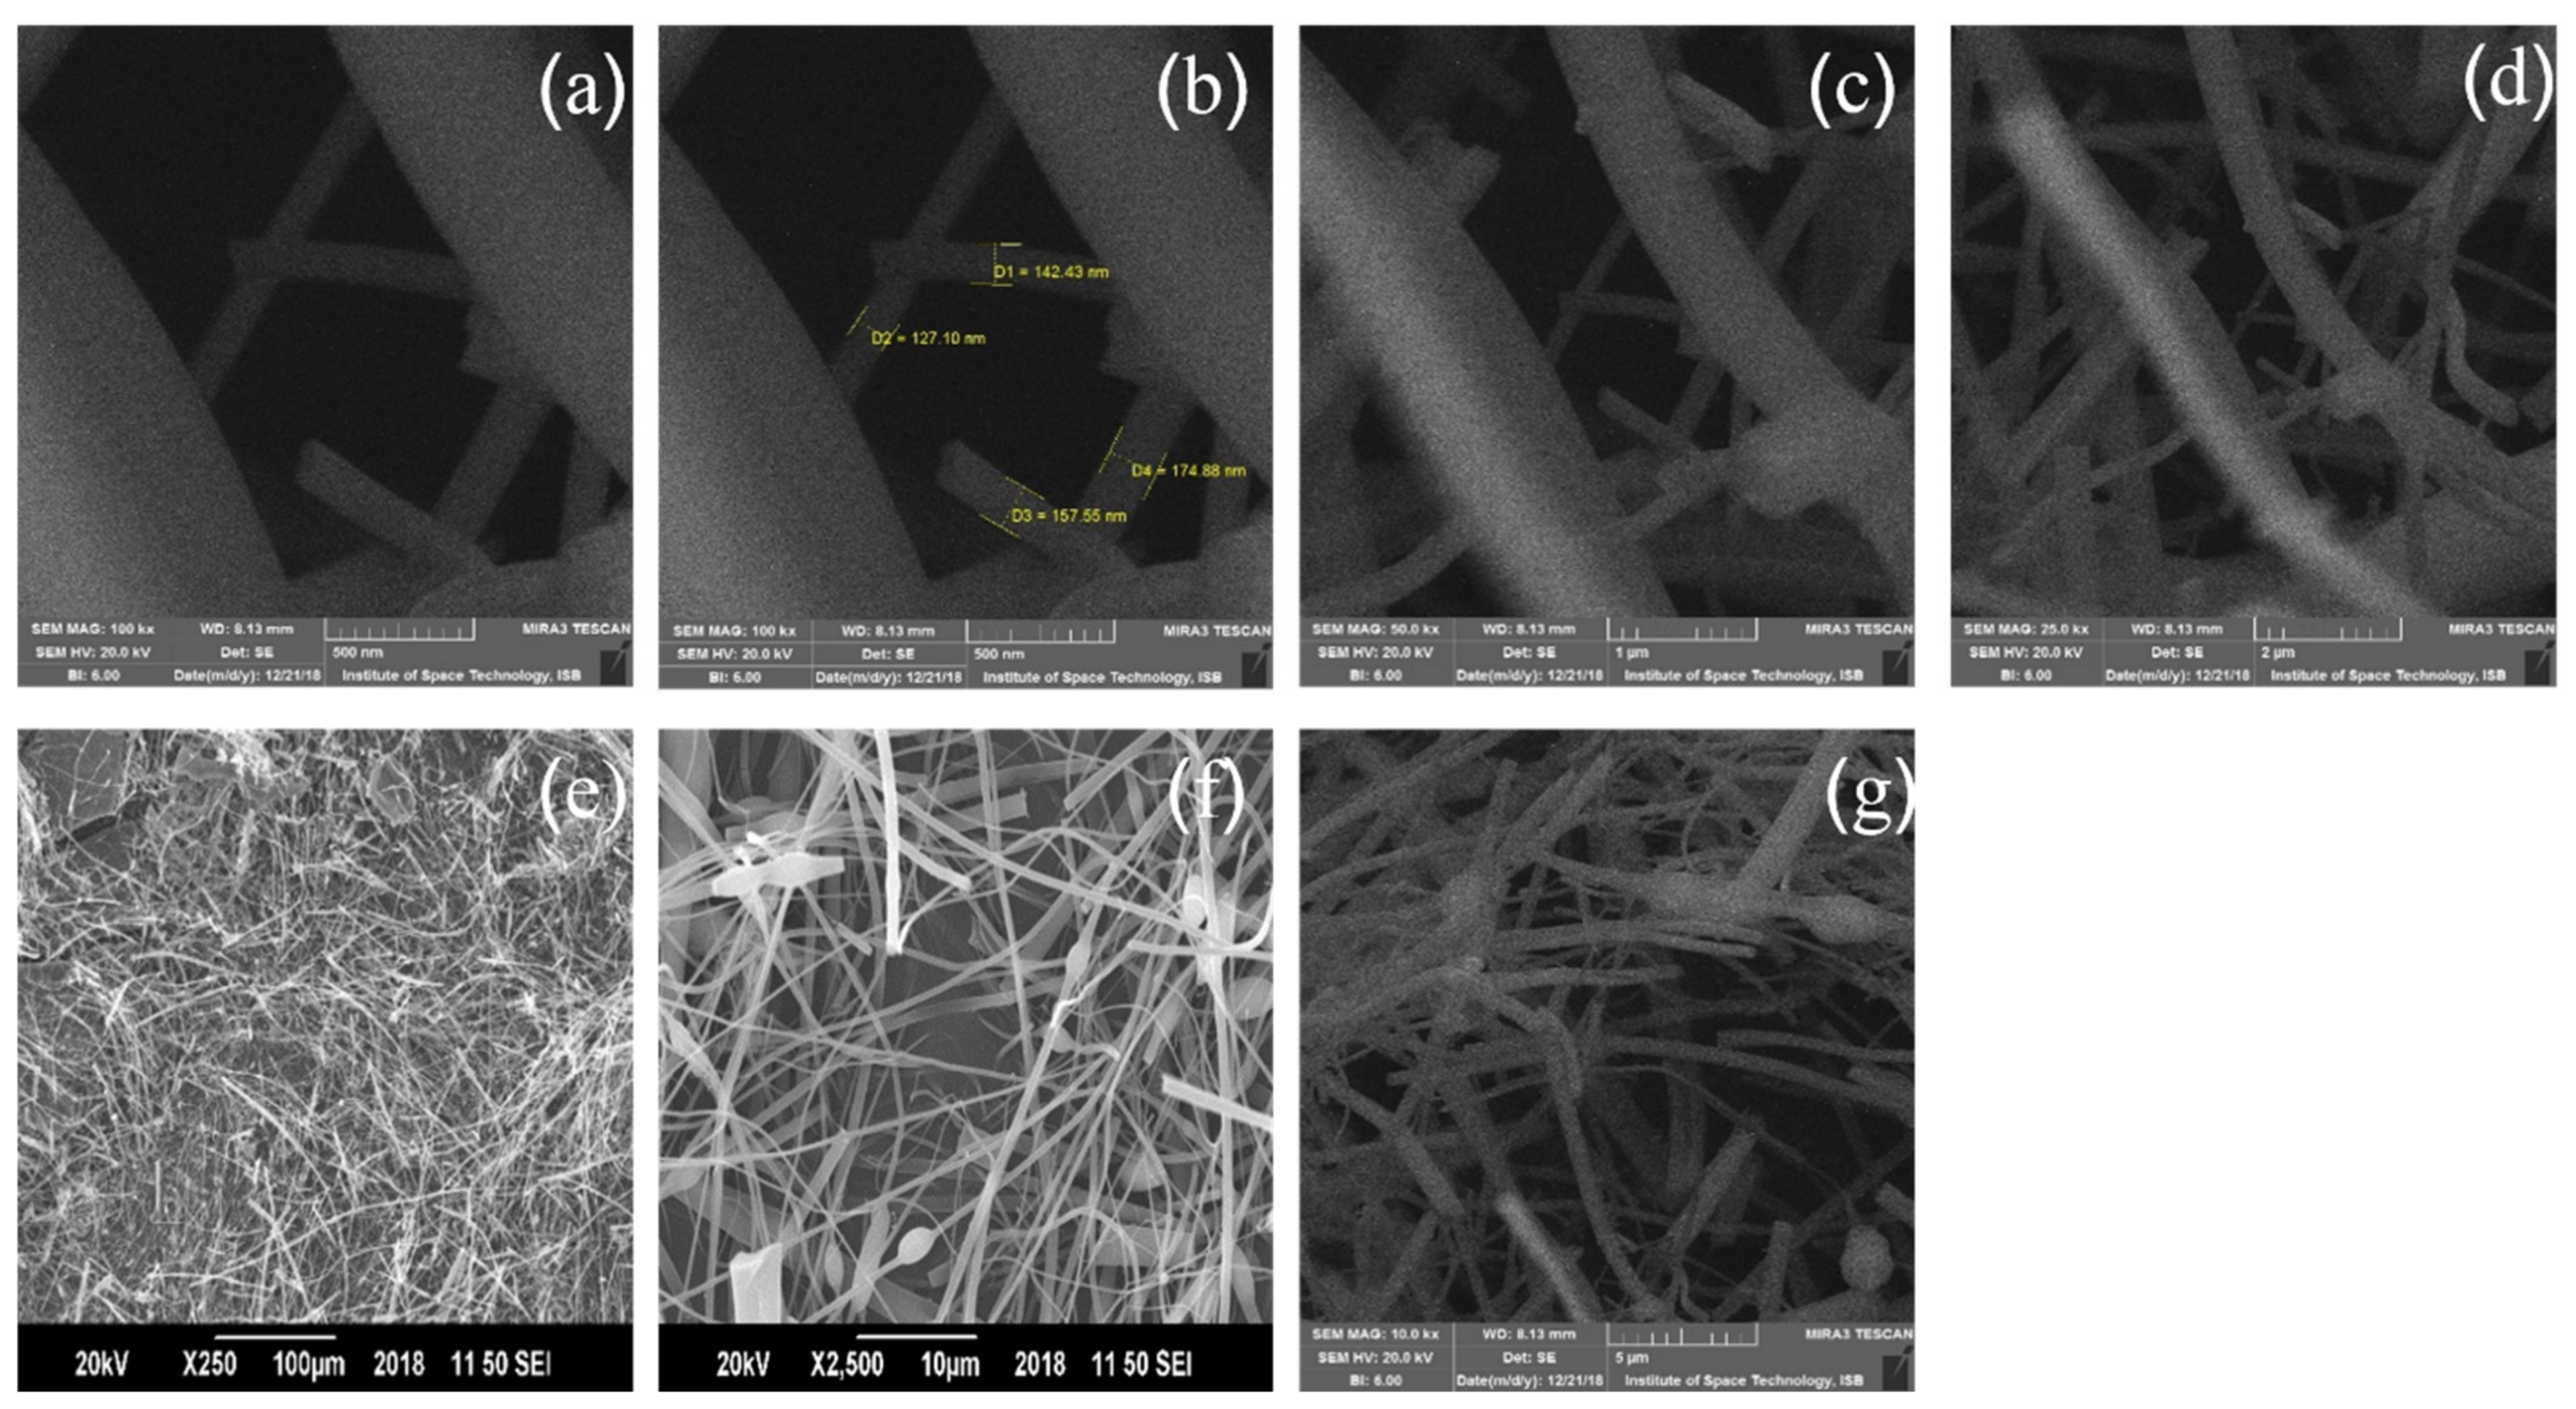
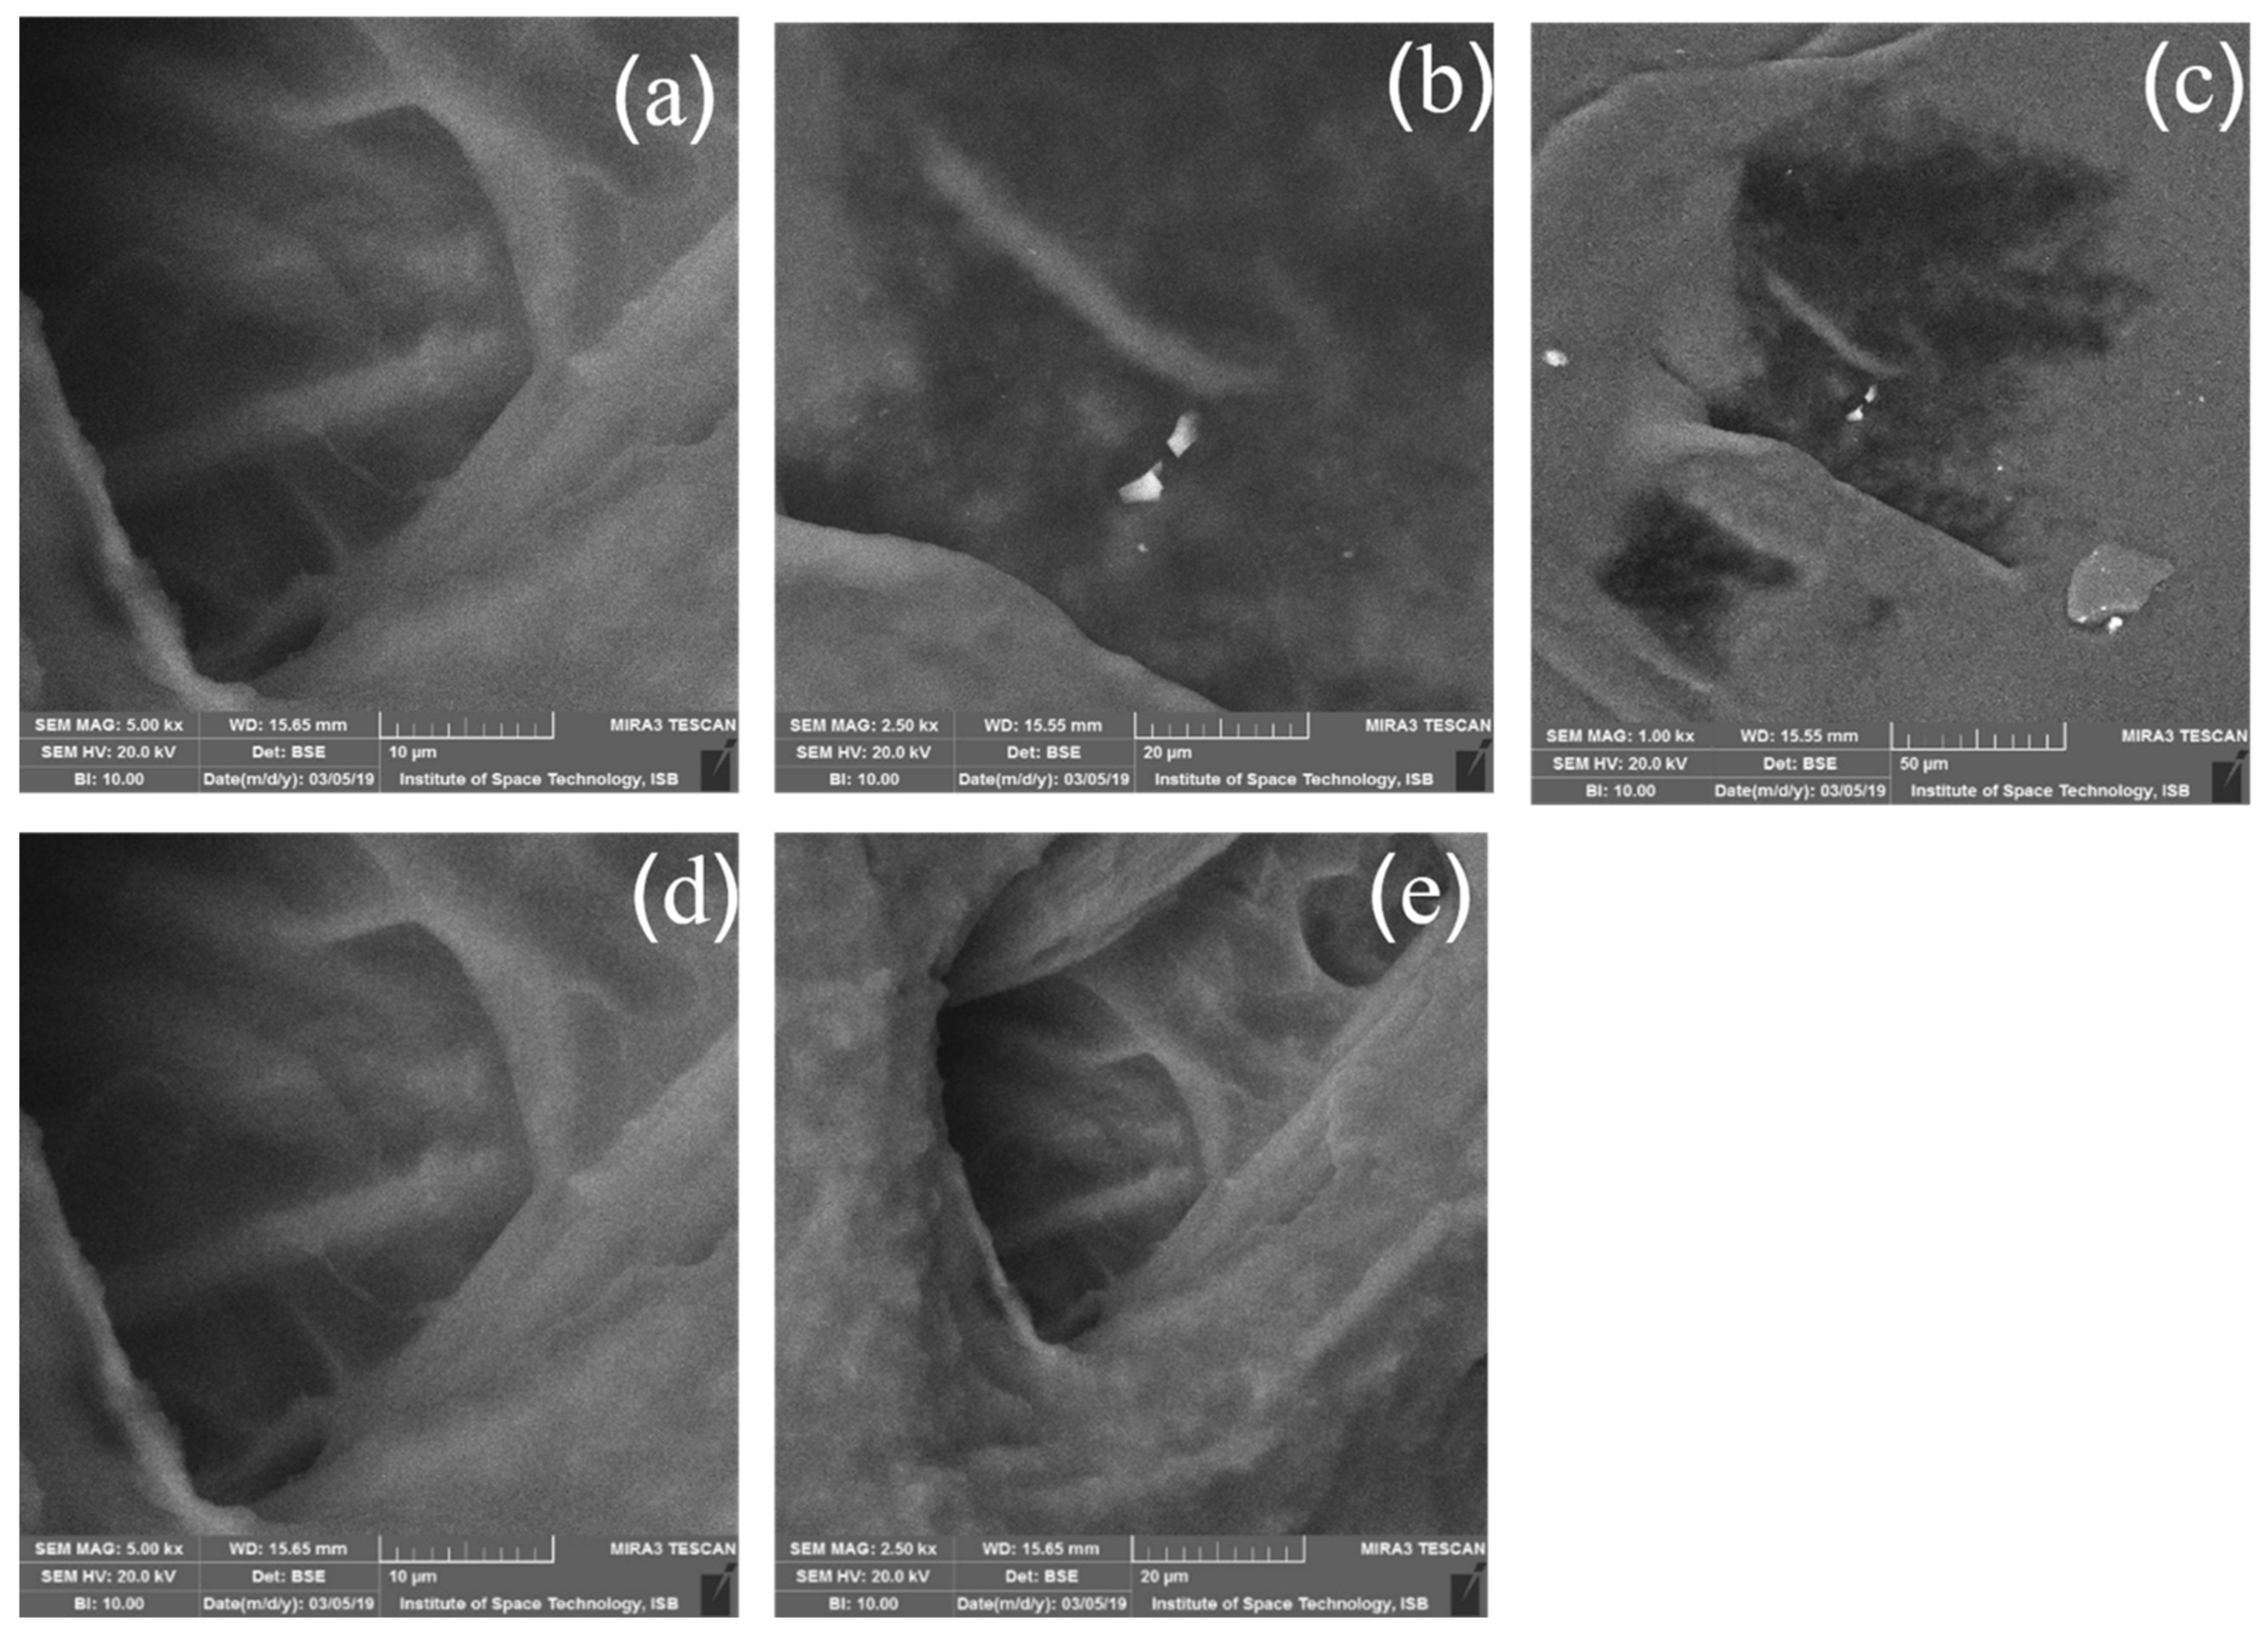
3.3. SEM Analysis
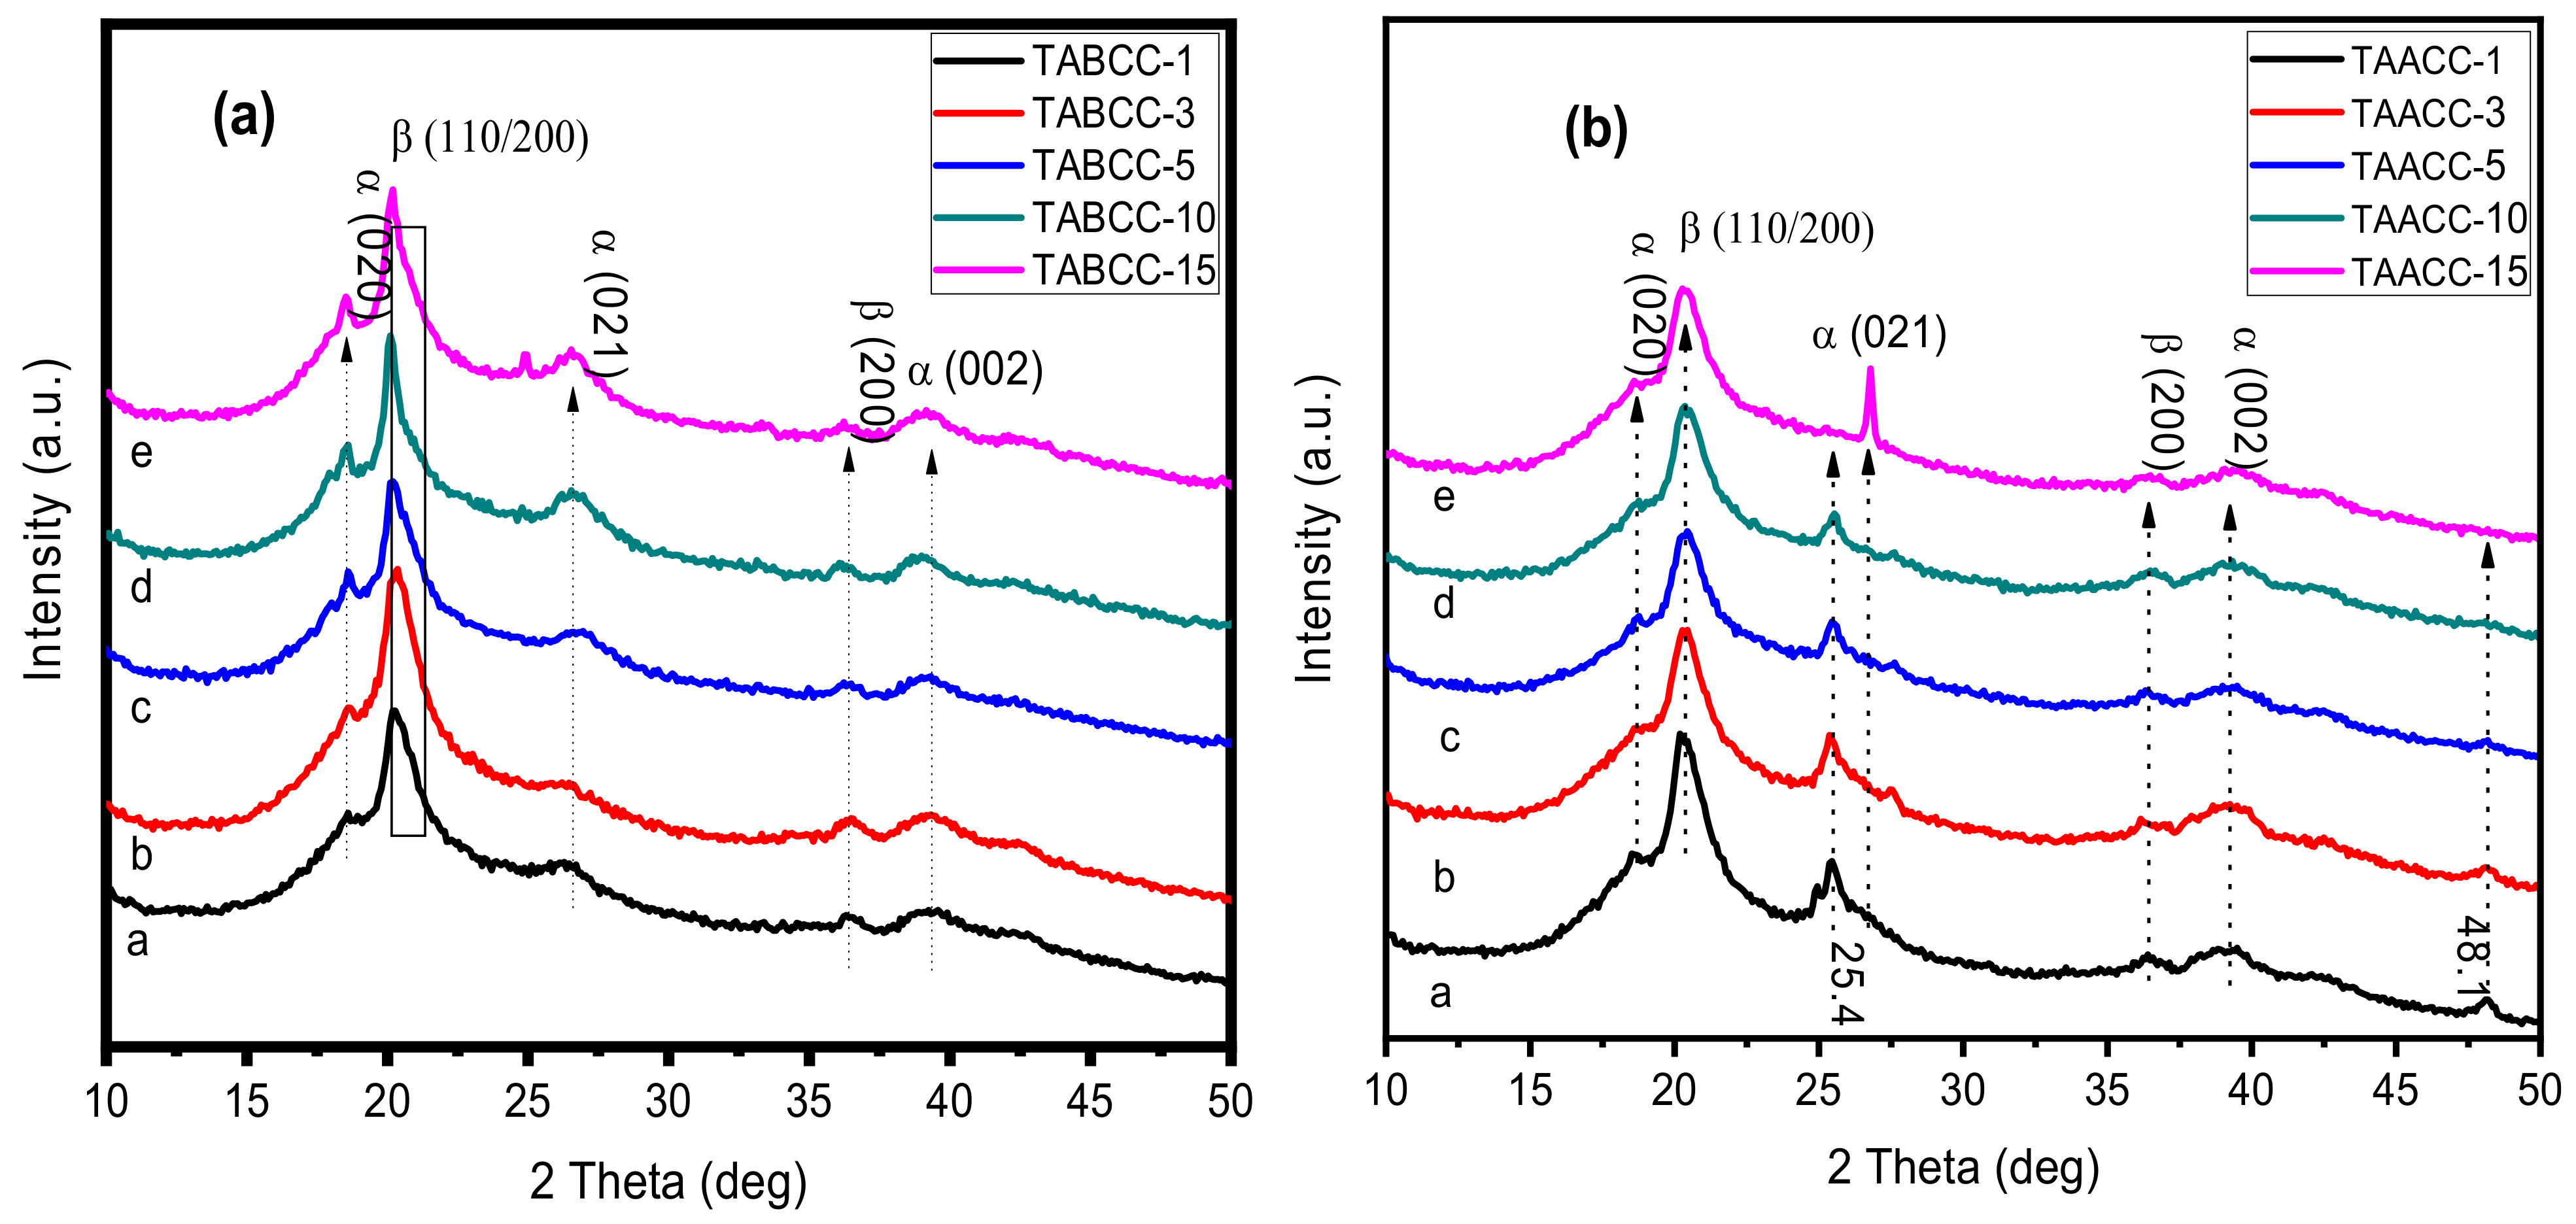
3.4. XRD Analysis
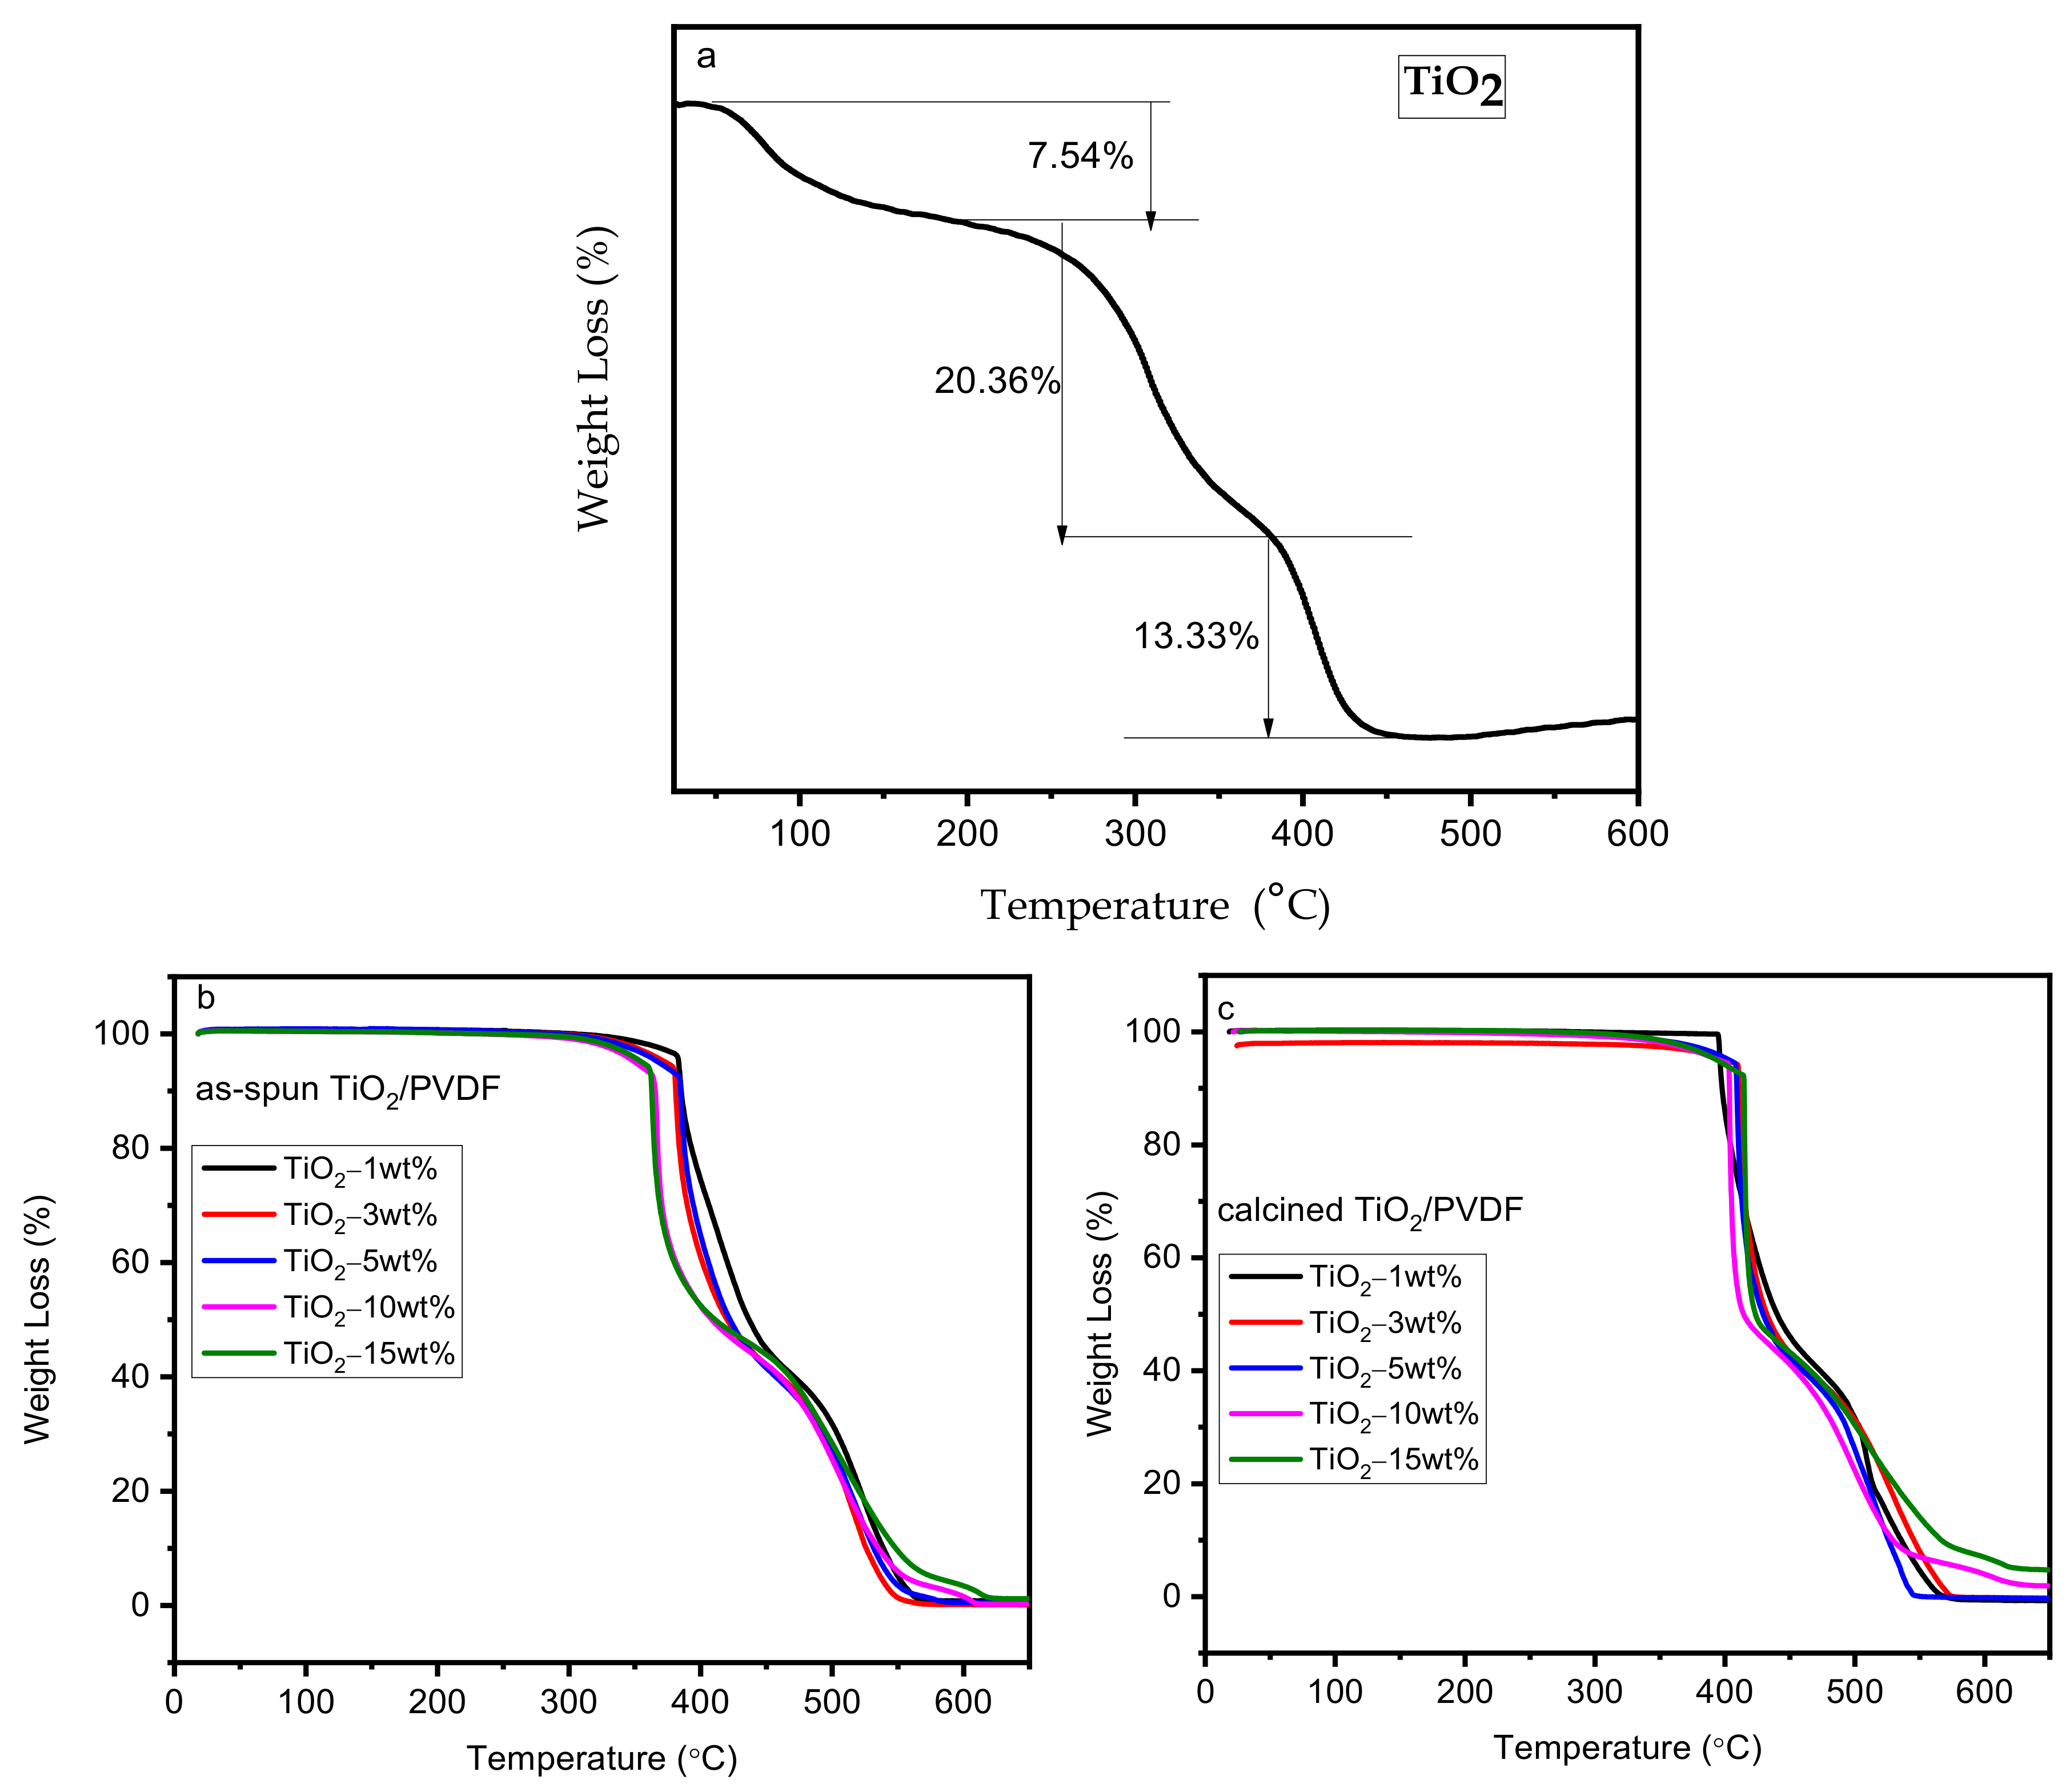
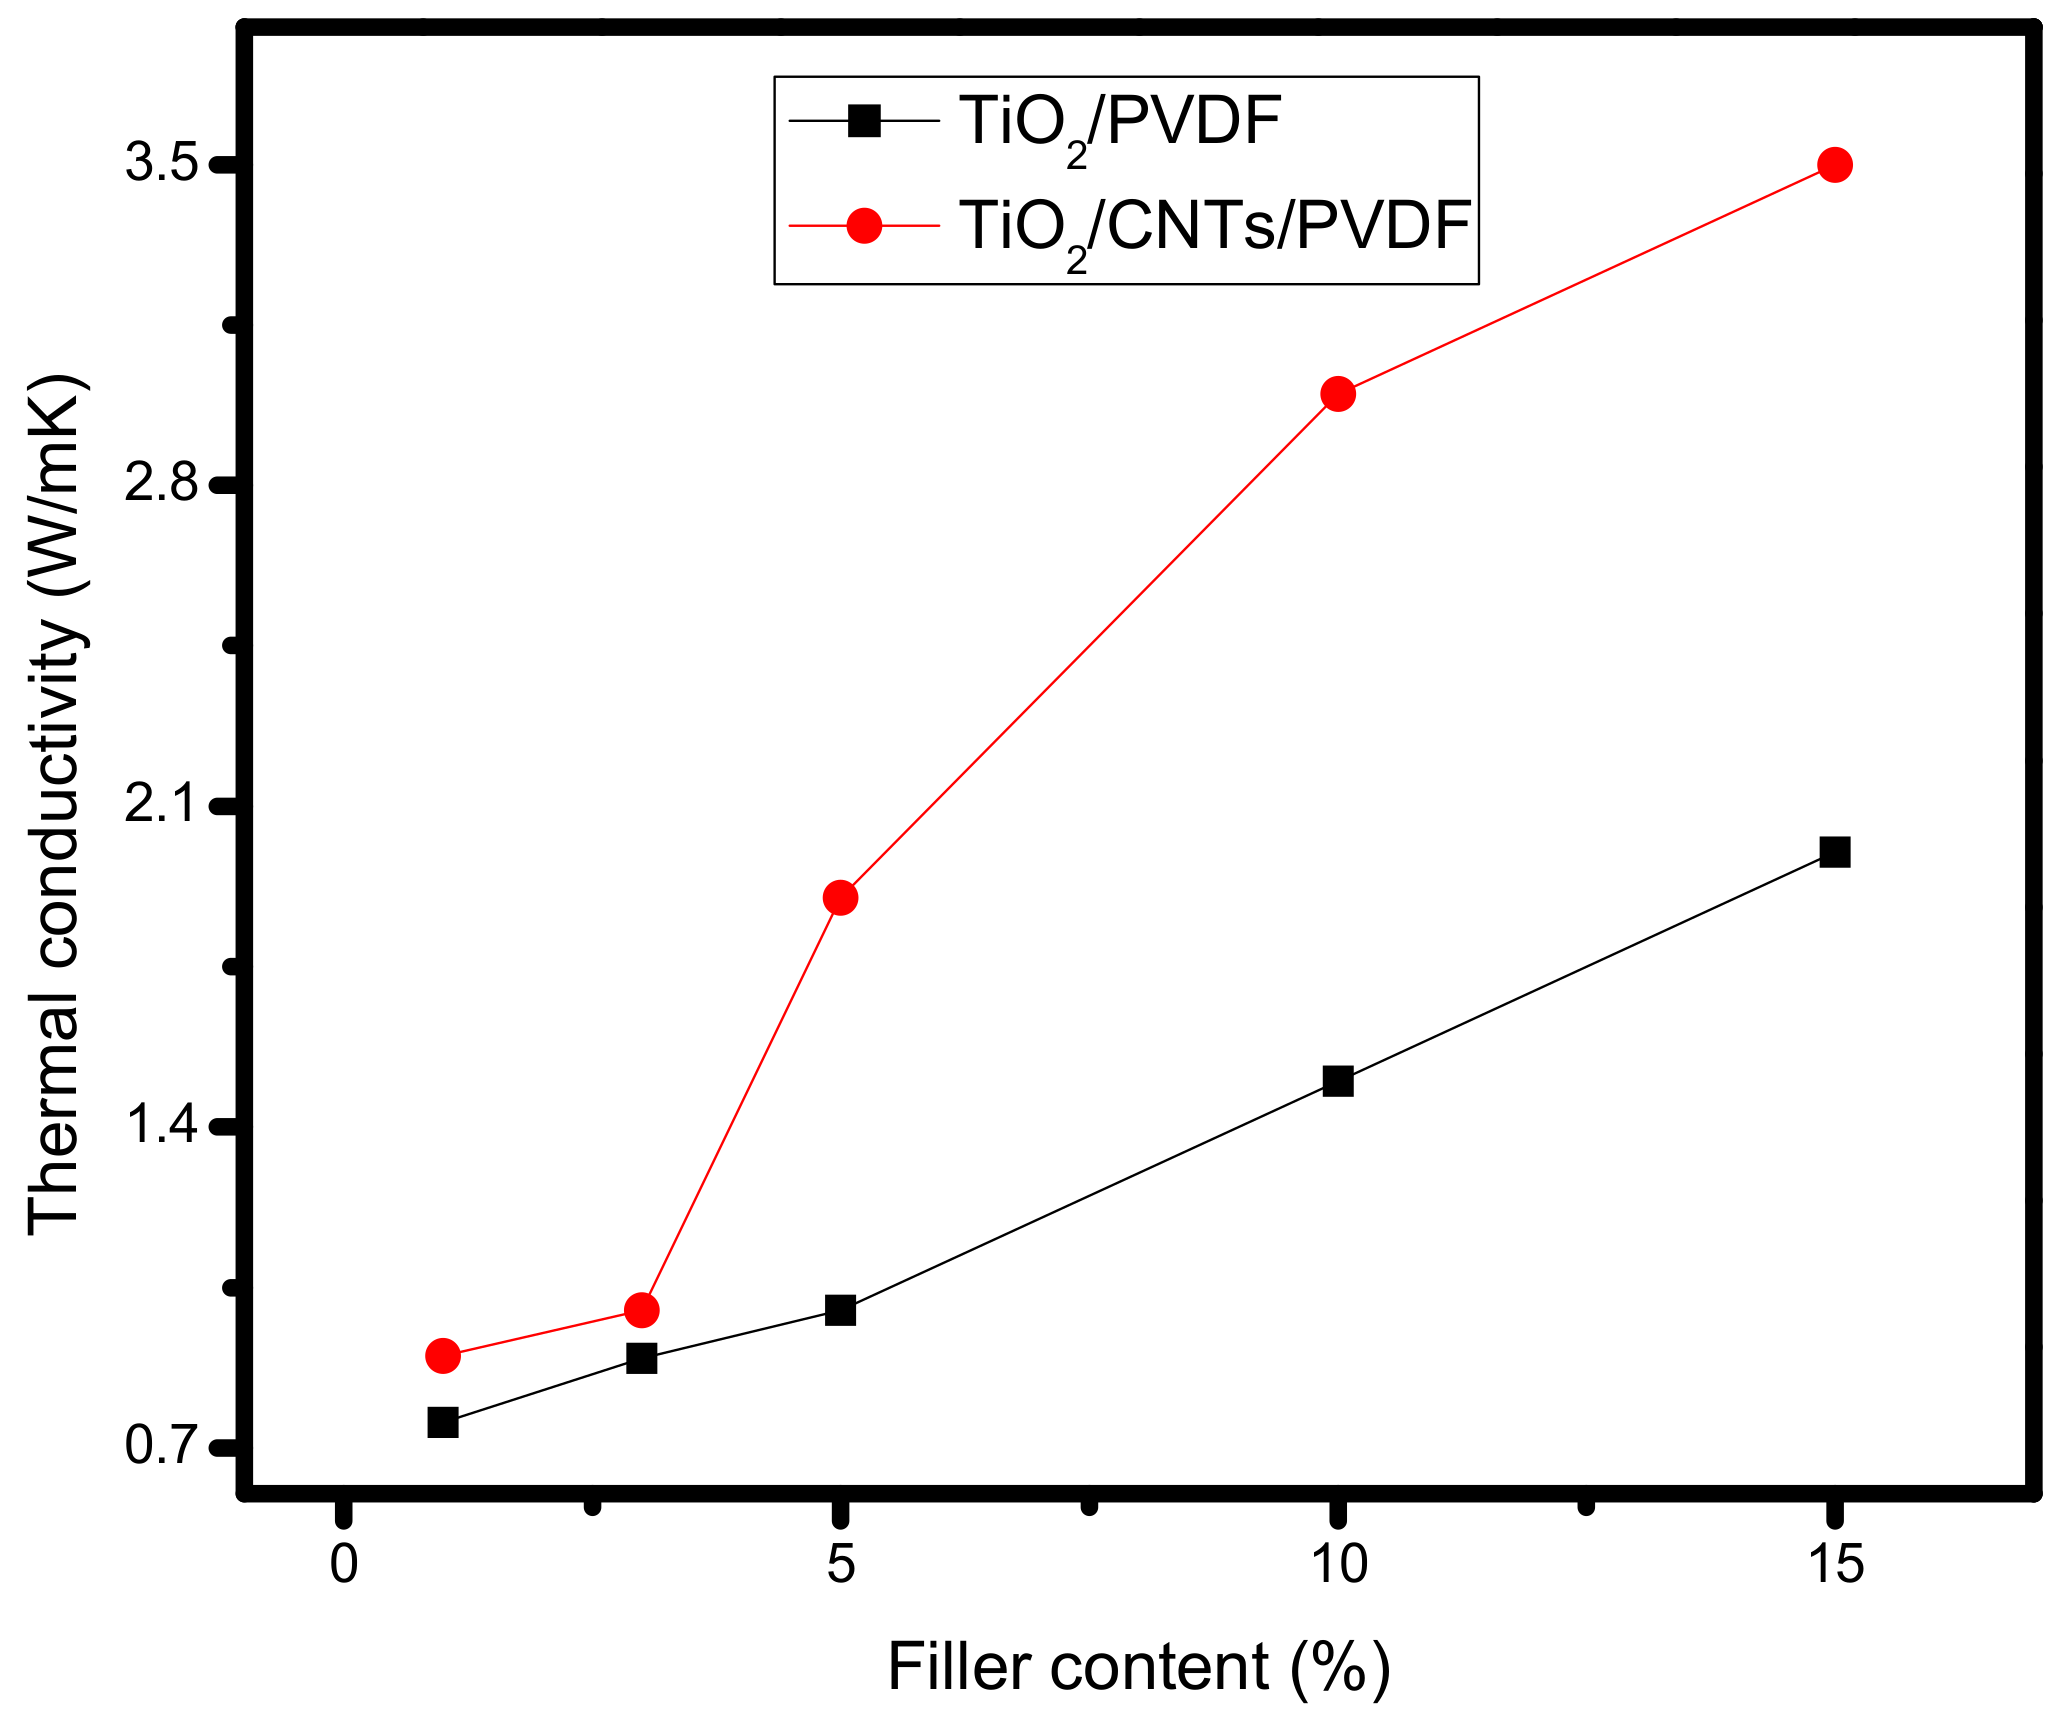
3.5. Thermal and Mechanical Stability
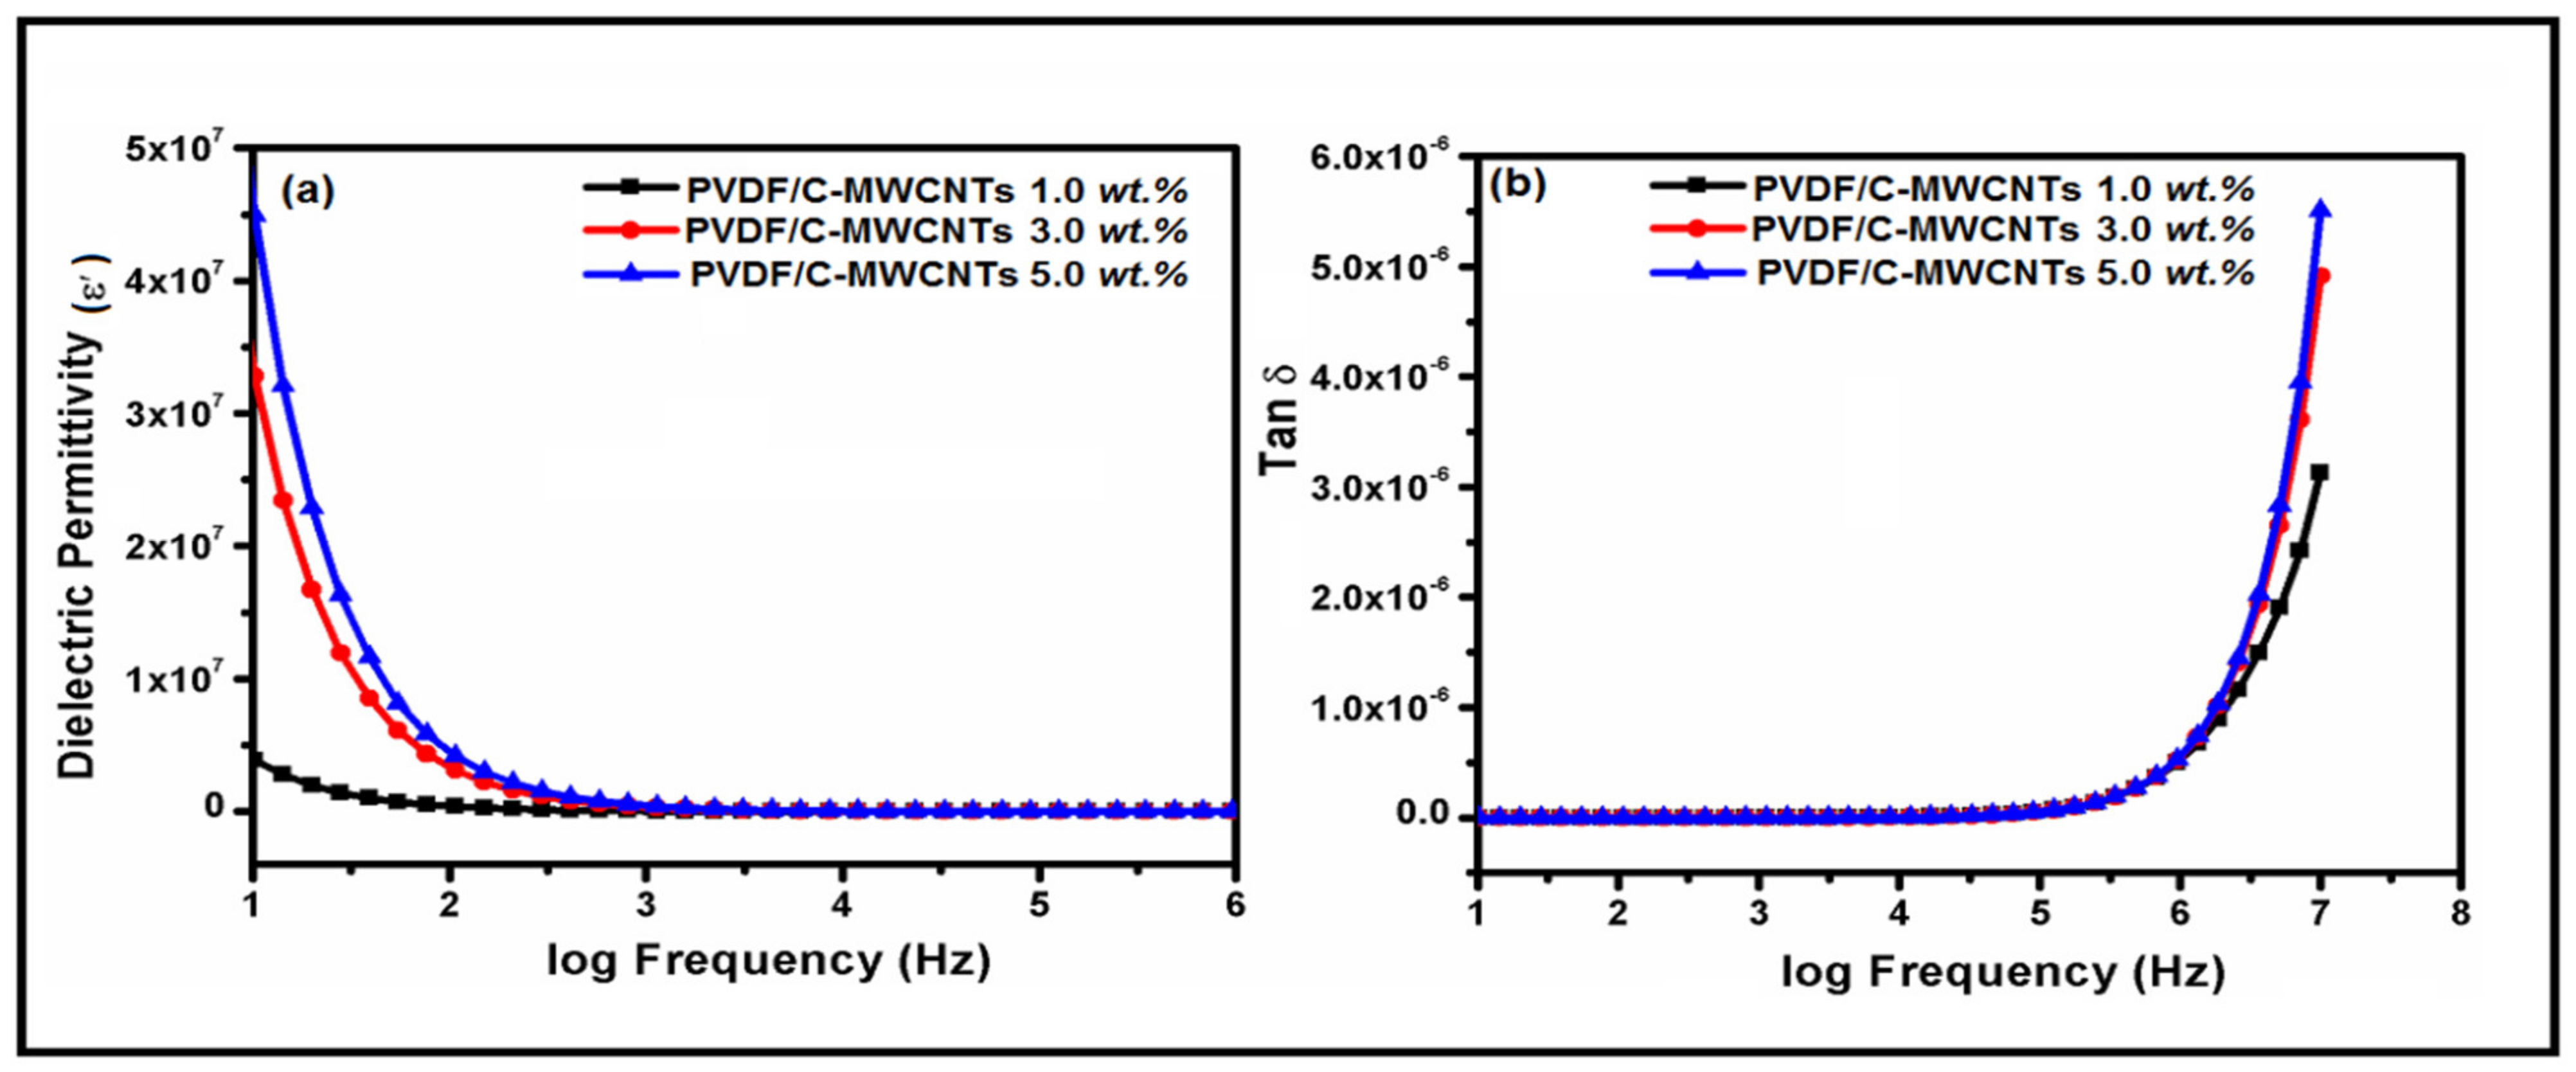
3.6. Dielectric Constant
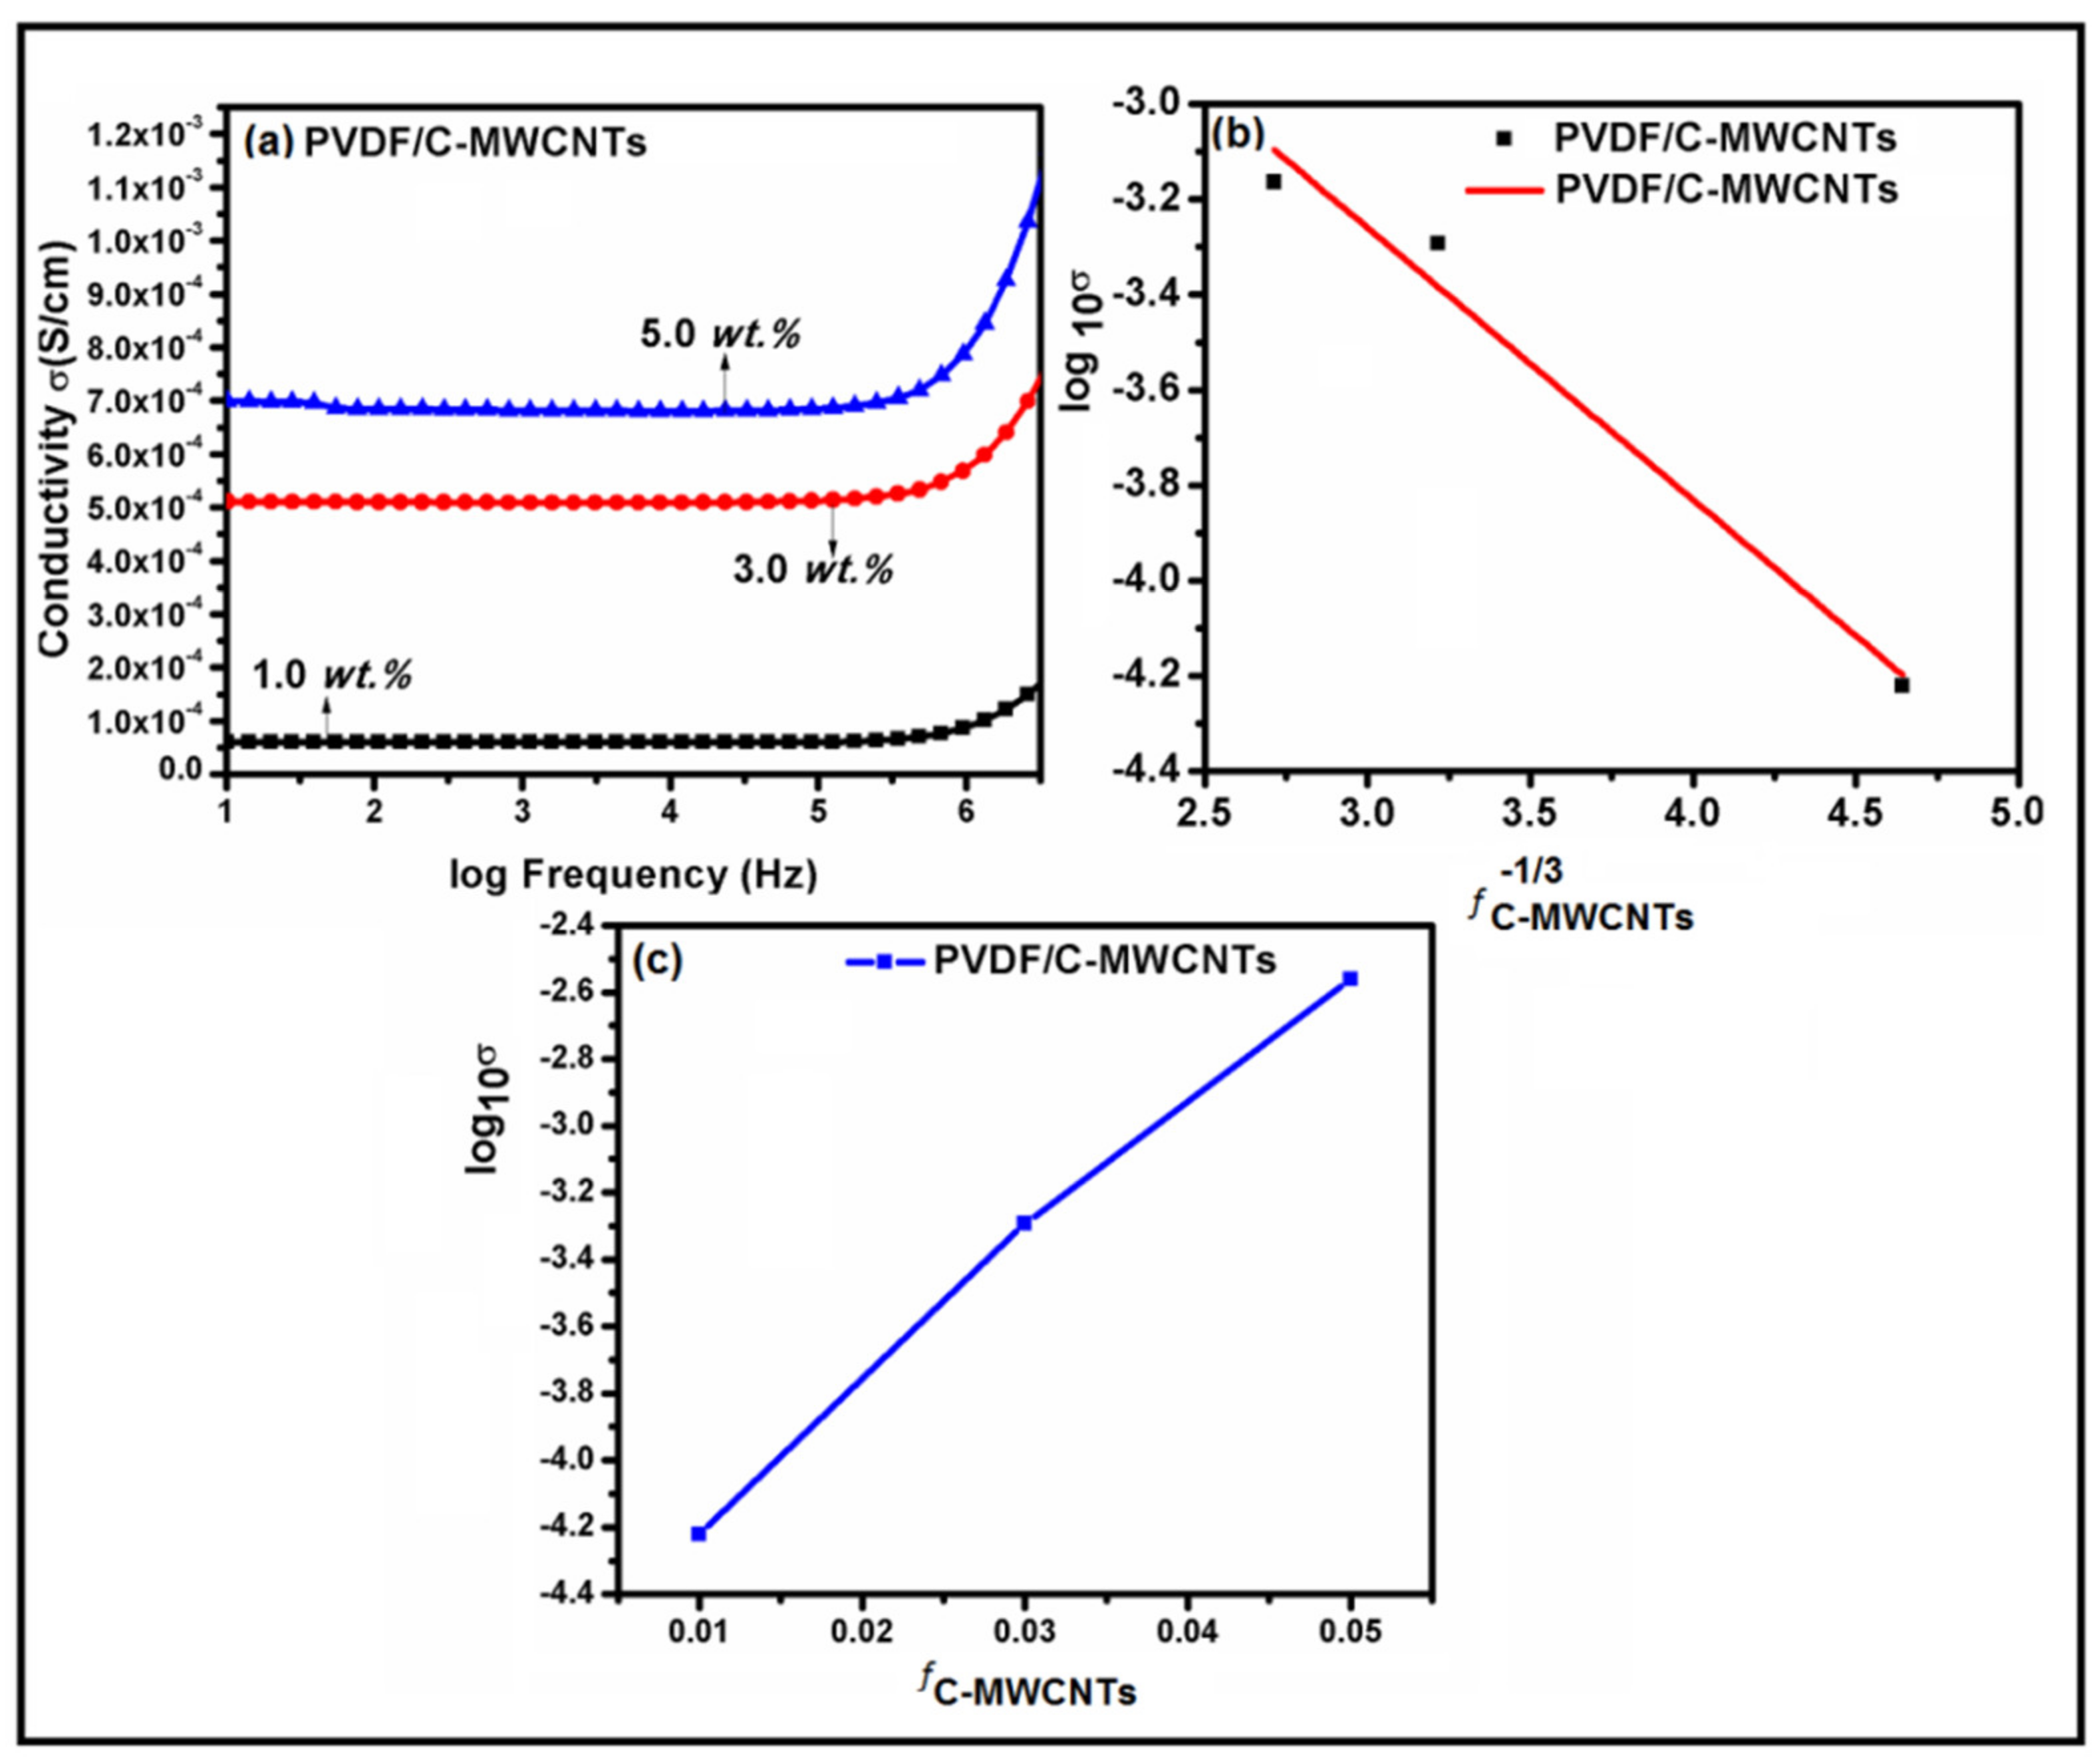
3.7. AC Electrical Conductivity
4. Conclusions
Author Contributions
Funding
Institutional Review Board Statement
Informed Consent Statement
Data Availability Statement
Conflicts of Interest
References
- Hong, S.; Liow, C.H.; Yuk, J.M.; Byon, H.R.; Yang, Y.; Cho, E.; Yeom, J.; Park, G.; Kang, H.; Kim, S.; et al. Reducing Time to Discovery: Materials and Molecular Modeling, Imaging, Informatics, and Integration. ACS Nano 2021, 15, 3971–3995. [Google Scholar] [CrossRef] [PubMed]
- Liu, G.; Zhang, X.; Chen, X.; He, Y.; Cheng, L.; Huo, M.; Yin, J.; Hao, F.; Chen, S.; Wang, P.; et al. Additive manufacturing of structural materials. Mater. Sci. Eng. R Rep. 2021, 145, 100596. [Google Scholar] [CrossRef]
- Yadav, P.K.; Ajitha, B.; Reddy, Y.A.K.; Sreedhar, A. Recent advances in development of nanostructured photodetectors from ultraviolet to infrared region: A review. Chemosphere 2021, 279, 130473. [Google Scholar] [CrossRef] [PubMed]
- Nehra, M.; Dilbaghi, N.; Marrazza, G.; Kaushik, A.; Abolhassani, R.; Mishra, Y.K.; Kim, K.H.; Kumar, S. 1D semiconductor nanowires for energy conversion, harvesting and storage applications. Nano Energy 2020, 76, 104991. [Google Scholar] [CrossRef]
- Wang, D.; Wang, L.; Shen, G. Nanofiber/nanowires-based flexible and stretchable sensors. J. Semicond. 2020, 41, 041605. [Google Scholar] [CrossRef]
- Altaf, A.A.; Ahmed, M.; Hamayun, M.; Kausar, S.; Waqar, M.; Badshah, A. Titania nano-fibers: A review on synthesis and utilities. Inorganica Chim. Acta 2019, 501, 119268. [Google Scholar] [CrossRef]
- Zhao, L.; Duan, G.; Zhang, G.; Yang, H.; He, S.; Jiang, S. Electrospun Functional Materials toward Food Packaging Applications: A Review. Nanomaterials 2020, 10, 150. [Google Scholar] [CrossRef]
- Huang, C.; Thomas, N.L. Fabrication of porous fibers via electrospinning: Strategies and applications. Polym. Rev. 2019, 60, 595–647. [Google Scholar] [CrossRef]
- Pereira, C.; Pereira, A.M.; Freire, C.; Pinto, T.V.; Costa, R.S.; Teixeira, J.S. Nanoengineered textiles: From advanced functional nanomaterials to groundbreaking high-performance clothing. In Handbook of Functionalized Nanomaterials for Industrial Applications; Elsevier: Amsterdam, The Netherlands, 2020; pp. 611–714. [Google Scholar]
- Fattakhova-Rohlfing, D.; Zaleska, A.; Bein, T. Three-Dimensional Titanium Dioxide Nanomaterials. Chem. Rev. 2014, 114, 9487–9558. [Google Scholar] [CrossRef]
- Sun, M.-H.; Huang, S.-Z.; Chen, L.-H.; Li, Y.; Yang, X.-Y.; Yuan, Z.-Y.; Su, B.-L. Applications of hierarchically structured porous materials from energy storage and conversion, catalysis, photocatalysis, adsorption, separation, and sensing to biomedicine. Chem. Soc. Rev. 2016, 45, 3479–3563. [Google Scholar] [CrossRef]
- Liu, L.; Ma, W.; Zhang, Z. Macroscopic Carbon Nanotube Assemblies: Preparation, Properties, and Potential Applications. Small 2011, 7, 1504–1520. [Google Scholar] [CrossRef] [PubMed]
- Ahmed, S.; Cai, Y.; Ali, M.; Khanal, S.; Xu, S. Preparation and performance of nanoparticle-reinforced chitosan proton-exchange membranes for fuel-cell applications. J. Appl. Polym. Sci. 2018, 136, 46904. [Google Scholar] [CrossRef]
- Ahmed, S.; Cai, Y.; Ali, M.; Khannal, S.; Ahmad, Z.; Lu, Y.; Wang, S.; Xu, S. One-step phosphorylation of graphene oxide for the fabrication of nanocomposite membranes with enhanced proton conductivity for fuel cell applications. J. Mater. Sci. Mater. Electron. 2019, 30, 13056–13066. [Google Scholar] [CrossRef]
- Ahmed, S.; Cai, Y.; Ali, M.; Khannal, S.; Xu, S. Preparation and properties of alkyl benzene sulfonic acid coated boehmite/chitosan nanocomposite membranes with enhanced proton conductivity for proton exchange membrane fuel cells. Mater. Express 2019, 9, 42–50. [Google Scholar] [CrossRef]
- Hassan, M.; Afzal, A.; Tariq, M.; Ahmed, S. Synthesis of the hyper-branched polyamides and their effective utilization in adsorption and equilibrium isothermal study for cadmium ion uptake. J. Polym. Res. 2021, 28, 1–11. [Google Scholar] [CrossRef]
- Ahmed, S.; Arshad, T.; Zada, A.; Afzal, A.; Khan, M.; Hussain, A.; Hassan, M.; Ali, M.; Xu, S. Preparation and characterization of a novel sulfonated titanium oxide incorporated Chitosan nanocomposite membranes for fuel cell application. Membranes 2021, 11, 450. [Google Scholar] [CrossRef]
- Chae, S.R.; Yamamura, H.; Ikeda, K.; Watanabe, Y. Effect of pre-treatment on membrane fouling of PVDF (Polyvinylidene Fluoride) microfiltration membrane with different structures in a pilot-scale drinking water production system. Water Res. 2008, 42, 2029–2042. [Google Scholar] [CrossRef]
- Park, H.H.; Deshwal, B.R.; Jo, H.D.; Choi, W.K.; Kim, I.W.; Lee, H.K. Absorption of nitrogen dioxide by PVDF hollow fiber membranes in a G–L contactor. Desalination 2009, 243, 52–64. [Google Scholar] [CrossRef]
- Sessler, G. Piezoelectricity in polyvinylidenefluoride. J. Acoust. Soc. Am. 1981, 70, 1596–1608. [Google Scholar] [CrossRef]
- Seminara, L.; Capurro, M.; Cirillo, P.; Cannata, G.; Valle, M. Electromechanical characterization of piezoelectric PVDF polymer films for tactile sensors in robotics applications. Sens. Actuators A Phys. 2011, 169, 49–58. [Google Scholar] [CrossRef]
- Bensouici, F.; Souier, T.; Dakhel, A.; Iratni, A.; Tala-Ighil, R.; Bououdina, M. Synthesis, characterization and photocatalytic behavior of Ag doped TiO2 thin film Superlattices. Microstruct 2015, 85, 255–265. [Google Scholar] [CrossRef]
- Sahoo, N.G.; Rana, S.; Cho, J.W.; Li, L.; Chan, S.H. Polymer nanocomposites based on functionalized carbon nanotubes. Prog. Polym. Sci. 2010, 35, 837–867. [Google Scholar] [CrossRef]
- Kakanakova-Georgieva, A.; Gueorguiev, G.; Sangiovanni, D.G.; Suwannaharn, N.; Ivanov, I.G.; Cora, I.; Pécz, B.; Nicotra, G.; Giannazzo, F. Nanoscale phenomena ruling deposition and intercalation of AlN at the graphene/SiC interface. Nanoscale 2020, 12, 19470–19476. [Google Scholar] [CrossRef] [PubMed]
- Santos, D.R.B.; Rivelino, R.; Gueorguiev, G.K.; Kakanakova-Georgieva, A. Exploring 2D structures of indium oxide of different stoichiometry. CrystEngComm 2021, 23, 6661–6667. [Google Scholar] [CrossRef]
- Li, C.; Thostenson, E.T.; Chou, T.-W. Dominant role of tunneling resistance in the electrical conductivity of carbon nanotube–based composites. Appl. Phys. Lett. 2007, 91, 223114. [Google Scholar] [CrossRef]
- Eitan, A.; Jiang, K.; Dukes, D.; Andrews, A.R.; Schadler, L.S. Surface Modification of Multiwalled Carbon Nanotubes: Toward the Tailoring of the Interface in Polymer Composites. Chem. Mater. 2003, 15, 3198–3201. [Google Scholar] [CrossRef]
- Roach, P.; Shirtcliffe, N.J.; Newton, M.I. Progess in superhydrophobic surface development. Soft Matter 2007, 4, 224–240. [Google Scholar] [CrossRef]
- Hassan, M.; Abbas, G.; Li, N.; Afzal, A.; Haider, Z.; Ahmed, S.; Xu, X.; Pan, C.; Peng, Z. Significance of Flexible Substrates for Wearable and Implantable Devices: Recent Advances and Perspectives. Adv. Mater. Technol. 2021, 7, 2100773. [Google Scholar] [CrossRef]
- Al-Saleh, M.H.; Sundararaj, U. A review of vapor grown carbon nanofiber/polymer conductive composites. Carbon 2009, 47, 2–22. [Google Scholar] [CrossRef]
- Yu, H.; Huang, T.; Lu, M.; Mao, M.; Zhang, Q.; Wang, H. Enhanced power output of an electrospun PVDF/MWCNTs-based nanogenerator by tuning its conductivity. Nanotechnology 2013, 24, 405401. [Google Scholar] [CrossRef]
- Anderson, O.; Ottermann, C.R.; Kuschnereit, R.; Hess, P.; Bange, K. Density and Young’s modulus of thin TiO 2 films. Anal. Bioanal. Chem. 1997, 358, 315–318. [Google Scholar] [CrossRef]
- Mayo, M.J.; Siegel, R.W.; Narayanasamy, A.; Nix, W.D. Mechanical properties of nanophase TiO2 as determined by nanoindentation. J. Mater. Res. 1990, 5, 1073–1082. [Google Scholar] [CrossRef]
- Wu, B.; Heidelberg, A.; Boland, J.J.; Sader, J.E.; Sun, X.M.; Li, Y.D. Microstructurehardened silver nanowires. Nano Lett. 2006, 6, 468–472. [Google Scholar] [CrossRef] [PubMed]
- Ahn, K.; Kim, K.; Kim, J. Thermal conductivity and electric properties of epoxy composites filled with TiO2 -coated copper nanowire. Polymer 2015, 76, 313–320. [Google Scholar] [CrossRef]
- Han, Z.D.; Fin, A. Thermal conductivity of carbon nanotubes and their polymer nanocomposites: A review. Prog. Polym. Sci. 2011, 36, 914–944. [Google Scholar] [CrossRef]


| Sample | PVDF wt% | MWCNTswt% | Uncalcined TiO2 wt% | Sample | PVDF wt% | MWCNTs wt% | Calcined TiO2 wt% |
|---|---|---|---|---|---|---|---|
| PVDF/TiO2 (1) | 99 | 0 | 1 | PVDF/TiO2 (1) | 99 | 0 | 1 |
| PVDF/TiO2 (3) | 97 | 0 | 3 | PVDF/TiO2 (3) | 97 | 0 | 3 |
| PVDF/TiO2 (5) | 95 | 0 | 5 | PVDF/TiO2 (5) | 95 | 0 | 5 |
| PVDF/TiO2 (10) | 90 | 0 | 10 | PVDF/TiO2 (10) | 90 | 0 | 10 |
| PVDF/TiO2 (15) | 85 | 0 | 15 | PVDF/TiO2 (15) | 85 | 0 | 15 |
| PVDF/TiO2/MWCNTs (1) | 99 | 0.5 | 0.5 | PVDF/TiO2/MWCNTs (1) | 99 | 0.5 | 0.5 |
| PVDF/TiO2/MWCNTs (3) | 97 | 1.5 | 1.5 | PVDF/TiO2/MWCNTs (3) | 97 | 1.5 | 1.5 |
| PVDF/TiO2/MWCNTs (5) | 95 | 2.5 | 2.5 | PVDF/TiO2/MWCNTs (5) | 95 | 2.5 | 2.5 |
| PVDF/TiO2/MWCNTs (10) | 90 | 5 | 5 | PVDF/TiO2/MWCNTs (10) | 90 | 5 | 5 |
| PVDF/TiO2/MWCNTs (15) | 85 | 7.5 | 7.5 | PVDF/TiO2/MWCNTs (15) | 85 | 7.5 | 7.5 |
| Sample PVP wt% | TiO2 wt% | ||||||
| 10 | 90 |
| Element | Weight% | Atomic% |
|---|---|---|
| O K | 33.46 | 60.09 |
| Ti K | 66.54 | 39.91 |
| Totals | 100.00 |
| Sample ID | Tensile Strength | Elongation at Break |
|---|---|---|
| TA | 1.57 ± 3.9 | 35.71 ± 3.7 |
| TA-1 | 1.61 ± 4.3 | 44.31 ± 3.2 |
| TA-2 | 1.70 ± 3.1 | 45.81 ± 3.2 |
| TA-3 | 1.97 ± 2.7 | 50.04 ± 2.5 |
| TA-4 | 2.04 ± 2.2 | 53.55 ± 2.6 |
| TA-5 | 2.19 ± 2.3 | 56.12 ± 2.1 |
Publisher’s Note: MDPI stays neutral with regard to jurisdictional claims in published maps and institutional affiliations. |
© 2022 by the authors. Licensee MDPI, Basel, Switzerland. This article is an open access article distributed under the terms and conditions of the Creative Commons Attribution (CC BY) license (https://creativecommons.org/licenses/by/4.0/).
Share and Cite
Dilbraiz, M.A.; Nawaz, M.; Imtiaz, M.; Ahmad, P.; Haq, S.; Rehman, Z.U.; Ullah, H.; Khandaker, M.U.; Tamam, N.; Sulieman, A.; et al. Synthesis of One-Dimensional Titanium Oxide Nanowires for Polyvinylidene Fluoride Membrane Optimization. Crystals 2022, 12, 1164. https://doi.org/10.3390/cryst12081164
Dilbraiz MA, Nawaz M, Imtiaz M, Ahmad P, Haq S, Rehman ZU, Ullah H, Khandaker MU, Tamam N, Sulieman A, et al. Synthesis of One-Dimensional Titanium Oxide Nanowires for Polyvinylidene Fluoride Membrane Optimization. Crystals. 2022; 12(8):1164. https://doi.org/10.3390/cryst12081164
Chicago/Turabian StyleDilbraiz, Muhammad Arsalan, Mohsan Nawaz, Mr. Imtiaz, Pervaiz Ahmad, Sirajul Haq, Zia Ur Rehman, Hameed Ullah, Mayeen Uddin Khandaker, Nissren Tamam, Abdelmoneim Sulieman, and et al. 2022. "Synthesis of One-Dimensional Titanium Oxide Nanowires for Polyvinylidene Fluoride Membrane Optimization" Crystals 12, no. 8: 1164. https://doi.org/10.3390/cryst12081164