
Property Variation of Extruded Mg-Gd Alloys by Mn Addition and Processing


Abstract
:1. Introduction
2. Materials and Methods
3. Results
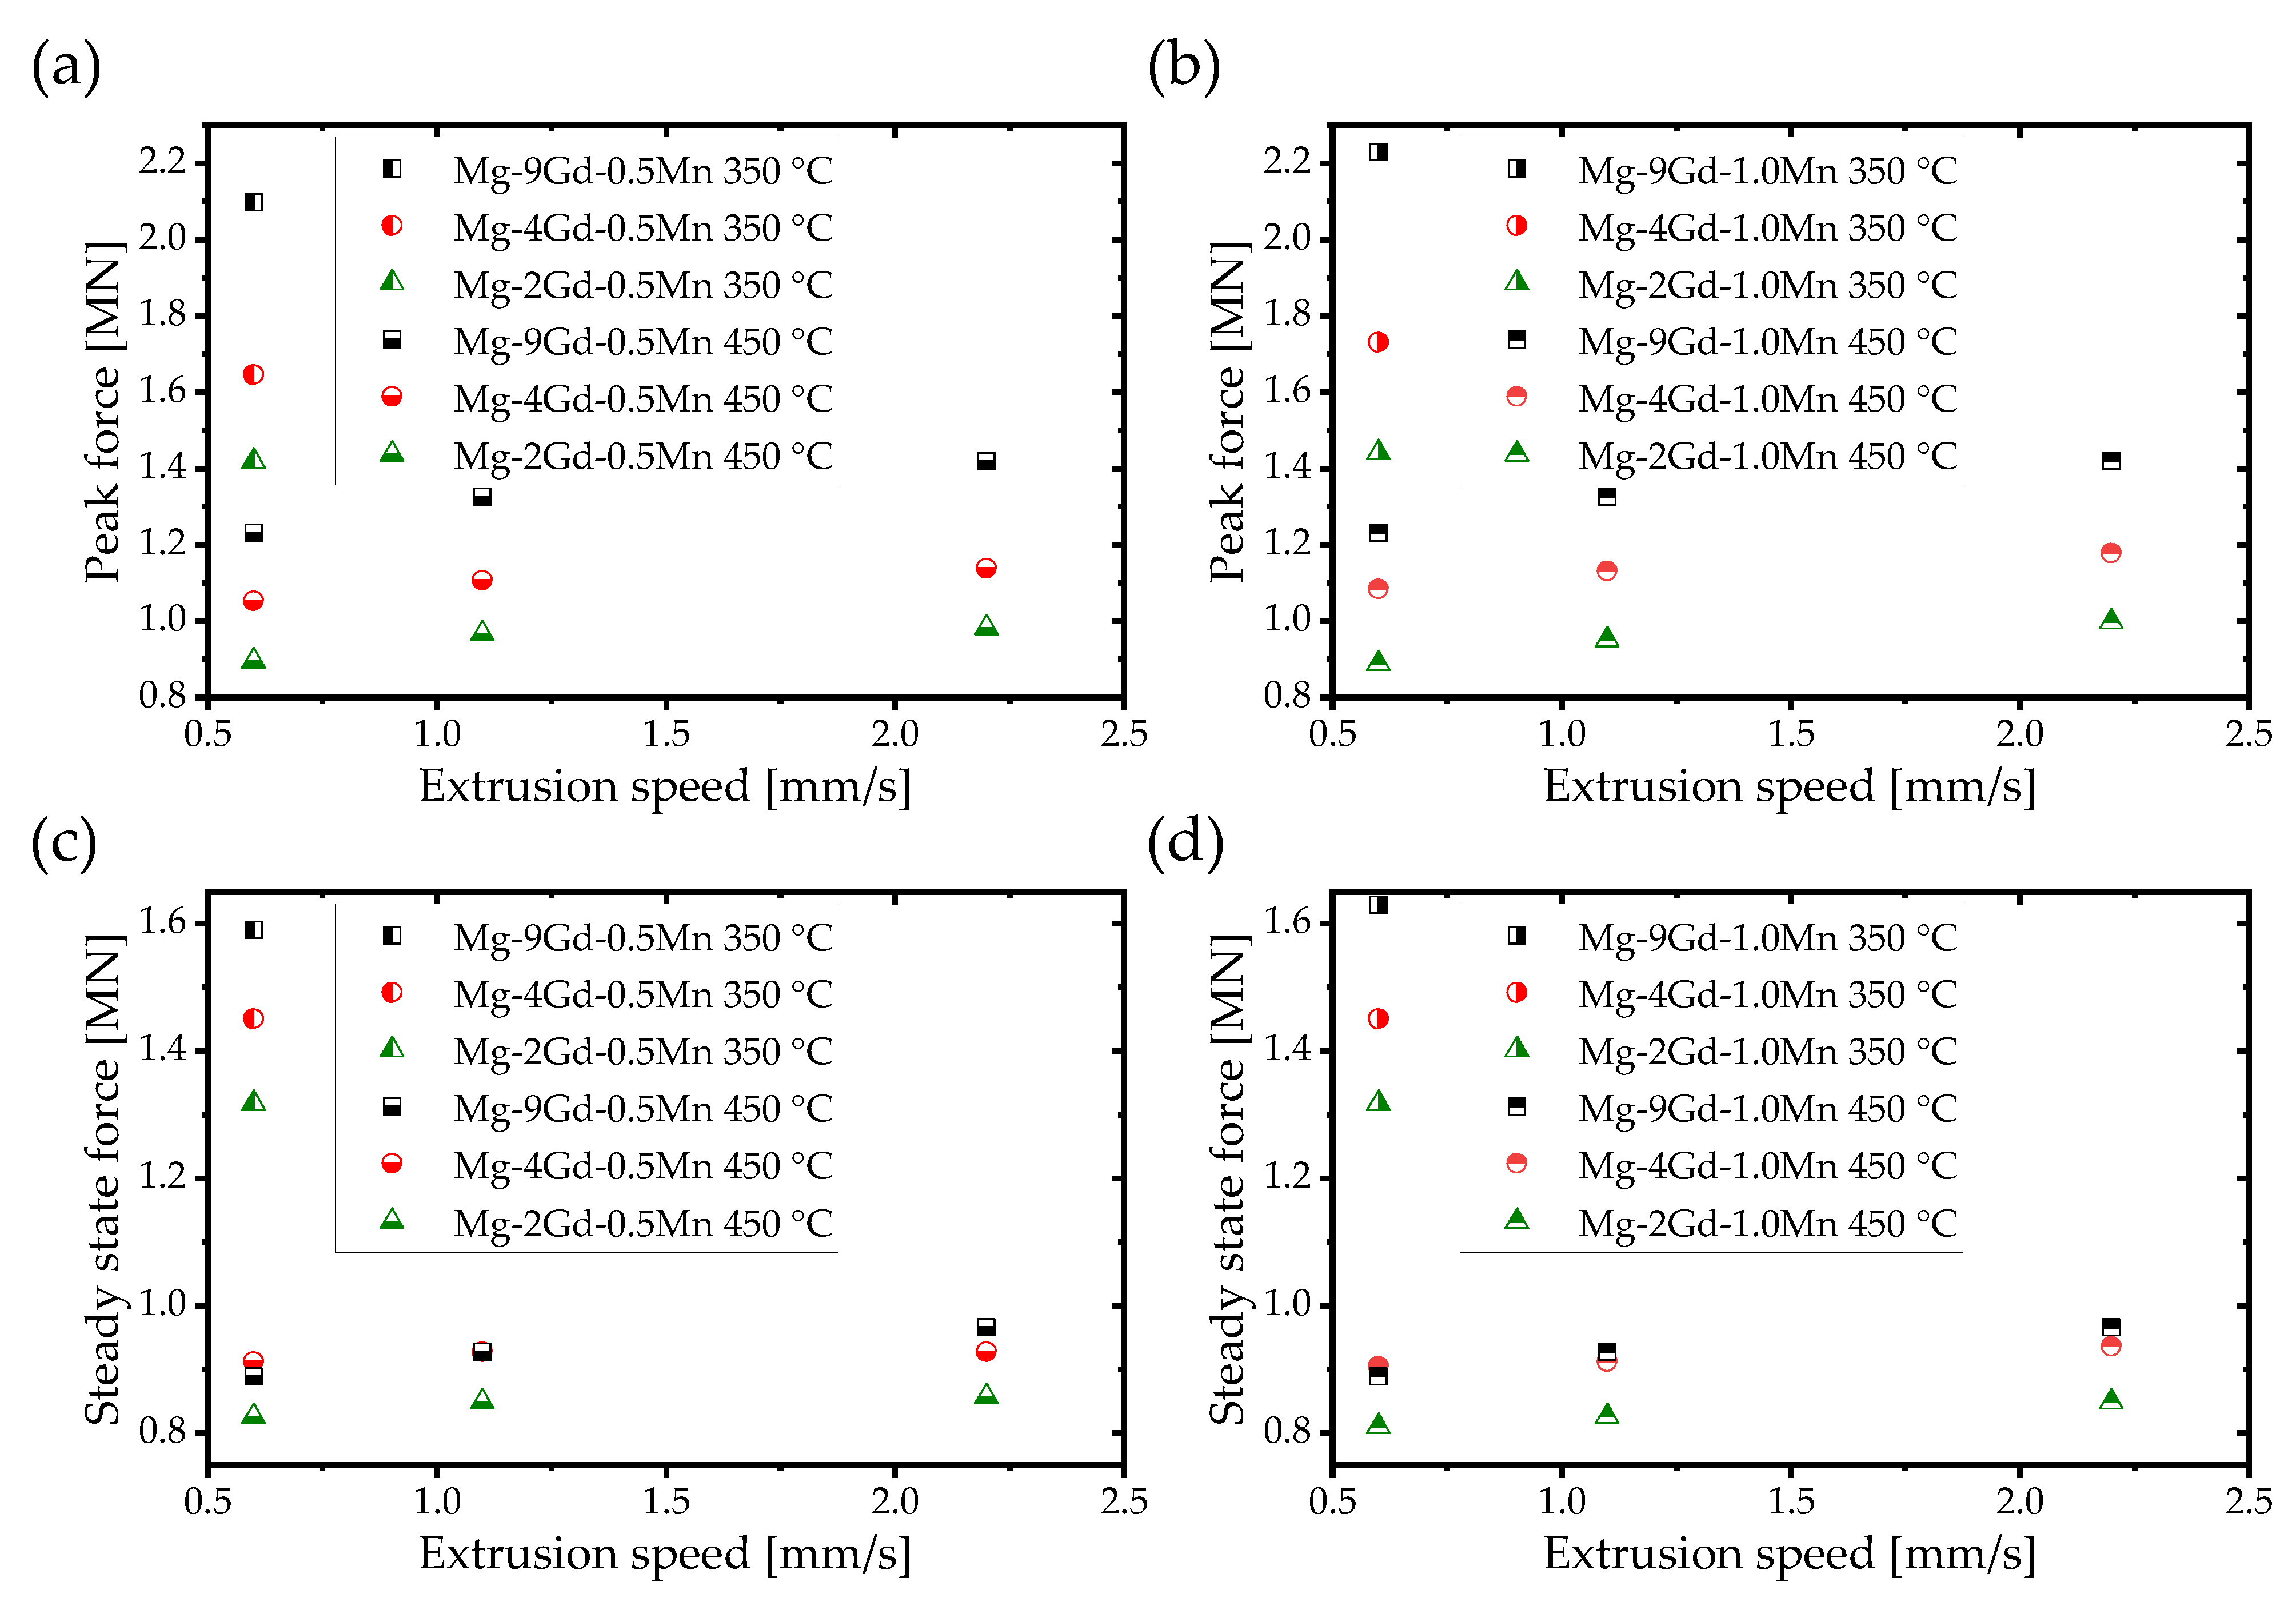
3.1. Extrusion Forces
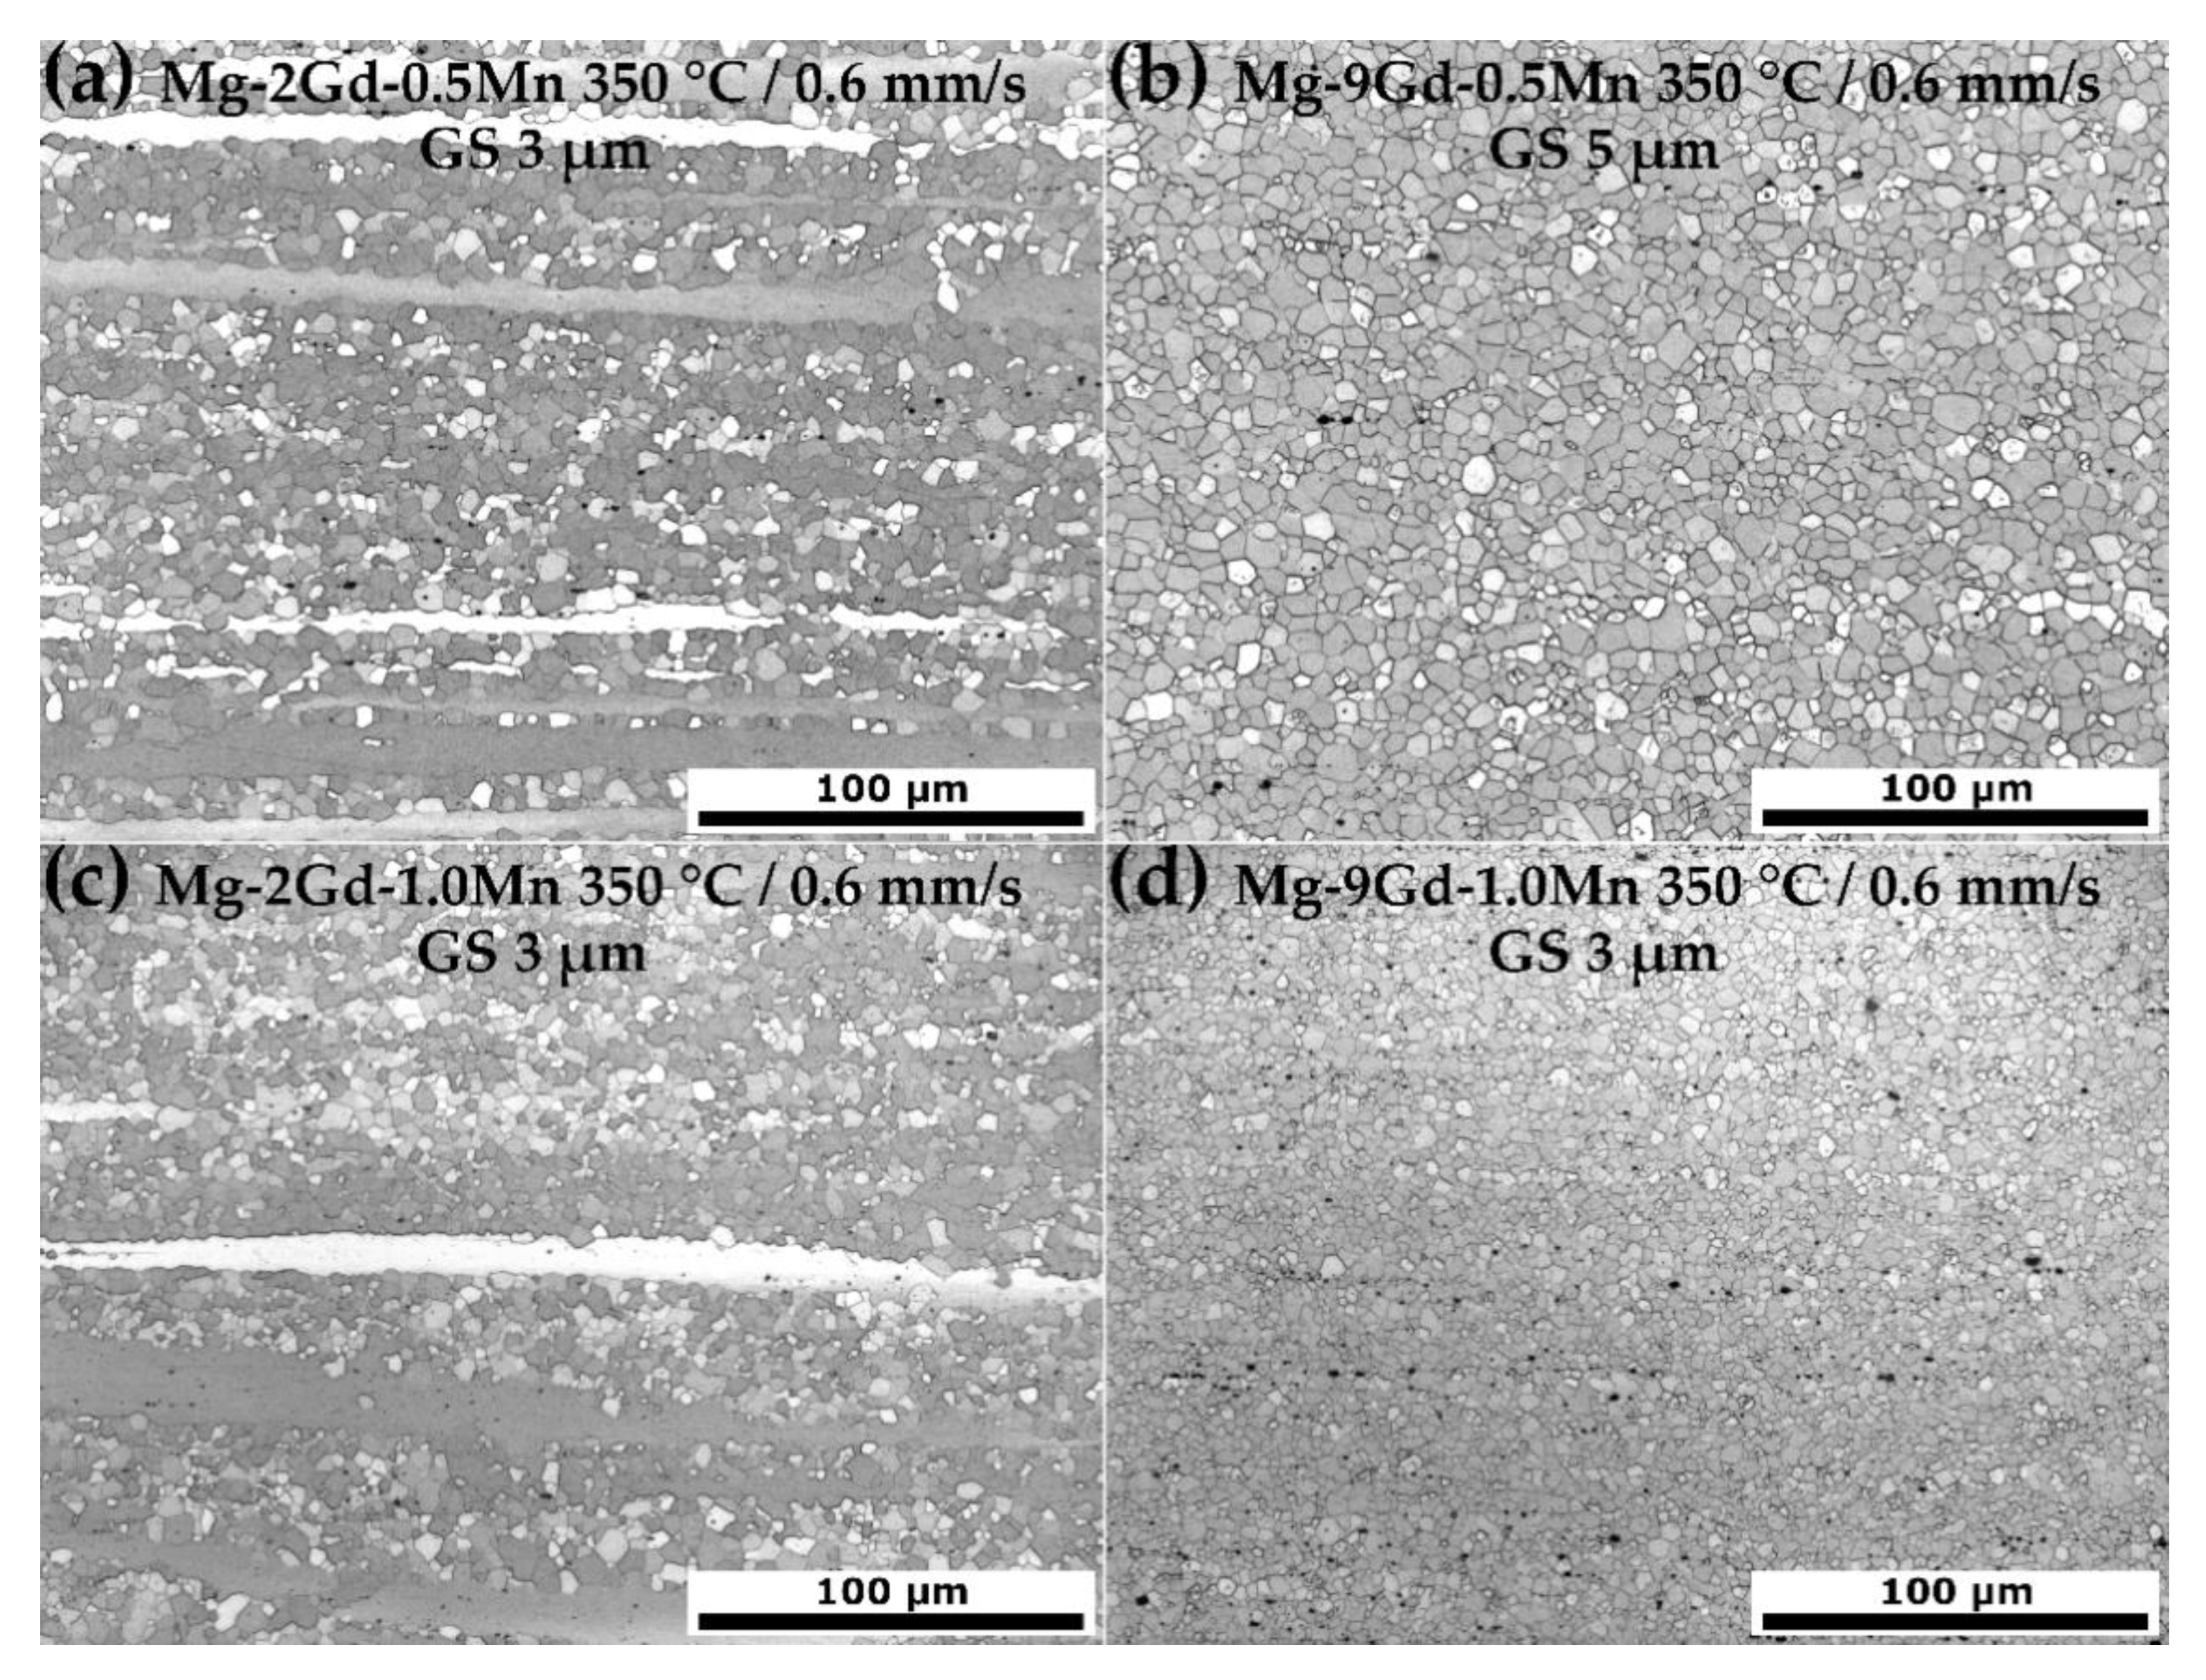
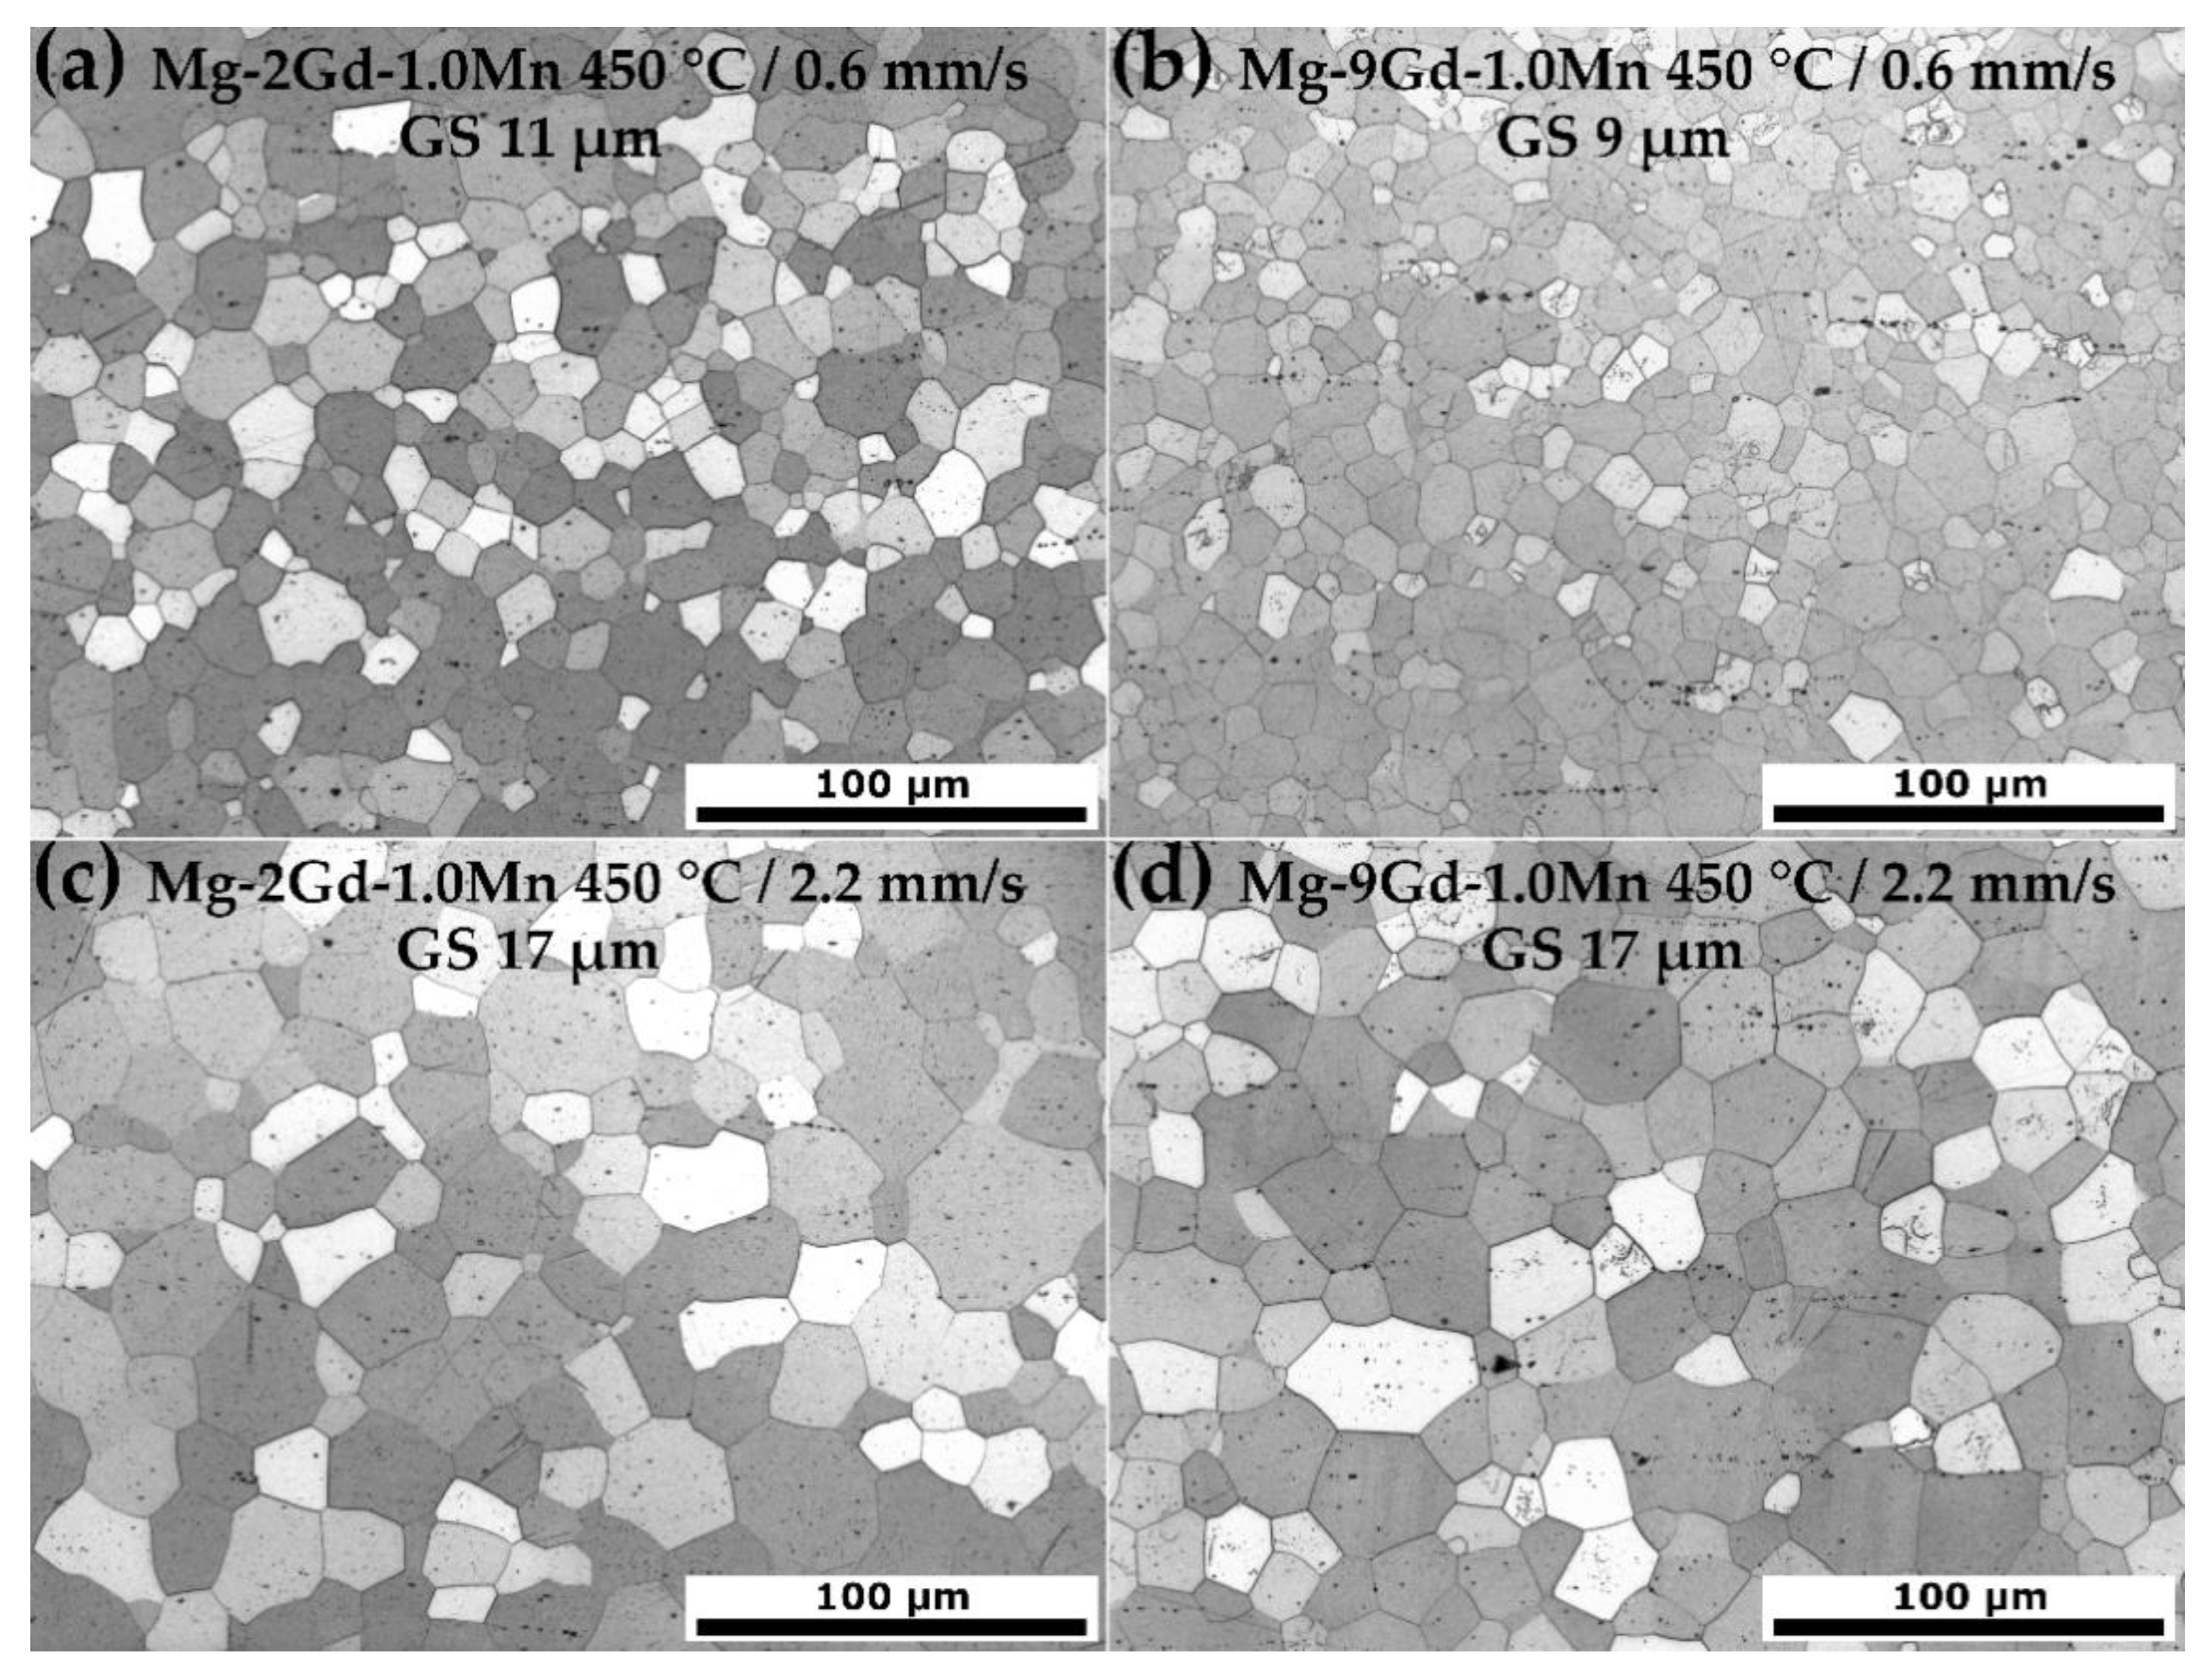
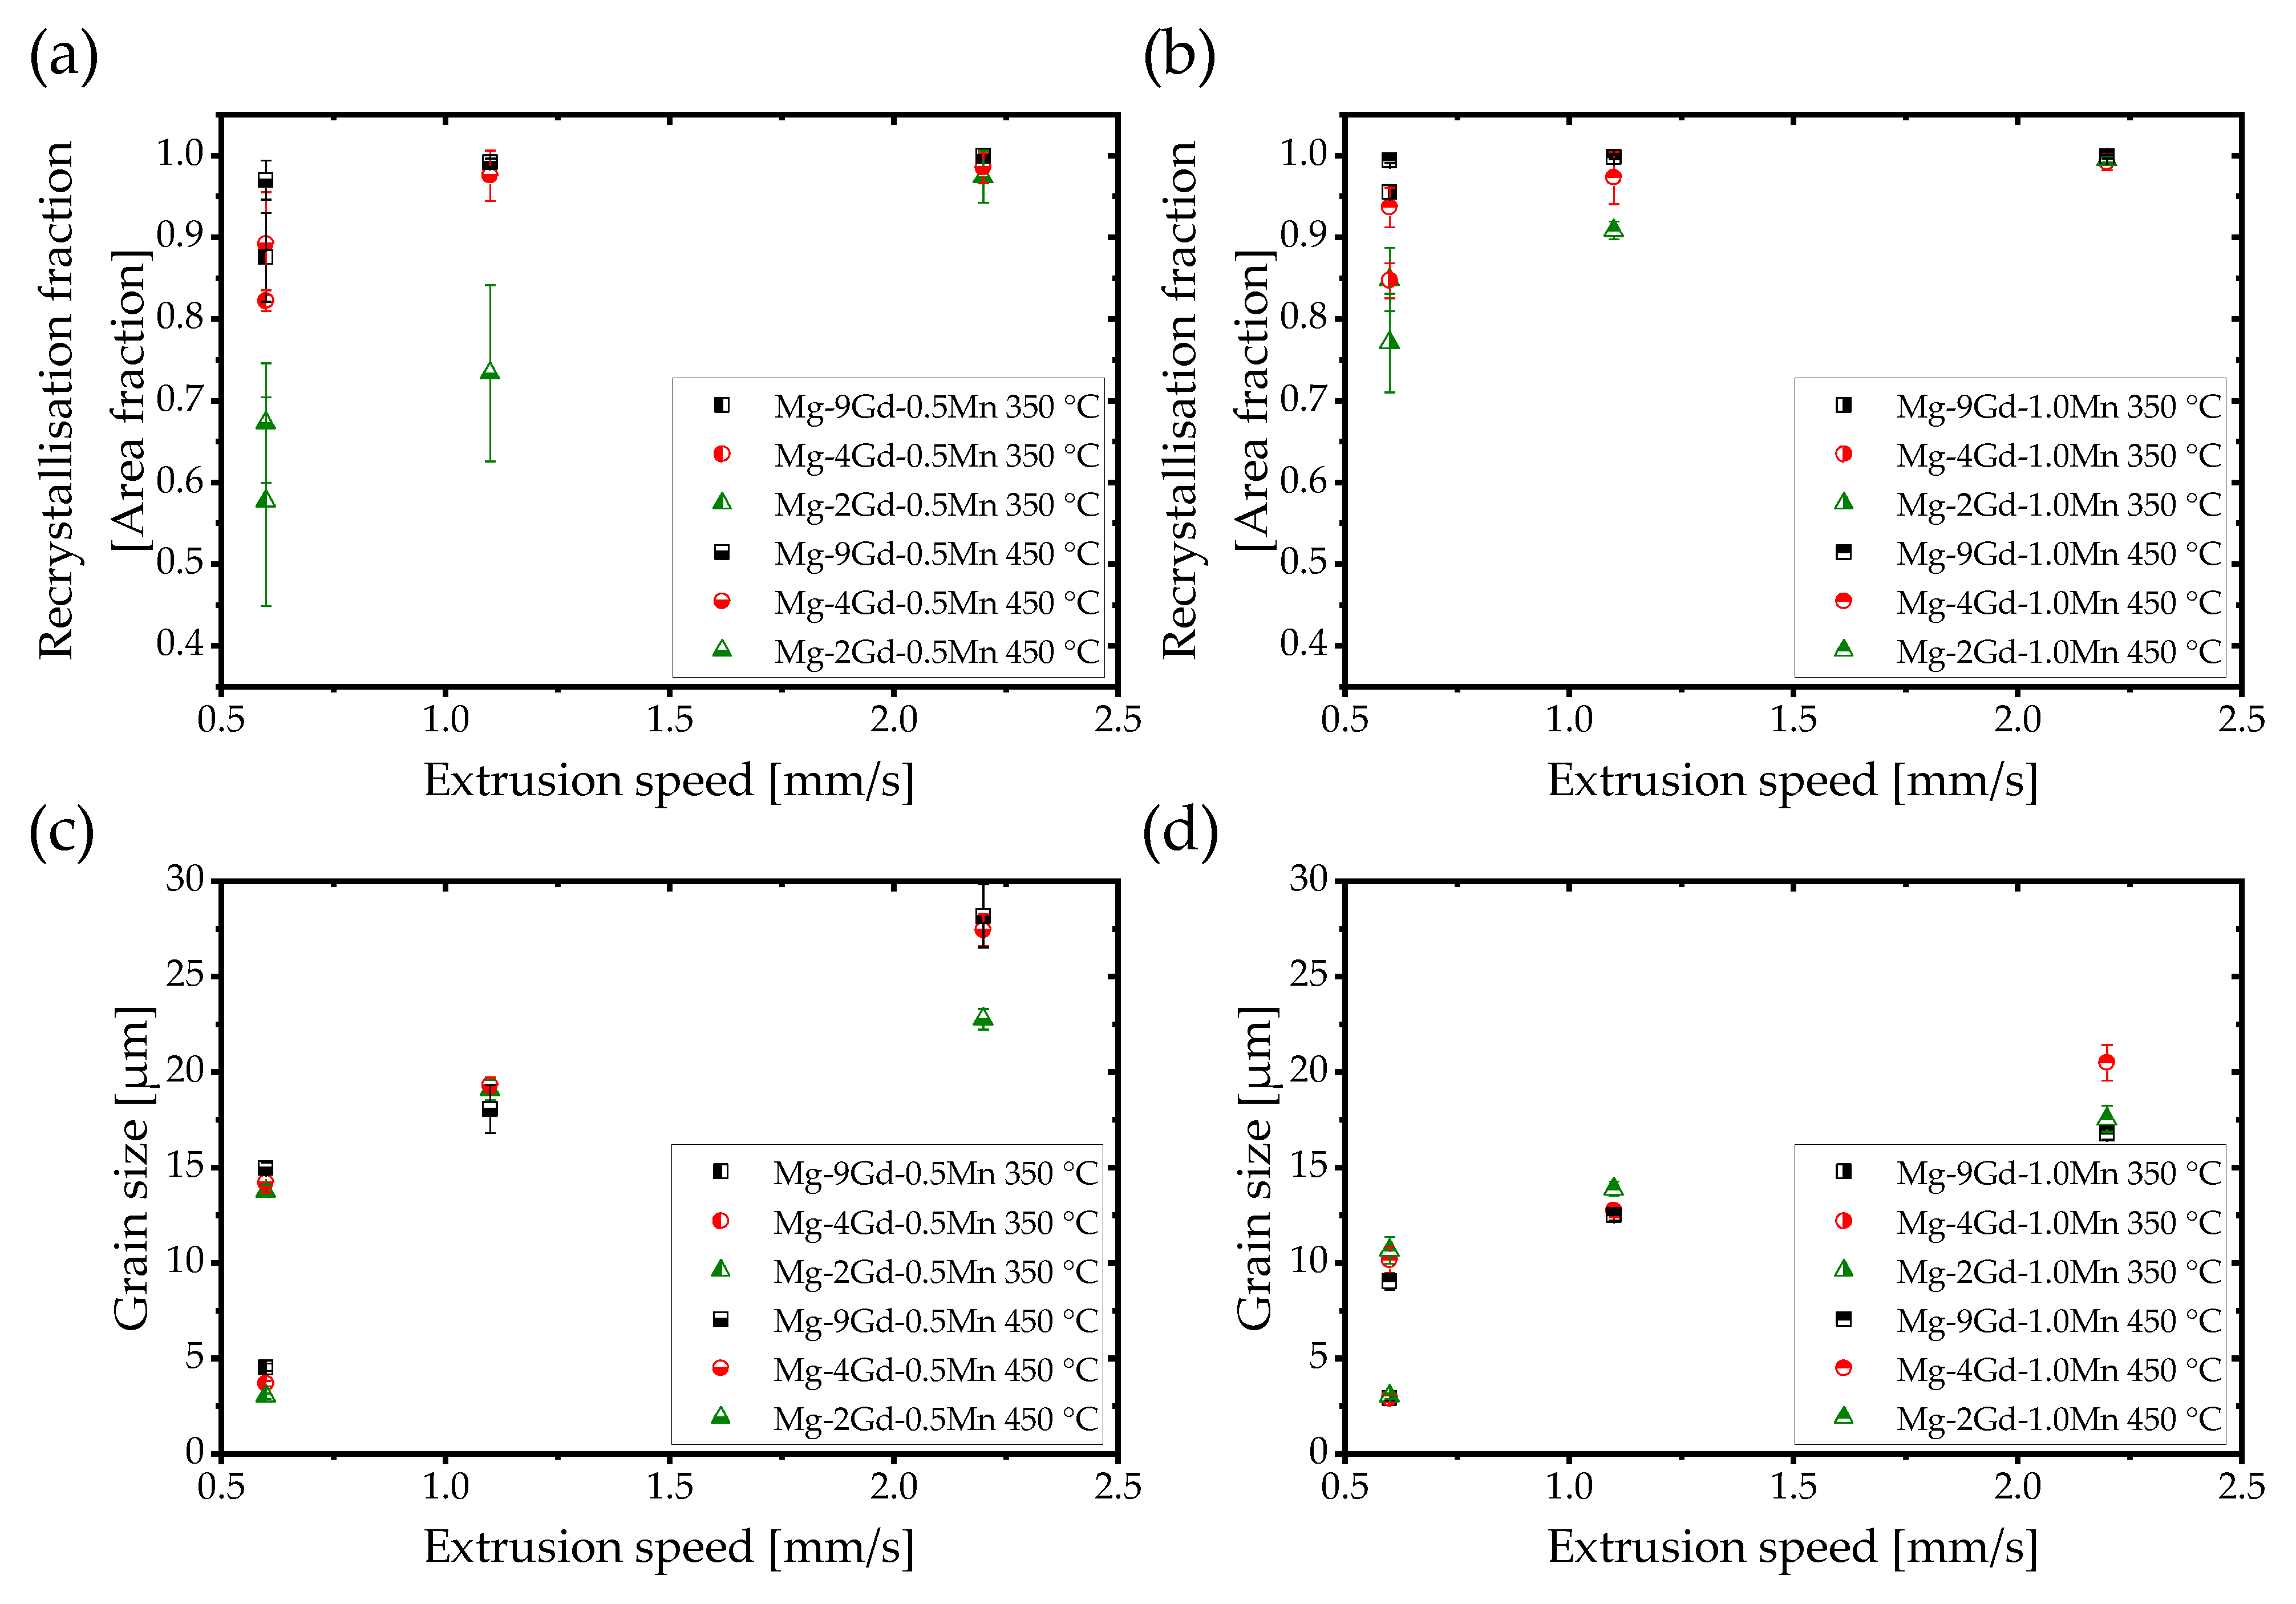
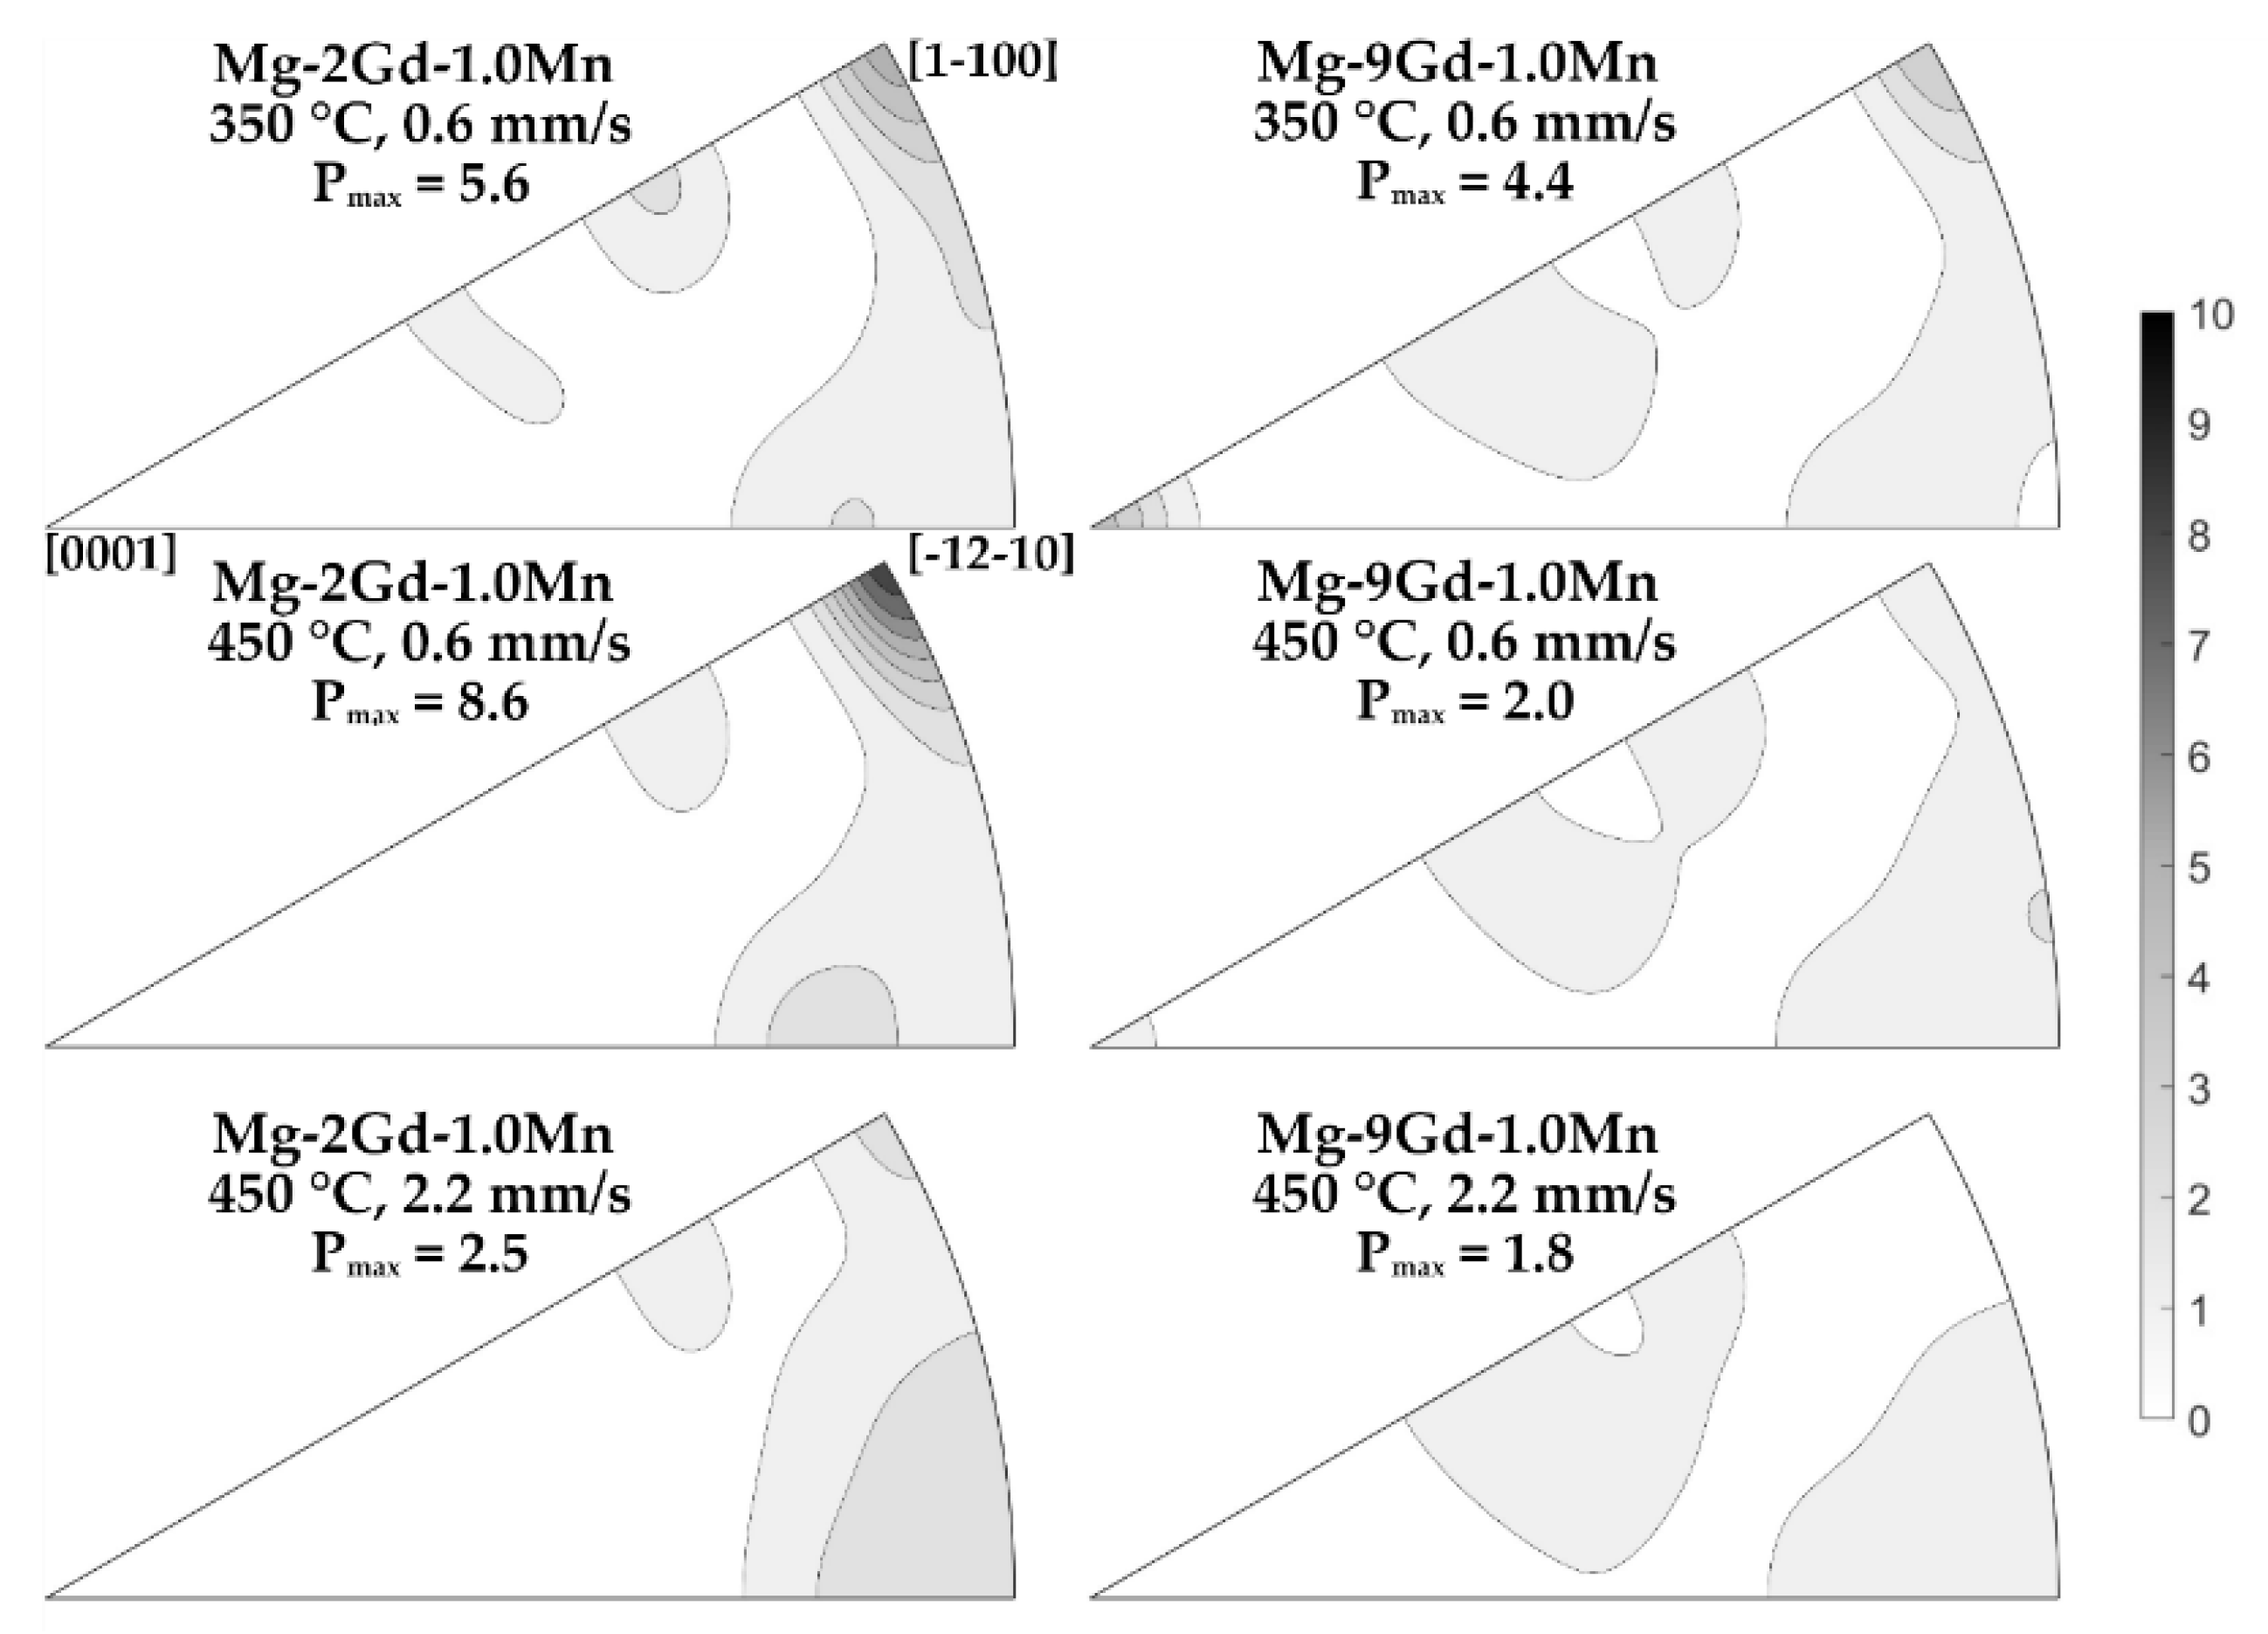
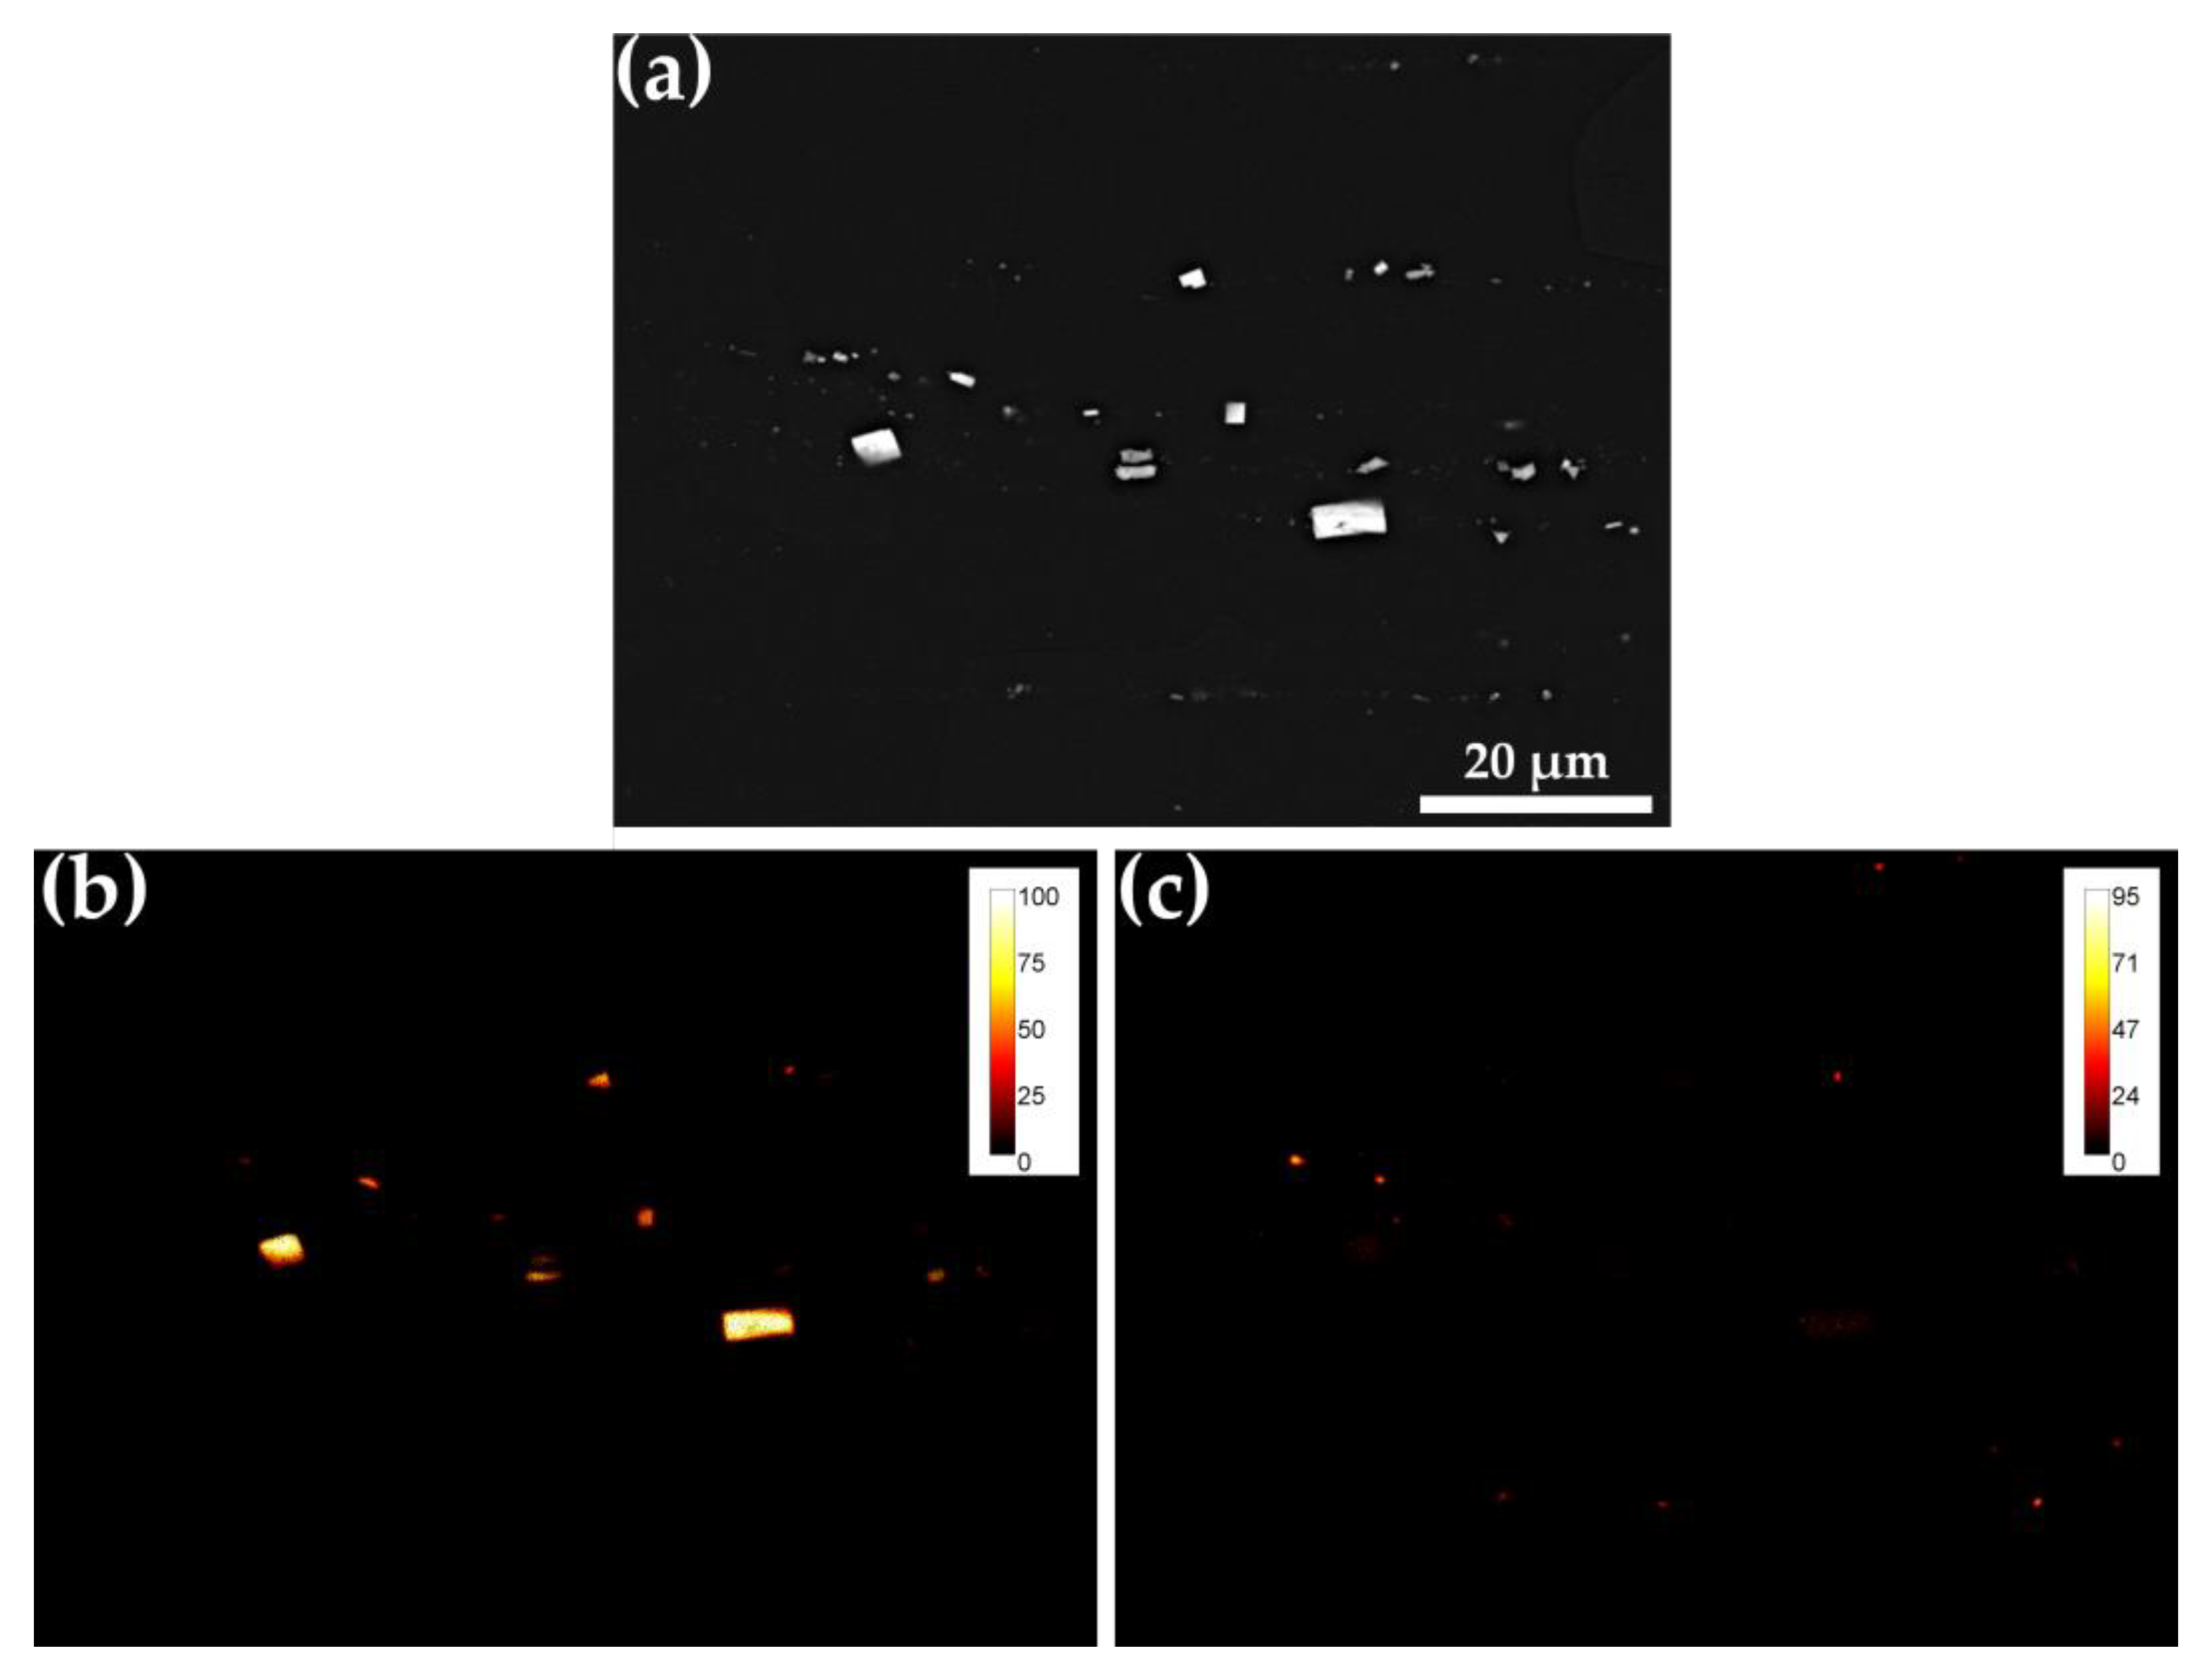
3.2. Microstructure
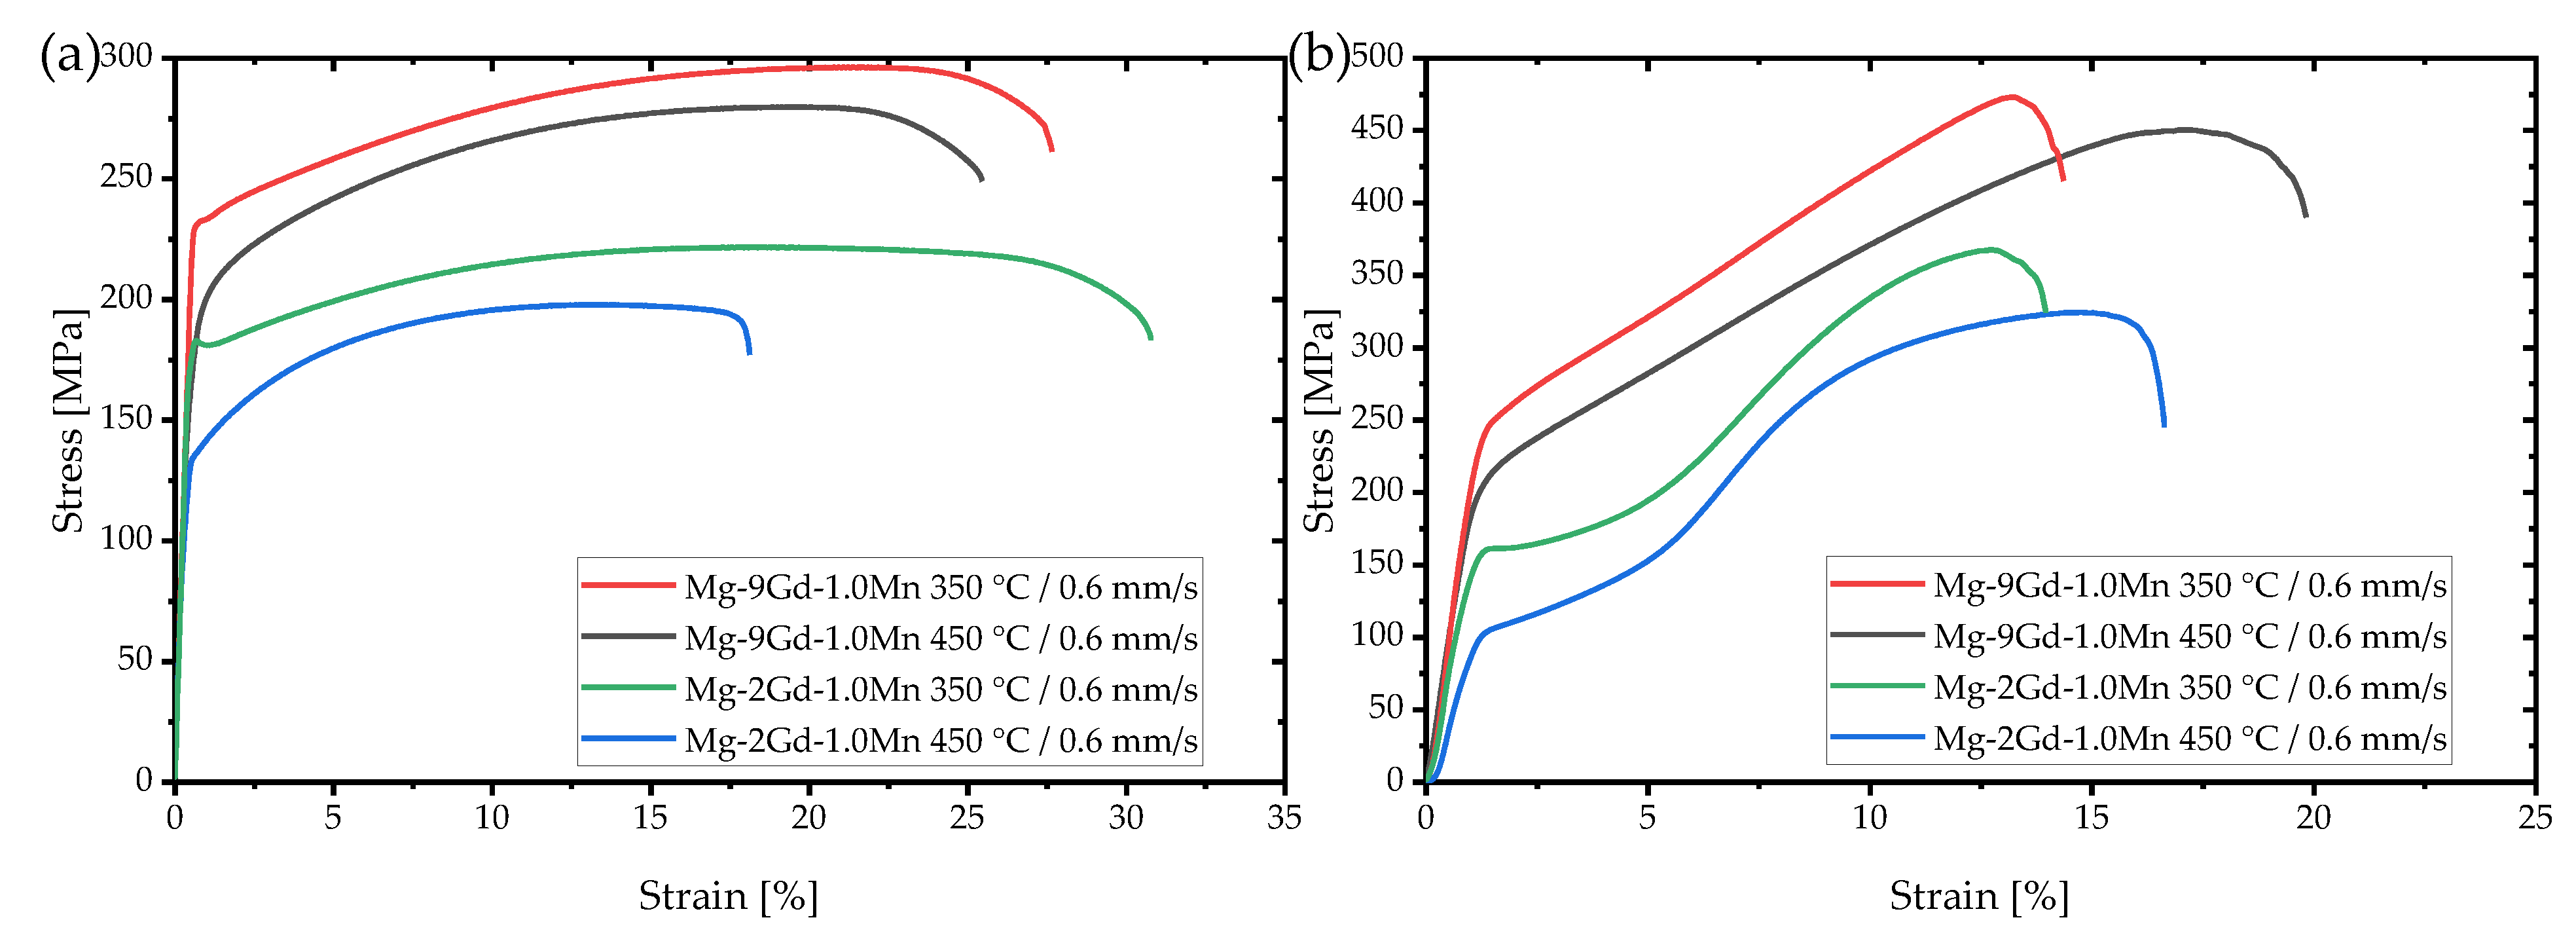
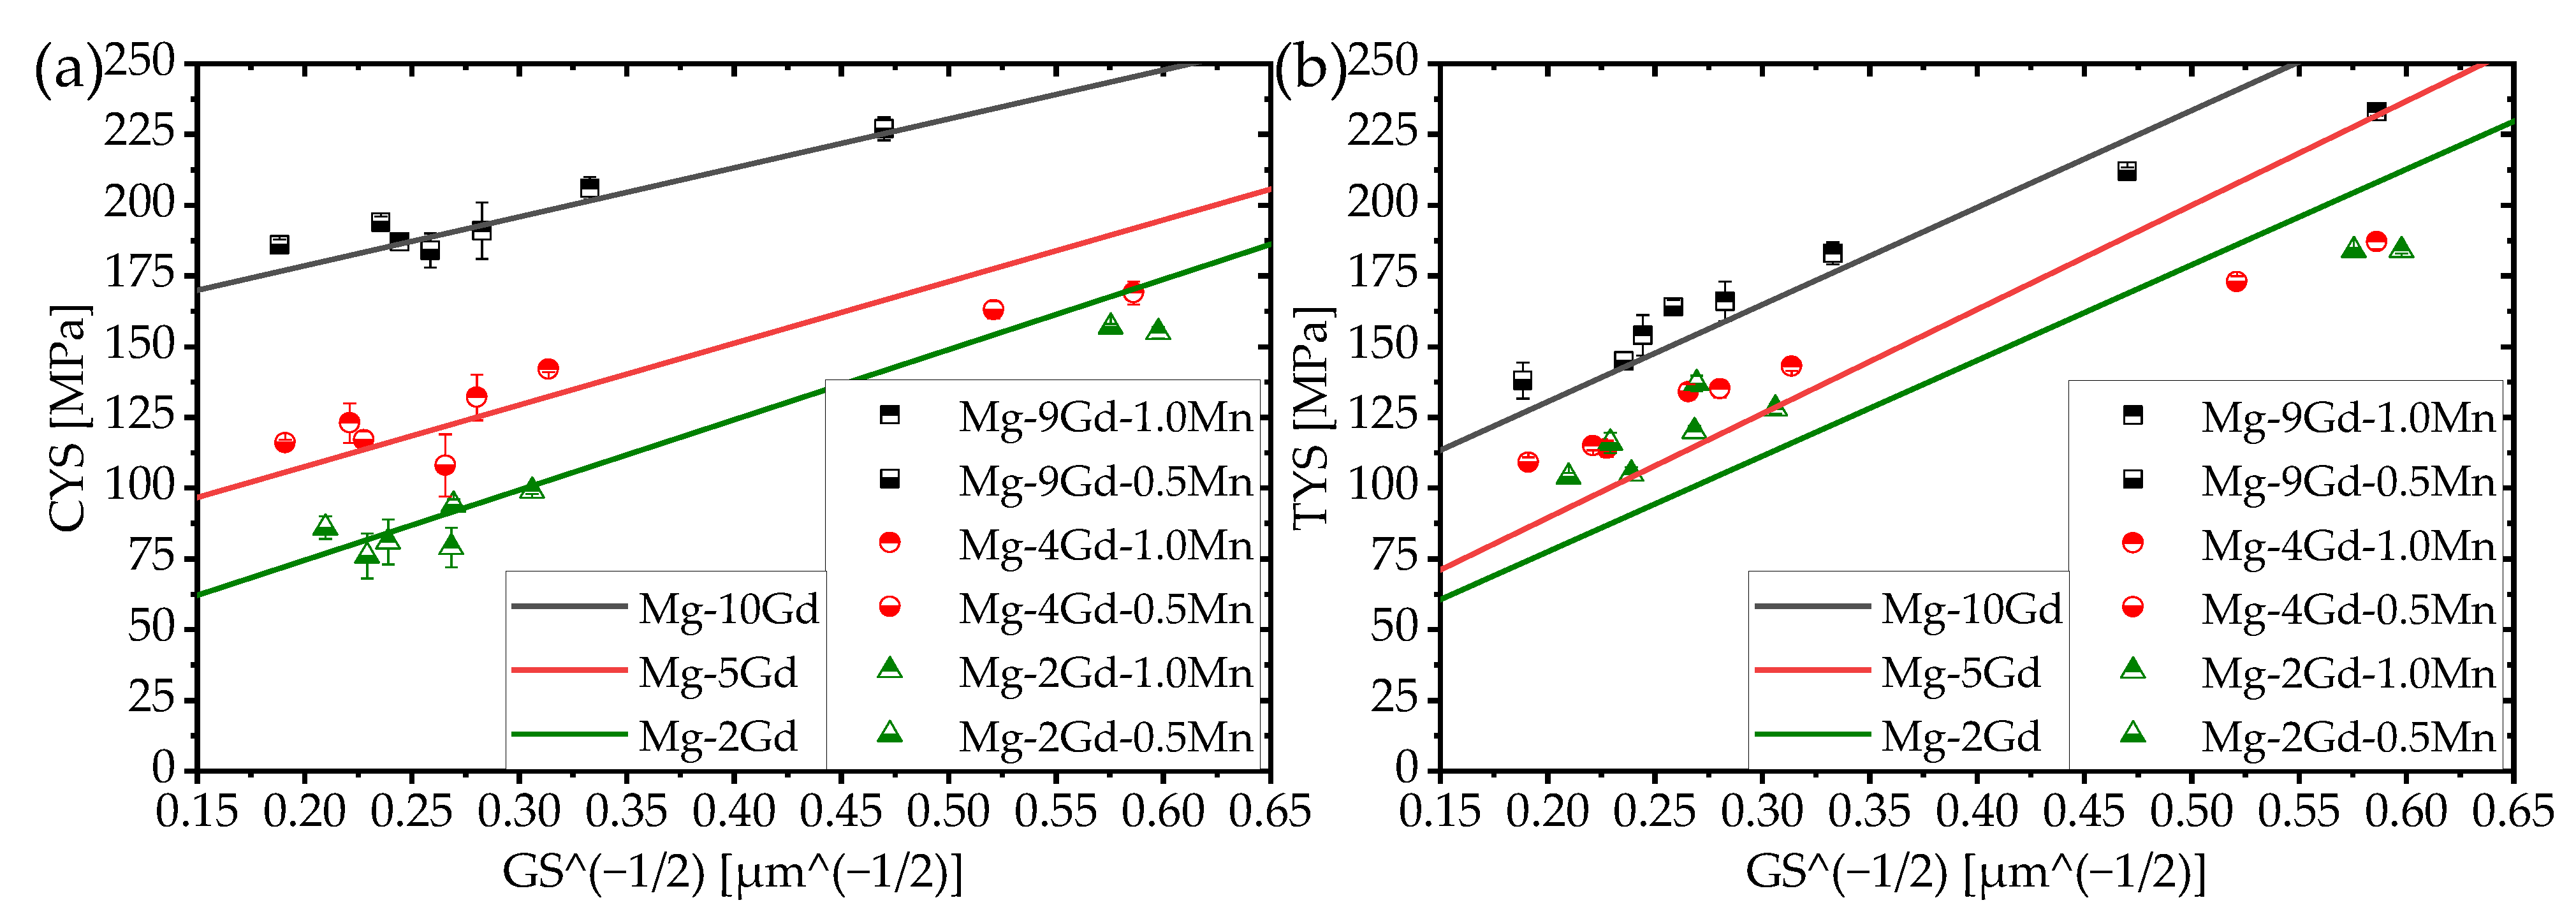
3.3. Mechanical Properties

| Alloy | T [°C] | Ext. Speed [mm/s] | TYS [MPa] | UTS [MPa] | εt [%] | CYS [MPa] | UCS [MPa] | εc [%] | CYS/TYS | Hardness [HV] |
|---|---|---|---|---|---|---|---|---|---|---|
| Mg-2Gd-0.5Mn | 350 | 0.6 | 184 ± 1 | 217 ± 1 | 31.5 ± 1.1 | 157 ± 1 | 360 ± 7 | 12.8 ± 1.3 | 0.85 | 59.6 ± 1.4 |
| 450 | 0.6 | 137 ± 3 | 187 ± 1 | 9.9 ± 2.3 | 94 ± 2 | 309 ± 4 | 13.7 ± 1.0 | 0.69 | 45.3 ± 1.0 | |
| 1.1 | 116 ± 4 | 185 ± 1 | 16.8 ± 4.4 | 76 ± 8 | 310 ± 6 | 19.7 ± 2.7 | 0.66 | 45.3 ± 1.1 | ||
| 2.2 | 104 ± 1 | 181 ± 1 | 22.0 ± 2.2 | 86 ± 4 | 330 ± 6 | 25.5 ± 1.2 | 0.83 | 43.4 ± 1.1 | ||
| Mg-2Gd-1.0Mn | 350 | 0.6 | 184 ± 1 | 222 ± 1 | 30.8 ± 1.2 | 155 ± 2 | 367 ± 1 | 12.6 ± 0.4 | 0.84 | 58.9 ± 1.1 |
| 450 | 0.6 | 128 ± 2 | 197 ± 1 | 18.4 ± 1.5 | 99 ± 1 | 324 ± 2 | 14.8 ± 1.1 | 0.77 | 48.8 ± 1.7 | |
| 1.1 | 120 ± 2 | 194 ± 1 | 20.8 ± 1.8 | 79 ± 7 | 320 ± 2 | 17.5 ± 0.6 | 0.66 | 45.5 ± 1.1 | ||
| 2.2 | 105 ± 2 | 189 ± 1 | 27.6 ± 1.6 | 81 ± 8 | 315 ± 4 | 19.1 ± 0.9 | 0.77 | 44.6 ± 0.9 | ||
| Mg-4Gd-0.5Mn | 350 | 0.6 | 173 ± 2 | 225 ± 1 | 26.2 ± 1.9 | 163 ± 3 | 368 ± 7 | 16.4 ± 0.7 | 0.94 | 64.3 ± 0.9 |
| 450 | 0.6 | 134 ± 3 | 206 ± 2 | 16.5 ± 1.2 | 108 ± 11 | 347 ± 5 | 20.3 ± 1.4 | 0.81 | 53.2 ± 1.4 | |
| 1.1 | 114 ± 3 | 200 ± 1 | 25.1 ± 1.8 | 117 ± 3 | 357 ± 6 | 24.5 ± 1.5 | 1.03 | 52.0 ± 0.8 | ||
| 2.2 | 109 ± 2 | 198 ± 1 | 26.7 ± 1.0 | 116 ± 1 | 355 ± 5 | 24.5 ± 0.9 | 1.06 | 50.5 ± 1.1 | ||
| Mg-4Gd-1.0Mn | 350 | 0.6 | 187 ± 2 | 238 ± 1 | 25.8 ± 0.6 | 169 ± 4 | 382 ± 3 | 16.0 ± 0.7 | 0.90 | 67.8 ± 1.6 |
| 450 | 0.6 | 143 ± 2 | 220 ± 1 | 21.6 ± 1.1 | 142 ± 1 | 365 ± 2 | 20.9 ± 0.9 | 0.99 | 58.0 ± 0.9 | |
| 1.1 | 135 ± 3 | 216 ± 1 | 23.2 ± 2.0 | 132 ± 8 | 363 ± 4 | 22.1 ± 1.3 | 0.98 | 56.3 ± 0.6 | ||
| 2.2 | 115 ± 2 | 206 ± 1 | 27.9 ± 2.1 | 123 ± 7 | 374 ± 2 | 25.7 ± 0.5 | 1.07 | 54.3 ± 1.3 | ||
| Mg-9Gd-0.5Mn | 350 | 0.6 | 212 ± 1 | 287 ± 1 | 26.6 ± 0.5 | 227 ± 4 | 458 ± 2 | 12.5 ± 0.4 | 1.07 | 86.2 ± 1.2 |
| 450 | 0.6 | 164 ± 2 | 268 ± 1 | 22.9 ± 1.7 | 184 ± 6 | 430 ± 3 | 19.3 ± 0.6 | 1.12 | 75.8 ± 0.9 | |
| 1.1 | 145 ± 3 | 257 ± 2 | 24.4 ± 0.6 | 194 ± 2 | 420 ± 3 | 18.5 ± 0.1 | 1.34 | 74.6 ± 1.8 | ||
| 2.2 | 138 ± 6 | 248 ± 1 | 25.0 ± 1.5 | 186 ± 2 | 418 ± 3 | 19.0 ± 0.5 | 1.35 | 74.7 ± 1.8 | ||
| Mg-9Gd-1.0Mn | 350 | 0.6 | 233 ± 1 | 297 ± 2 | 26.9 ± 0.4 | 253 ± 2 | 475 ± 4 | 12.4 ± 0.3 | 1.09 | 90.8 ± 0.7 |
| 450 | 0.6 | 183 ± 4 | 281 ± 1 | 24.2 ±3.1 | 206 ±4 | 452 ±2 | 18.1 ± 0.4 | 1.13 | 81.4 ± 0.8 | |
| 1.1 | 166 ± 7 | 271 ± 1 | 24.8 ±0.3 | 191 ±10 | 440 ±3 | 19.0 ± 0.3 | 1.15 | 79.5 ± 1.3 | ||
| 2.2 | 154 ± 7 | 262 ± 1 | 26.0 ±0.7 | 187 ±3 | 432 ±1 | 19.3 ± 0.5 | 1.21 | 77.5 ± 0.9 |
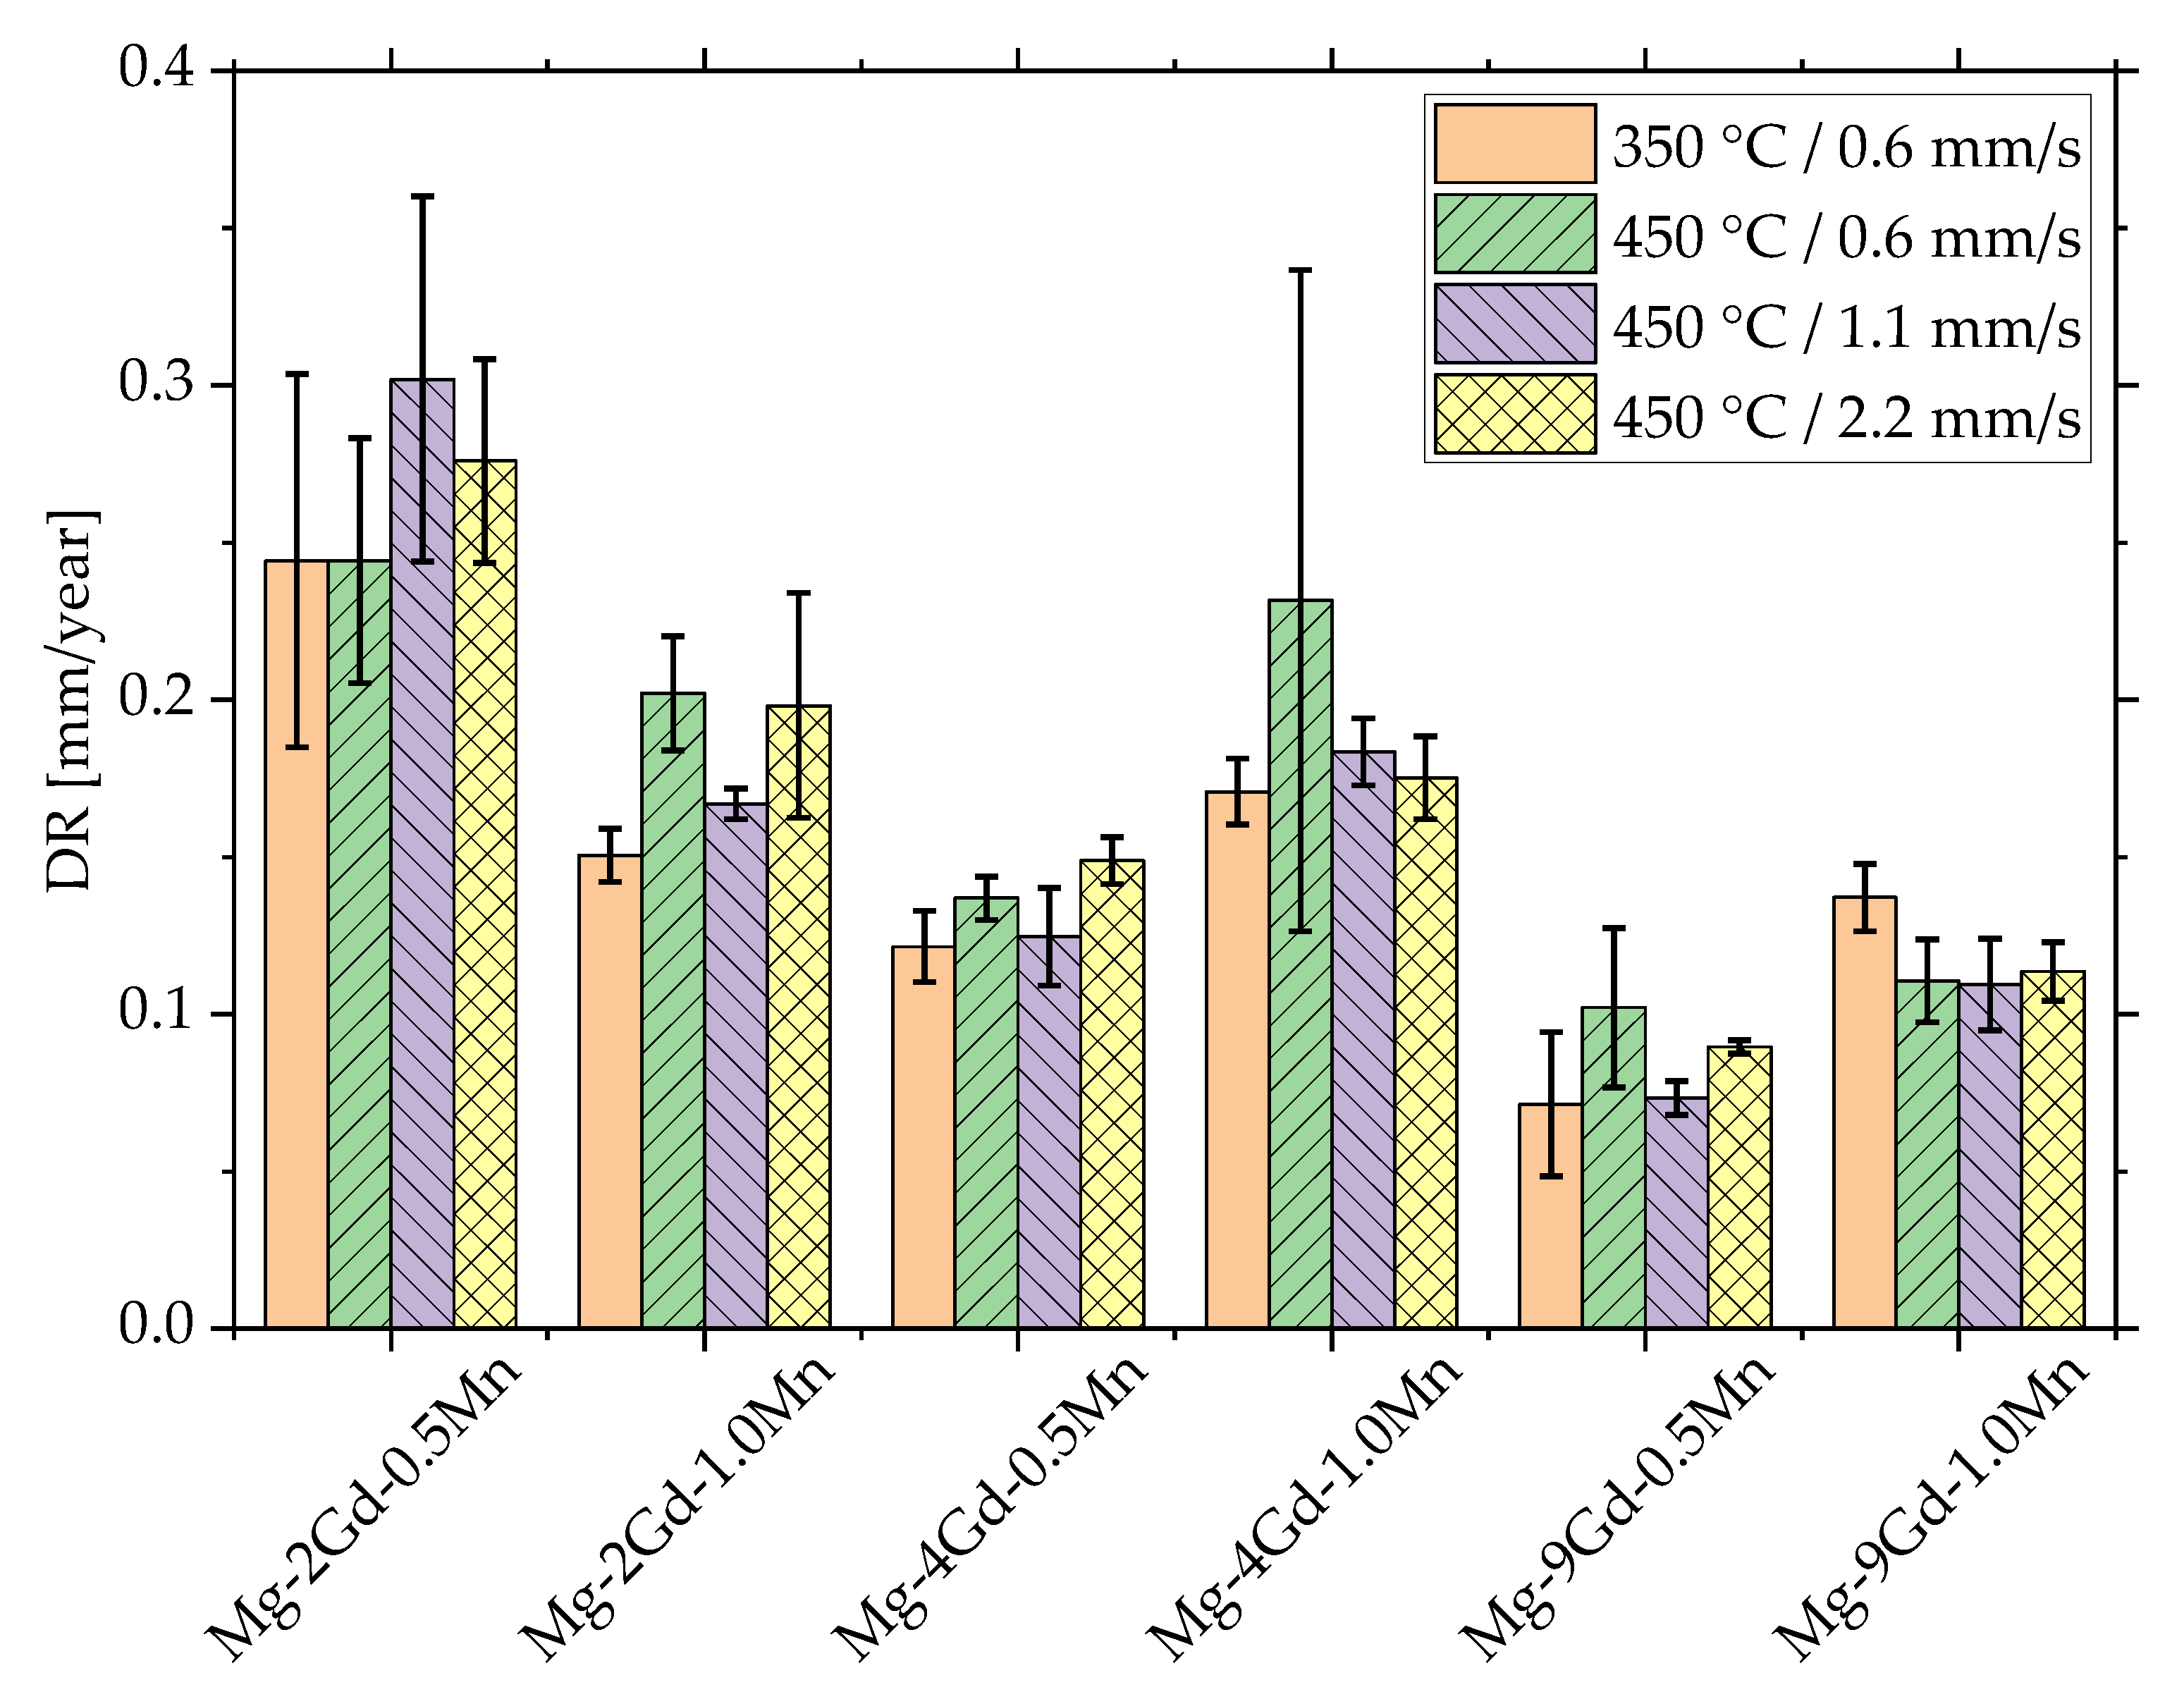
3.4. Degradation
4. Discussion
5. Conclusions
Author Contributions
Funding
Institutional Review Board Statement
Informed Consent Statement
Data Availability Statement
Acknowledgments
Conflicts of Interest
References
- Kammer, C. Magnesium Taschenbuch 2. Auflage; Aluminium-Zentrale e.V., Düsseldorf; Alu Media: Düsseldorf, Germany, 2000. [Google Scholar]
- Stanford, N.; Atwell, D.; Barnett, M.R. The effect of Gd on the recrystallisation, texture and deformation behaviour of magnesium-based alloys. Acta Mater. 2010, 58, 6773–6783. [Google Scholar] [CrossRef]
- Stanford, N. The effect of rare earth elements on the behaviour of magnesium-based alloys: Part 2—Recrystallisation and texture development. Mater. Sci. Eng. A 2013, 565, 469–475. [Google Scholar] [CrossRef]
- Stanford, N. Micro-alloying Mg with Y, Ce, Gd and La for texture modification—A comparative study. Mater. Sci. Eng. A 2010, 527, 2669–2677. [Google Scholar] [CrossRef]
- Stanford, N.; Barnett, M.R. The origin of “rare earth” texture development in extruded Mg-based alloys and its effect on tensile ductility. Mater. Sci. Eng. A 2008, 496, 399–408. [Google Scholar] [CrossRef]
- Bohlen, J.; Meyer, S.; Wiese, B.; Luthringer-Feyerabend, B.J.C.; Willumeit-Römer, R.; Letzig, D. Alloying and processing effects on the microstructure, mechanical properties, and degradation behavior of extruded magnesium alloys containing calcium, cerium, or silver. Materials 2020, 13, 391. [Google Scholar] [CrossRef] [Green Version]
- Bohlen, J.; Yi, S.; Letzig, D.; Kainer, K.U. Effect of rare earth elements on the microstructure and texture development in magnesium-manganese alloys during extrusion. Mater. Sci. Eng. A 2010, 527, 7092–7098. [Google Scholar] [CrossRef]
- Harmuth, J.; Wiese, B.; Bohlen, J.; Ebel, T.; Willumeit-Römer, R. Tailoring of Material Properties of Mg–Gd Alloys for Biomedical Applications. In Proceedings of the 11th International Conference on Magnesium Alloys and Their Applications, Old Windsor, UK, 24–27 July 2018; pp. 376–381. [Google Scholar]
- Huang, Y.; Gan, W.; Kainer, K.U.; Hort, N. Role of multi-microalloying by rare earth elements in ductilization of magnesium alloys. J. Magnes. Alloy. 2014, 2, 1–7. [Google Scholar] [CrossRef] [Green Version]
- Feyerabend, F.; Fischer, J.; Holtz, J.; Witte, F.; Willumeit, R.; Drücker, H.; Vogt, C.; Hort, N. Evaluation of short-term effects of rare earth and other elements used in magnesium alloys on primary cells and cell lines. Acta Biomater. 2010, 6, 1834–1842. [Google Scholar] [CrossRef] [Green Version]
- Zeller-Plumhoff, B.; Malich, C.; Krüger, D.; Campbell, G.; Wiese, B.; Galli, S.; Wennerberg, A.; Willumeit-Römer, R.; Wieland, D.C.F. Analysis of the bone ultrastructure around biodegradable Mg–xGd implants using small angle X-ray scattering and X-ray diffraction. Acta Biomater. 2020, 101, 637–645. [Google Scholar] [CrossRef]
- Moosmann, J.; Zeller-Plumhoff, B.; Wieland, D.C.F.; Galli, S.; Krüger, D.; Dose, T.; Burmester, H.; Wilde, F.; Bech, M.; Peruzzi, N.; et al. Biodegradable Magnesium-Based Implants in Bone Studied by Synchrotron Radiation Microtomography. In Proceedings of the SPIE—The International Society for Optical Engineering, San Diego, CA, USA, 8–10 August 2017. [Google Scholar]
- Willumeit-Römer, R.; Moosmann, J.; Zeller-Plumhoff, B.; Florian Wieland, D.C.; Krüger, D.; Wiese, B.; Wennerberg, A.; Peruzzi, N.; Galli, S.; Beckmann, F.; et al. Visualization of implant failure by synchrotron tomography. In Minerals, Metals and Materials Series; Springer: Cham, Switzerland, 2018; Volume Part F12, pp. 275–284. [Google Scholar]
- Peruzzi, N.; Galli, S.; Helmholz, H.; Kardjilov, N.; Krüger, D.; Markötter, H.; Moosmann, J.; Orlov, D.; Prgomet, Z.; Willumeit-Römer, R.; et al. Multimodal ex vivo methods reveal that Gd-rich corrosion byproducts remain at the implant site of biodegradable Mg–Gd screws. Acta Biomater. 2021, 136, 582–591. [Google Scholar] [CrossRef]
- Sun, Y.; Helmholz, H.; Will, O.; Damm, T.; Wiese, B.; Luczak, M.; Peschke, E.; Luthringer-Feyerabend, B.; Ebel, T.; Hövener, J.-B.; et al. Dynamic in vivo monitoring of fracture healing process in response to magnesium implant with multimodal imaging: Pilot longitudinal study in a rat external fixation model. Biomater. Sci. 2022, 10, 1532–1543. [Google Scholar] [CrossRef] [PubMed]
- Nagarajan, D.; Cáceres, C.H.; Griffiths, J.R. Grain Size Hardening Effects in Mg–Gd Solid Solutions. Metall. Mater. Trans. A 2016, 47, 5401–5408. [Google Scholar] [CrossRef]
- Xu, Y.; Ren, Z.; Huang, Y.; Kainer, K.; Hort, N. Solid solution strengthening in Mg–Gd alloys. In Magnesium Technology 2016; Springer: Cham, Switzerland, 2016; pp. 135–139. [Google Scholar]
- Pan, F.; Chen, X.; Yan, T.; Liu, T.; Mao, J.; Luo, W.; Wang, Q.; Peng, J.; Tang, A.; Jiang, B. A novel approach to melt purification of magnesium alloys. J. Magnes. Alloy. 2016, 4, 8–14. [Google Scholar] [CrossRef] [Green Version]
- Lu, Y.; Huang, Y.; Feyerabend, F.; Willumeit-Römer, R.; Kainer, K.U.; Hort, N. Microstructure and mechanical properties of Mg–Gd alloys as biodegradable implant materials. In Minerals, Metals and Materials Series; Springer: Cham, Switzerland, 2018; Volume Part F12, pp. 253–262. [Google Scholar]
- Harmuth, J.; Wiese, B.; Bohlen, J.; Ebel, T.; Willumeit-Römer, R. Wide Range Mechanical Customization of Mg–Gd Alloys with Low Degradation Rates by Extrusion. Front. Mater. 2019, 6, 201. [Google Scholar] [CrossRef] [Green Version]
- Hort, N.; Huang, Y.; Fechner, D.; Störmer, M.; Blawert, C.; Witte, F.; Vogt, C.; Drücker, H.; Willumeit, R.; Kainer, K.U.; et al. Magnesium alloys as implant materials-Principles of property design for Mg-RE alloys. Acta Biomater. 2010, 6, 1714–1725. [Google Scholar] [CrossRef] [Green Version]
- Krüger, D.; Zeller-Plumhoff, B.; Wiese, B.; Yi, S.; Zuber, M.; Wieland, D.C.F.; Moosmann, J.; Willumeit-Römer, R. Assessing the microstructure and in vitro degradation behavior of Mg-xGd screw implants using µCT. J. Magnes. Alloy. 2021, 9, 2207–2222. [Google Scholar] [CrossRef]
- Gandel, D.S.; Birbilis, N.; Easton, M.A.; Gibson, M.A. The influence of Mn on the corrosion of Al-free Mg-alloys. In Proceedings of the 18th International Corrosion Congress 2011, Perth, Australia, 20–24 November 2011; pp. 1009–1017. [Google Scholar]
- Gandel, D.S.; Easton, M.A.; Gibson, M.A.; Birbilis, N. CALPHAD simulation of the Mg-(Mn, Zr)-Fe system and experimental comparison with as-cast alloy microstructures as relevant to impurity driven corrosion of Mg-alloys. Mater. Chem. Phys. 2014, 143, 1082–1091. [Google Scholar] [CrossRef]
- Yang, Y.; Wu, P.; Wang, Q.; Wu, H.; Liu, Y.; Deng, Y.; Zhou, Y.; Shuai, C. The Enhancement of Mg Corrosion Resistance by Alloying Mn and Laser-Melting. Materials 2016, 9, 216. [Google Scholar] [CrossRef] [Green Version]
- Friedrich, H.E.; Mordike, B.L. Magnesium Technology: Metallurgy, Design Data, Applications; Springer: Berlin/Heidelberg, Germany, 2006; pp. 1–677. [Google Scholar]
- Zeng, G.; Xian, J.W.; Gourlay, C.M. Nucleation and growth crystallography of Al8Mn5 on B2-Al(Mn,Fe) in AZ91 magnesium alloys. Acta Mater. 2018, 153, 364–376. [Google Scholar] [CrossRef] [Green Version]
- Silva Campos, M.R.; Scharnagl, N.; Blawert, C.; Kainer, K.U. Improving corrosion resistance of Mg10Gd alloy. In Materials Science Forum; Trans Tech Publications Ltd.: Bäch, Switzerland, 2013; Volume 765, pp. 673–677. [Google Scholar]
- Fang, X.Y.; Yi, D.Q.; Nie, J.F.; Zhang, X.J.; Wang, B.; Xiao, L.R. Effect of Zr, Mn and Sc additions on the grain size of Mg–Gd alloy. J. Alloy. Compd. 2009, 470, 311–316. [Google Scholar] [CrossRef]
- Wang, J.; Lu, R.; Qin, D.; Huang, X.; Pan, F. A study of the ultrahigh damping capacities in Mg-Mn alloys. Mater. Sci. Eng. A 2013, 560, 667–671. [Google Scholar] [CrossRef]
- Robson, J.D.; Henry, D.T.; Davis, B. Particle effects on recrystallization in magnesium-manganese alloys: Particle pinning. Mater. Sci. Eng. A 2011, 528, 4239–4247. [Google Scholar] [CrossRef]
- Yu, Z.; Tang, A.; Wang, Q.; Gao, Z.; He, J.; She, J.; Song, K.; Pan, F. High strength and superior ductility of an ultra-fine grained magnesium-manganese alloy. Mater. Sci. Eng. A 2015, 648, 202–207. [Google Scholar] [CrossRef]
- Aschner, J.L.; Aschner, M. Nutritional aspects of manganese homeostasis. Mol. Asp. Med. 2005, 26, 353–362. [Google Scholar] [CrossRef] [PubMed]
- Gahl, A. Kupfer, Mangan, Chrom, Molybdän—Schätzwerte Für Eine Angemessene Zufuhr. Available online: https://www.dge.de/wissenschaft/referenzwerte/kupfer-mangan-chrom-molybdaen/ (accessed on 26 March 2022).
- Trumbo, P.; Yates, A.A.; Schlicker, S.; Poos, M. Dietary reference intakes: Vitamin A, vitamin K, arsenic, boron, chromium, copper, iodine, iron, manganese, molybdenum, nickel, silicon, vanadium, and zinc. J. Am. Diet. Assoc. 2001, 101, 294–301. [Google Scholar] [CrossRef]
- Dermience, M.; Lognay, G.; Mathieu, F.; Goyens, P. Effects of thirty elements on bone metabolism. J. Trace Elem. Med. Biol. 2015, 32, 86–106. [Google Scholar] [CrossRef]
- Bachmann, F.; Hielscher, R.; Schaeben, H. Texture analysis with MTEX—Free and open source software toolbox. In Solid State Phenomena; Trans Tech Publications: Bäch, Switzerland, 2010; Volume 160, pp. 63–68. [Google Scholar]
- Wiese, B.; Willumeit-Römer, R.; Letzig, D.; Bohlen, J. Alloying effect of silver in magnesium on the development of microstructure and mechanical properties by indirect extrusion. J. Magnes. Alloy. 2021, 9, 112–122. [Google Scholar] [CrossRef]
- Bauser, M.; Sauer, G.; Siegert, K. Extrusion; ASM international: Amir, The Netherlands, 2006; Volume 2. [Google Scholar]
- Peng, P.; Tang, A.; She, J.; Zhang, J.; Zhou, S.; Song, K.; Pan, F. Significant improvement in yield stress of Mg-Gd-Mn alloy by forming bimodal grain structure. Mater. Sci. Eng. A 2021, 803, 140569. [Google Scholar] [CrossRef]
- Robson, J.D. Effect of rare-earth additions on the texture of wrought magnesium alloys: The role of grain boundary segregation. Metall. Mater. Trans. A 2014, 45, 3205–3212. [Google Scholar] [CrossRef] [Green Version]
- Zhu, S.M.; Nie, J.F.; Gibson, M.A.; Easton, M.A. On the unexpected formation of rare earth hydrides in magnesium-rare earth casting alloys. Scr. Mater. 2014, 77, 21–24. [Google Scholar] [CrossRef]
- Huang, Y.; Yang, L.; You, S.; Gan, W.; Kainer, K.U.; Hort, N. Unexpected formation of hydrides in heavy rare earth containing magnesium alloys. J. Magnes. Alloy. 2016, 4, 173–180. [Google Scholar] [CrossRef] [Green Version]
- Peng, Q.; Huang, Y.; Meng, J.; Li, Y.; Kainer, K.U. Strain induced GdH2 precipitate in Mg–Gd based alloys. Intermetallics 2011, 19, 382–389. [Google Scholar] [CrossRef]
- Vlček, M.; Čížek, J.; Lukáč, F.; Hruška, P.; Smola, B.; Stulíková, I.; Kudrnová, H.; Minárik, P.; Kmječ, T.; Vlasák, T. Hydrogen absorption in Mg–Gd alloy. Int. J. Hydrogen Energy 2017, 42, 22598–22604. [Google Scholar] [CrossRef]
- Grey, E.A.; Higgins, G.T. Solute limited grain boundary migration: A rationalisation of grain growth. Acta Metall. 1973, 21, 309–321. [Google Scholar] [CrossRef]
- Kim, S.H.; Jung, J.G.; You, B.S.; Park, S.H. Microstructure and texture variation with Gd addition in extruded magnesium. J. Alloy. Compd. 2017, 695, 344–350. [Google Scholar] [CrossRef]
- Yu, H.; Kim, Y.M.; You, B.S.; Yu, H.S.; Park, S.H. Effects of cerium addition on the microstructure, mechanical properties and hot workability of ZK60 alloy. Mater. Sci. Eng. A 2013, 559, 798–807. [Google Scholar] [CrossRef]
- Dobroň, P.; Drozdenko, D.; Olejňák, J.; Hegedüs, M.; Horváth, K.; Veselý, J.; Bohlen, J.; Letzig, D. Compressive yield stress improvement using thermomechanical treatment of extruded Mg-Zn-Ca alloy. Mater. Sci. Eng. A 2018, 730, 401–409. [Google Scholar] [CrossRef]


| Alloy | Gd [wt.%] | Mn [wt.%] | Fe [ppm] | Ni [ppm] | Cu [ppm] | Mg [wt.%] |
|---|---|---|---|---|---|---|
| Mg-2Gd-0.5Mn | 2.27 ± 0.12 | 0.51 ± 0.02 | 24 ± 3 | <13 | <7 | bal. |
| Mg-2Gd-1.0Mn | 1.95 ± 0.06 | 0.94 ± 0.03 | 52 ± 3 | <13 | <7 | bal. |
| Mg-4Gd-0.5Mn | 4.18 ± 0.10 | 0.53 ± 0.03 | 56 ± 3 | <13 | <7 | bal. |
| Mg-4Gd-1.0Mn | 4.13 ± 0.12 | 0.95 ± 0.03 | 66 ± 3 | <13 | <7 | bal. |
| Mg-9Gd-0.5Mn | 9.01 ± 0.36 | 0.55 ± 0.02 | 58 ± 3 | <13 | <7 | bal. |
| Mg-9Gd-1.0Mn | 8.99 ± 0.14 | 1.06 ± 0.02 | 82 ± 3 | <13 | <7 | bal. |
Publisher’s Note: MDPI stays neutral with regard to jurisdictional claims in published maps and institutional affiliations. |
© 2022 by the authors. Licensee MDPI, Basel, Switzerland. This article is an open access article distributed under the terms and conditions of the Creative Commons Attribution (CC BY) license (https://creativecommons.org/licenses/by/4.0/).
Share and Cite
Wiese, B.; Harmuth, J.; Willumeit-Römer, R.; Bohlen, J. Property Variation of Extruded Mg-Gd Alloys by Mn Addition and Processing. Crystals 2022, 12, 1036. https://doi.org/10.3390/cryst12081036
Wiese B, Harmuth J, Willumeit-Römer R, Bohlen J. Property Variation of Extruded Mg-Gd Alloys by Mn Addition and Processing. Crystals. 2022; 12(8):1036. https://doi.org/10.3390/cryst12081036
Chicago/Turabian StyleWiese, Björn, Jochen Harmuth, Regine Willumeit-Römer, and Jan Bohlen. 2022. "Property Variation of Extruded Mg-Gd Alloys by Mn Addition and Processing" Crystals 12, no. 8: 1036. https://doi.org/10.3390/cryst12081036