Article

Microscopic Phase-Field Simulation of γ′ Precipitation in Ni-Based Binary Alloys Coupled with CALPHAD Method

1
School of Materials Science and Engineering, Shanghai University, Shanghai 200444, China
2
Ansteel Beijing Research Institute, Beijing 102211, China
*
Author to whom correspondence should be addressed.
Crystals 2022, 12(7), 971; https://doi.org/10.3390/cryst12070971
Submission received: 26 May 2022 / Revised: 4 July 2022 / Accepted: 7 July 2022 / Published: 12 July 2022
(This article belongs to the Special Issue Experiments and Simulations of Superalloys)

Abstract

:
In the present work, the first (1st) and second (2nd) nearest-neighbor interaction energies are calculated by coupling the microscopic phase-field kinetic model with the calculation of phase diagrams (CALPHAD) method. The morphological evolution of the γ′ precipitate and the variation of its atomic ordering parameter for Ni–X (X = Al, Fe, Mn, Pt, or Si) alloys during aging are studied. The simulation results predict different occupation preferences for solute and solvent atoms in the γ′ phase, i.e., solute atoms are inclined to occupy the corner sites and solvent atoms tend to occupy the face sites. In order to understand the precipitation process of the γ′ phase systematically, the ordering and clustering behaviors of solute atoms are analyzed.

1. Introduction

The excellent mechanical properties of Ni-based superalloys, which are due to the precipitation hardening effect by γ′ precipitates, have attracted considerable interest in the aerospace industry [1,2,3]. The coherently precipitated γ′ (ordered Ni3X, L12-type structure) from the disordered γ (face-centered cubic structure) matrix reduces dislocation motion [4]. Since the ordering and clustering processes in Ni-based alloys occur for a very short time during precipitation [5], it is not enough to obtain effective information only from experiments using methods such as transmission electron microscopy (TEM) and powder X-ray diffraction (XRD) [6]. Multi-scale simulation methods have been widely used to study the microstructures and mechanical behaviors of superalloys [7,8,9]. Mesoscale phase-field simulations are useful for describing the co-evolution of massive-phase microstructures and dislocations, while molecular dynamics and microscopic phase-field methods are useful for studying mechanisms which require individual-atom resolution. Compared with molecular dynamics, the microscopic phase-field method has advantages in obtaining the lattice occupation information based on reliable interatomic interaction energies [10]. The microscopic phase-field kinetic model was first proposed by Khachaturyan [11], based on the Önsager-type microscopic diffusion equations. Then, it was employed to simulate the precipitation morphological evolution, including the strain-induced morphological transformation of coherent precipitates [12], the precipitation mechanism in the ternary Ni–Al–V alloy [13], and the early precipitation of the δ′(Al3Li) ordered phase [14]. In these studies, the atomic configurations and the morphologies of the alloys were described by single-site occupation probability functions P α ( r , t ) , which represent the probabilities of finding an atom α on a given lattice site r at a given time t. The initial state corresponds to the homogenous disordered phase described by P α ( r , t ) = c α , where c α is the overall concentration. When the homogenous phase is quenched to a lower temperature, it becomes unstable with respect to atomic ordering or clustering, depending on the interatomic interaction energies in the system [15].
When simulating the ordering and clustering process in Ni-based superalloys, one difficulty in coupling the phase-field and calculation of phase diagrams (CALPHAD) methods [16] is the complexity of deriving the interatomic interaction energy, especially in multicomponent systems. Meanwhile, for the extension to multicomponent systems, the interaction energies of high components must be optimally obtained from low components; therefore, the interaction energy is a key factor that determines the simulation accuracy. To date, efforts to calculate interaction energies have focused primarily on atomic intercalation [17] and first-principles calculations [18]. However, the key challenge is to obtain the interaction energy change with temperature and to study the ordering behavior at high temperature. In order to deal with such problems, a coupling method for the microscopic phase-field method and the CALPHAD method is developed, which has the potential to be extended for multicomponent systems.
In the present study, the first (1st) and second (2nd) nearest-neighbor interaction energies at different temperatures are calculated, based on thermodynamic data obtained by the CALPHAD method, and the early stage of the γ′ precipitation process is simulated. The coupling method is applied to predict different occupation probabilities between solute and solvent atoms in the γ′ phase in Ni–X (X denotes the solute atom: Al, Fe, Mn, Pt, or Si) alloys. In addition, the ordering and clustering behaviors of the solute atoms are studied systematically, which enables understanding of the precipitation mechanism of the γ′ phase. For simplicity, the effect of the elastic strain energy on the two-phase morphology is ignored.

2. Methodology

2.1. Concentration Wave Representation in γ Solid Solution

In order to deal with the order–disorder transition, a description of atomic occupancy probability is introduced. In this case, the function n ( r ) , which determines the solute atom distribution in an ordered phase, can be expanded into a Fourier series, i.e., expressed as a superposition of static concentration waves. Considering a binary Ni–X (X = Al, Fe, Mn, Pt, or Si) system, the occupancy probability of solute atoms on the lattice site of Ni3X is [2]:
n ( r ) = c + ( η 1 e i 2 π a 1 * r + η 2 e i 2 π a 2 * r + η 3 e i 2 π a 3 * r )
or
n ( x , y , z ) = c + ( η 1 e i 2 π x + η 2 e i 2 π y + η 3 e i 2 π z )
where η 1 , η 2 , and η 3 are the long-range-order parameters that represent the amplitudes of the corresponding concentration waves e i 2 π x , e i 2 π y , and e i 2 π z and c is the solute concentration. There are different values for different lattice sites in the γ phase, i.e., n 1 = c + 3 η 1 / 4 for all corners and n 2 = c η 1 / 4 for all face centers. In addition, a 1 * , a 2 * , and a 3 * denote the reciprocal lattice vectors of the lattice sites along the [100], [010], and [001] directions, respectively, and | a 1 * | = | a 2 * | = | a 3 * | = 1 / a 0 , where a 0 is the lattice parameter.

2.2. Helmholtz Free Energy

The Helmholtz free energy of a system based on the mean-field approximation [19,20,21] can be written as:
F ( T , c , η ) = 1 2 [ V α β ( 0 ) + 3 V α β ( k 1 ) η 2 ] c 2 + ( k B T 4 ) { c ( 1 + 3 η ) l n ( c ( 1 + 3 η ) ) + [ 1 c ( 1 + 3 η ) ] l n [ 1 c ( 1 + 3 η ) ] + 3 c ( 1 η ) l n ( c ( 1 η ) ) + 3 [ 1 c ( 1 η ) ] l n [ 1 c ( 1 η ) ] }
where k B is the Boltzmann constant, k 1 is the wave vector in the <100> direction, and V α β ( 0 ) and V α β ( k 1 ) are the Fourier transforms of the interaction energy between solute atoms at k = 0 and k = k 1 , respectively. The interaction energy in γ lattice sites is given by:
V α β = 4 V α β 1 ( c o s π h · c o s π k + c o s π h · c o s π l + c o s π l · c o s π k ) + 2 V α β 2 ( c o s 2 π h + c o s 2 π l + c o s 2 π k )
where V α β 1 and V α β 2 are the 1st and 2nd nearest-neighbor interaction energies and h, k, and l relate to the reciprocal lattice:
k = ( k x , k y , k z ) = 2 π ( h a 1 * + k a 2 * + l a 3 * )
For the γ and γ′ phases in Ni–X (X = Al, Fe, Mn, Pt, or Si) binary systems, the 1st and 2nd nearest-neighbor interaction energies ( V α β 1 and V α β 2 ) are much larger than other parameters, and V α β ( 0 ) and V α β ( k 1 ) can be described by:
V α β ( 0 ) = 12 V α β 1 + 6 V α β 2
V α β ( k 1 ) = 4 V α β 1 + 6 V α β 2

2.3. Order Parameter

The value of the order parameter η in Equation (3) should minimize the free energy of the system:
4 c η | V α β ( k 1 ) | k B T = l n { ( 1 + 3 η ) [ 1 c ( 1 η ) ] ( 1 η ) [ 1 c ( 1 + 3 η ) ] }
where η is a function of temperature T . There is no analytical solution for this equation; it must be solved numerically. For a given T , the γ and γ′ phases become stable at concentrations c γ and c γ , respectively. The equilibrium concentrations c γ and c γ are determined by the common tangent:
[ f γ c γ ] T = [ f γ c γ ] T
Therefore, the relationship between the equilibrium concentrations and the nearest-neighbor interaction energies can be expressed as:
V α β ( 0 ) c γ + 3 η 2 V α β ( k ) c γ + ( k B T 4 ) · { ( 1 + 3 η ) · l n { c γ ( 1 + 3 η ) [ 1 c γ ( 1 + 3 η ) ] } + 3 ( 1 η ) · l n { c γ ( 1 η ) [ 1 c γ ( 1 η ) ] } } V α β ( 0 ) c γ k B T · l n [ c γ ( 1 c γ ) ] = 0

2.4. Coupling with CALPHAD to Calculate Interaction Energies

The phase diagram of the binary Ni–Al system can be calculated using the Thermo-Calc software (Version 2015a. Created by Sundman, Jansson, Ågren et al. Royal Institute of Technology (KTH), Stockholm, Sweden) [22] with TCNI7, as shown in Figure 1. According to the phase diagram, for given temperatures T1 and T2, the equilibrium concentrations c 1 γ and c 2 γ of the γ phase and c 1 γ and c 2 γ of the γ′ phase tie-lines can be obtained, respectively. Then the values of V α β ( 0 ) , V α β ( k ) , and η can be determined using Equation (9).

2.5. Kinetic Equations

Since for a binary alloy system the sum of the occupation probabilities is unity, i.e., P A ( r , t ) + P B ( r , t ) = 1.0 , only one equation is independent for each lattice site [23]:
d P ( r , t ) d t = c 0 ( 1 c 0 ) k B T r L ( r r ) F P ( r , t ) + ξ ( r , t )
where L ( r r ) is the probability of elementary diffusion jumps from r to r . F is the Helmholtz free energy. A Langevin noise term ξ ( r , t ) that satisfies the fluctuation–dissipation theorem is added, to introduce nucleation.
There are three assumptions in this methodology description. Firstly, a 3D crystal structure (fcc) is replaced by a 2D projection, and the influence on the lattice constants during the ordering transition can be taken into account. Secondly, the 1st and 2nd interaction energies in Equations (3) and (4) are used to approximate the intersection on the phase diagram, and the higher-order interactions are ignored. Thirdly, for simplicity, the lattice diffusion coefficient with respect to the kinetic parameter L is not considered in Equation (10).

3. Simulation Results and Discussion

3.1. 1st and 2nd Nearest-Neighbor Interaction Energies

The 1st and 2nd nearest-neighbor interaction energies ( V α β 1 and V α β 2 ) of the Ni–X (X = Al, Fe, Mn, Pt, or Si) alloy are shown in Figure 2. It is obvious that V α β 1 and V α β 2 increase with temperature in the Ni–Al alloy, while showing the opposite trend in the Ni–Mn alloy. There is a small fluctuation in the V α β 2 curve of the Ni–Fe alloy between 620 K and 720 K. In the Ni–Pt alloy, as the temperature increases, V α β 1 and V α β 2 first increase and then decrease, with maxima at about 85 meV/atom for V α β 1 and −12 meV/atom for V α β 2 at 612 K. For the Ni–Si alloy, V α β 1 and V α β 2 are stable at lower temperatures then grow rapidly above 1000 K.

3.2. Morphological Evolution of γ′ Precipitates

Although it is straightforward and desirable to perform three-dimensional (3D) simulations using the microscopic diffusion equations, a two-dimensional (2D) simulation is much less computationally intensive. In addition, its visualization and the analysis of the atomic configuration are much easier. Thus, all the results obtained in the present paper are reported using a 2D projection of a 3D system. This is equivalent to assuming that the occupation probabilities do not depend on the coordinate z along the [001] axis [12]. The γ′ domain can be identified by the solute atoms arranged in lattice sites, which is consistent with the projection of the γ′ phase, as shown in Figure 3.
This study focuses on the kinetic simulation of atomic ordering during the annealing process of the γ phase. The initial concentration of solute atoms in the alloy is c 0 = 0.175 atomic fraction, located in the equilibrium two-phase region, and the initial γ phase is generated by assigning the average concentration to an occupation probability function at each lattice site. The simulated supercell consists of 128 × 128 unit cells on the projected 2D square lattice, and the time step is 0.02. The color displayed in the simulation results is consistent with the occupancy probability. Thus, if the occupancy probability of a solute atom in any position is 1.0, then the position will be displayed as white; otherwise, it will be assigned the color blue, and so on.
Figure 4 shows the morphological evolution of the Ni–Al, Ni–Fe, Ni–Mn, Ni–Pt, and Ni–Si alloys versus time t * ( t * is defined as t / Δ t , where t is the simulation time and Δ t is the time step) at 1574 K, 686 K, 618 K, 638 K, and 1162 K, respectively. In the initial aging stage, the atomic ordering process of the γ phase leads to atomic redistribution. As the segregation of solute atoms in the γ phase occurs, the γ′ phase begins to precipitate from the matrix γ phase in a circular random distribution, as shown in Figure 4A1–E1, A2–E2. The interface between the γ and γ′ domains is decentralized. Furthermore, the morphologies shown in Figure 4A3–E3 illustrate the process of γ′-particle growth, where the small γ′ particles gradually merge with each other and grow, resulting in irregular shapes. Finally, the two-phase equilibrium of coexisting γ + γ′ is established, as shown in Figure 4A4–E4.
The process of solute-atom migration can be illustrated by the evolution of the solute concentration, as shown in Figure 5. In Figure 5, the horizontal axis (“Distance”) denotes the length of a 1D line region assigned in the 2D images. The distribution of solute concentration in the line region evolves as the ordering proceeds. It can be observed that the solute atoms are enriched in the γ′ phase and sparsely distributed in the γ phase boundary. The curves of solute concentration begin with a bulge, then gradually become stable. Finally, the uppermost domain is widened until the final equilibrium is established, which corresponds to the coarsening process.

3.3. Evolution of Atomic Occupation

Since it is difficult to quantitatively observe the occupancy probabilities of solute atoms in experiments, incorporating the sublattice models in CALPHAD has become an essential technique. Based on the equilibrium calculation, the sublattice models can present the lattice occupation, and the occupancy probabilities of solute atoms at corner and face sites as a function of aging time are predicted, as shown in Figure 6. At the beginning, there is no significant change in solute concentration in the incubation period, then the solute atoms tend to occupy corner sites, contributing to the ordering process of the alloys. In contrast, the solute concentration at face sites is almost zero, as these sites are occupied by the solvent atom Ni. Eventually, the solute concentration reaches the equilibrium value; the value for Al, Mn, Pt, and Si atoms is close to 0.8, while that for Fe atoms is close to 1.0.

3.4. Evolution of Long-Range-Order Parameter and Solute Concentration

In order to study the precipitation mechanism of the γ′ phase, the long-range-order parameter η u is introduced [24]:
η u ( i , j ) = 1 P u α ¯ ( i , j ) P u ¯ ( i , j )
This describes the ordering degree with respect to the order parameter. Here, P u α ¯ ( i , j ) and P u ¯ ( i , j ) are the average occupation probabilities of the alloy element in the α site (face site) and in the unit cell u (including corner and face sites), respectively. When η u ( i , j ) = 1 , this means that alloy atoms are distributed equally at the lattice site ( i , j ) and around it. When η u ( i , j ) = 0 or P u α ¯ ( i , j ) = 0 , this means that alloy atoms in the unit cell occupy corner sites only, so that the lattice is in a completely ordered state. The temporal evolutions of the long-range parameter and the solute concentration are shown in Figure 7. There are two stages during aging. Firstly, corresponding to the transitional ordering stage, the long-rang-order parameter and the solute concentration rise rapidly, indicating that the disorder–order transition occurs over time. Then the two-phase equilibrium is established, and the long-range-order parameter remains stable. From Figure 7, it can be observed that the long-range-order parameter reaches a steady state earlier than the solute concentration in all alloys, which indicates that the ordering event of the order parameter occurs first and is completed within 10,000 timesteps. Interestingly, there is a bump in the solute concentration during the early stages. This indicates that the solute concentration decreases slightly during coarsening, then increases to a steady value through uphill diffusion. Finally, when the solute concentration reaches an equilibrium value, the stoichiometric Ni3X (X = Al, Fe, Mn, Pt, or Si) precipitates are formed, which corresponds to the migration of solute atoms from the γ boundary to the γ′ phase. Compared to other alloys, the clustering behavior of solute atoms in the Ni–Mn alloy (Figure 7C) lags significantly behind the order parameter, which reveals that the γ′ precipitates formed in the early stage are supersaturated and unstable, resulting in the solute atom Mn migrating from the γ′ phase to the boundary.

4. Conclusions

The microscopic phase-field kinetic model was used to simulate γ′ precipitation from the γ matrix phase, and the first and second nearest-neighbor interaction energies were successfully obtained by employing the CALPHAD method. The following conclusions are drawn from this work:
  • There were different trends for the first and second nearest-neighbor interaction energies ( V α β 1 and V α β 2 ) in Ni–X (X = Al, Fe, Mn, Pt, or Si) alloys. The V α β 1 and V α β 2 values increased with temperature in the Ni–Al and Ni–Si alloys, while the opposite trend was seen in the Ni–Fe and Ni–Mn alloys. In the Ni–Pt alloy, the interaction energies first increased, with maxima at about 85 meV/atom for V α β 1 and −12 meV/atom for V α β 2 at 612 K, and then decreased with temperature.
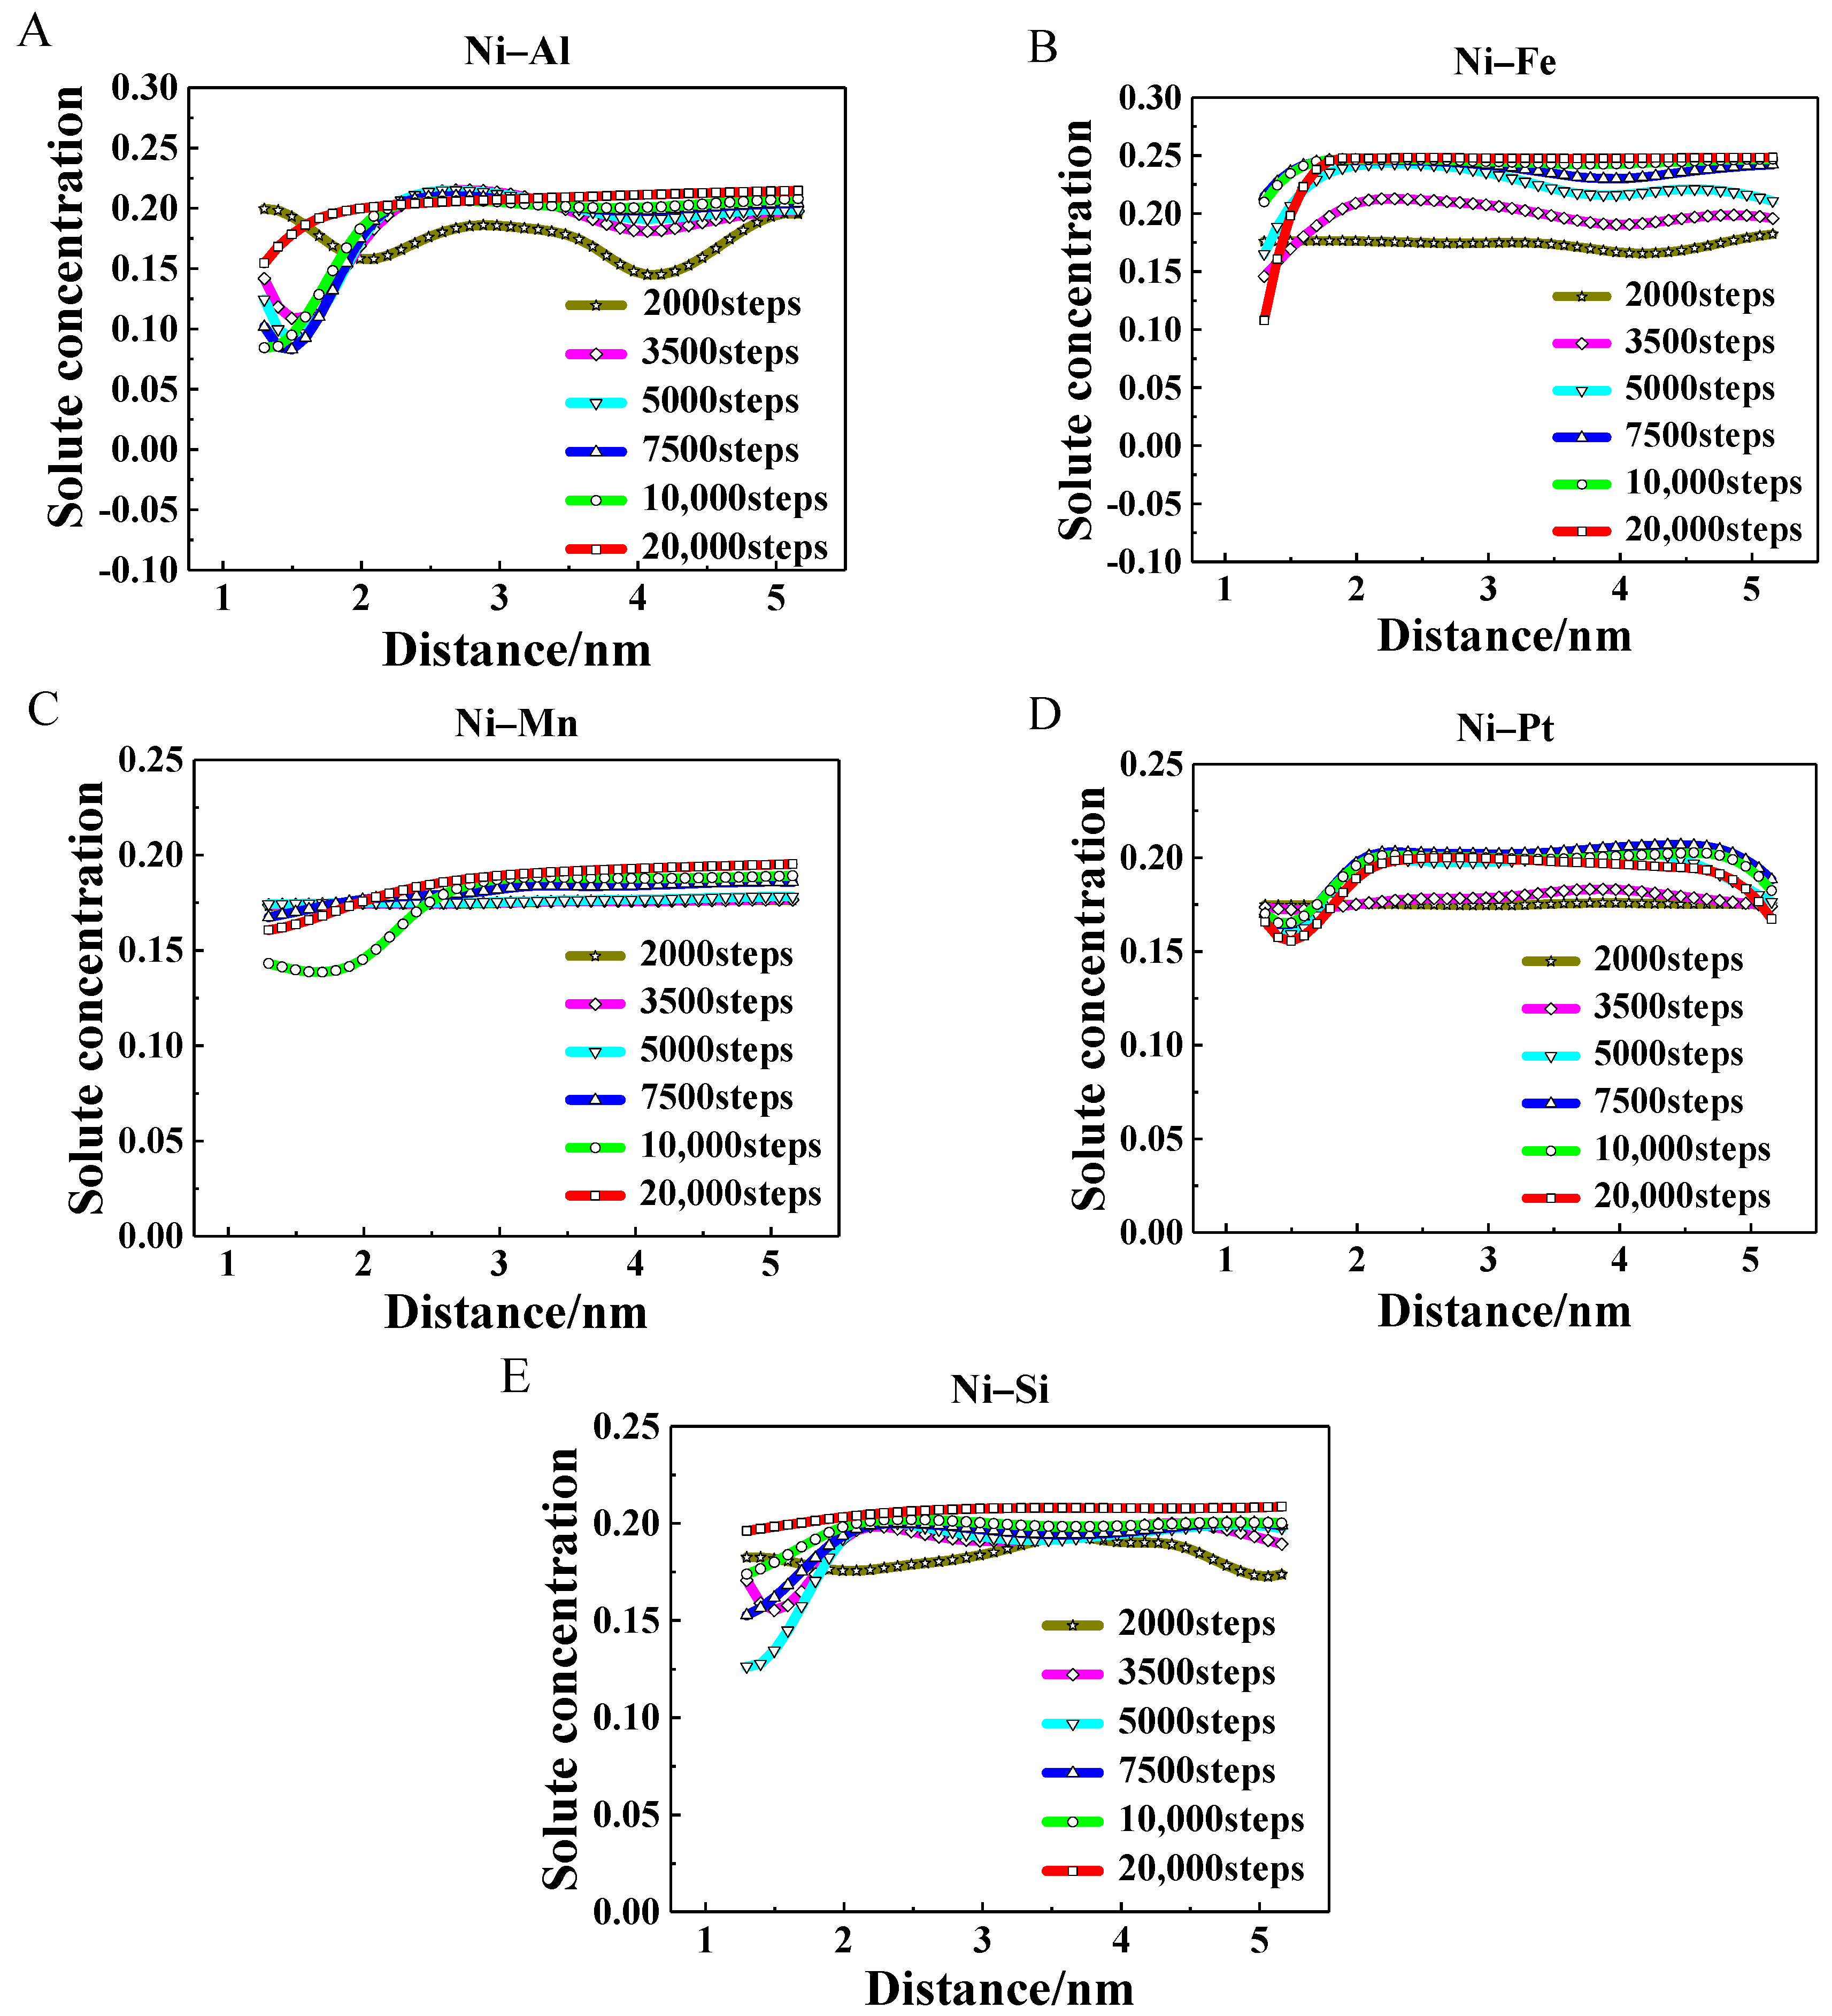
  • The morphological evolutions of the Ni–X alloys were simulated. The atomic ordering contributed to the γ′-phase precipitation from the γ phase, and the segregation and aggregation behavior of solute atoms in the γ phase greatly influenced the coarsening and growth process of the γ’ phase.
  • The different occupation probabilities between solute and solvent atoms in the γ′ precipitates were predicted in the binary alloys. The solute atoms tend to occupy corner sites and the solvent atoms prefer to occupy the face sites. The equilibrium occupation probability values of Al, Mn, Pt, and Si atoms were close to 0.8, while the value for Fe atoms was close to 1.0.
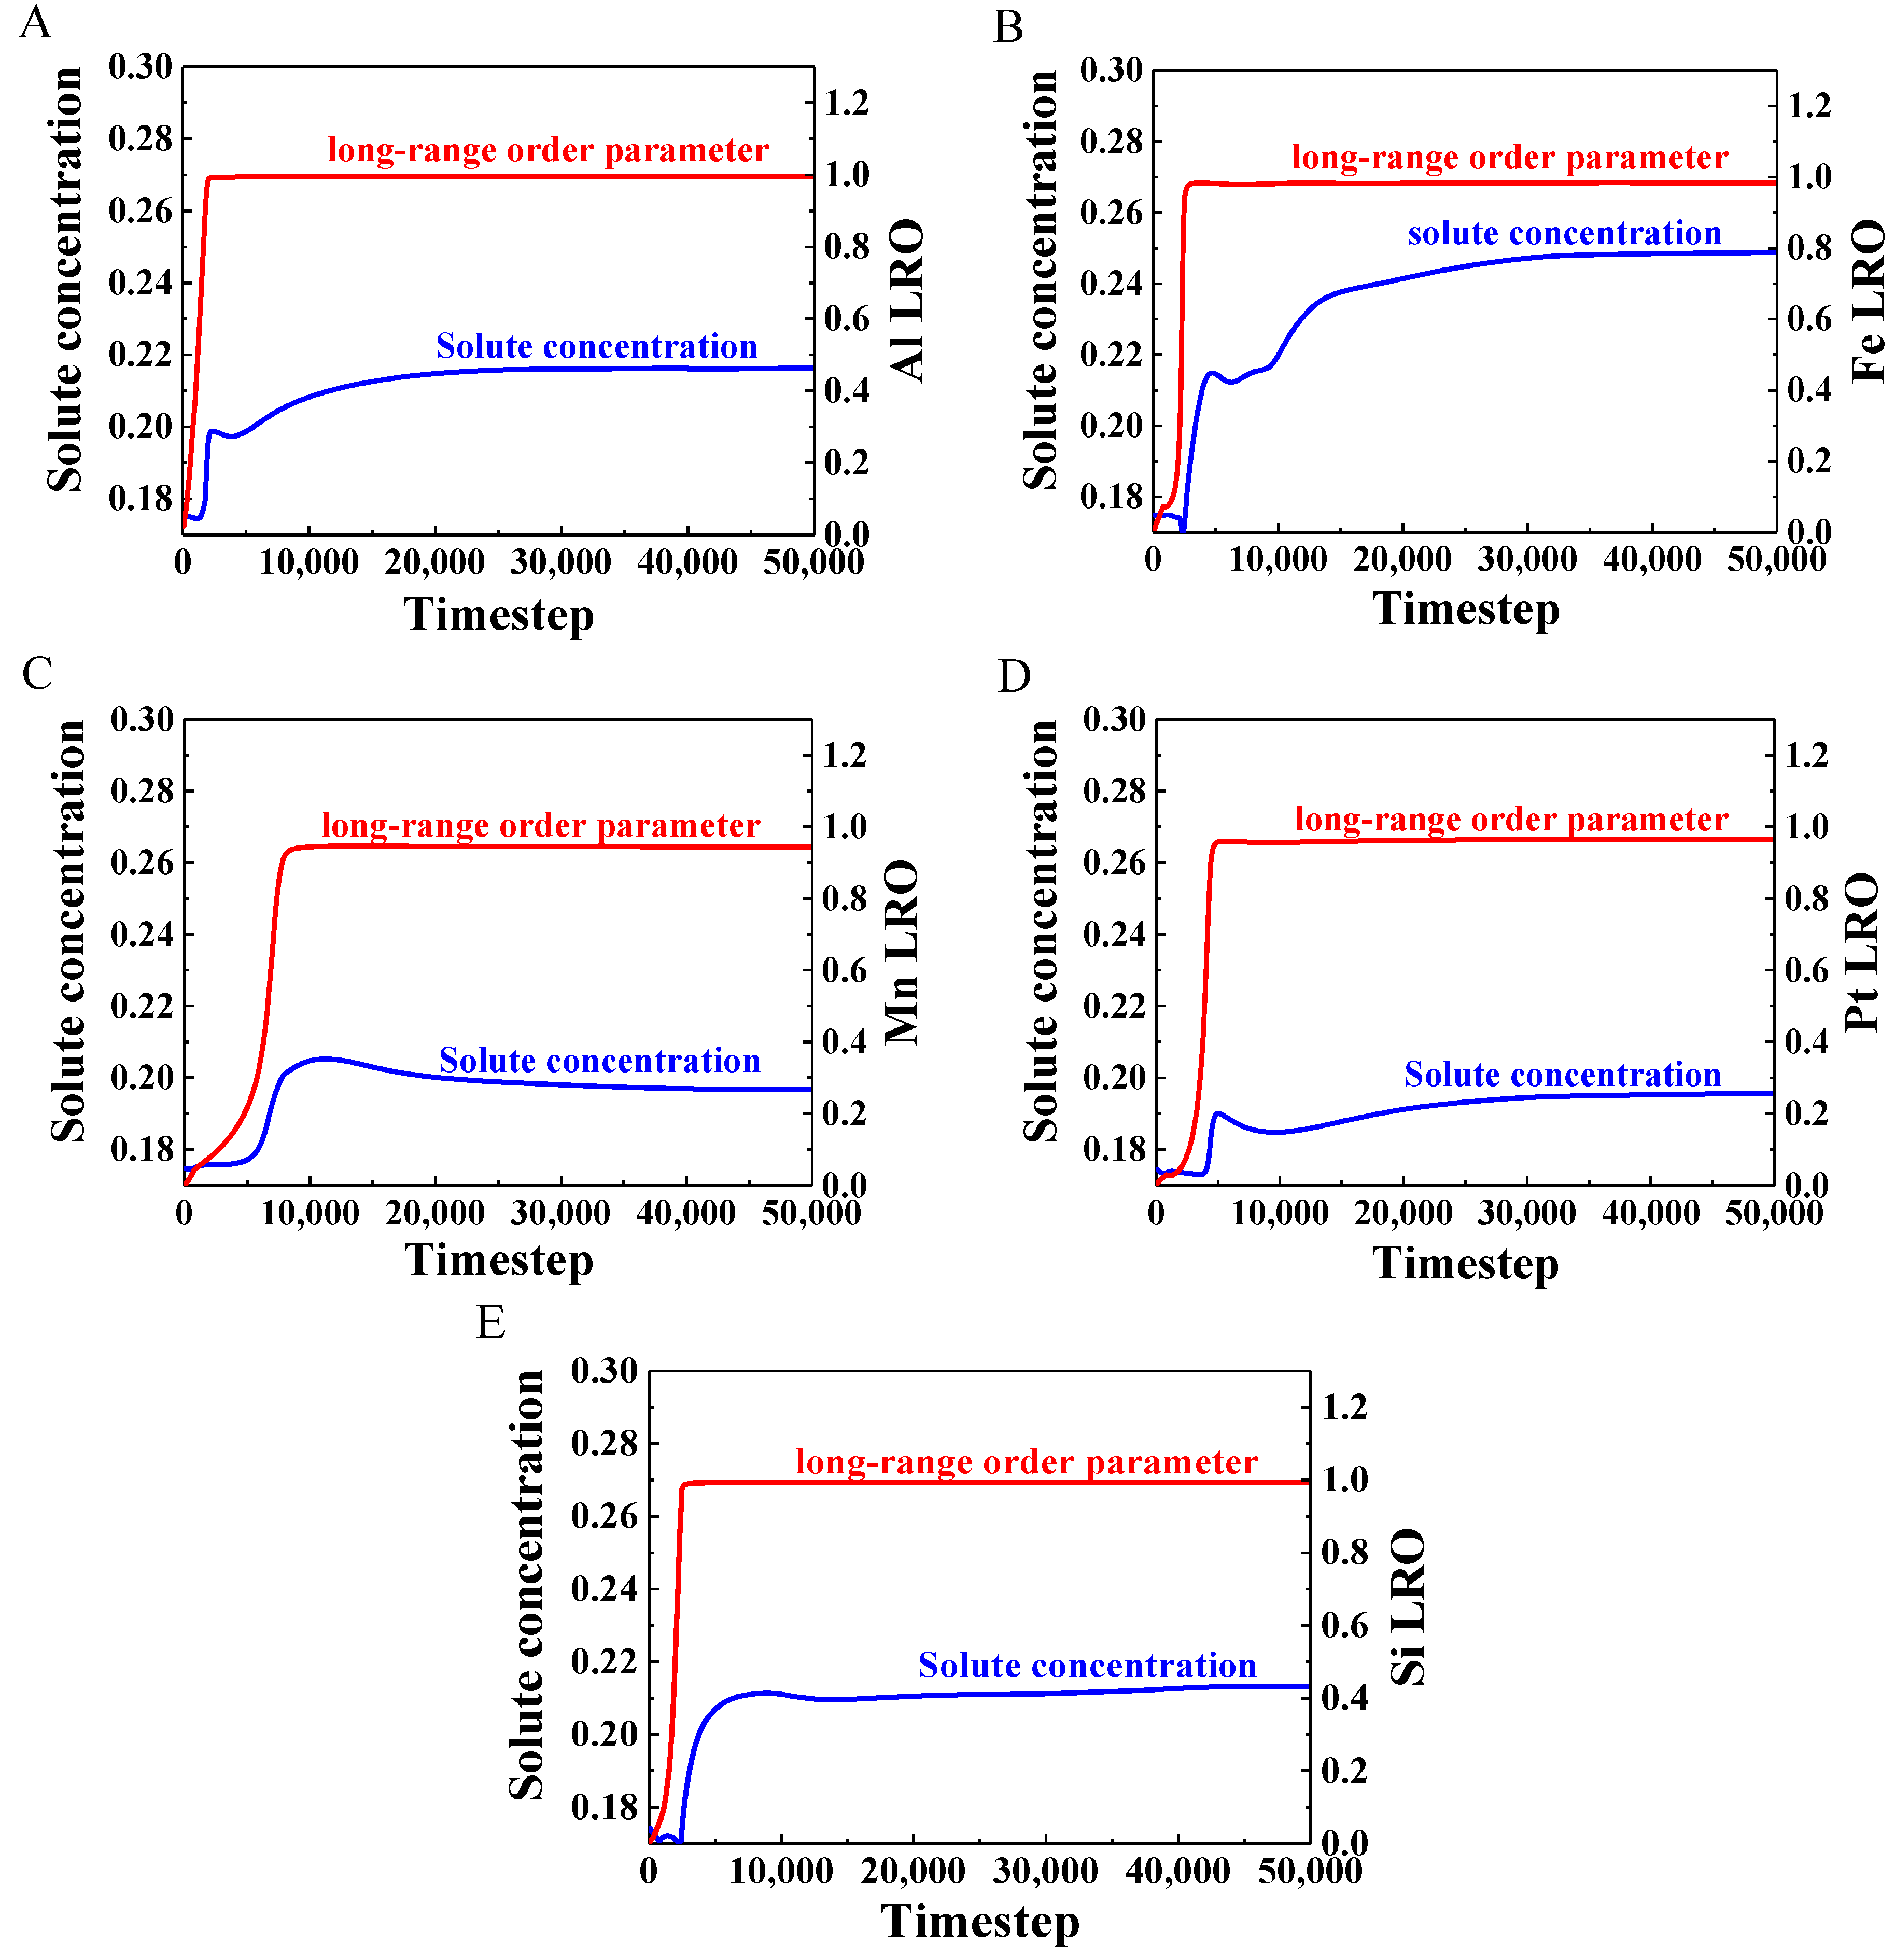
  • The temporal evolutions of the long-range parameter and the solute concentration were simulated to study the precipitation mechanism of the γ′ phase. The results showed that the long-range-order parameter (nearly 5000 timesteps) reached a steady state before the solute concentration (nearly 10,000 timesteps) in all alloys, and the clustering behavior revealed the migration of solute atoms during the precipitation process.

Author Contributions

Conceptualization, Y.Z. (Yan Zhao); methodology, Y.Z. (Yan Zhao) and X.-G.L.; writing—original draft preparation, Z.L. and X.Z.; writing—review and editing, Y.Z. (Yan Zhao); X.-G.L., C.W., and Y.Z. (Yu Zhang). All authors have read and agreed to the published version of the manuscript.

Funding

This research received no external funding.

Institutional Review Board Statement

Not applicable.

Informed Consent Statement

Not applicable.

Data Availability Statement

Not applicable.

Conflicts of Interest

The authors declare no conflict of interest.

References

  1. Soga, W.; Kaneno, Y.; Takasugi, T. Phase relation and microstructure in multi-phase intermetallic alloys based on Ni3Si–Ni3Ti–Ni3Nb pseudo-ternary alloy system. Intermetallics 2004, 12, 317–325. [Google Scholar]
  2. Wang, Y.; Banerjee, D.; Su, C.C.; Khachaturyan, A.G. Field kinetic model and computer simulation of precipitation of L12 ordered intermetallics from fcc solid solution. Acta Mater. 1998, 46, 2983–3001. [Google Scholar] [CrossRef]
  3. Sheu, H.H.; Hsiung, L.C.; Sheu, J.R. Synthesis of multiphase intermetallic compounds by mechanical alloying in Ni–Al–Ti system. J. Alloys Compd. 2009, 469, 483–487. [Google Scholar] [CrossRef]
  4. Savin, O.V.; Stepanova, N.N.; Akshentsev, Y.N.; Rodionov, D.P. Ordering kinetics in ternary Ni3Al–X alloys. Scr. Mater. 2001, 45, 883–888. [Google Scholar] [CrossRef]
  5. Chen, L.Q. A computer simulation technique for spinodal decomposition and ordering in ternary systems. Scr. Metall. Mater. 1993, 29, 683–688. [Google Scholar] [CrossRef]
  6. Bendersky, L.A.; Biancaniello, F.S.; Williams, M.E. Evolution of the two-phase microstructure L12 + DO22 in near-eutectoid Ni3(Al,V) alloy. J. Mater. Res. 1994, 9, 3068–3082. [Google Scholar] [CrossRef]
  7. Wu, R.; Zhao, Y.; Yin, Q.; Wang, J.; Wen, Z. Atomistic simulation studies of Ni-based superalloys. J. Alloys Compd. 2021, 855, 157355. [Google Scholar] [CrossRef]
  8. Wu, R.; Yin, Q.; Wang, J.; Mao, Q.; Wen, Z. Effect of Re on mechanical properties of single crystal Ni-based superalloys: Insights from first-principle and molecular dynamics. J. Alloys Compd. 2021, 862, 158643. [Google Scholar] [CrossRef]
  9. Wu, R.; Zhao, Y.; Liu, Y.; Ai, X. High temperature creep mechanisms of a single crystal superalloy: A phase-field simulation and microstructure characterization. Prog. Nat. Sci. 2020, 30, 366–370. [Google Scholar] [CrossRef]
  10. Cermak, J.; Rothova, V. Concentration dependence of ternary interdiffusion coefficients in Ni3Al/Ni3Al–X couples with X= Cr, Fe, Nb and Ti. Acta Mater. 2003, 51, 4411–4421. [Google Scholar] [CrossRef]
  11. Khachaturyan, A.G. Theory of structural transformations in solids. Mat. Res. Bull. 1984, 99, 125–127. [Google Scholar]
  12. Zhao, Y.; Zheng, C.; Li, X. Computer simulation of strain-induced morphological transformation of coherent precipitates. Int. J. Miner. Metall. Mater. 2003, 10, 55–60. [Google Scholar]
  13. Chen, L.Q. Computer simulation of structural transformations during precipitation of an ordered intermetallic phase. Acta Metall. Mater. 1991, 39, 2533–2551. [Google Scholar] [CrossRef]
  14. Li, X.L. Computer simulation for early precipitation of δ′(Al3Li). Prog. Nat. Sci. 2002, 12, 74. [Google Scholar]
  15. Poduri, R.; Chen, L.Q. Computer simulation of atomic ordering and compositional clustering in the pseudobinary Ni3Al–Ni3V system. Acta Mater. 1998, 46, 1719–1729. [Google Scholar] [CrossRef]
  16. Lu, X.G.; Wang, Z.; Cui, Y.; Jin, Z. Computational thermodynamics, computational kinetics, and materials design. Sci. Bull. 2014, 59, 1662–1671. [Google Scholar] [CrossRef]
  17. Mishin, Y.; Lozovoi, A.Y. Angular-dependent interatomic potential for tantalum. Acta Mater. 2006, 54, 5013–5026. [Google Scholar] [CrossRef]
  18. Kim, H.K.; Jung, W.S.; Lee, B.J. Modified embedded-atom method interatomic potentials for the Nb-C, Nb-N, Fe-Nb-C, and Fe-Nb-N system. J. Mater. Res. 2010, 25, 1288–1297. [Google Scholar] [CrossRef]
  19. Chen, L.Q.; Khachaturyan, A.G. Computer simulation of decomposition reactions accompanied by a congruent ordering of the second kind. Scr. Metall. Mater. 1991, 25, 61–66. [Google Scholar] [CrossRef]
  20. Khachaturyan, A.G. Nonlinear integral equations and their application to the problem of orderable alloys. Sov. Phys. Solid State. 1963, 5, 16–22. [Google Scholar]
  21. Khachaturyan, A.G. The problem of symmetry in statistical thermodynamics of substitutional and interstitial ordered solid solutions. Phys. Status Solidi-B 1973, 60, 9–37. [Google Scholar] [CrossRef]
  22. Andersson, J.O.; Helander, T.; Hglund, L. Thermo-Calc & DICTRA, computational tools for materials science. Calphad 2002, 26, 273–312. [Google Scholar]
  23. Wang, Y.; Chen, L.Q.; Khachaturyan, A.G. Kinetics of strain-induced morphological transformation in cubic alloys with a miscibility gap. Acta Metall. Mater. 1993, 41, 279–296. [Google Scholar] [CrossRef]
  24. Chen, L.Q.; Simmons, J.A. Microscopic master equation approach to diffusion transformations in inhomogeneous systems-single-site approximation and direct exchange mechanism. Acta Metall. Mater. 1994, 42, 2943–2954. [Google Scholar] [CrossRef]
Figure 1. The Ni–Al partial binary phase diagram.
Crystals 12 00971 g001
Figure 2. The 1st and 2nd nearest-neighbor interaction energies ( V α β 1 and V α β 2 ) for: (A) Ni–Al; (B) Ni–Fe; (C) Ni–Mn; (D) Ni–Pt; (E) Ni–Si.
Crystals 12 00971 g002
Figure 3. The γ’-phase structure and its projections.
Crystals 12 00971 g003
Figure 4. Microstructural evolution at simulation time t* = 2000, 5000, 10,000, and 20,000 for: Ni–Al at 1574 K (A1A4); Ni–Fe at 686 K (B1B4); Ni–Mn at 618 K (C1C4); Ni–Pt at 638 K (D1D4); Ni–Si at 1162 K (E1E4).
Crystals 12 00971 g004aCrystals 12 00971 g004b
Figure 5. Variations of the solute concentration with distance for: (A) Ni–Al; (B) Ni–Fe; (C) Ni–Mn; (D) Ni–Pt; (E) Ni–Si.
Crystals 12 00971 g005
Figure 6. Occupancy probabilities (OCP) of solute atoms for: (A) Al; (B) Fe; (C) Mn; (D) Pt; (E) Si at corner and face sites as a function of timestep.
Crystals 12 00971 g006
Figure 7. The temporal evolution of long-range-order parameter and solute concentration for: (A) Ni–Al; (B) Ni–Fe; (C) Ni–Mn; (D) Ni–Pt; (E) Ni–Si.
Crystals 12 00971 g007
Publisher’s Note: MDPI stays neutral with regard to jurisdictional claims in published maps and institutional affiliations.

