
Preparation of Cerium Oxide via Microwave Heating: Research on Effect of Temperature Field on Particles

 ,
,
Abstract
:1. Introduction
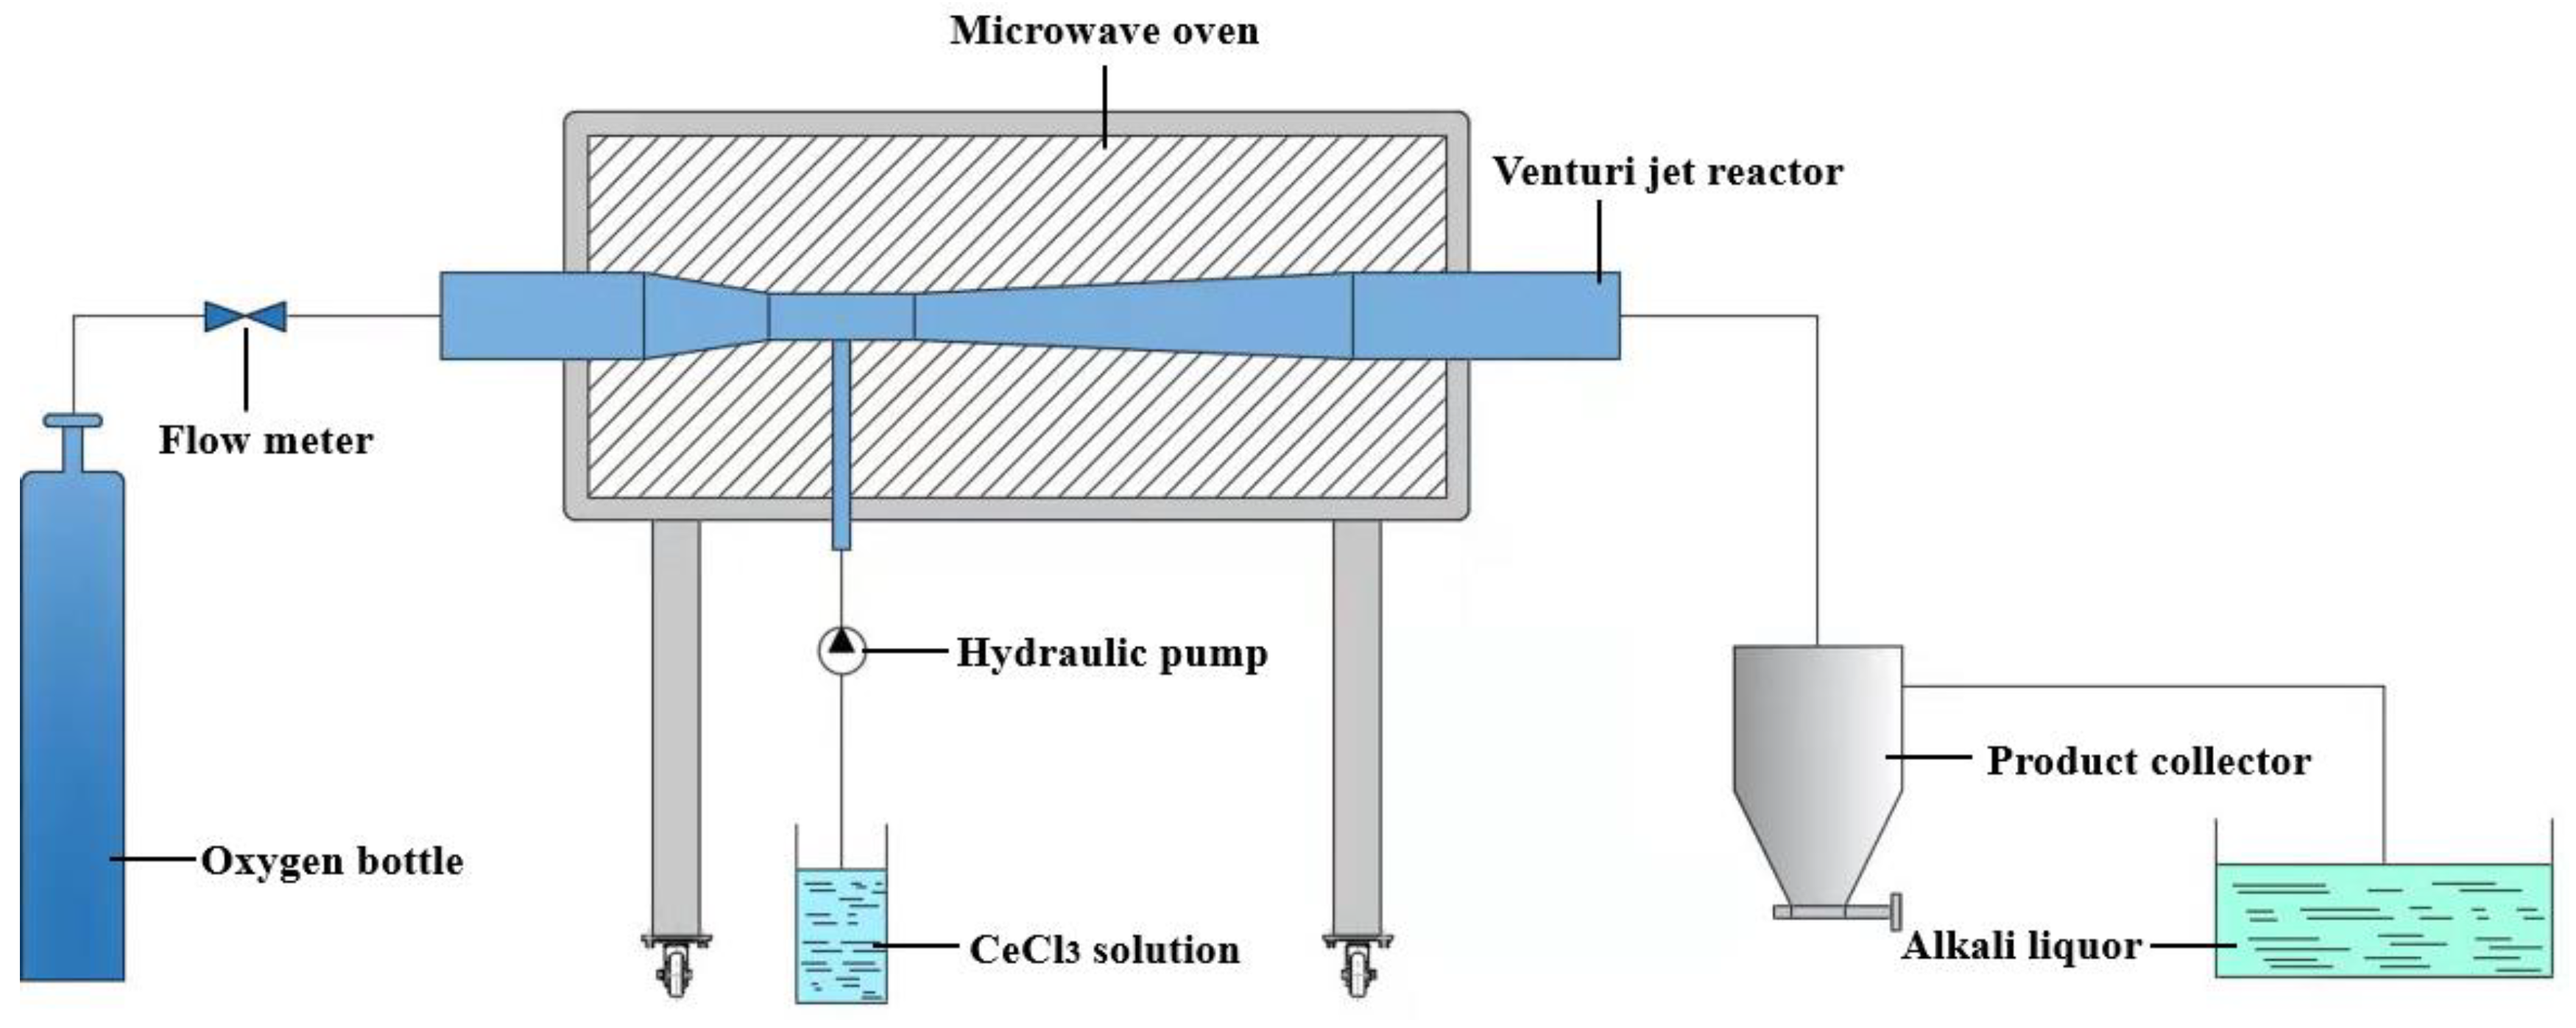
2. Experimental
3. Numerical Simulation
3.1. Geometry
3.2. Governing Equation
3.3. Material and Boundary Conditions
- Microwave frequency is constant (2.45 GHz).
- The initial temperature inside the reactor is uniform (25 °C).
- The fluid inside the reactor is incompressible.
- Permeability is constant at 1.
3.4. Independence Verification of Grid
4. Results and Discussion
4.1. Effect of Microwave Power
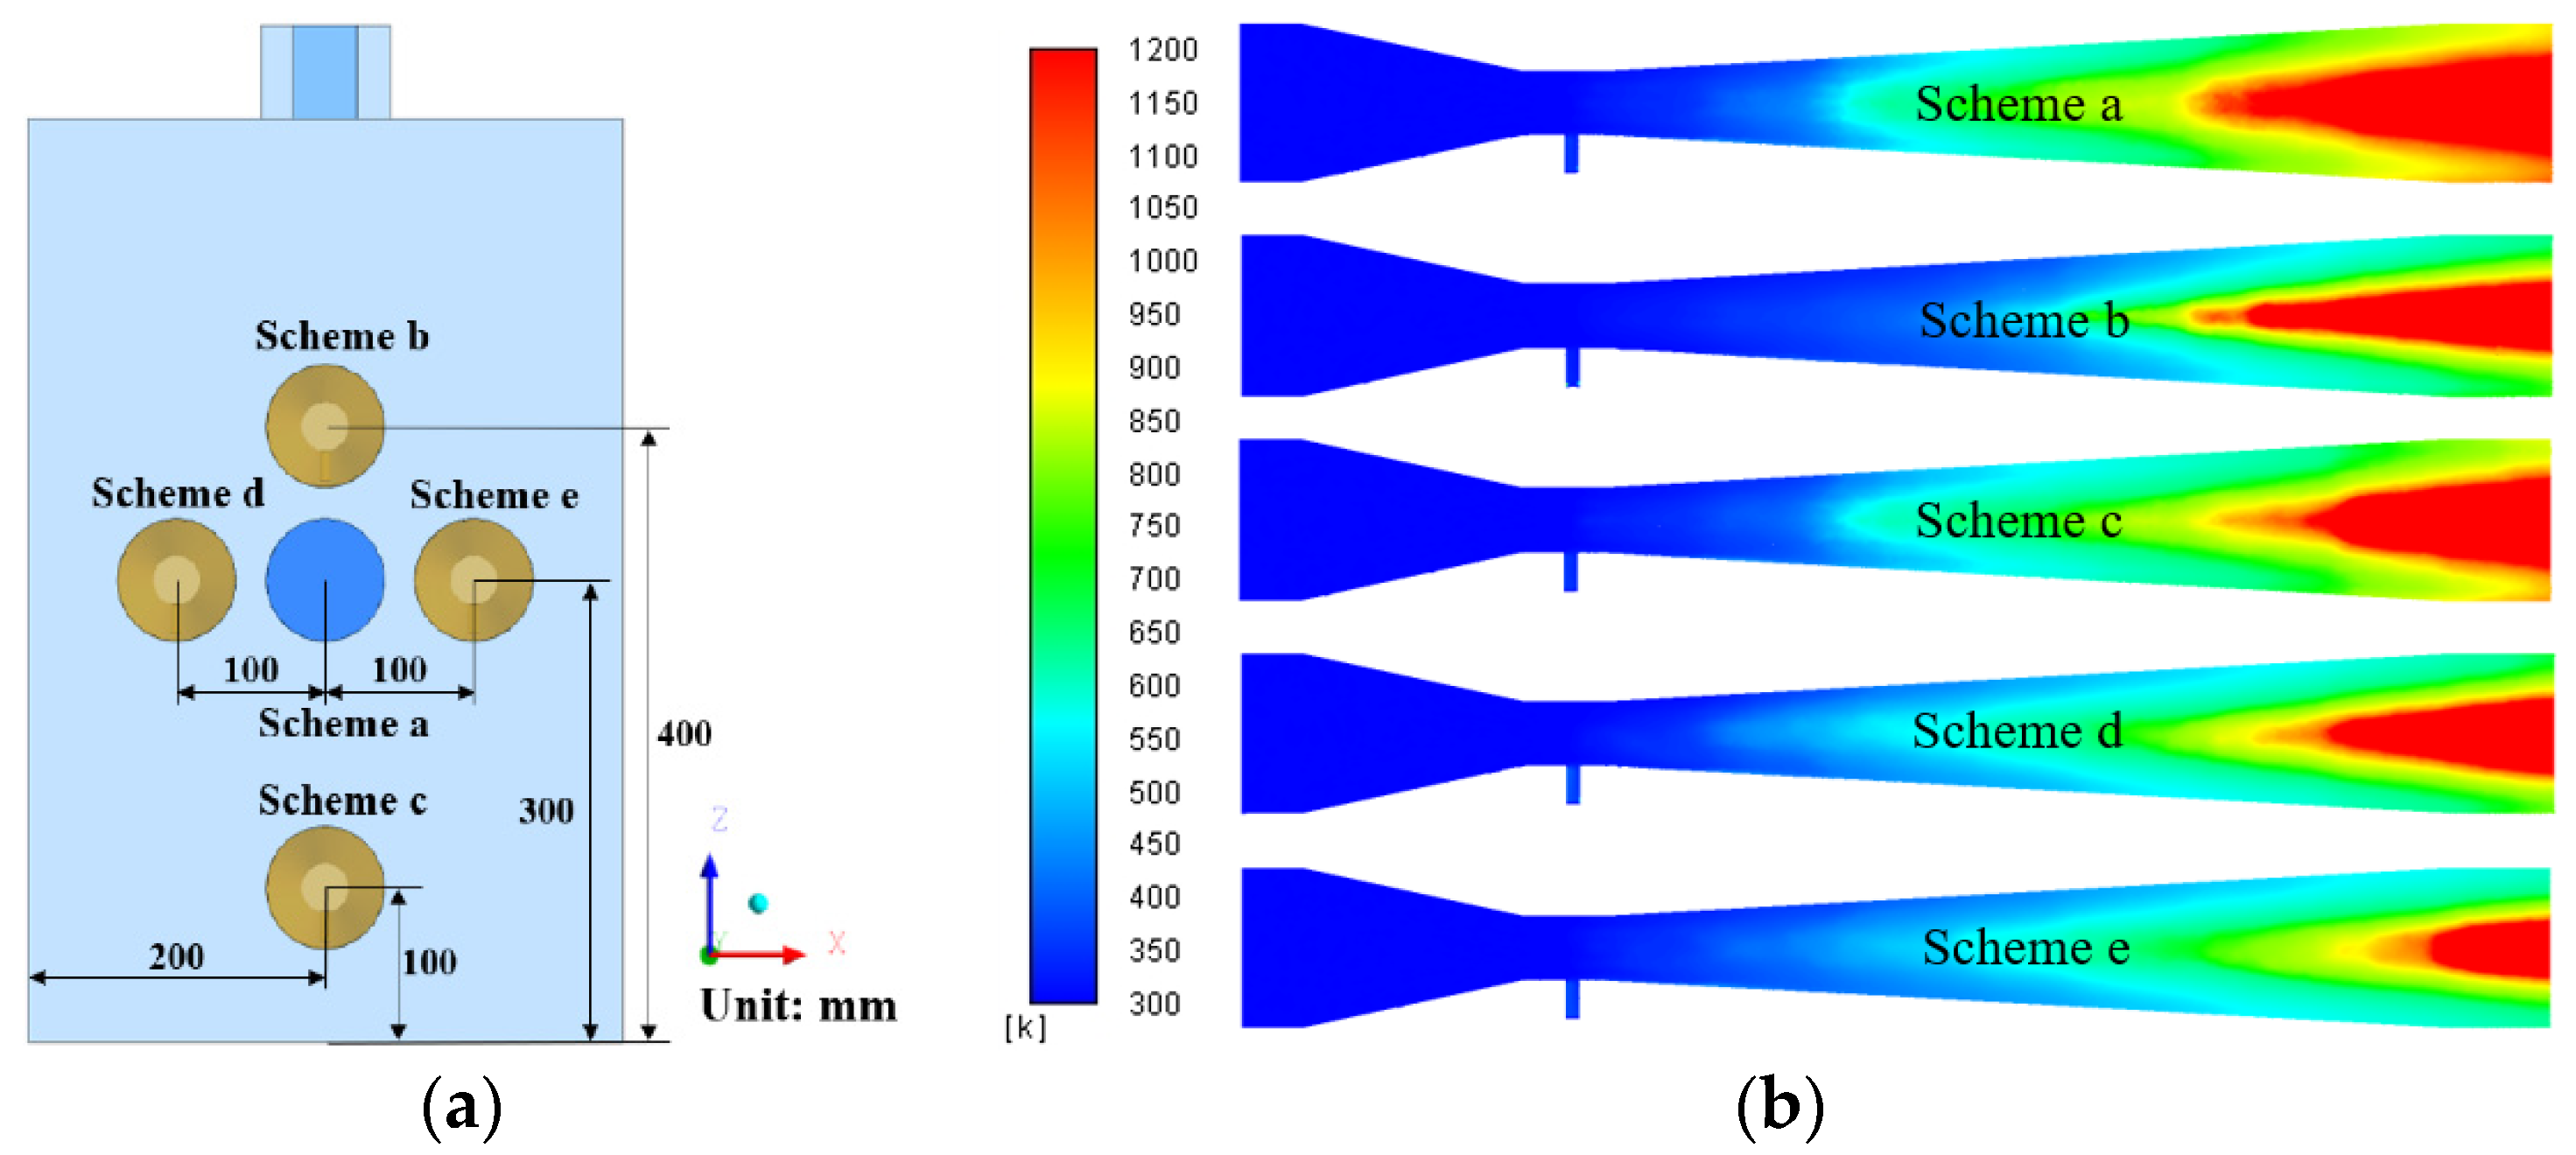
4.2. Effects of Reactor Location
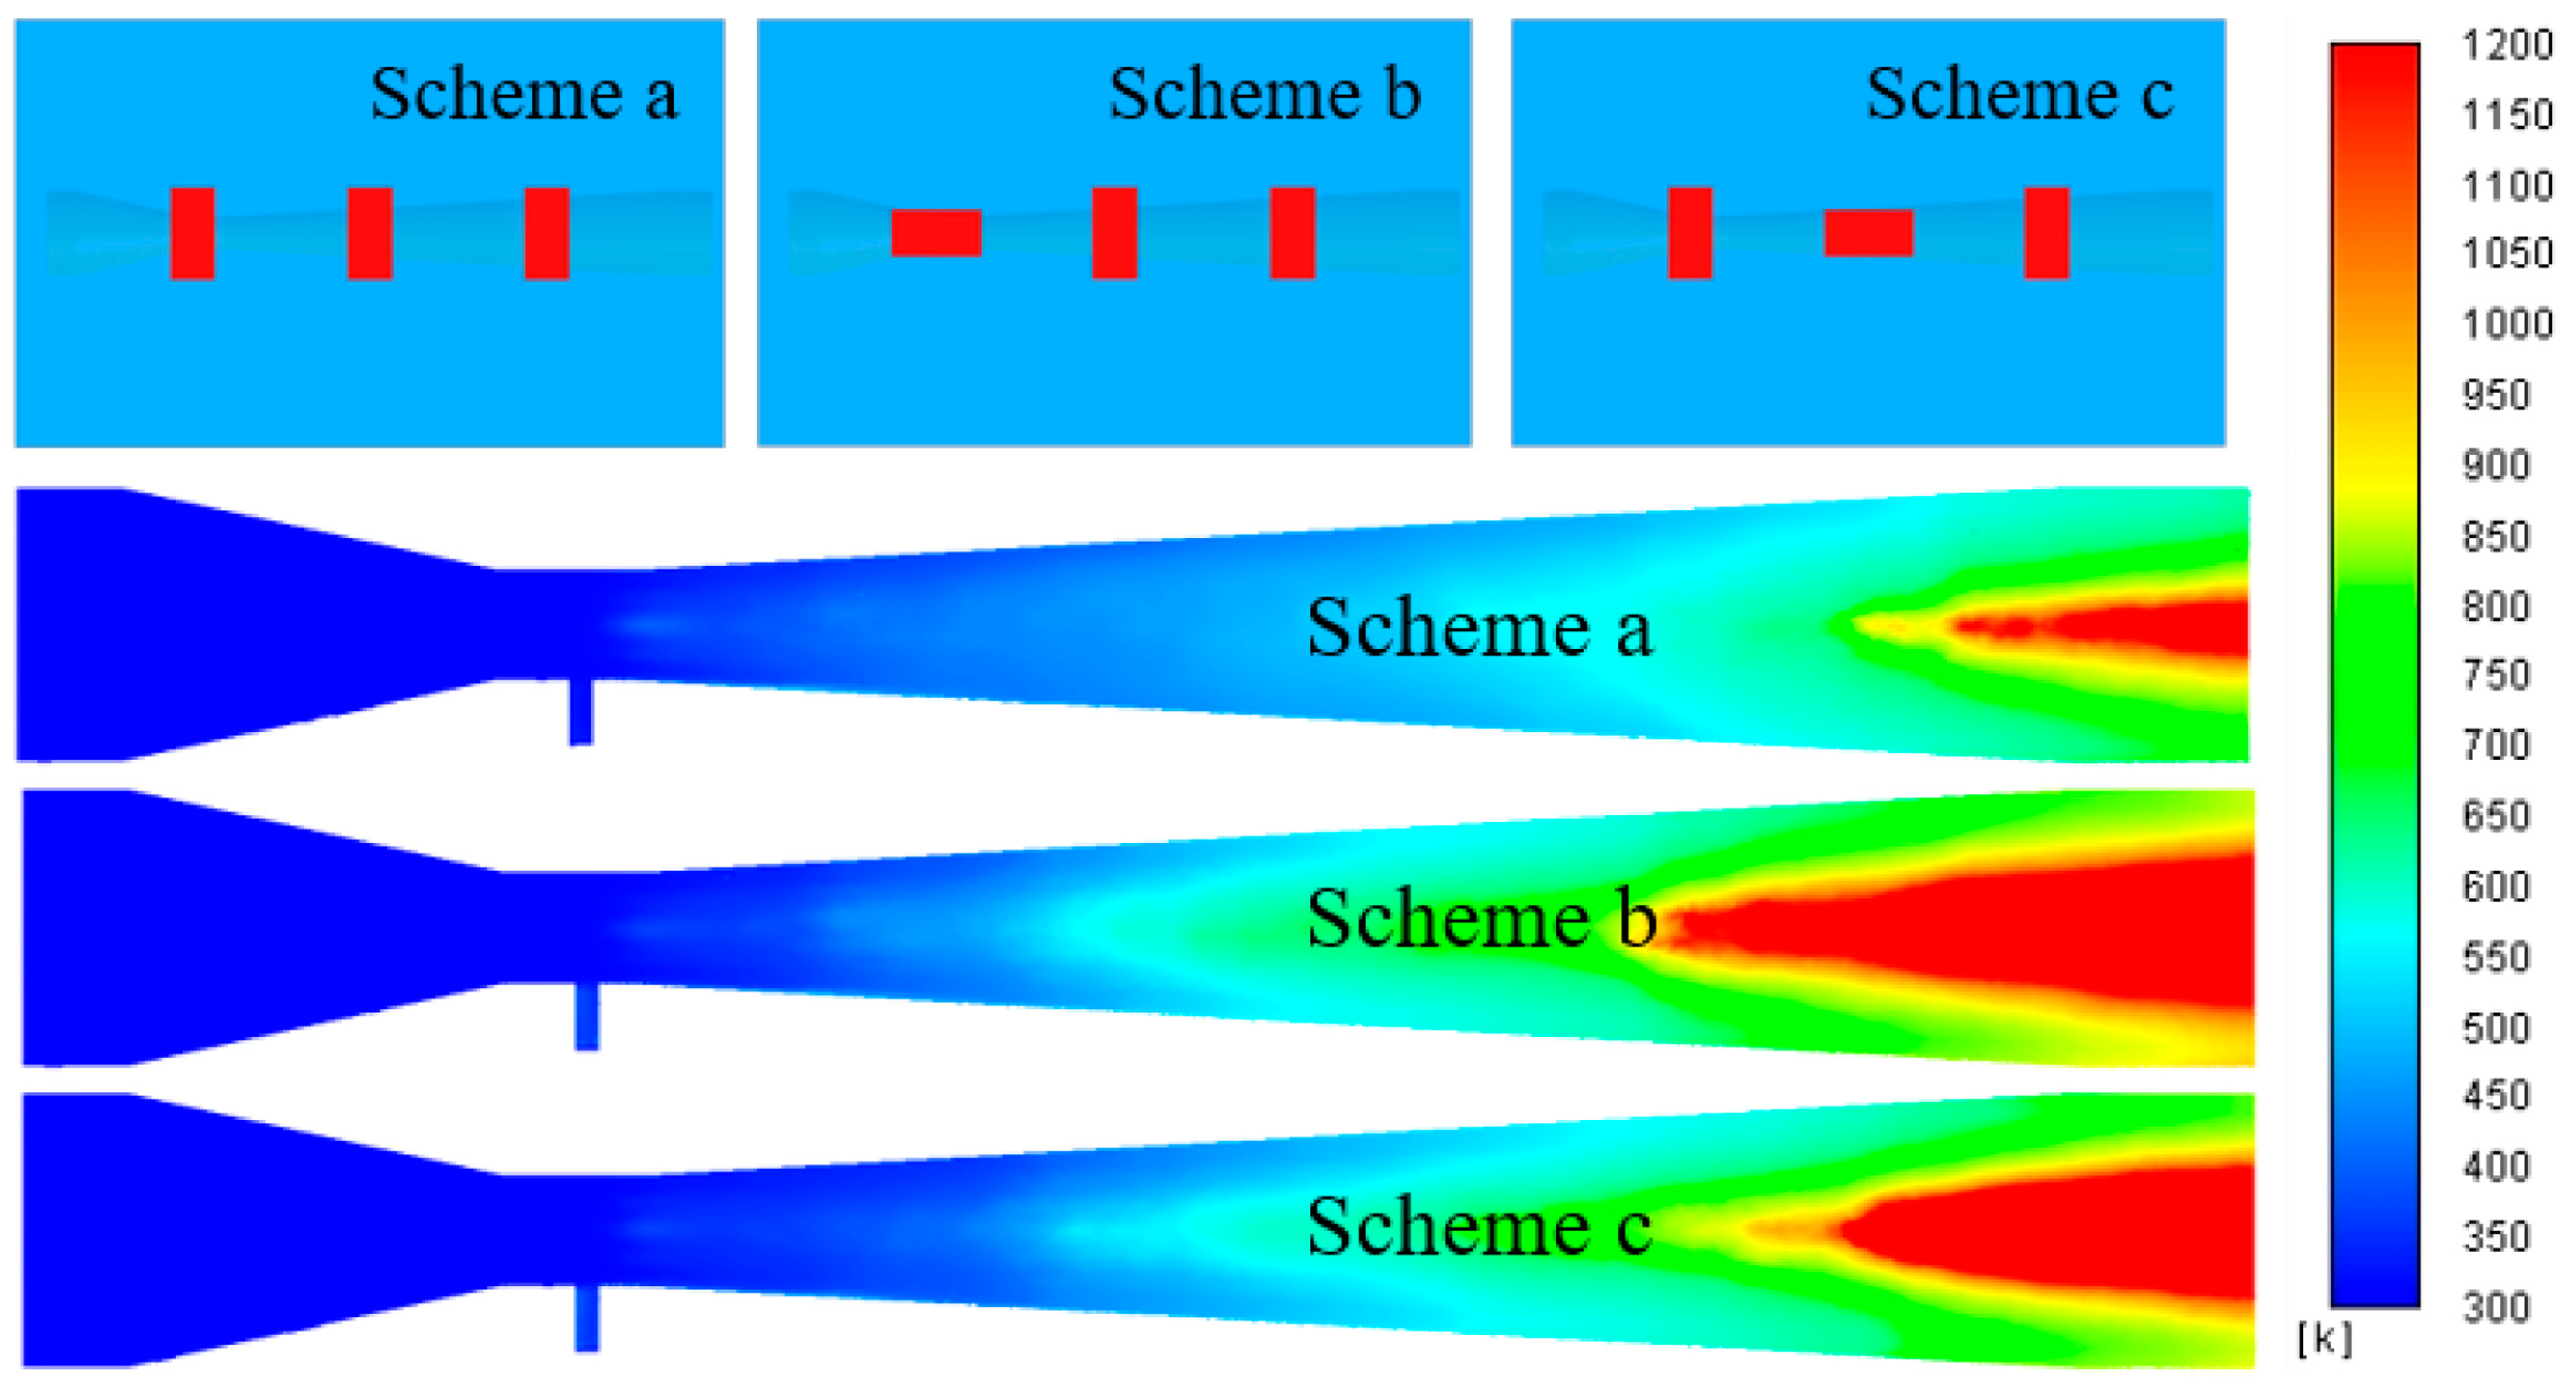
4.3. Effects of Waveguide Distribution
5. Conclusions
- Microwave power had significant effects on the purity of the products. Higher power contributed to higher purity and an improvement of the degree of crystallinity of CeO2. When microwave power reached 16 kW, sphere-like CeO2 particles were obtained and the residual Cl− content was only 0.15%. Increasing microwave power also had benefits for obtaining a more regular morphology of particles.
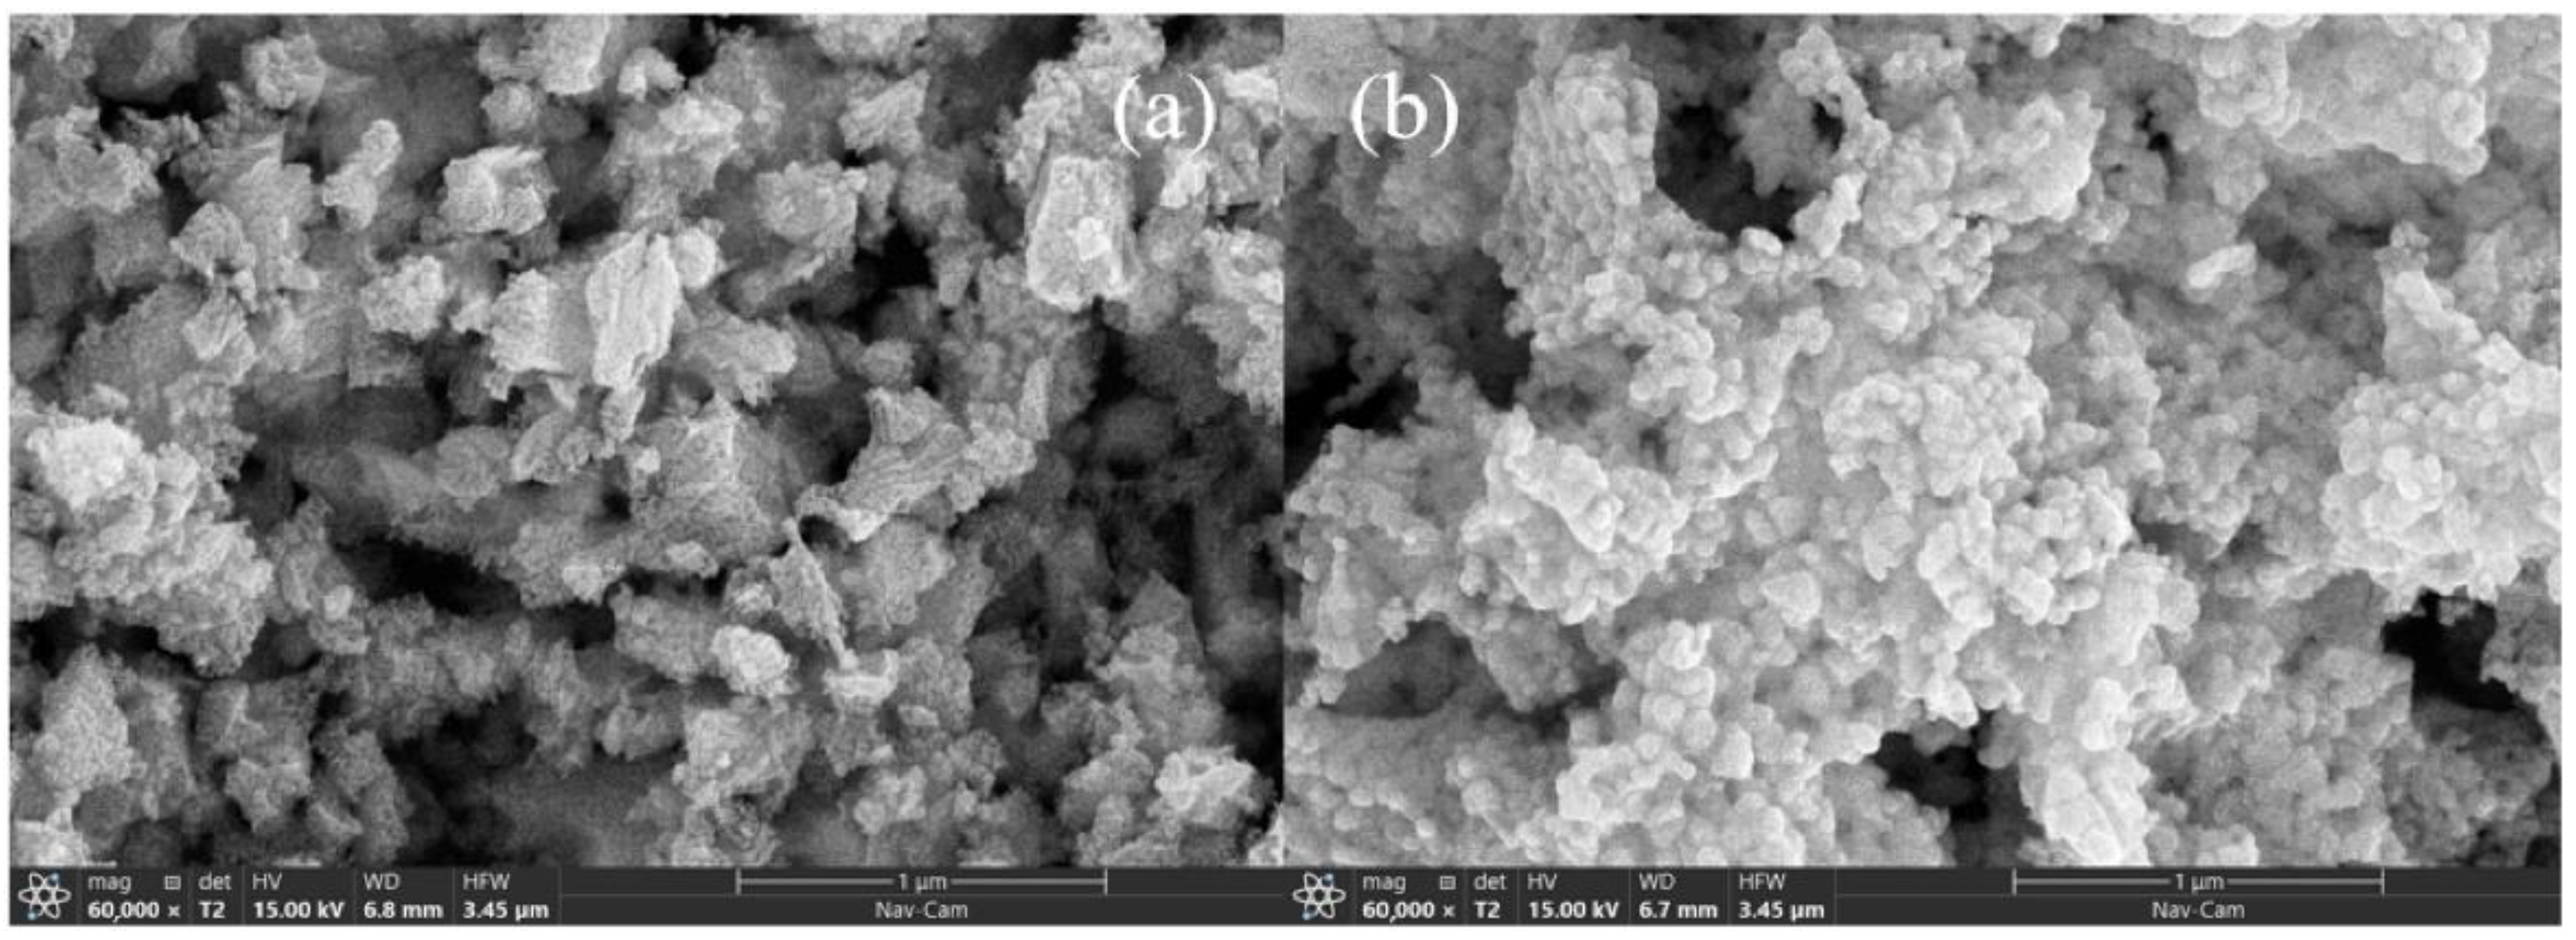
- Various reactor locations caused various temperature fields to present varied temperature gradients and dispersities, which had a remarkable effect on the microstructure of CeO2 particles. The simulated nephogram of temperature fields combined with SEM images showed that large temperature gradients caused agglomeration and bulk particles to appear, and better temperature dispersity contributed to a better dispersity of particles. When the reactor was located in the center of the cavity, CeO2 particles with a regular morphology were prepared, which had an average size of 80 nm.
- Varied waveguide arrangements also caused various temperature fields. The vertical arrangement of waveguides had the advantages of higher temperature value, gentle gradient and better dispersity. It was predicted that the actual value of Cl− content was close to 2.07% when the waveguides were distributed in Scheme (b). Moreover, the morphology was similar to Scheme (c) and better than Scheme (a).
Author Contributions
Funding
Institutional Review Board Statement
Informed Consent Statement
Data Availability Statement
Conflicts of Interest
References
- Fujiwara, A.; Yoshida, H. In-Situ diffuse reflectance spectroscopy analysis of Pd/CeO2–ZrO2 model three-way catalysts under Lean-Rich cycling condition. Catal. Today 2021, 376, 269–275. [Google Scholar] [CrossRef]
- Chen, Y.S.; Fan, J. Synthesis of high stability nanosized Rh/CeO2–ZrO2 three-way automotive catalysts by Rh chemical state regulation. J. Energy Inst. 2020, 93, 2325–2333. [Google Scholar] [CrossRef]
- Fan, J.; Chen, Y.S. A simple and effective method to synthesize Pt/CeO2 three-way catalysts with high activity and hydrothermal stability. J. Environ. Chem. Eng. 2020, 8, 104236. [Google Scholar] [CrossRef]
- Jiang, D.; Wan, G. Elucidation of the Active Sites in Single-Atom Pd1/CeO2 Catalysts for Low-Temperature CO Oxidation. ACS Catal. 2020, 10, 11356–11364. [Google Scholar] [CrossRef]
- Xiang, L. Study on the Preparation of Light Rare Earth Oxide from Rare Earth Chloride Roasted Statically. Master’s Thesis, Northeastern University, Shenyang, China, 2010. [Google Scholar]
- Li, H.; Xu, J.L. Food waste pyrolysis by traditional heating and microwave heating: A review. Fuel 2022, 324, 124574. [Google Scholar] [CrossRef]
- Arballo, J.R.; Goni, S.M. Modeling of fluid dynamics and water vapor transport in microwave ovens—ScienceDirect. Food Bioprod. Process. 2020, 119, 75–87. [Google Scholar] [CrossRef]
- Wang, B.; Zheng, H.B. Microwave-assisted fast pyrolysis of waste tires: Effect of microwave power on products composition and quality. J. Anal. Appl. Pyrolysis 2021, 155, 104979. [Google Scholar]
- Zhou, N.; Dai, L.L. Catalytic pyrolysis of plastic wastes in a continuous microwave assisted pyrolysis system for fuel production. Chem. Eng. J. 2021, 418, 129412. [Google Scholar] [CrossRef]
- Luo, W.; Huang, S.Y. Three-dimensional mesostructure model of coupled electromagnetic and heat transfer for microwave heating on steel slag asphalt mixtures. Constr. Build. Mater. 2022, 330, 127235. [Google Scholar] [CrossRef]
- Shen, X.; Li, H. Imaging of liquid temperature distribution during microwave heating via thermochromic metal organic frameworks. Int. J. Heat Mass Transfer. 2022, 189, 122667. [Google Scholar] [CrossRef]
- Chen, H. Study on Preparation and Mechanism of Yttria-Stabilized Zirconia Nanosized Powder by Microwave Pyrolysis. Master’s Thesis, Zhengzhou University, Zhengzhou, China, 2014. [Google Scholar]
- Sadeghi, A.; Hassanzadeh, H. Thermal analysis of high frequency electromagnetic heating of lossy porous media. Chem. Eng. Sci. 2017, 172, 13–22. [Google Scholar] [CrossRef]
- Lv, C.; Sun, M.H. Pyrolysis Preparation Process of CeO2 with the Addition of Citric Acid: A Fundamental Study. Crystals 2021, 11, 912. [Google Scholar] [CrossRef]
- Xu, T.; Song, G. Visualization and simulation of steel metallurgy processes. Int. J. Miner. Metall. Mater. 2021, 28, 1387–1396. [Google Scholar] [CrossRef]
- Yuan, F.; Xu, A.J. Development of an improved CBR model for predicting steel temperature in ladle furnace refining. J. Miner. Metall. Mater. 2021, 28, 1321–1331. [Google Scholar] [CrossRef]
- Yu, S.Z.; Duan, Y. Three-dimensional simulation of a novel microwave-assisted heating device for methyl ricinoleate pyrolysis. Appl. Therm. Eng. 2019, 153, 341–351. [Google Scholar] [CrossRef]
- Zhu, J.Y.; Yi, L.P. Three-dimensional numerical simulation on the thermal response of oil shale subjected to microwave heating. Chem. Eng. J. 2021, 407, 127197. [Google Scholar] [CrossRef]
- Ye, D.L. Practical Inorganic Thermodynamics Data Manual; Cao, S.L., Ed.; Metallurgical Industry Press: Beijing, China, 1981; pp. 262–263, 265–266. [Google Scholar]


| Length/mm | Width/mm | Height/mm | Diameter/mm | |
|---|---|---|---|---|
| Cavity | 690 | 400 | 600 | - |
| Waveguide | 86.36 | 43.18 | 60 | - |
| L1 | - | - | 30 | - |
| L2 | - | - | 110 | - |
| L3 | - | - | 40 | - |
| L4 | - | - | 419 | - |
| L5 | - | - | 50 | - |
| D1 | - | - | - | 80 |
| D3 | - | - | - | 32 |
| D5 | - | - | - | 80 |
| Dm | - | - | - | 7 |
| Properties | Dielectric Constant | Loss Factor | Electrical Conductivity | Thermal Conductivity | Specific Heat | Density |
|---|---|---|---|---|---|---|
| Symbol | ε′ | ε″ | σ | k | Cp | ρ |
| Value | 80.49 | 0.785 | 0.1383 S/m | 0.53 W/(m·K) | 5.025 J/(g·K) | 1.023 g/cm3 |
| Function | T | T | T | T | T | - |
| Source | This study | This study | This study | This study | This study | This study |
| Boundary Type | Value | |
|---|---|---|
| Excitation | Wave port | - |
| Wall of waveguides and cavity | Perfect E boundary | - |
| Gas velocity | Velocity-inlet | 7 m/s |
| Material velocity | Velocity-inlet | 0.2 m/s |
| Outlet | Outflow | - |
Publisher’s Note: MDPI stays neutral with regard to jurisdictional claims in published maps and institutional affiliations. |
© 2022 by the authors. Licensee MDPI, Basel, Switzerland. This article is an open access article distributed under the terms and conditions of the Creative Commons Attribution (CC BY) license (https://creativecommons.org/licenses/by/4.0/).
Share and Cite
Lv, C.; Yin, H.-X.; Liu, Y.-L.; Chen, X.-X.; Sun, M.-H.; Zhao, H.-L. Preparation of Cerium Oxide via Microwave Heating: Research on Effect of Temperature Field on Particles. Crystals 2022, 12, 843. https://doi.org/10.3390/cryst12060843
Lv C, Yin H-X, Liu Y-L, Chen X-X, Sun M-H, Zhao H-L. Preparation of Cerium Oxide via Microwave Heating: Research on Effect of Temperature Field on Particles. Crystals. 2022; 12(6):843. https://doi.org/10.3390/cryst12060843
Chicago/Turabian StyleLv, Chao, Hong-Xin Yin, Yan-Long Liu, Xu-Xin Chen, Ming-He Sun, and Hong-Liang Zhao. 2022. "Preparation of Cerium Oxide via Microwave Heating: Research on Effect of Temperature Field on Particles" Crystals 12, no. 6: 843. https://doi.org/10.3390/cryst12060843