
Non-Destructive Analysis of a High-Power Capacitor Using High-Energy X-ray Compton Scattering

 , and
, and 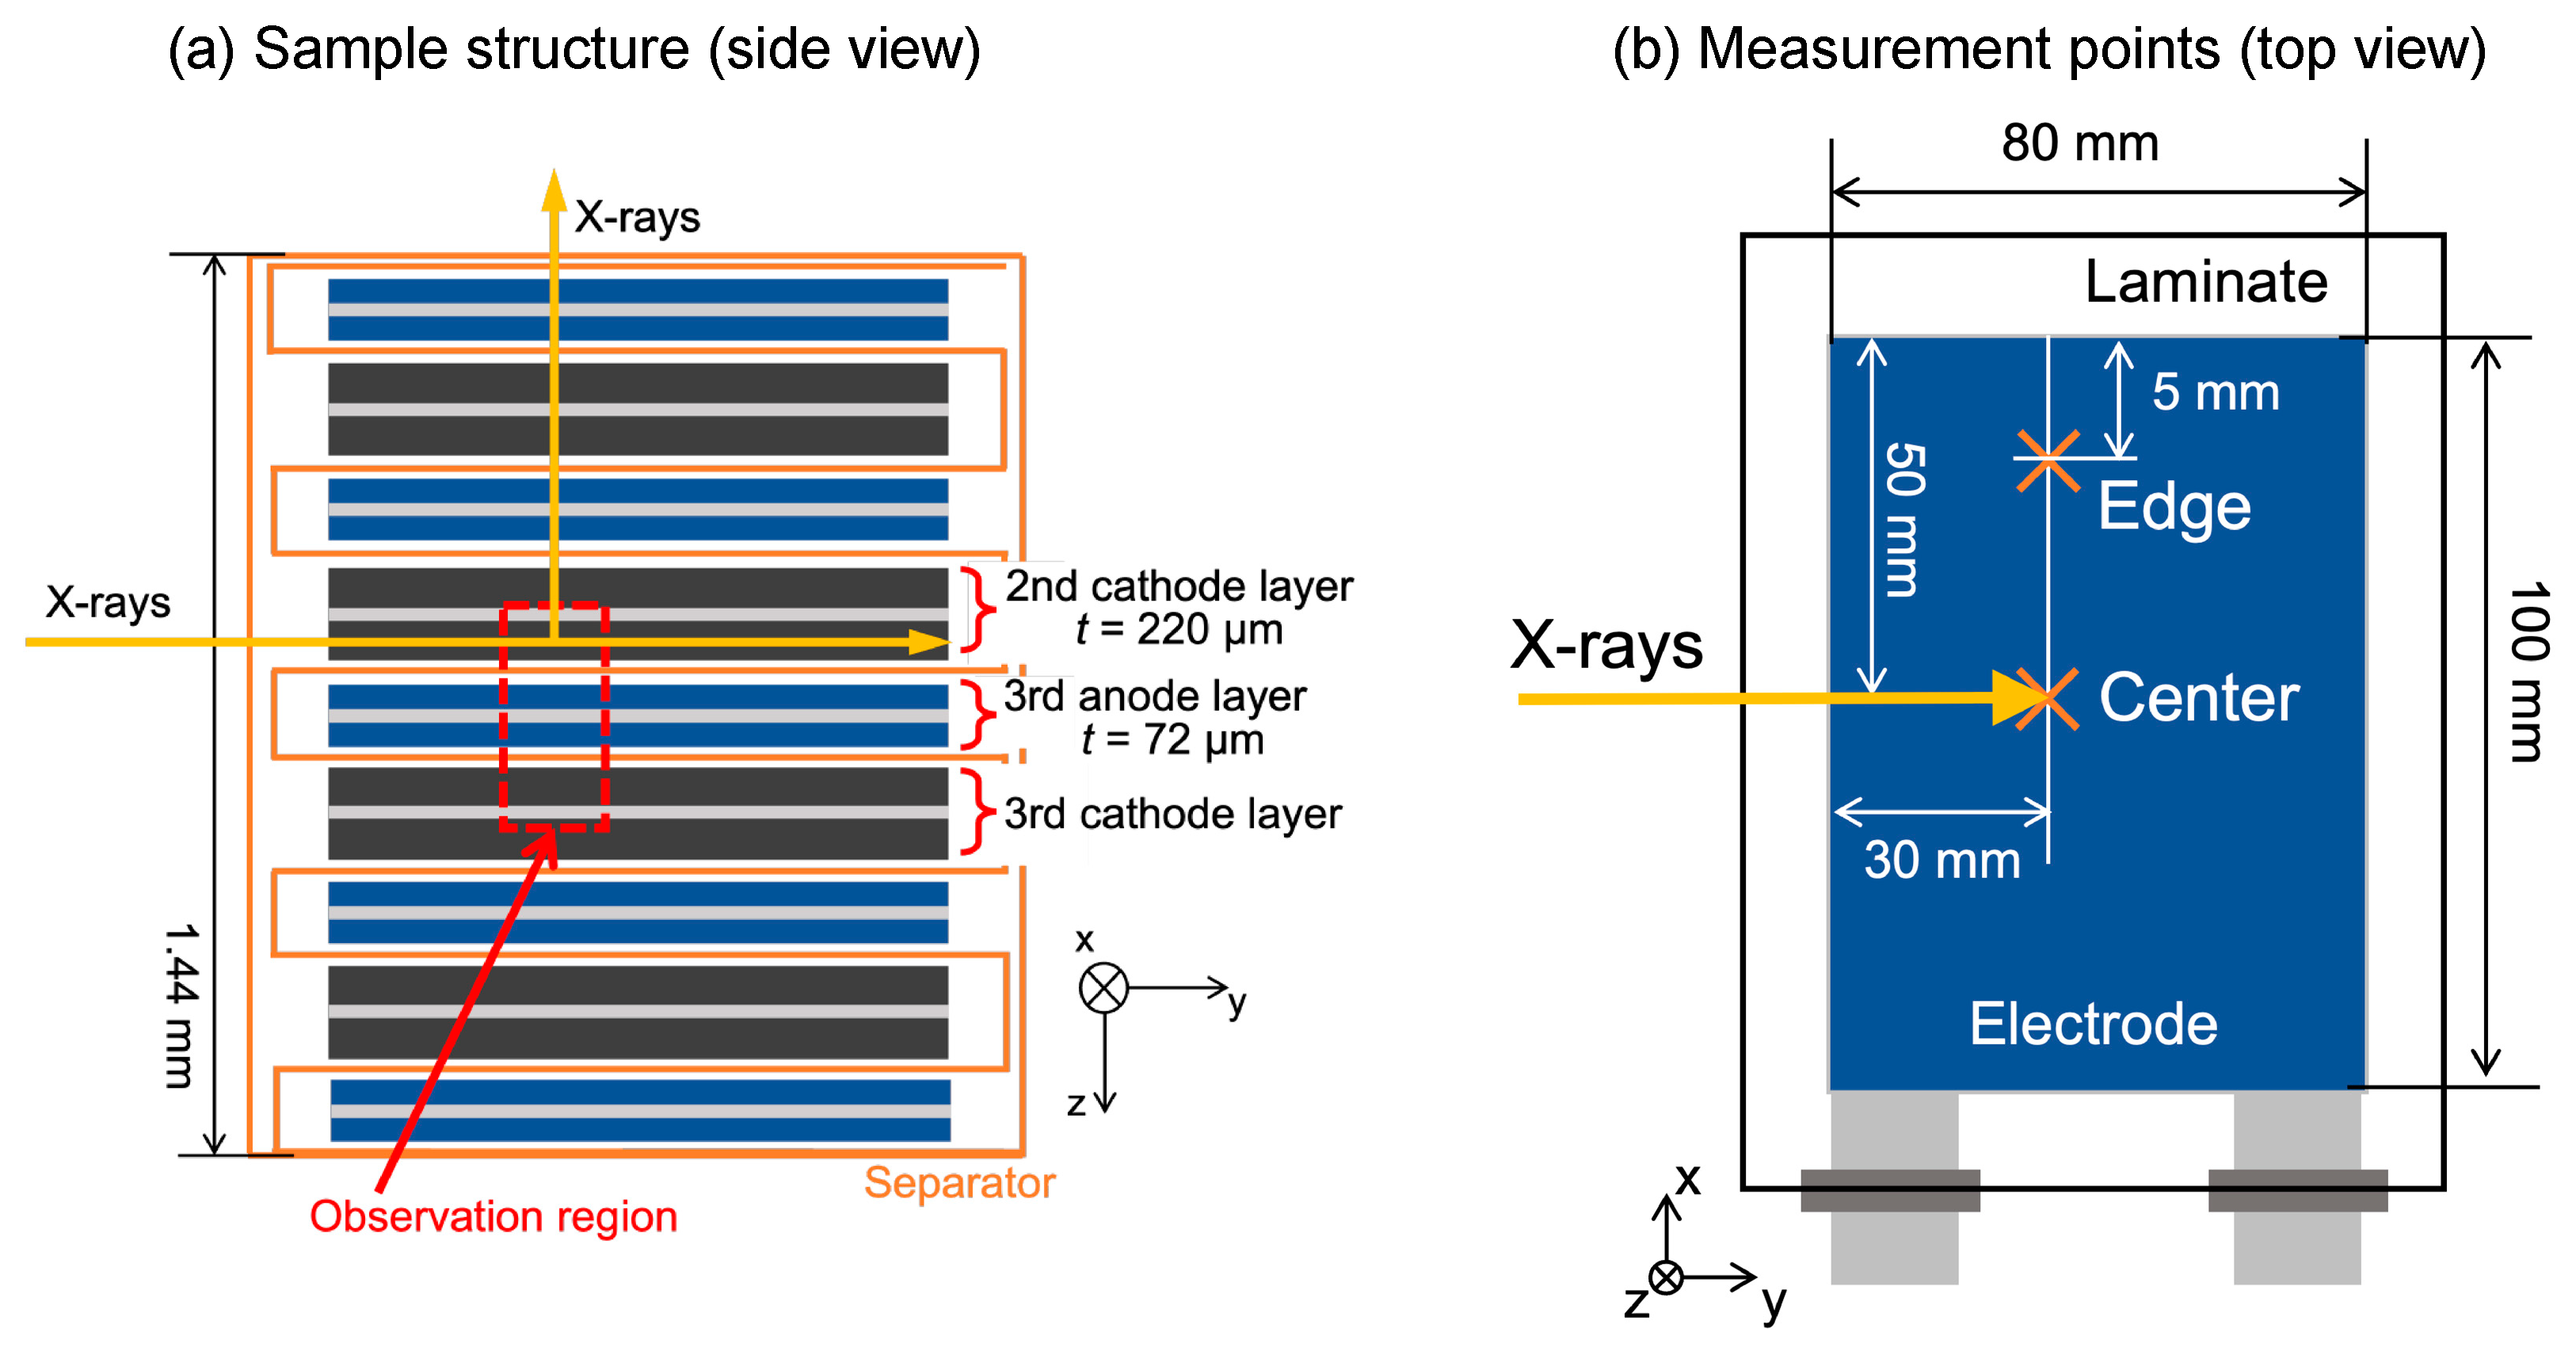
Abstract
:1. Introduction
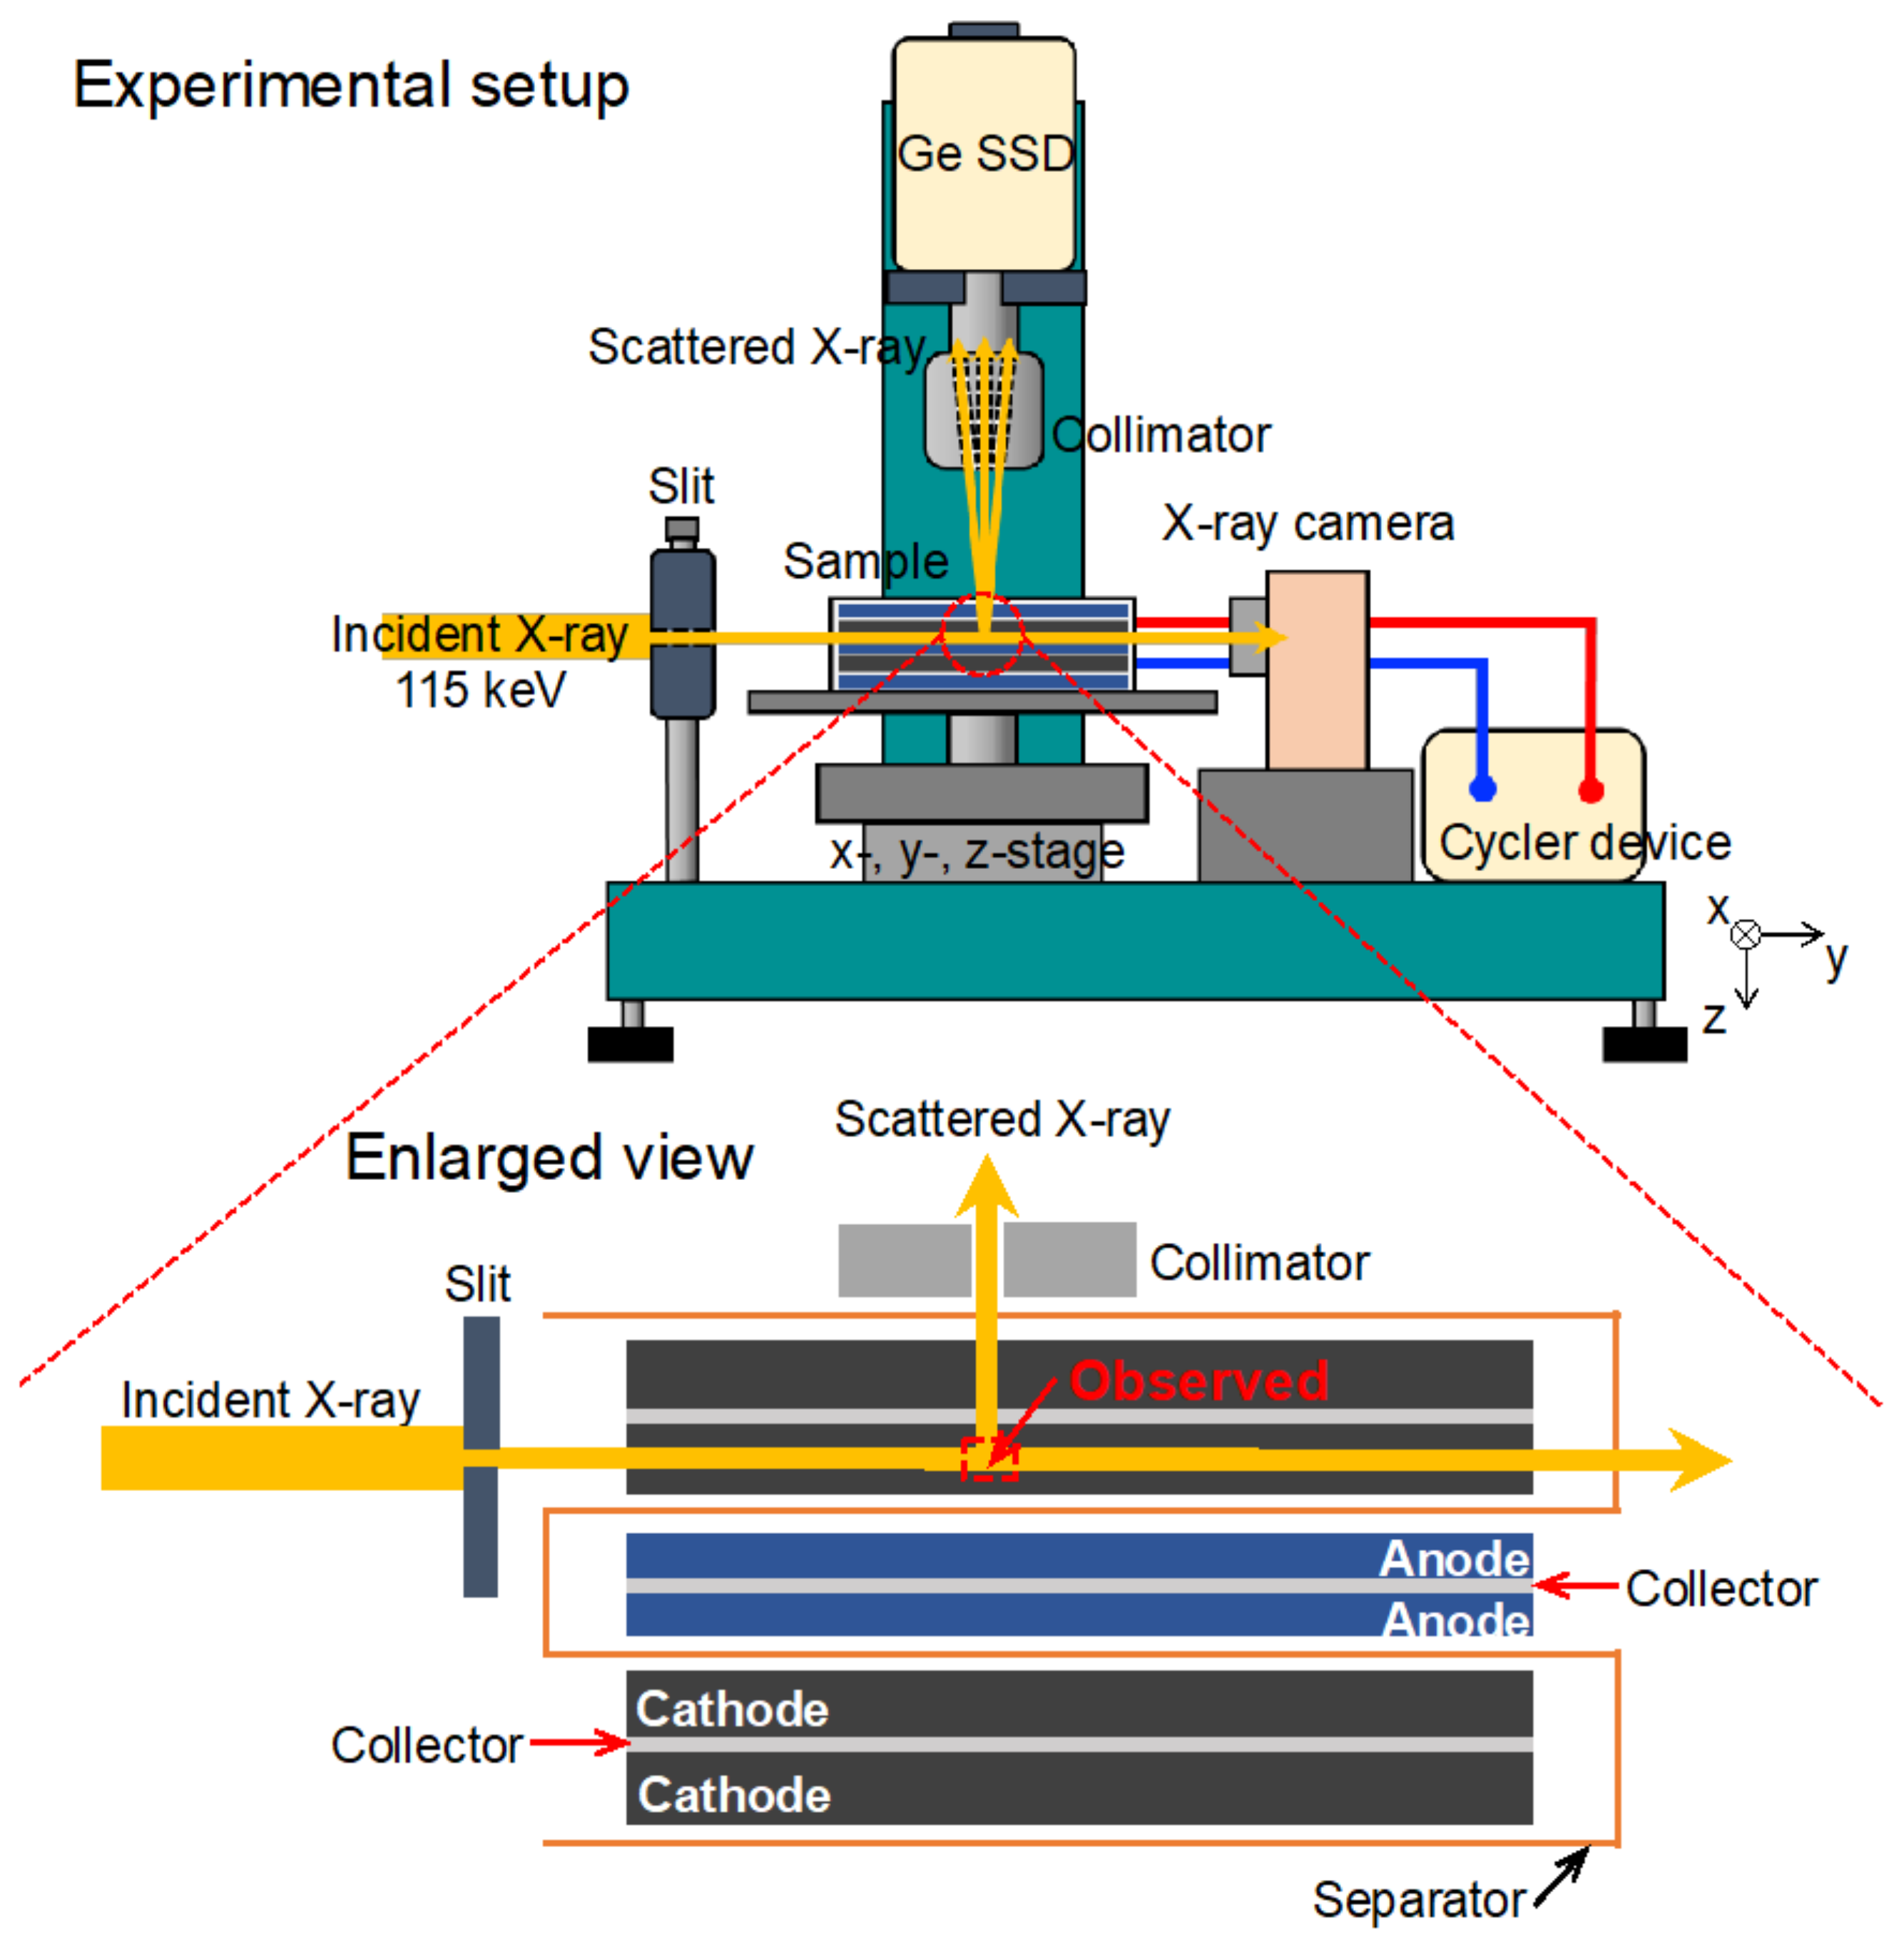
2. Samples and Experimental Methods
3. Results and Discussions
4. Conclusions
Author Contributions
Funding
Institutional Review Board Statement
Informed Consent Statement
Data Availability Statement
Acknowledgments
Conflicts of Interest
References
- Naoi, K. ‘Nanohybrid Capacitor’: The Next Generation Electrochemical Capacitors. Fuel Cells 2010, 5, 825–833. [Google Scholar] [CrossRef]
- Wang, Y.; Wang, L.; Li, M.; Chen, Z. A review of key issues for control and management in battery and ultra-capacitor hybrid energy storage system. eTransportation 2020, 4, 100064. [Google Scholar] [CrossRef]
- Pal, B.; Yasin, A.; Kaur, R.; Tebyetekerwa, M.; Zabihi, F.; Yang, S.; Yang, C.-C.; Sofer, Z.; Jose, R. Understanding electrochemical capacitors with in-situ techniques. Renew. Sustain. Energy Rev. 2021, 149, 111418. [Google Scholar] [CrossRef]
- Pal, B.; Krishnan, S.G.; Vijayan, B.L.; Harilal, M.; Yang, C.-C.; Ezema, F.I.; Yusoff, M.M.; Jose, R. In situ encapsulation of tin oxide and cobalt oxide composite in porous carbon for high-performance energy storage application. J. Electro. Chem. 2018, 817, 217–225. [Google Scholar] [CrossRef]
- Pal, B.; Yasin, A.; Kunwar, R.; Yang, S.; Yusoff, M.M.; Jose, R. Polymer versus Cation of Gel Polymer Electrolytes in the Charge Storage of Asymmetric Supercapacitors. Ind. Eng. Chem. Res. 2019, 58, 654–664. [Google Scholar] [CrossRef]
- Seongki, A.; Haniu, Y.; Nara, H.; Momma, T.; Sugimoto, W.; Osaka, T. Synthesis of Stacked Graphene-Sn Composite as a High-Performance Anode for Lithium-Ion Capacitors. J. Electrochem. Soc. 2020, 167, 040519. [Google Scholar]
- Bruce, P.G.; Freunberger, S.A.; Hardwick, L.J.; Tarascon, J.-M. Li–O2 and Li–S batteries with high energy storage. Nat. Mater. 2012, 11, 19–29. [Google Scholar] [CrossRef]
- Reddy, M.V.; Rao, G.V.S.; Chowdari, B.V.R. Metal Oxides and Oxysalts as Anode Materials for Li Ion Batteries. Chem. Rev. 2013, 113, 5364–5457. [Google Scholar] [CrossRef]
- Suzuki, K.; Kanai, R.; Tsuji, N.; Yamashige, H.; Orikasa, Y.; Uchimoto, Y.; Sakurai, Y.; Sakurai, H. Dependency of the Charge-Discharge Rate on Lithium Reaction Distributions for Commercial Lithium Coin Cell Visualized by Compton Scattering Imaging. Condens. Matter. 2018, 3, 27. [Google Scholar] [CrossRef] [Green Version]
- Kimura, Y.; Tomura, A.; Fakkao, M.; Nakamura, T.; Ishiguro, N.; Sekizawa, O.; Nitta, K.; Uruga, T.; Okumura, T.; Tada, M.; et al. 3D Operando Imaging and Quantification of Inhomogeneous Electrochemical Reactions in Composite Battery Electrodes. J. Phys. Chem. Lett. 2020, 11, 3629–3636. [Google Scholar] [CrossRef]
- Orikasa, Y.; Yamamoto, K.; Shimizu, T.; Uchimoto, Y. Multiscale and hierarchical reaction mechanism in a lithium-ion battery. Chem. Phys. Rev. 2022, 3, 011305. [Google Scholar] [CrossRef]
- Prehal, C.; Koczwara, C.; Jäckel, N.; Amenitsch, H.; Presser, V.; Paris, O. A carbon nanopore model to quantify structure and kinetics of ion electrosorption with in situ small-angle X-ray scattering, Phys. Chem. Chem. Phys. 2017, 19, 15549–15561. [Google Scholar] [CrossRef] [PubMed]
- Suzuki, K.; Barbiellini, B.; Orikasa, Y.; Kaprzk, S.; Itou, M.; Yamamoto, K.; Wang, Y.J.; Hafiz, H.; Uchimoto, Y.; Bansil, A.; et al. Non-destructive measurement of in-operando lithium concentration in batteries via X-ray Compton scattering. J. Appl. Phys. 2016, 119, 025103. [Google Scholar] [CrossRef]
- Suzuki, K.; Suzuki, A.; Ishikawa, T.; Itou, M.; Yamashige, H.; Orikasa, Y.; Uchimoto, Y.; Sakurai, Y.; Sakurai, H. In operando quantitation of Li concentration for a commercial Li-ion rechargeable battery using high-energy X-ray Compton scattering. J. Synchrotron Rad. 2017, 24, 1006–1011. [Google Scholar] [CrossRef] [PubMed] [Green Version]
- Suzuki, K.; Suzuki, S.; Otauka, Y.; Tsuji, N.; Jalkanen, K.; Koskinen, J.; Hoshi, K.; Honkanen, A.-P.; Hafiz, H.; Sakurai, Y.; et al. Redox oscillations in 18650-type lithium-ion cell revealed by in operando Compton scattering imaging. Appl. Phys. Lett. 2021, 118, 161902. [Google Scholar] [CrossRef]
- Sharaf, J.M. Practical aspects of Compton scatter densitometry. Appl. Radiat. Isotop. 2001, 54, 801–809. [Google Scholar] [CrossRef]
- Harding, G.; Harding, E. Compton scatter imaging: A tool for historical exploration. Appl. Radiat. Isotop. 2010, 68, 993–1005. [Google Scholar] [CrossRef]
- Cooper, M.J.; Mijnarends, P.E.; Shiotani, N.; Sakai, N.; Bansil, A. The theory of Compton scattering. In X-ray Compton Scattering; Oxford Science Publications: London, UK, 2004; Chapter 2; pp. 22–69. [Google Scholar]
- Barbiellini, B. A natural orbital method for the electron momentum distribution in matter. J. Phys. Chem. Solids. 2000, 61, 341–344. [Google Scholar] [CrossRef] [Green Version]
- Barbiellini, B.; Bansil, A. Treatment of correlation effects in electron momentum density: Density functional theory and beyond. J. Phys. Chem. Solids. 2001, 62, 2181–2189. [Google Scholar] [CrossRef] [Green Version]
- Suzuki, K.; Barbiellini, B.; Orikasa, Y.; Go, N.; Sakurai, H.; Kaprzyk, S.; Itou, M.; Yamamoto, K.; Uchimoto, Y.; Wang, Y.J.; et al. Extracting the Redox Orbitals in Li Battery Materials with High-resolution X-ray Compton Scattering Spectroscopy. Phys. Rev. Lett. 2015, 114, 087401. [Google Scholar] [CrossRef] [Green Version]
- Barbiellini, B.; Suzuki, K.; Orikasa, Y.; Kaprzyk, S.; Itou, M.; Yamamoto, K.; Wang, Y.J.; Hafiz, H.; Yamada, R.; Uchimoto, Y.; et al. Identifying a descriptor for d-orbital delocalization in cathodes of Li batteries based on x-ray Compton scattering. Appl. Phys. Lett. 2016, 109, 073102. [Google Scholar] [CrossRef] [Green Version]
- Hafiz, H.; Suzuki, K.; Barbiellini, B.; Orikasa, Y.; Callewaert, V.; Kaprzyk, S.; Itou, M.; Yamamoto, K.; Yamada, R.; Uchimoto, Y.; et al. Visualizing redox orbitals and their potentials in advanced lithium-ion battery materials using high-resolution X-ray Compton scattering. Sci. Adv. 2017, 3, e1700971. [Google Scholar] [CrossRef] [PubMed] [Green Version]
- Hafiz, H.; Suzuki, K.; Barbiellini, B.; Orikasa, Y.; Kaprzyk, S.; Tsuji, N.; Yamamoto, K.; Terasaka, A.; Hoshi, K.; Uchimoto, Y.; et al. Identification of ferrimagnetic orbitals preventing spinel degradation by charge ordering in LixMn2O4. Phys. Rev. B 2019, 100, 205104. [Google Scholar] [CrossRef] [Green Version]
- Hafiz, H.; Suzuki, K.; Barbiellini, B.; Tsuji, N.; Yabuuchi, N.; Yamamoto, K.; Orikasa, Y.; Uchimoto, Y.; Sakurai, Y.; Sakurai, H.; et al. Tomographic reconstruction of oxygen orbitals in lithium-rich battery materials. Nature 2021, 594, 213–216. [Google Scholar] [CrossRef] [PubMed]
- Suzuki, K.; Otsuka, Y.; Hoshi, K.; Sakurai, H.; Tsuji, N.; Yamamoto, K.; Yabuuchi, N.; Hafiz, H.; Orikasa, Y.; Uchimoto, Y.; et al. Magnetic Compton Scattering Study of Li-Rich Battery Materials. Condens. Matter. 2022, 7, 4. [Google Scholar] [CrossRef]
- Biggs, F.; Mendelson, L.B.; Mann, J.B. Hartree-Fock Compton profiles for the elements. At. Data Nucl. Data Tables 1975, 16, 201. [Google Scholar] [CrossRef]
- Suzuki, K.; Otsuka, Y.; Tsuji, N.; Hoshi, K.; Sakurai, Y.; Sakurai, H. Identifying the Degradation Mechanism in Commercial Lithium Rechargeable Batteries via High-Energy X-ray Compton Scattering Imaging. Appl. Sci. 2020, 10, 5855. [Google Scholar] [CrossRef]


Publisher’s Note: MDPI stays neutral with regard to jurisdictional claims in published maps and institutional affiliations. |
© 2022 by the authors. Licensee MDPI, Basel, Switzerland. This article is an open access article distributed under the terms and conditions of the Creative Commons Attribution (CC BY) license (https://creativecommons.org/licenses/by/4.0/).
Share and Cite
Suzuki, K.; Takano, K.; Suzuki, S.; Hanawa, H.; Tsuji, N.; Ando, T.; Hoshi, K.; Minato, Y.; Ishimoto, S.; Sakurai, Y.; et al. Non-Destructive Analysis of a High-Power Capacitor Using High-Energy X-ray Compton Scattering. Crystals 2022, 12, 824. https://doi.org/10.3390/cryst12060824
Suzuki K, Takano K, Suzuki S, Hanawa H, Tsuji N, Ando T, Hoshi K, Minato Y, Ishimoto S, Sakurai Y, et al. Non-Destructive Analysis of a High-Power Capacitor Using High-Energy X-ray Compton Scattering. Crystals. 2022; 12(6):824. https://doi.org/10.3390/cryst12060824
Chicago/Turabian StyleSuzuki, Kosuke, Kodai Takano, Shunta Suzuki, Hirotaka Hanawa, Naruki Tsuji, Tomoya Ando, Kazushi Hoshi, Yoshihiro Minato, Shuichi Ishimoto, Yoshiharu Sakurai, and et al. 2022. "Non-Destructive Analysis of a High-Power Capacitor Using High-Energy X-ray Compton Scattering" Crystals 12, no. 6: 824. https://doi.org/10.3390/cryst12060824