Article

Weak Antilocalization in Polycrystalline SnTe Films Deposited by Magnetron Sputtering

1
Center for Joint Quantum Studies and Department of Physics, School of Science, Tianjin University, Tianjin 300350, China
2
Centre for Quantum Physics, Key Laboratory of Advanced Optoelectronic Quantum Architecture and Measurement (MOE), School of Physics, Beijing Institute of Technology, Beijing 100081, China
3
Beijing National Laboratory for Condensed Matter Physics, Institute of Physics, Chinese Academy of Sciences, Beijing 100190, China
*
Author to whom correspondence should be addressed.
Crystals 2022, 12(6), 773; https://doi.org/10.3390/cryst12060773
Submission received: 3 May 2022 / Revised: 19 May 2022 / Accepted: 24 May 2022 / Published: 26 May 2022
(This article belongs to the Section Inorganic Crystalline Materials)

Abstract

:
Previous works on weak antilocalization (WAL) of SnTe were mostly carried out in MBE-grown films, where the signals of WAL usually coexist with a large parabolic background of classical magnetoresistance. In this article, we present our study on WAL in polycrystalline SnTe films deposited by magnetron sputtering. Due to the polycrystalline nature and the relatively low mobility of the films, the background of conventional magnetoresistance was greatly suppressed, and clean WAL signals, which are well described by the Hikami–Larkin–Nagaoka equation, were obtained at low temperatures. A close analysis of the WAL data shows that the number of transport channels contributing to WAL increases monotonously with decreasing temperatures, reaching N = 2.8 at T = 1.6 K in one of the devices, which indicates the decoupling of Dirac cones at low temperatures. Meanwhile, as the temperature decreases, the temperature dependence of phase coherence length gradually changes from l ϕ T 1 to l ϕ T 0.5 , suggesting that the dominant mechanism of phase decoherence switches from electron–phonon scattering to electron–electron scattering. Our results are helpful for understanding the quantum transport properties of SnTe.

1. Introduction

Topological crystalline insulators (TCIs) are a novel class of topological insulators (TIs) in which the topology of energy bands is protected by crystal symmetries instead of time-reversal symmetry [1,2]. The IV-VI semiconductor SnTe is known to be a representative material of TCI [1,2,3,4]. In SnTe, the topological protection originates from the mirror symmetry with respect to the {110} planes in the cubic rock-salt crystal structure [1,2,3,4]. In contrast to conventional TIs, SnTe harbors four helical Dirac cones on the (100), (110) and (111) surfaces. The coexistence of multiple Dirac cones on a single surface makes SnTe an ideal platform for investigating quantum transport phenomena which involve intra-surface coupling between Dirac cones, such as the weak anti-localization (WAL) effect [5].
WAL is a disorder-induced quantum correction to the Drude conductivity, often observed in materials with strong spin–orbit coupling [5]. In contrast to WAL observed in two-dimensional (2D) electron gases [6,7] and conventional TIs [8,9,10], WAL in SnTe was reported to exhibit a total number of diffusive transport channels N = 2 α > 2 [11,12,13], where α is the prefactor in the Hikami–Larkin–Nagaoka (HLN) equation [5].
Previous works on WAL of SnTe were mostly carried out in single-crystalline films grown by molecular beam epitaxy (MBE) [11,12,13,14,15], where the signals of WAL coexist with a large parabolic background of conventional magnetoresistance [11,12,13]. In addition, the large surface roughness of MBE-grown films [11,12,14,15] could also hinder the reliable measurement of the out-of-plane magnetoconductance. In this article, we present our study on WAL in polycrystalline SnTe films deposited by magnetron sputtering. Due to the polycrystalline nature and the relatively low mobility of the films, the background of conventional magnetoresistance was greatly suppressed, and clean WAL signals were obtained at low temperatures. A close analysis using the HLN equation shows that the number of transport channels contributing to WAL increases monotonously with decreasing temperature, reaching N = 2.8 at T = 1.6 K in one of the devices, which indicates the decoupling of Dirac cones at low temperatures. Meanwhile, as temperature decreases, the temperature dependence of phase coherence length l ϕ gradually changes from l ϕ T 1 to l ϕ T 0.5 , suggesting that the main mechanism of phase decoherence switches from electron–phonon scattering to electron–electron scattering. Our results are helpful for understanding the quantum transport properties of SnTe.

2. Experimental Methods

2.1. Film Deposition and Device Fabrication

SnTe films were deposited on Si (001)/SiO2 substrates at room temperature by dc magnetron sputtering. A SnTe target (purity: 99.99%, diameter: 54 mm) was used for the deposition. The distance between the target and the substrates was 96 mm. Before the deposition, the sputtering chamber was pumped to a base pressure of P < 1.5 × 10 4 Pa. During the sputtering, the Ar pressure in the chamber was set to 0.8 Pa. A deposition rate of 1.5   / s was reached at a dc power of 10 W. For consistency, all SnTe films presented in this work are 50 nm in thickness. For the as-deposited film, the Sn:Te atomic ratio was measured to be 51.6: 48.4, as shown in Figure S1 in the Supplementary Materials.
The room-temperature deposition of SnTe allows us to fabricate Hall-bar devices with the lift-off technique. To fabricate the device, a mask of photoresist was prepared on the Si (001)/SiO2 substrate using photolithography. After the deposition of SnTe, the resist mask was removed by a room-temperature lift-off process performed in N-Methyl-2-pyrrolidon (NMP). During the lift-off process, the SnTe deposited on the resist mask was also removed. After that, the substrates were carefully rinsed in acetone and isopropyl alcohol to remove possible residue of NMP.
Next, the prepared SnTe films and devices were annealed in vacuum ( P < 1 × 10 3 Pa) for 2 h at various temperatures between 50 °C and 240 °C. The annealing temperature was precisely monitored using a Pt-100 thermometer installed on top of the aluminum stage on which the samples were mounted.
The crystalline phase of the sputtered SnTe films was confirmed by X-ray diffraction (XRD) measurements. The morphology and the thickness of the films were measured using the tapping mode of an atomic force microscope (AFM). The root mean square (RMS) roughness of the films was calculated from AFM scans in a 5 × 5   μ m 2 area.

2.2. Transport Measurements

The sheet resistance and Hall resistance of SnTe films were measured using lock-in amplifiers. The ac excitation current was 40 μA at 17 Hz for room-temperature measurements and 10 μA at 33.7 Hz for low-temperature measurements, respectively. To reduce noise, each room-temperature R y x ( B ) curve was averaged over 10 independent scans. The well-defined geometry of Hall-bar devices ensured the accuracy of measurements. The room-temperature measurements were performed using a desktop electromagnet, while the low-temperature measurements were carried out in a cryostat equipped with a superconducting magnet.

3. Results and Discussion

3.1. Optimization of Annealing Conditions

3.1.1. Morphology

The as-deposited SnTe films are polycrystalline, composed of small grains with an average size of 30 nm. Films annealed at T 120 °C exhibit no difference in morphology in comparison with the as-deposited films. However, for films that were annealed at T 147   , the average grain size increases notably with annealing temperature, indicating the occurrence of recrystallization. The representative AFM images of the SnTe films are presented in Figure 1a–e and Figure S3 in the Supplementary Materials.
Most of the MBE-grown SnTe films reported in previous research exhibited rough surfaces and non-uniform morphology [11,12,14,15]. In contrast, the sputtered SnTe films presented in this paper are quite flat and uniform. As shown in Figure 1f, the RMS roughness data of most sputtered SnTe films are distributed in a narrow region between 1.2 nm and 2.1 nm, except for the one annealed at 240 °C. Such flat and uniform films are favorable for realizing the proposed novel devices based on SnTe [2].

3.1.2. Structural Characterization

To confirm the crystalline phase of the sputtered SnTe films, we performed XRD measurements in θ - 2 θ geometry on four SnTe samples annealed at different temperatures. As shown in Figure 2a, Bragg peaks of the (200) and (220) planes are clearly visible in all samples, indicating the presence of two crystallographic phases grown along the [100] and [110] orientations, respectively. As a result of recrystallization, the XRD signals of annealed SnTe films are stronger than that of the as-deposited film.

3.1.3. Carrier Density and Mobility

The room-temperature Hall carrier density n H = 1 / ( e t R H ) and Hall mobility μ H = 1 / ( e t R sh n H ) were obtained by measuring the sheet resistance R sh and Hall resistance R y x ( B ) of the films. Here, t and R H denote thickness and Hall coefficient, respectively. As shown in Figure 2c, all R y x ( B ) curves exhibit positive R H , corresponding to p-type carriers with n H ranging from 5.5 × 10 20 cm−3 to 3.4 × 10 21 cm−3. Such high densities of p-type carriers are known to originate from Sn vacancies and Te anti-sites in SnTe [11,13,14,15]. During the vacuum annealing, the density of Te anti-sites reduced due to recrystallization, leading to a decrease in n H , as shown in Figure 2d.
The obtained μ H ( T anneal ) data are plotted in Figure 2e. For clarity, we divide Figure 2e into three regions according to the shape of the μ H ( T anneal ) curve. In region I, μ H increases slowly with increasing T anneal . An upturn of μ H ( T anneal ) occurs at the border between region I and region II, corresponding to the T anneal at which the grain size of SnTe films starts to show a notable increment. Another sharp rise of μ H is seen at T anneal 178   ℃, above which μ H starts to decrease with increasing T anneal .

3.2. Electron Transport Properties at Low Temperatures

3.2.1. R-T Curves

Two representative Hall-bar devices, labelled as devices A and B, were selected from region II and region III in Figure 2e for the low-temperature transport measurements. Device A was fabricated using a SnTe film annealed at 147 °C, while device B was made of a film annealed at 190 °C, as indicated by the arrows in Figure 2e.
The R sh ( T ) curves of devices A and B were measured down to T = 1.6   K . As plotted in Figure 3a, the sheet resistance of both devices decreases monotonically with decreasing temperatures. Such a metallic behavior is consistent with previous observations in MBE-grown films [12,13,14,15].

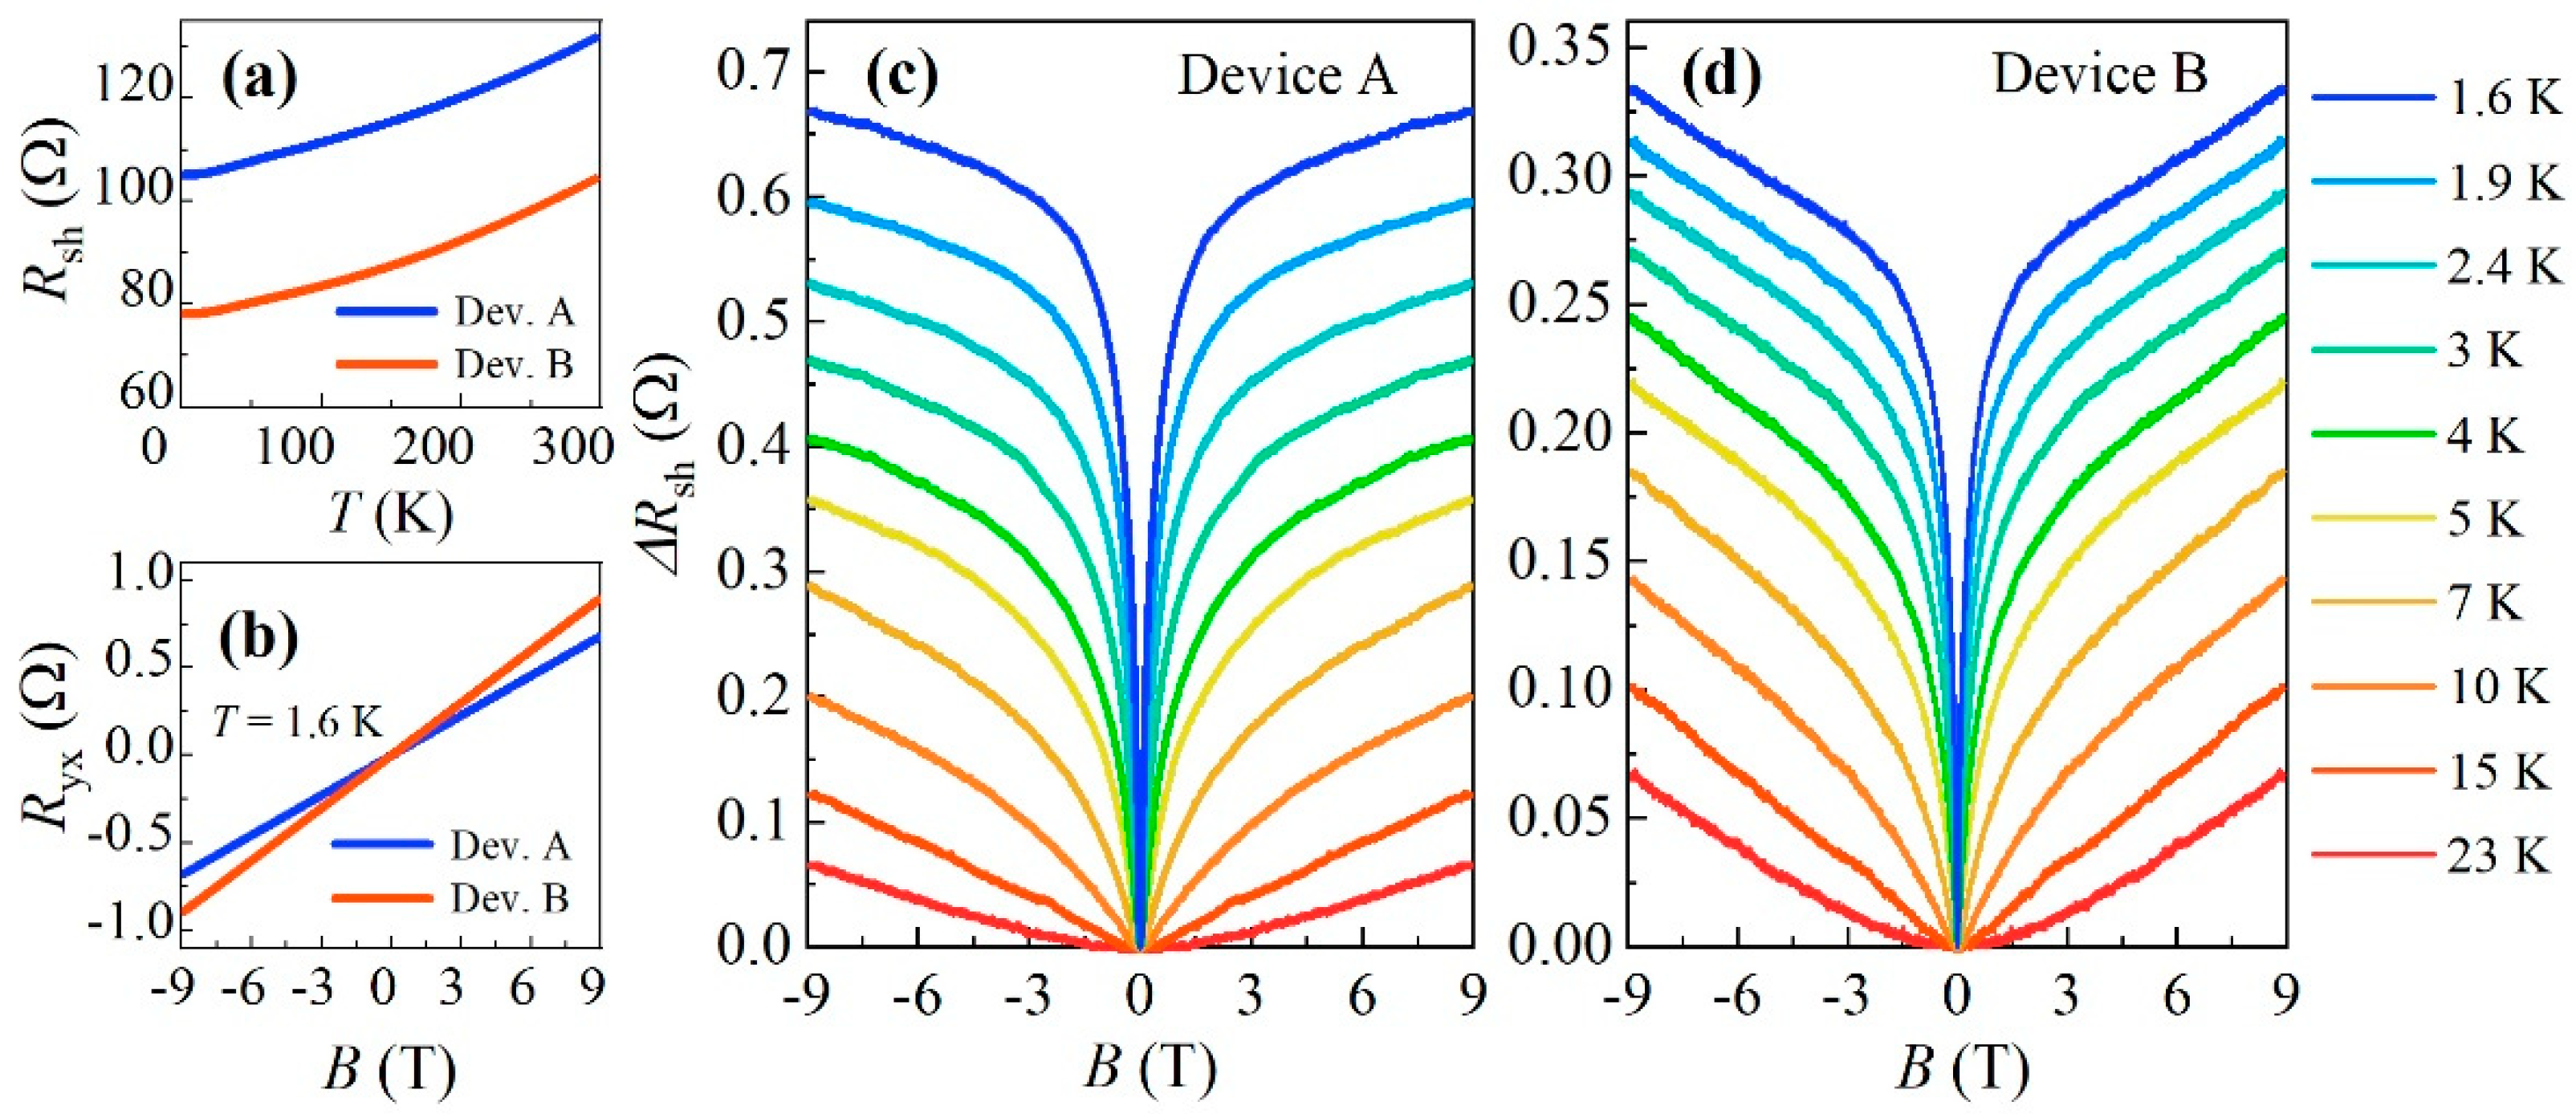
3.2.2. Hall Resistance and Magnetoresistance

At low temperatures, the R y x ( B ) curves of both devices are highly linear up to B = 9   T , as plotted in Figure 3b and Figure S2 in Supplementary Materials. The Hall carrier density and Hall mobility of the two devices are calculated to be n H A = 1.6 × 10 21   cm 3 , n H B = 1.3 × 10 21   cm 3 , μ H A = 7.2   cm 2 V 1 s 1 and μ H B = 12.7   cm 2 V 1 s 1 .
The magnetoresistance Δ R sh ( B ) = R sh ( B ) R sh ( 0 ) of both devices was measured at various temperatures between T = 1.6 K and 23 K, as plotted in Figure 3c,d. Due to the relatively low mobility of the sputtered SnTe films, classical magnetoresistance was greatly suppressed, leaving only a weak parabolic background, as seen in the Δ R sh ( B ) curve measured at T = 23   K . Such a weak classical MR is favorable for WAL measurements. At T 15   K , a cusp structure centered at the zero field starts to develop. Such sharp, cusp-shaped structures in magnetoresistance are known as the transport signature of WAL [6,7,8,9,10,11,12,13,14,15].
WAL in TIs and TCIs mainly originates from helical surface states which have a Berry phase of π [11]. When the helical surface electrons propagate coherently along a pair of self-intersecting scattering paths, a destructive interference occurs due to the π Berry phase and the probability of back scattering is reduced, resulting in a positive correction to the Drude conductance, which is known as WAL.
Theoretically, the low-field magnetoconductance Δ G ( B ) = G ( B ) G ( 0 ) due to 2D WAL is described by the simplified HLN equation [5]:
Δ G WAL ( B ) = α e 2 π h [ ψ ( 1 2 + 4 e l ϕ 2 B ) ln ( 4 e l ϕ 2 B ) ] ,
where ψ ( x ) is the digamma function and α = N / 2 is a parameter determined by the number of independent transport channels (denoted by N ).
Fitting the HLN equation to the Δ G ( B ) data allows us to extract the values of N and l ϕ for both devices. As shown in Figure 4a,b, all Δ G ( B ) curves are well-fitted, confirming that the cusp-shaped structures observed in the magnetoresistance of SnTe films are due to 2D WAL. The temperature dependence of parameters extracted from the HLN fitting are plotted in Figure 4c,d.
As shown in Figure 4c, at T = 15   K , the extracted values of N are N devA = 1.5 and N devB = 1.3 for device A and B, respectively. As T decreases, the N ( T ) curves show a sharp upturn at T 4   K , below which N increases rapidly and finally reaches N devA = 2.8 and N devB = 1.9 at T = 1.6   K . These observations are consistent with previous research on WAL in SnTe films [11,12,13].
The increase in N can be understood qualitatively by assuming that the decoupling of Dirac cones occurs at low temperatures [11]. As mentioned before, SnTe has four Dirac cones on each high-symmetry surface, and hence there are eight Dirac cones in total, when both top and bottom surfaces are considered. Ideally, there could be, at most, eight independent transport channels if all Dirac cones are decoupled. In reality, however, N should take a value between 1 and 8 due to the presence of finite scattering rate between Dirac cones. In this scenario, the increase in N observed in our experiment implies the decoupling of Dirac cones, which is most likely caused by a decrease in the inter-valley scattering rate at low temperatures.
For most of the films, the average grain size is slightly smaller than the film thickness, indicating that there is more than one grain in the thickness direction. However, since topological surface states do not appear at the boundaries between SnTe grains where the topological invariant does not change, the presence of grains in the thickness direction does not introduce additional transport channels of topological surface states and hence does not affect the explanation above.
Now we discuss the temperature dependence of l   ϕ . According to theory [14,16,17], l   ϕ ( T ) follows a power-law relation l   ϕ T p , where the value of p is determined by the major mechanism of phase breaking scattering: p = 1 corresponds to electron–phonon scattering and p = 0.5 corresponds to electron–electron scattering.
Figure 4d shows the log–log plot of the l   ϕ ( T ) data extracted from the HLN fitting. Obviously, the parameter p takes different values in different temperature regions. Fitting l   ϕ T p to the data gives p devA = 1.14 , p devB = 1.17 at T 4 K and p devA = 0.49 , p devB = 0.62 at T < 4 K . These values are very close to the theoretical explanation of p = 1 and p = 0.5 , indicating that the dominant mechanism of phase decoherence changes from electron–phonon scattering to electron–electron scattering at low temperatures.

4. Conclusions

In conclusion, we observed pronounced WAL signals in post-annealed SnTe films deposited by magnetron sputtering. The increasing number of independent transport channels at low temperatures indicates the decoupling of Dirac cones. The change of l ϕ ( T ) from l ϕ T 1 to l ϕ T 0.5 at low temperatures implies that the main mechanism of phase decoherence switches from electron–phonon scattering to electron–electron scattering. Our results are helpful for understanding the quantum transport properties of SnTe.

Supplementary Materials

The following supporting information can be downloaded at: https://www.mdpi.com/article/10.3390/cryst12060773/s1, Figure S1: EDX spectrum of as-deposited SnTe film, Figure S2: Additional R y x ( B ) data of devices A and B, Figure S3: Additional AFM images of SnTe films.

Author Contributions

X.L. grew the SnTe films, tested the annealing conditions, and performed the AFM measurements and room-temperature transport measurements; X.W. and F.Q. performed the low-temperature transport measurements; Y.Y., X.L. and F.Y. analyzed the data; P.Z. and Z.W. performed the XRD measurements; F.Y. conceived and supervised the project; F.Y. wrote and edited the manuscript with the input of all authors. All authors have read and agreed to the published version of the manuscript.

Funding

This research was funded by the National Natural Science Foundation of China (Grant No. 11904259), the Natural Science Foundation of Tianjin (Grant No. 20JC-QNJC02040) and the Independent Innovation Foundation of Tianjin University (Grant No. 2020XRG-0044).

Institutional Review Board Statement

Not applicable.

Informed Consent Statement

Not applicable.

Data Availability Statement

The data presented in this study are available on request from the corresponding author.

Acknowledgments

The authors thank Li Lu for his help with the low-temperature transport measurements.

Conflicts of Interest

The authors declare no conflict of interest.

References

  1. Fu, L. Topological Crystalline Insulators. Phys. Rev. Lett. 2011, 106, 106802. [Google Scholar] [CrossRef] [PubMed] [Green Version]
  2. Ando, Y.; Fu, L. Topological Crystalline Insulators and Topological Superconductors: From Concepts to Materials. Annu. Rev. Condens. Matter Phys. 2015, 6, 361–381. [Google Scholar] [CrossRef]
  3. Hsieh, T.H.; Lin, H.; Liu, J.; Duan, W.; Bansil, A.; Fu, L. Topological Crystalline Insulators in the SnTe Material Class. Nat. Commun. 2012, 3, 982. [Google Scholar] [CrossRef] [PubMed] [Green Version]
  4. Tanaka, Y.; Ren, Z.; Sato, T.; Nakayama, K.; Souma, S.; Takahashi, T.; Segawa, K.; Ando, Y. Experimental Realization of a Topological Crystalline Insulator in SnTe. Nat. Phys. 2012, 8, 800–803. [Google Scholar] [CrossRef] [Green Version]
  5. Hikami, S.; Larkin, A.I.; Nagaoka, Y. Spin-Orbit Interaction and Magnetoresistance in the Two Dimensional Random System. Prog. Theor. Phys. 1980, 63, 707–710. [Google Scholar] [CrossRef]
  6. Knap, W.; Skierbiszewski, C.; Zduniak, A.; Litwin-Staszewska, E.; Bertho, D.; Kobbi, F.; Robert, J.L.; Pikus, G.E.; Pikus, F.G.; Iordanskii, S.V. Weak Antilocalization and Spin Precession in Quantum Wells. Phys. Rev. B 1996, 53, 3912. [Google Scholar] [CrossRef] [PubMed] [Green Version]
  7. Grbić, B.; Leturcq, R.; Ihn, T.; Ensslin, K.; Reuter, D.; Wieck, A.D. Strong Spin-Orbit Interactions and Weak Antilocalization in Carbon-Doped p-Type GaAs/AlxGa1XAs Heterostructures. Phys. Rev. B 2008, 77, 125312. [Google Scholar] [CrossRef] [Green Version]
  8. Chen, J.; Qin, H.J.; Yang, F.; Liu, J.; Guan, T.; Qu, F.M.; Zhang, G.H.; Shi, J.R.; Xie, X.C.; Yang, C.L.; et al. Gate-Voltage Control of Chemical Potential and Weak Antilocalization in Bi2Se3. Phys. Rev. Lett. 2010, 105, 176602. [Google Scholar] [CrossRef] [PubMed] [Green Version]
  9. Chen, J.; He, X.Y.; Wu, K.H.; Ji, Z.Q.; Lu, L.; Shi, J.R.; Smet, J.H.; Li, Y.Q. Tunable Surface Conductivity in Bi2Se3 Revealed in Diffusive Electron Transport. Phys. Rev. B 2011, 83, 241304. [Google Scholar] [CrossRef] [Green Version]
  10. Steinberg, H.; Laloë, J.; Fatemi, V.; Moodera, J.S.; Jarillo-Herrero, P. Electrically Tunable Surface-to-Bulk Coherent Coupling in Topological Insulator Thin Films. Phys. Rev. B 2011, 84, 233101. [Google Scholar] [CrossRef] [Green Version]
  11. Assaf, B.A.; Katmis, F.; Wei, P.; Satpati, B.; Zhang, Z.; Bennett, S.P.; Harris, V.G.; Moodera, J.S.; Heiman, D. Quantum Coherent Transport in SnTe Topological Crystalline Insulator Thin Films. Appl. Phys. Lett. 2014, 105, 102108. [Google Scholar] [CrossRef] [Green Version]
  12. Akiyama, R.; Fujisawa, K.; Sakurai, R.; Kuroda, S. Weak Antilocalization in (111) Thin Films of a Topological Crystalline Insulator SnTe. J. Phys. Conf. Ser. 2014, 568, 52001. [Google Scholar] [CrossRef] [Green Version]
  13. Wei, F.; Gao, X.P.; Ma, S.; Zhang, Z. Giant Linear Magnetoresistance and Carrier Density Tunable Transport in Topological Crystalline Insulator SnTe Thin Film. Phys. Status Solidi B 2019, 256, 1900139. [Google Scholar] [CrossRef]
  14. Akiyama, R.; Fujisawa, K.; Yamaguchi, T.; Ishikawa, R.; Kuroda, S. Two-Dimensional Quantum Transport of Multivalley (111) Surface State in Topological Crystalline Insulator SnTe Thin Films. Nano Res. 2016, 9, 490–498. [Google Scholar] [CrossRef]
  15. Ishikawa, R.; Yamaguchi, T.; Ohtaki, Y.; Akiyama, R.; Kuroda, S. Thin Film Growth of a Topological Crystal Insulator SnTe on the CdTe (111) Surface by Molecular Beam Epitaxy. J. Cryst. Growth 2016, 453, 124–129. [Google Scholar] [CrossRef] [Green Version]
  16. Anderson, P.W.; Abrahams, E.; Ramakrishnan, T.V. Possible Explanation of Nonlinear Conductivity in Thin-Film Metal Wires. Phys. Rev. Lett. 1979, 43, 718. [Google Scholar] [CrossRef]
  17. Abrahams, E.; Anderson, P.W.; Lee, P.A.; Ramakrishnan, T.V. Quasiparticle Lifetime in Disordered Two-Dimensional Metals. Phys. Rev. B 1981, 24, 6783. [Google Scholar] [CrossRef]
Figure 1. (ae) AFM images of SnTe films annealed at various temperatures. The SnTe films were sputtered on Si/SiO2 substrates at room temperature and then annealed in vacuum for two hours. All films are 50 nm in thickness. (f) Root mean square (RMS) roughness of SnTe films as a function of annealing temperature.
Crystals 12 00773 g001
Figure 2. (a) X-ray diffraction patterns of 50-nm-thick SnTe films annealed at various temperatures. (b) Optical image of a typical Hall-bar device fabricated of sputtered SnTe film. The Hall-bar is 100 μm in width, with a length-to-width ratio of 4:1. All transport data in this work were measured in Hall-bar devices with the same design. (c) Room-temperature Hall resistance of SnTe films. For clarity, only a few representative curves are shown. (d,e) Room-temperature Hall carrier density ( n H ) and Hall mobility ( μ H ) plotted as a function of annealing temperature. The dashed lines are a guide to the eye. The figures are divided into three regions according to the shape of the μ H ( T anneal ) curve. The arrows in (e) indicate the samples based on which devices A and B were fabricated.
Crystals 12 00773 g002
Figure 3. (a) Temperature dependence of sheet resistance. (b) Hall resistance measured at T = 1.6 K. (c,d) Magnetoresistance Δ R sh ( B ) = R sh ( B ) R sh ( 0 ) measured at various temperatures between T = 1.6 K and 23 K.
Crystals 12 00773 g003
Figure 4. (a,b) Magnetoconductance Δ G ( B ) = G ( B ) G ( 0 ) measured at various temperatures between T = 1.6 K and 23 K. The dashed–dotted lines are curves fitted using the HLN equation. (c) Temperature dependence of N , obtained by HLN fitting. The error bars indicate the parameter range within which the deviation between the data and the fitted curves are acceptable. The dashed lines are a guide to the eye. (d) Temperature dependence of l ϕ , obtained by HLN fitting. The dashed reference lines correspond to l ϕ T 0.5   ( T < 4 K ) and l ϕ T 1   ( T 4 K ) .
Crystals 12 00773 g004
Publisher’s Note: MDPI stays neutral with regard to jurisdictional claims in published maps and institutional affiliations.

