Article

A Compound Damage Constitutive Model Considering Deformation of Nonpersistent Fractured Rock Masses

1
School of Civil Engineering and Communication, North China University of Water Resources and Electric Power, Zhengzhou 450046, China
2
College of Geosciences and Engineering, North China University of Water Resources and Electric Power, Zhengzhou 450046, China
3
Yellow River Engineering Consulting Co., Ltd., Zhengzhou 450003, China
*
Author to whom correspondence should be addressed.
Crystals 2022, 12(3), 352; https://doi.org/10.3390/cryst12030352
Submission received: 31 December 2021 / Revised: 25 February 2022 / Accepted: 3 March 2022 / Published: 4 March 2022

Abstract

:
This paper describes a study on the interaction between joint fissures in a nonpersistent jointed rock mass by introducing a self-consistent methodology, amending the traditional method of self-consistency by increasing the number of joints one by one, and deducing a new compound mesoscale and macroscale constitutive damage model based on the Betti energy reciprocity theorem. By analyzing the Mohr–Coulomb failure criterion and generalized von Mises yield criterion and their impact on the calculation result of macroscopic damage, the generalized von Mises criterion is proven to be more appropriate, and it is, thus, chosen for this compound damage constitutive model. Comparing the theoretical calculation and laboratory results of the compound damage model with the existing theoretical calculation results indicates the following: 1. The compound damage model in this paper provides a better fit of the stress–strain curves from the laboratory tests. 2. The theoretical calculative results for the compound damage model in this paper are consistent with the experimental results; that is, the peak load decreases as the connectivity rate increases. 3. For different joint angles and connectivity rates, the overall absolute deviations and relative deviations of the peak stress from the theoretical calculations and the laboratory tests are less than those from the theoretical calculations provided in the original literature. The theoretical calculations of the compound damage model in this paper are more aligned with the experimental results, verifying its correctness and rationality.

1. Introduction

Natural wall rock has certain defects, such as joints, fissures, and cavities [1]. Under the effect of an external force, the mechanical characteristics of a rock mass are influenced by its internal structures. With the development of statistical damage theory [2,3], the constitutive model of compound mesoscopic and macroscopic damage has gradually attracted attention, as most jointed rock masses in construction areas exhibit a random nonpersistent distribution of joints, and research on the damage constitutive equation of nonpersistent jointed rock masses has become increasingly meaningful.
Many scholars have studied the constitutive model of a damaged rock mass. Zhao Heng et al. obtained the statistical damage constitutive equation by assuming that rock element strength obeys a normal distribution function and Weibull function [4]. Li and Ma found [5] that the stress–strain curve of weakly jointed rock mass is obviously dependent on the joint width and water content. Shojaei et al. [6] studied the deformation and damage mechanism of porous rock and established the elastic–plastic damage constitutive model of rock based on continuous damage mechanics. On the basis of the Lemaitre hypothesis, a damage variable equation considering both macroscopic and mesoscopic defects was derived by Yiqing Zhao, Hong-yan Liu, and other scholars [7], and the compound damage constitutive model of a jointed rock mass has been established. According to the equivalent elastic parameter model of the nonpersistent jointed rock mass proposed by Shilin Yan, a macroscopic and mesoscopic coupling damage variable expression was proposed by Xiaoqing Yuan and Hongyan Liu et al. [8]. This model established a three-dimensional compound damage constitutive model for a nonpersistent jointed rock, but the complexity of its parameters is not conducive to calculation and application. On the basis of Helmholtz free energy, considering rock damage and lossless plastic deformation, an elastoplastic constitutive equation was deduced by Lide Wei and Weiya Xu [9] by using continuum damage mechanics. Wengui Cao and Sheng Zhang et al. [10] divided rock material into two parts: damaged and unbroken parts. On the basis of the different forces of these two parts, a rock damage constitutive equation was established using the energy principle of rock material destruction and yield. On the basis of the assumption of isotropic damage and strain equivalency and the adoption of the least energy consumption principle, Wei Gao and Lei Wang et al. [11] proposed a developing equation of rock damage from the point of view of energy. Qijian Liu and Linde Yang et al. [12] noted that the selection of the failure criterion has a great influence on the establishment of model curves and the equivalent elastic modulus of damaged rock, so it is necessary to select the appropriate failure criterion. In engineering construction, a nonpersistent joint is a typical type of rock joint, and the influence of the interaction of macroscopic joints on rock damage is considered. In the existing literature, a modification factor was introduced that was based on the array pitch and penetration rate [13]. However, the arrangement of rock joints is too complex, and it is difficult to confirm an appropriate correction factor for calculation. In this paper, based on Betti energy exchange theory [14], a corrected self-consistent method is introduced to manage the interaction of joint fissures, and a new compound mesoscopic and macroscopic damage constitutive model is deduced. On the basis of the effects of mesoscopic damage variables on different failure criteria, the difference in the calculation results of mesoscopic damage between the Mohr–Coulomb criterion and generalized von Mises criterion is studied, and these results are compared with laboratory test results [15].

2. Evolution Constitutive Model for Microscopic Damage

2.1. Establishment of the Model

According to the statistical damage model [16], macroscopic rocks are composed of mutually bonded particles. Under the effect of external force, defect elements will be gradually surrounded by these particles, and the rock mass damage develops due to the gathering and connecting process of these defect elements. Here, the mesoscopic damage variable D1 is introduced to indicate the failure process of the rock; D1 = 0 indicates that the rock is undamaged, and D1 = 1 indicates that the rock is completely damaged. In this paper, to calculate the damage variable of the rock, we assume that the intensity distribution of the elements obeys a certain density function.
Assuming that the rock strength follows a Weibull statistical probability density, the distribution function of rock microelements can be expressed as [16]:
P ( F ) = m F 0 ( F F 0 ) m 1 exp [ ( F F 0 ) m ]
where m and F0 are rock parameters.
The total number of microelements is N; if the number of microelements destroyed in rock mass under a certain load is Nf, the damage variable can be defined as [16]:
D 1 = N f N = 0 F P ( x ) d x = 1 exp [ ( F F 0 ) m ]
The evolution equations of the mesoscopic damage variable can be deduced from Equation (2).
According to the Lemaitre hypothesis 5, the effective stress can be defined by the following equation:
σ i = σ i ( 1 D 1 )
where σ i is the nominal stress of the material and σ i is the effective stress of the material.
Assuming that the microelements of rock obey Hooke’s law before destruction, the rock damage constitutive equation can be deduced from Equation (3).
σ i = E ε i ( 1 D 1 ) + μ ( σ j + σ k )
where E is the elastic modulus of the intact rock and ε 1 is the strain of the intact rock.
According to the generalized Hooke’s law, and substituting Equation (2) into Equation (4), the constitutive equations of damage statistics can be deduced:
σ i = E ε 1 exp [ ( F F 0 ) m ] + μ ( σ j + σ k )
where σ i and σ k are both confining pressures of the material.
There are different forms of expression of F under different failure criteria, and the principal effective stress satisfies σ 1 σ 2 σ 3 . Currently, the most widely used criterion is the Mohr–Coulomb criterion, which is also used here and can be presented as
F = 1 2 ( σ 1 σ 3 ( σ 1 + σ 3 ) sin γ ) = c cos γ
where c and γ are the cohesion of the rock and angle of friction.
In a laboratory triaxial compression test, to force the specimen to reach an isotropic stress state, which means that the specimen is under a hydrostatic stress, the specimen is initially compressed. From Equation (6), it can be determined that F < 0 ; furthermore, during the calculation process, F = 0 is regularly considered. However, in general rock problems, hydrostatic pressure has an effect on rock yielding; thus, in this paper, the generalized von Mises failure criterion is used and expressed as Equation (7):
F = α I 1 + J 2 1 2 k I 1 = 3 2 ( σ 1 + σ 3 ) 3 α J 2 1 2 ,   J 2 = 1 4 ( σ 1 σ 3 ) 2 1 3 α 2 α = sin γ 3 ( 3 + sin 2 γ ) 1 2 ,   k = 3 c cos γ 3 ( 3 + sin 2 γ ) 1 2
According to the Lemaitre strain equivalent hypothesis and Hooke’s law, the effective stress and nominal stress have the following relation:
σ 1 = E ε 1 σ 1 σ 1 2 μ σ 3
σ 3 = E ε 1 σ 3 σ 1 2 μ σ 3
By using Equations (8) and (9), the effective stress can be calculated from the nominal stress and axial strain.

2.2. Determination of the Distribution Parameters

It is assumed that σ c and ε c are the stress and strain at the peak point of the stress–strain curve from the uniaxial compression test, respectively, and the following two geometric conditions are introduced:
σ 1 | ε 1 = ε c = σ c
d σ 1 d ε 1 | σ 1 = σ c , ε 1 = ε c = 0
By using Equations (6) and (7), it is not difficult to calculate the value of F corresponding to the peak load.
{ S 1 = F | σ 1 = σ c , ε 1 = ε c S 1 = d F d ε 1 | σ 1 = σ c , ε 1 = ε c
Substituting Equation (12) into Equation (5), the distributed parameters m and F0 can be calculated using the following two formulas.
m = ( σ c 2 μ σ 3 ε c S 1 ) · { [ σ c 2 μ σ 3 ] S 1 · ln [ σ c 2 μ σ 3 E ε c ] } 1
F 0 = S 1 ( ln [ σ c 2 μ σ 3 E ε c ] ) 1 m

3. Compound Damage Constitutive Equation
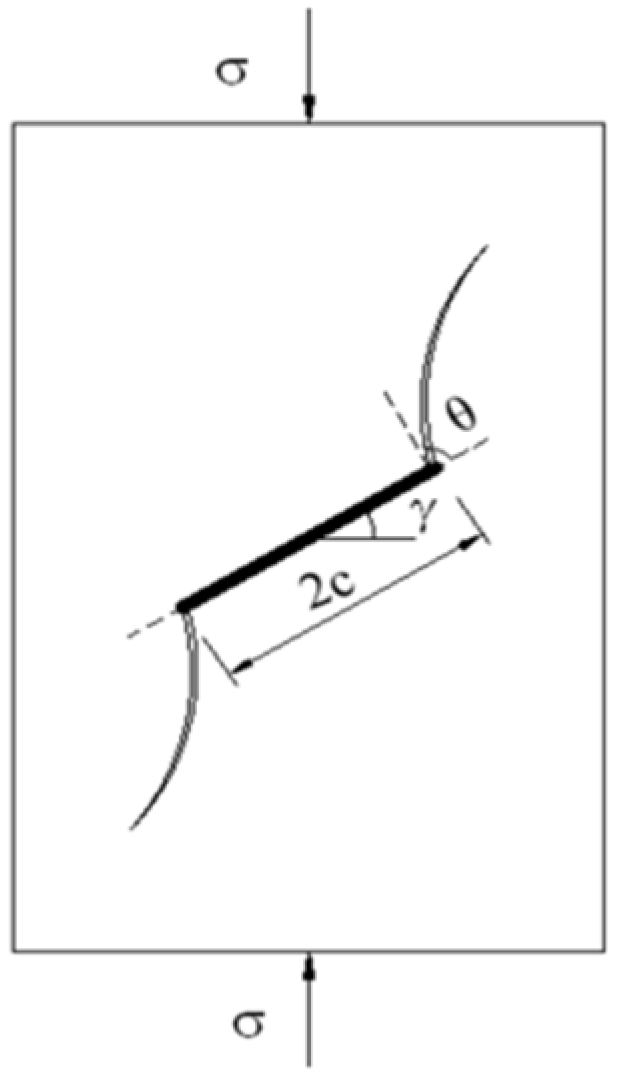
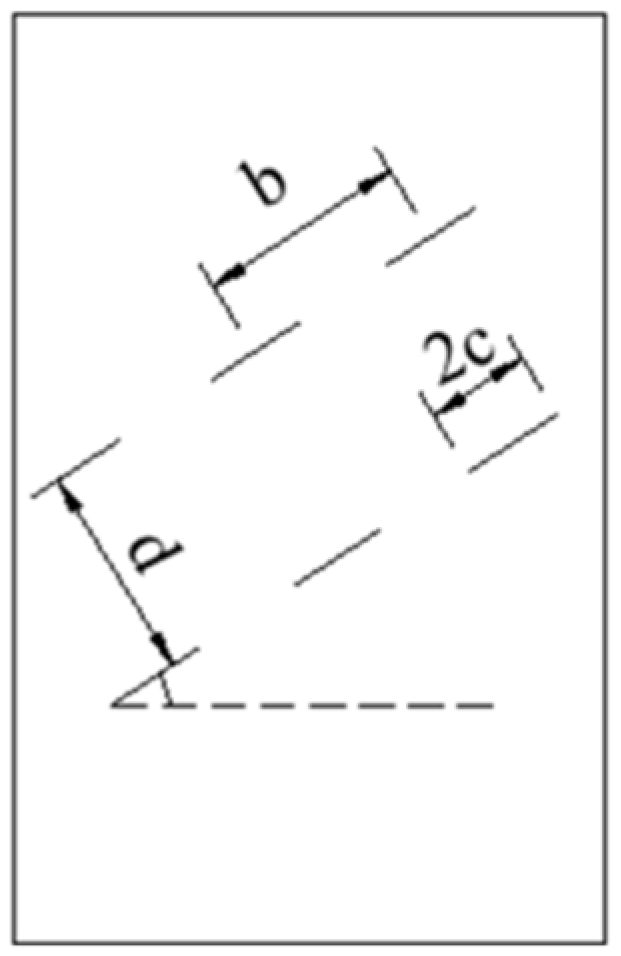
Under a uniaxial stress σ , a unit volume of rock mass exhibits the following relation according to the Betti energy reciprocity law [12].
σ 2 2 E * = σ 2 2 E + Δ ϕ 1 + Δ ϕ 2
where Δ ϕ 1 is the additional strain energy produced by microscopic damage of the unit volume of rock mass; Δ ϕ 2 is the additional strain energy produced by an incipient joint in the unit volume rock mass; E * is the elastic modulus of the damaged rock; and E is the elastic modulus of the intact rock.

3.1. Calculation of Δ ϕ 1

Under a uniaxial stress σ , Δ ϕ 1 can be calculated using Equation (16) by means of the microscopic damage variable presented in Section 2 [13,17].
Δ ϕ 1 = σ 2 [ 1 2 E ( 1 D 1 ) 1 2 E ]

3.2. Calculation of Δ ϕ 2

For plane stress problems, the additional strain energy, which is produced by the incipient joints in the unit volume of rock mass, can be calculated by Equation (17):
Δ ϕ 2 = ρ v 0 A G d A = ρ v E 0 A ( K I 2 + K I I 2 ) d A
where ρ v is the average volume density of a single group joint, A is the initial surface area of a single joint, A = 2 B c , B is the depth of the initial joint, and c is the half-length of the initial joint. G is the energy release rate of the rock. K I and K I I are the effective stress intensity factors of the joint tip.
The distribution of joints in a nonpersistent jointed rock mass is complex and is mostly random. To simplify the analysis, a rock mass is regarded as a damaged elastomer according to the theory of mathematical statistics, which simplifies the joints in the rock into multiple sets. The plastic strain energy, kinetic energy, and loss of other energy are not considered. For rock masses with N groups of joints, Δ ϕ 2 can be obtained using Equation (17) on the basis of the energy superposition principle.
ϕ 2 = i = 1 N ρ v i 0 A i G i d A i = i = 1 N ρ v i E 0 A i ( K I i 2 + K I I i 2 ) d A i
As shown in Figure 1, under the action of a uniaxial compressive stress σ , the far-field normal stress and shear stress acting on the joint surface are described by Equations (19) and (20).
σ n = σ cos 2 γ
τ s = σ sin γ cos γ
For a closed joint, the friction angle at the joint surface is φ ; then, the friction factor can be expressed as μ = tan φ . On the basis of a study by Xiaoqing Yuan et al. [13], the effective stress τ e f f on the joint plane can be expressed as
τ e f f = { 0 tan γ < tan φ τ s μ σ n tan γ tan φ
On the basis of the research of Xiaoqing Yuan et al. [13] and Isida [18], considering the influence of plate width, the revised effective stress intensity factor at the joint tip can be written [19] as
K I = 2 c τ e f f sin θ π l * sec ( π c w )
K I I = 2 c τ e f f cos θ π l * sec ( π c w )
where w is the width of the plate; θ is the extended direction of the wing crack, which is, in this paper, θ = 70.5 ° ; and l * is the introduced effective length considering the singularity at the joint tip, which is, in this paper, l * = 0.27 c [13].
Substituting Equations (21)–(23) into Equation (17) can produce Equation (24).
Δ ϕ 2 = { 0 tan γ < tan φ 9.43 c 2 B ρ v m 0 σ 2 E sec ( π c w ) tan γ tan φ
where m 0 = cos 2 γ ( sin 2 γ cos γ tan φ ) 2 .
For multiple fractures, to consider the influence of interaction between joints, the existing literature simplifies the randomly distributed joints to an ideal arrangement, as shown in Figure 2. The difference in the connection rate and array pitch, f ( c , b , d ) , which is the correction factor of the effective stress intensity factor for a single joint [13], is introduced and listed in Table 1.
K I = K I 0 f ( c , b , d )
K I I = K I I 0 f ( c , b , d )
where K I 0 and K I I 0 are the effective stress intensity factors for a single joint.
In practice, rock mass joints cannot be easily simplified into a linear form, such as that shown in Figure 2, and the correction factor is selected mostly due to past experience, which is not advised for practical calculation and theoretical analysis. Previous studies had shown that it is practical to use self-consistent methods to determine the interaction between joints 1; for example, the elastic moduli of the elements around the joint determines the nominal modulus of elasticity of the primary damaged mass. Therefore, the nominal modulus E * replaces the elasticity modulus E in Equation (24), as shown in Equation (27):
Δ ϕ 2 = { 0 tan γ < tan φ 9.43 c 2 B ρ v m 0 σ 2 E * sec ( π c w ) tan γ tan φ
Substituting Equations (16) and (27) into Equation (15),
E * E = { 1 D 1 tan γ < tan φ 1 ( 1 D 1 ) 18.86 c 2 B ρ v m 0 sec ( π c w ) tan γ tan φ
From Equation (28), under the condition tan γ tan φ , when the unit volume density of the rock mass ρ v reaches a certain value, the nominal modulus of elasticity E * is equal to zero, which is not consistent with natural conditions. Therefore, Equation (28) needs to be corrected and optimized. Bruner [20] proposed a revising method for self-consistency that is more specific, successively adding a single joint into the rock mass, and the corresponding modulus of elasticity of the rock mass changes. The elastic modulus changes from E , which is the elastic modulus of the rock mass before the first joint is added, to E * , which is the nominal modulus of elasticity of the rock mass after the last joint is added. Through this method, when tan γ tan φ , varying ρ v in Equation (28) and replacing E with E * [21], the following equations and corresponding initial conditions can be obtained:
{ d E * d ρ v = ( 1 D 1 ) 18.86 c 2 B m 0 sec ( π c w ) E * E * ( 0 ) = E ( 1 D 1 )
An approximate solution of Equation (29) is
E * E = exp ( ( 1 D 1 ) 18.86 c 2 B ρ v m 0 sec ( π c w ) )
According to the definition of damage variable E * = E ( 1 D ) and Equation (30), the compound microscopic and macroscopic joint damage can be deduced as
D = 1 ( 1 D 1 ) exp ( ( 1 D 1 ) 18.86 c 2 B ρ v m 0 sec ( π c w ) )
From Equation (31), when there is only microscopic damage in the rock mass, namely, the joint volume density ρ v = 0 , the compound damage variable is equal to the microscopic damage D = D 1 . When there is only macroscopic damage in the rock mass, the compound damage variable is equal to the macroscopic damage, which corresponds with the actual situation, so the compound damage equation established in this method is reasonable.
Equations (28) and (31) show that the expression of the compound microscopic and macroscopic damage variable can be deduced as
D = { D 1 tan γ < tan φ 1 ( 1 D 1 ) exp ( ( 1 D 1 ) 18.86 c 2 B ρ v m 0 sec ( π c w ) ) tan γ tan φ
On the basis of the energy superposition principle used in Equation (18), the damage variable formula of a damaged rock mass with multiple joints can be derived and expressed as
D = { D 1 tan γ < tan φ 1 ( 1 D 1 ) exp ( i = 1 i = n ( 1 D 1 ) 18.86 c 2 B ρ v m 0 sec ( π c w ) ) tan γ tan φ
where i represents different series of joints.
According to the study of Xiaoqing Yuan [11], the compound microscopic and macroscopic damage constitutive equations can be written as
σ = E ( 1 D ) ε
where σ is the stress component, ε is the strain component, and the compound damage variable D can be calculated using Equations (32) and (33).

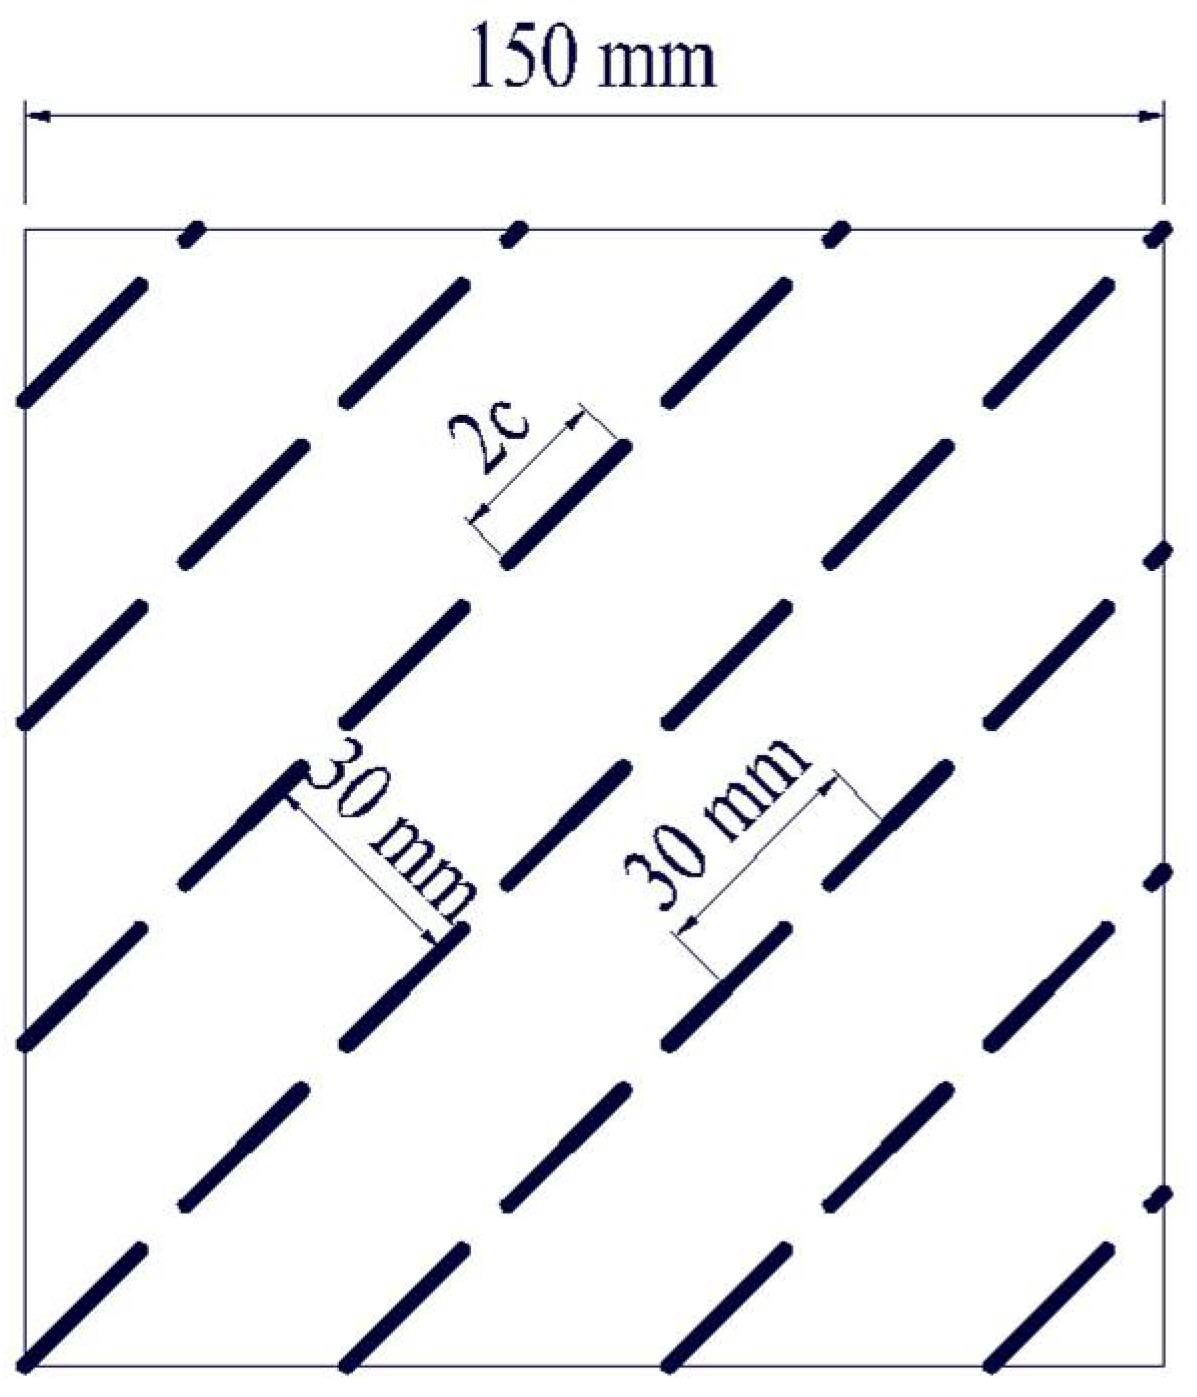
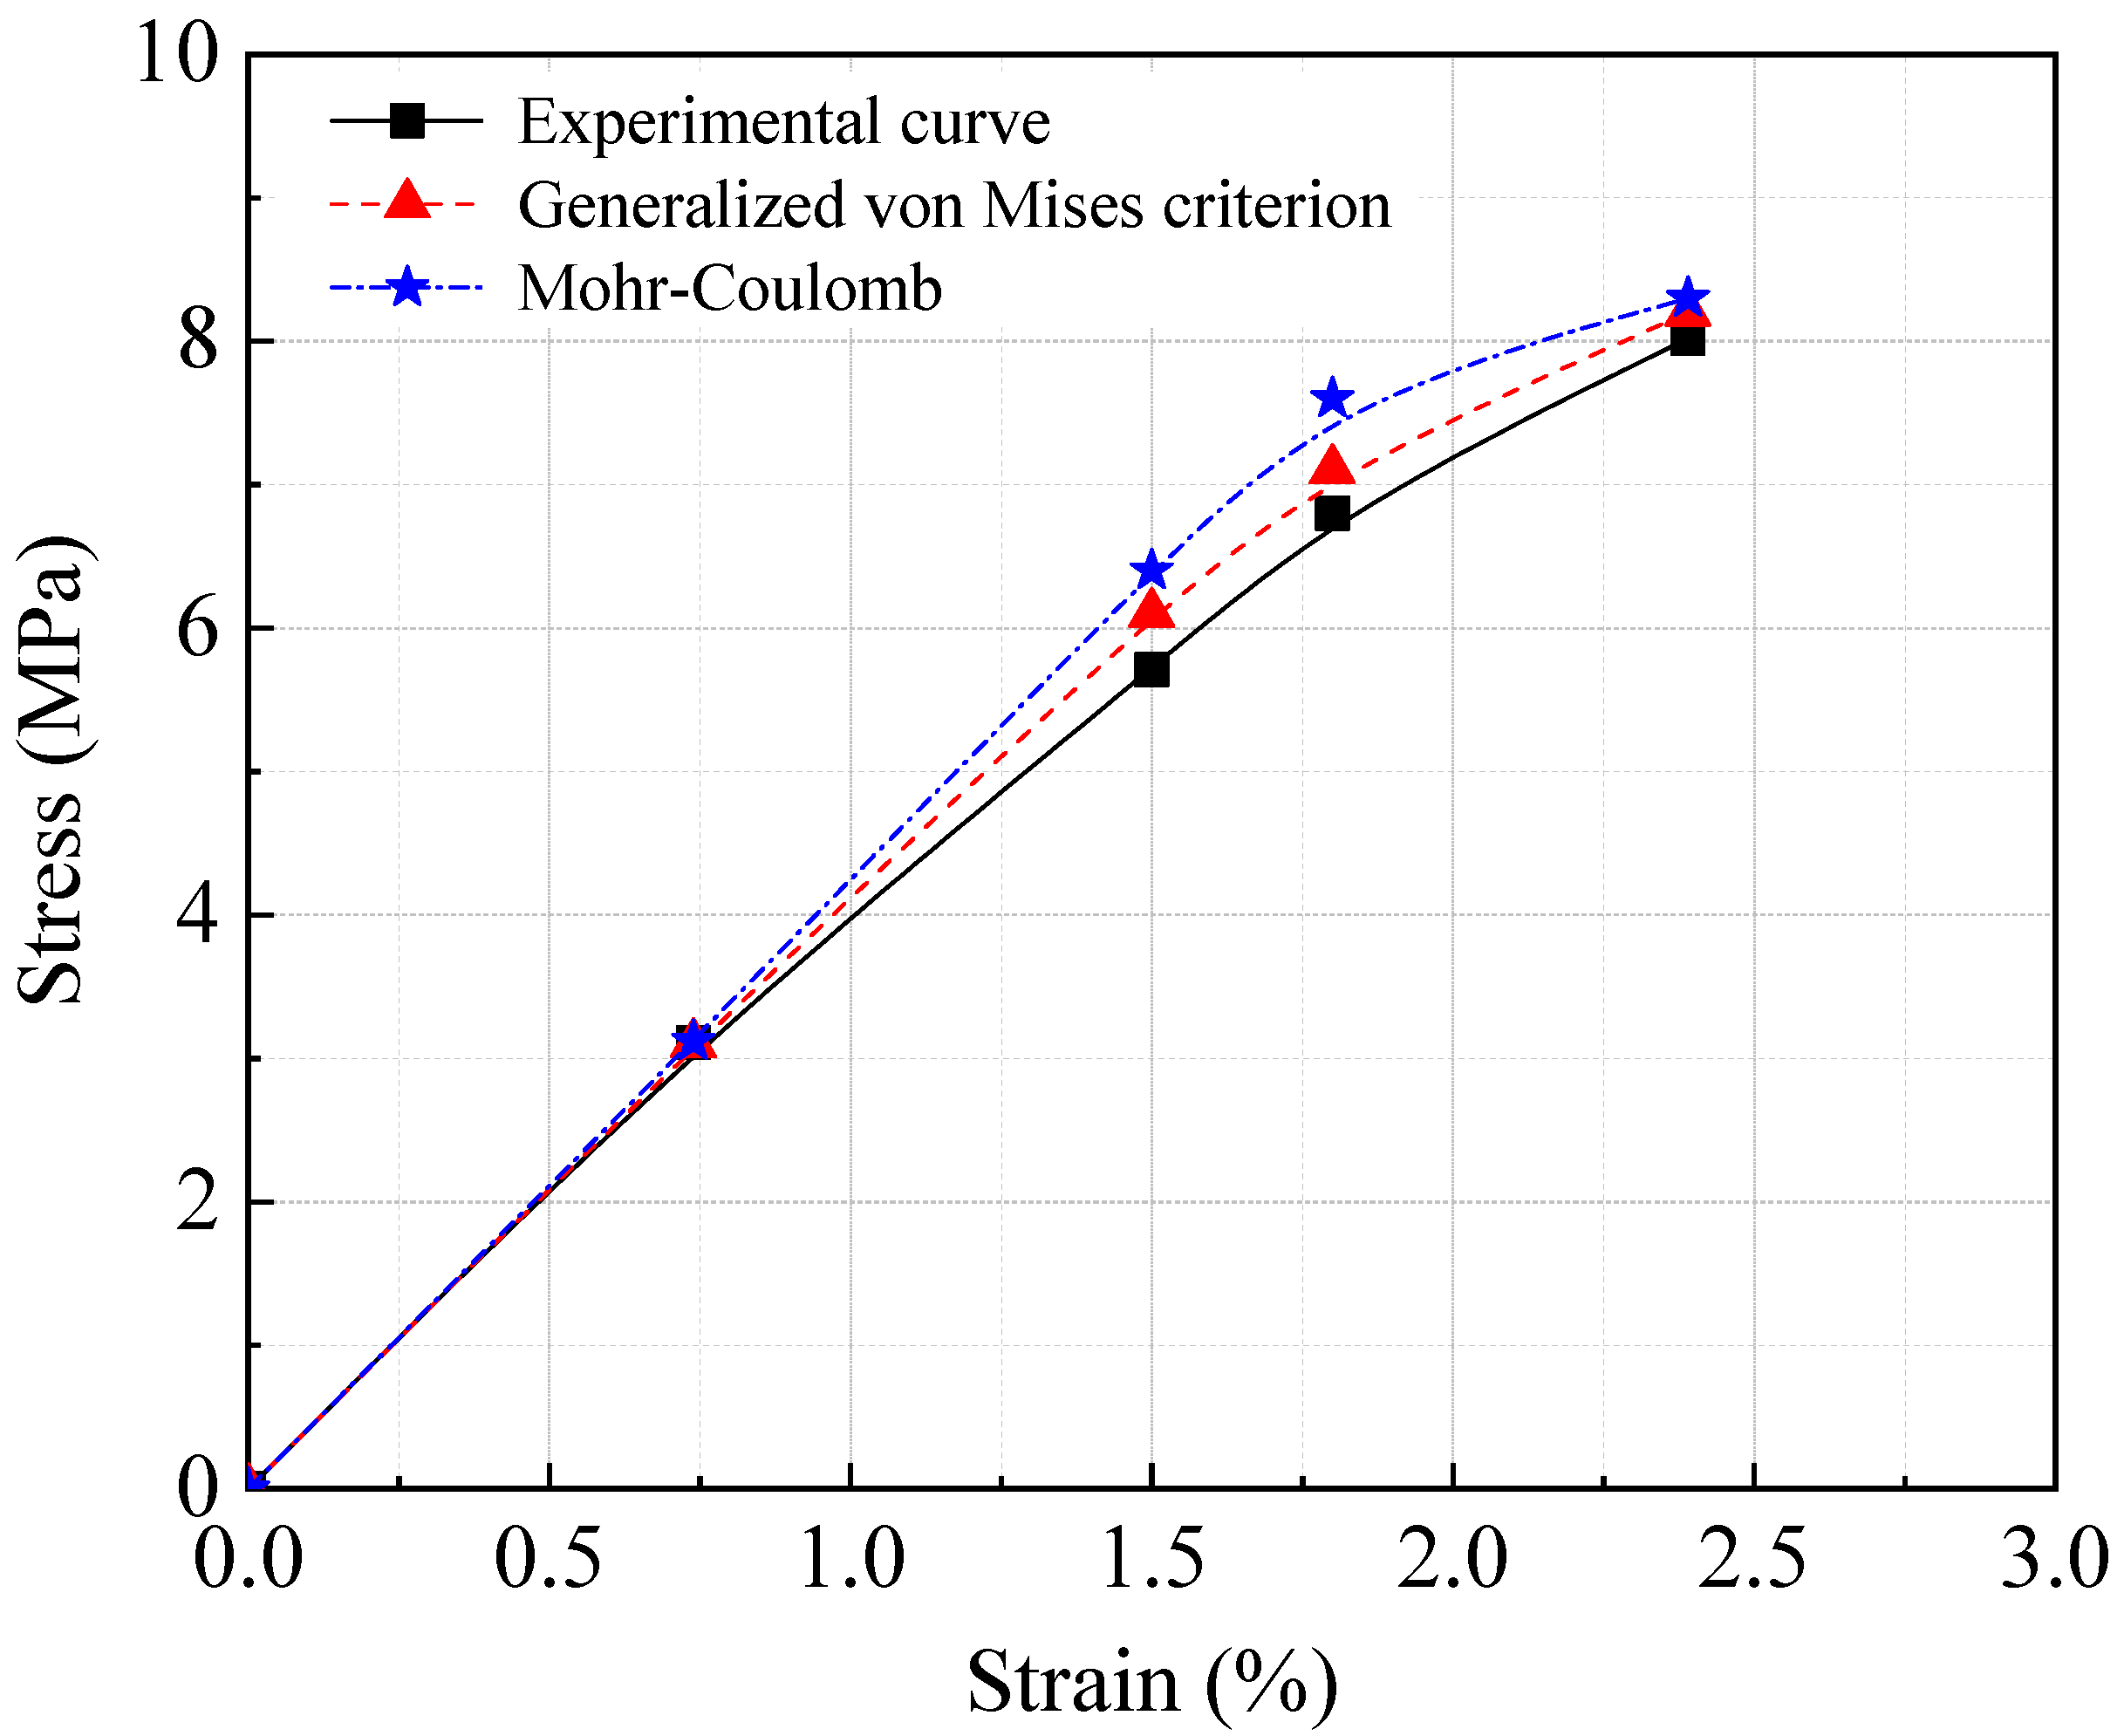
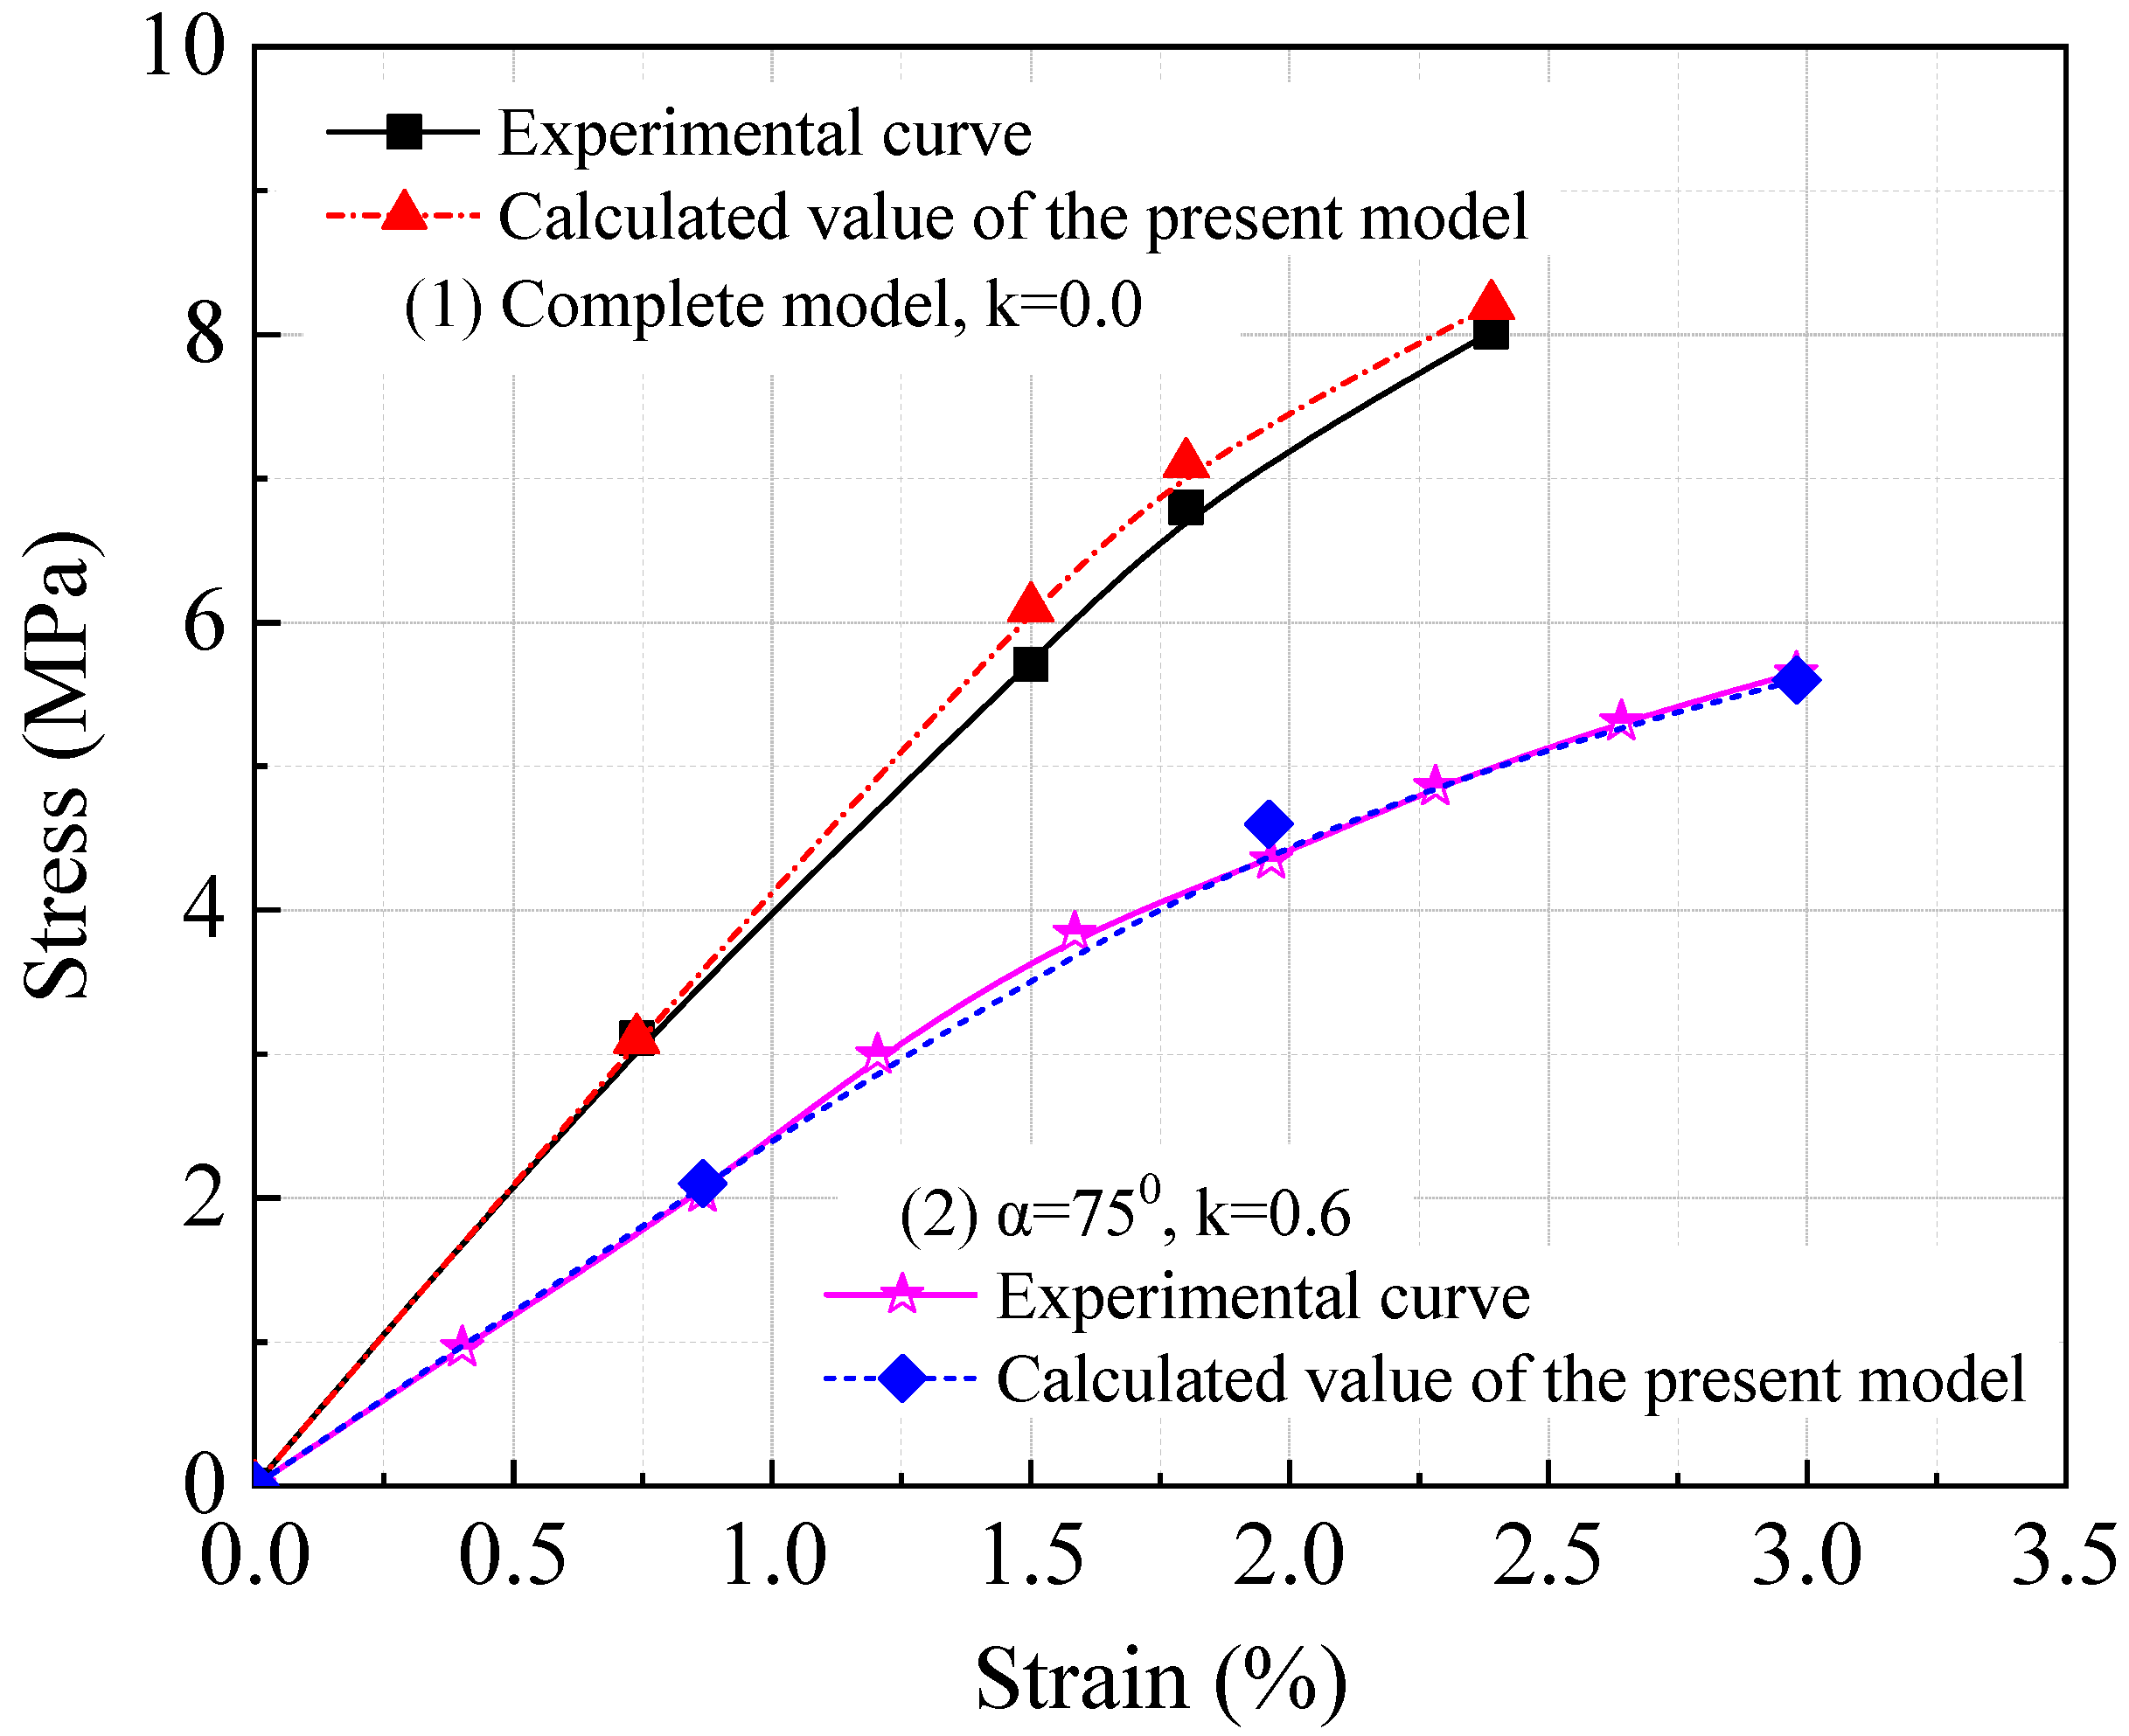
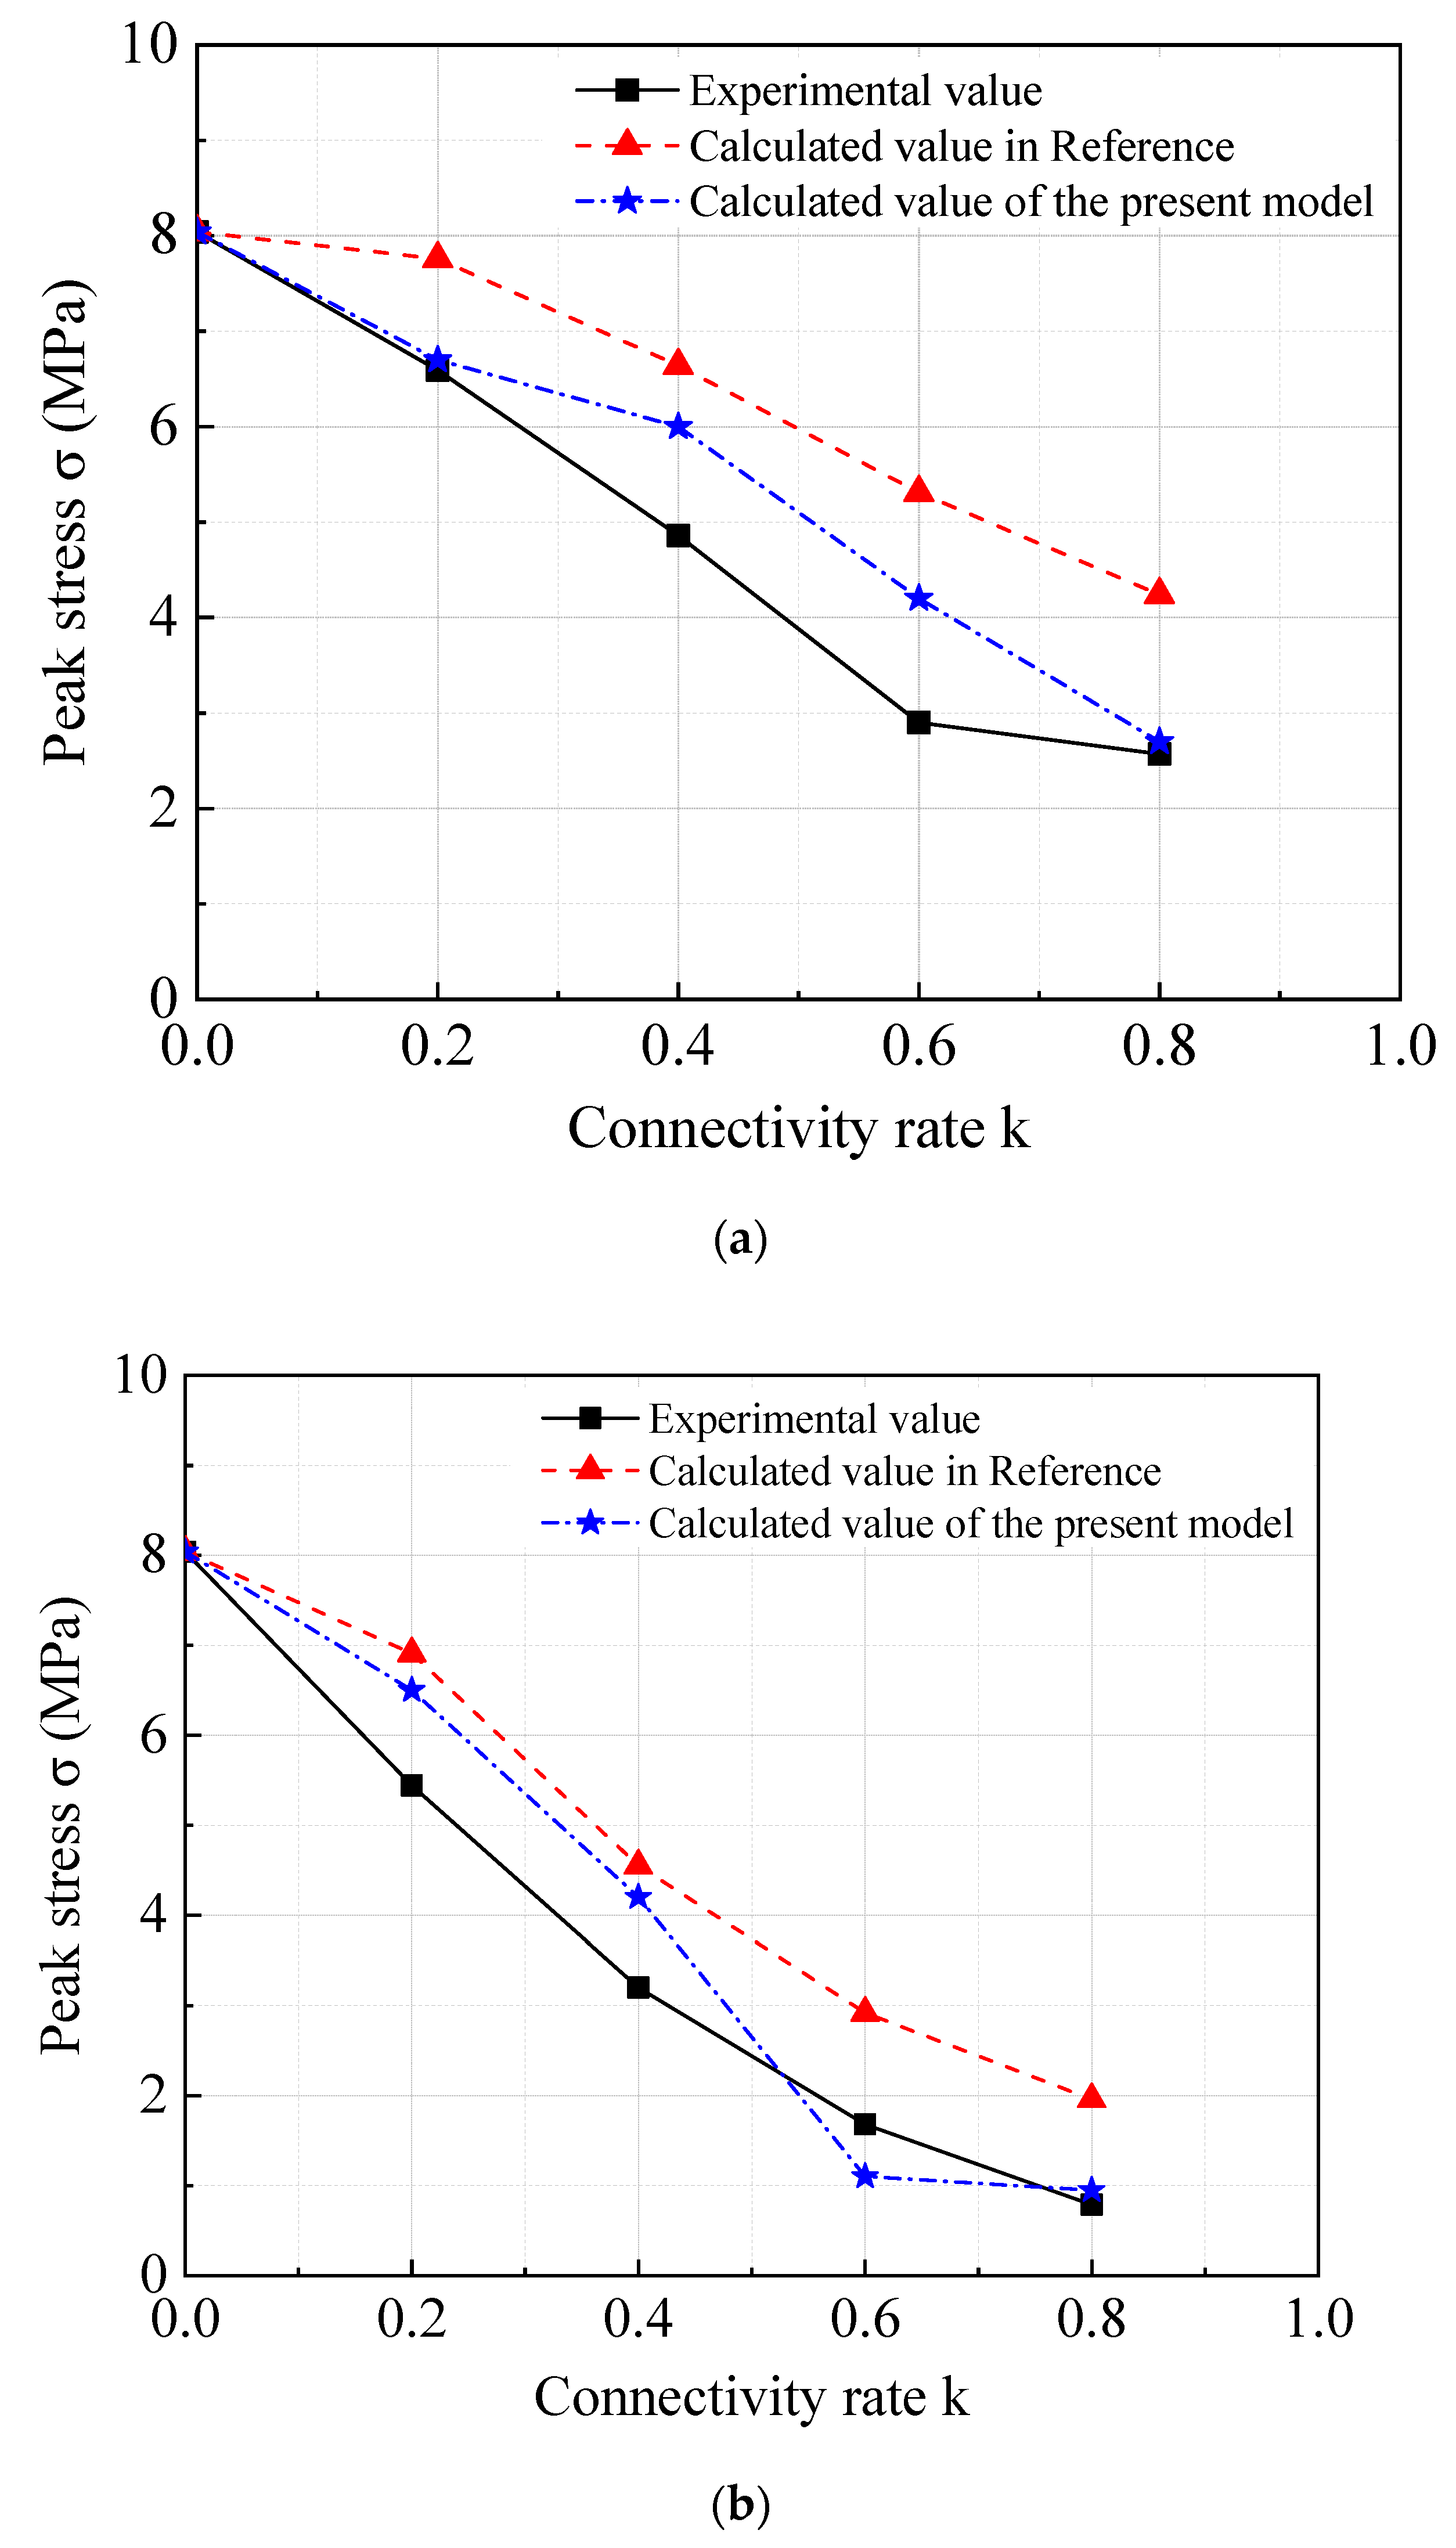
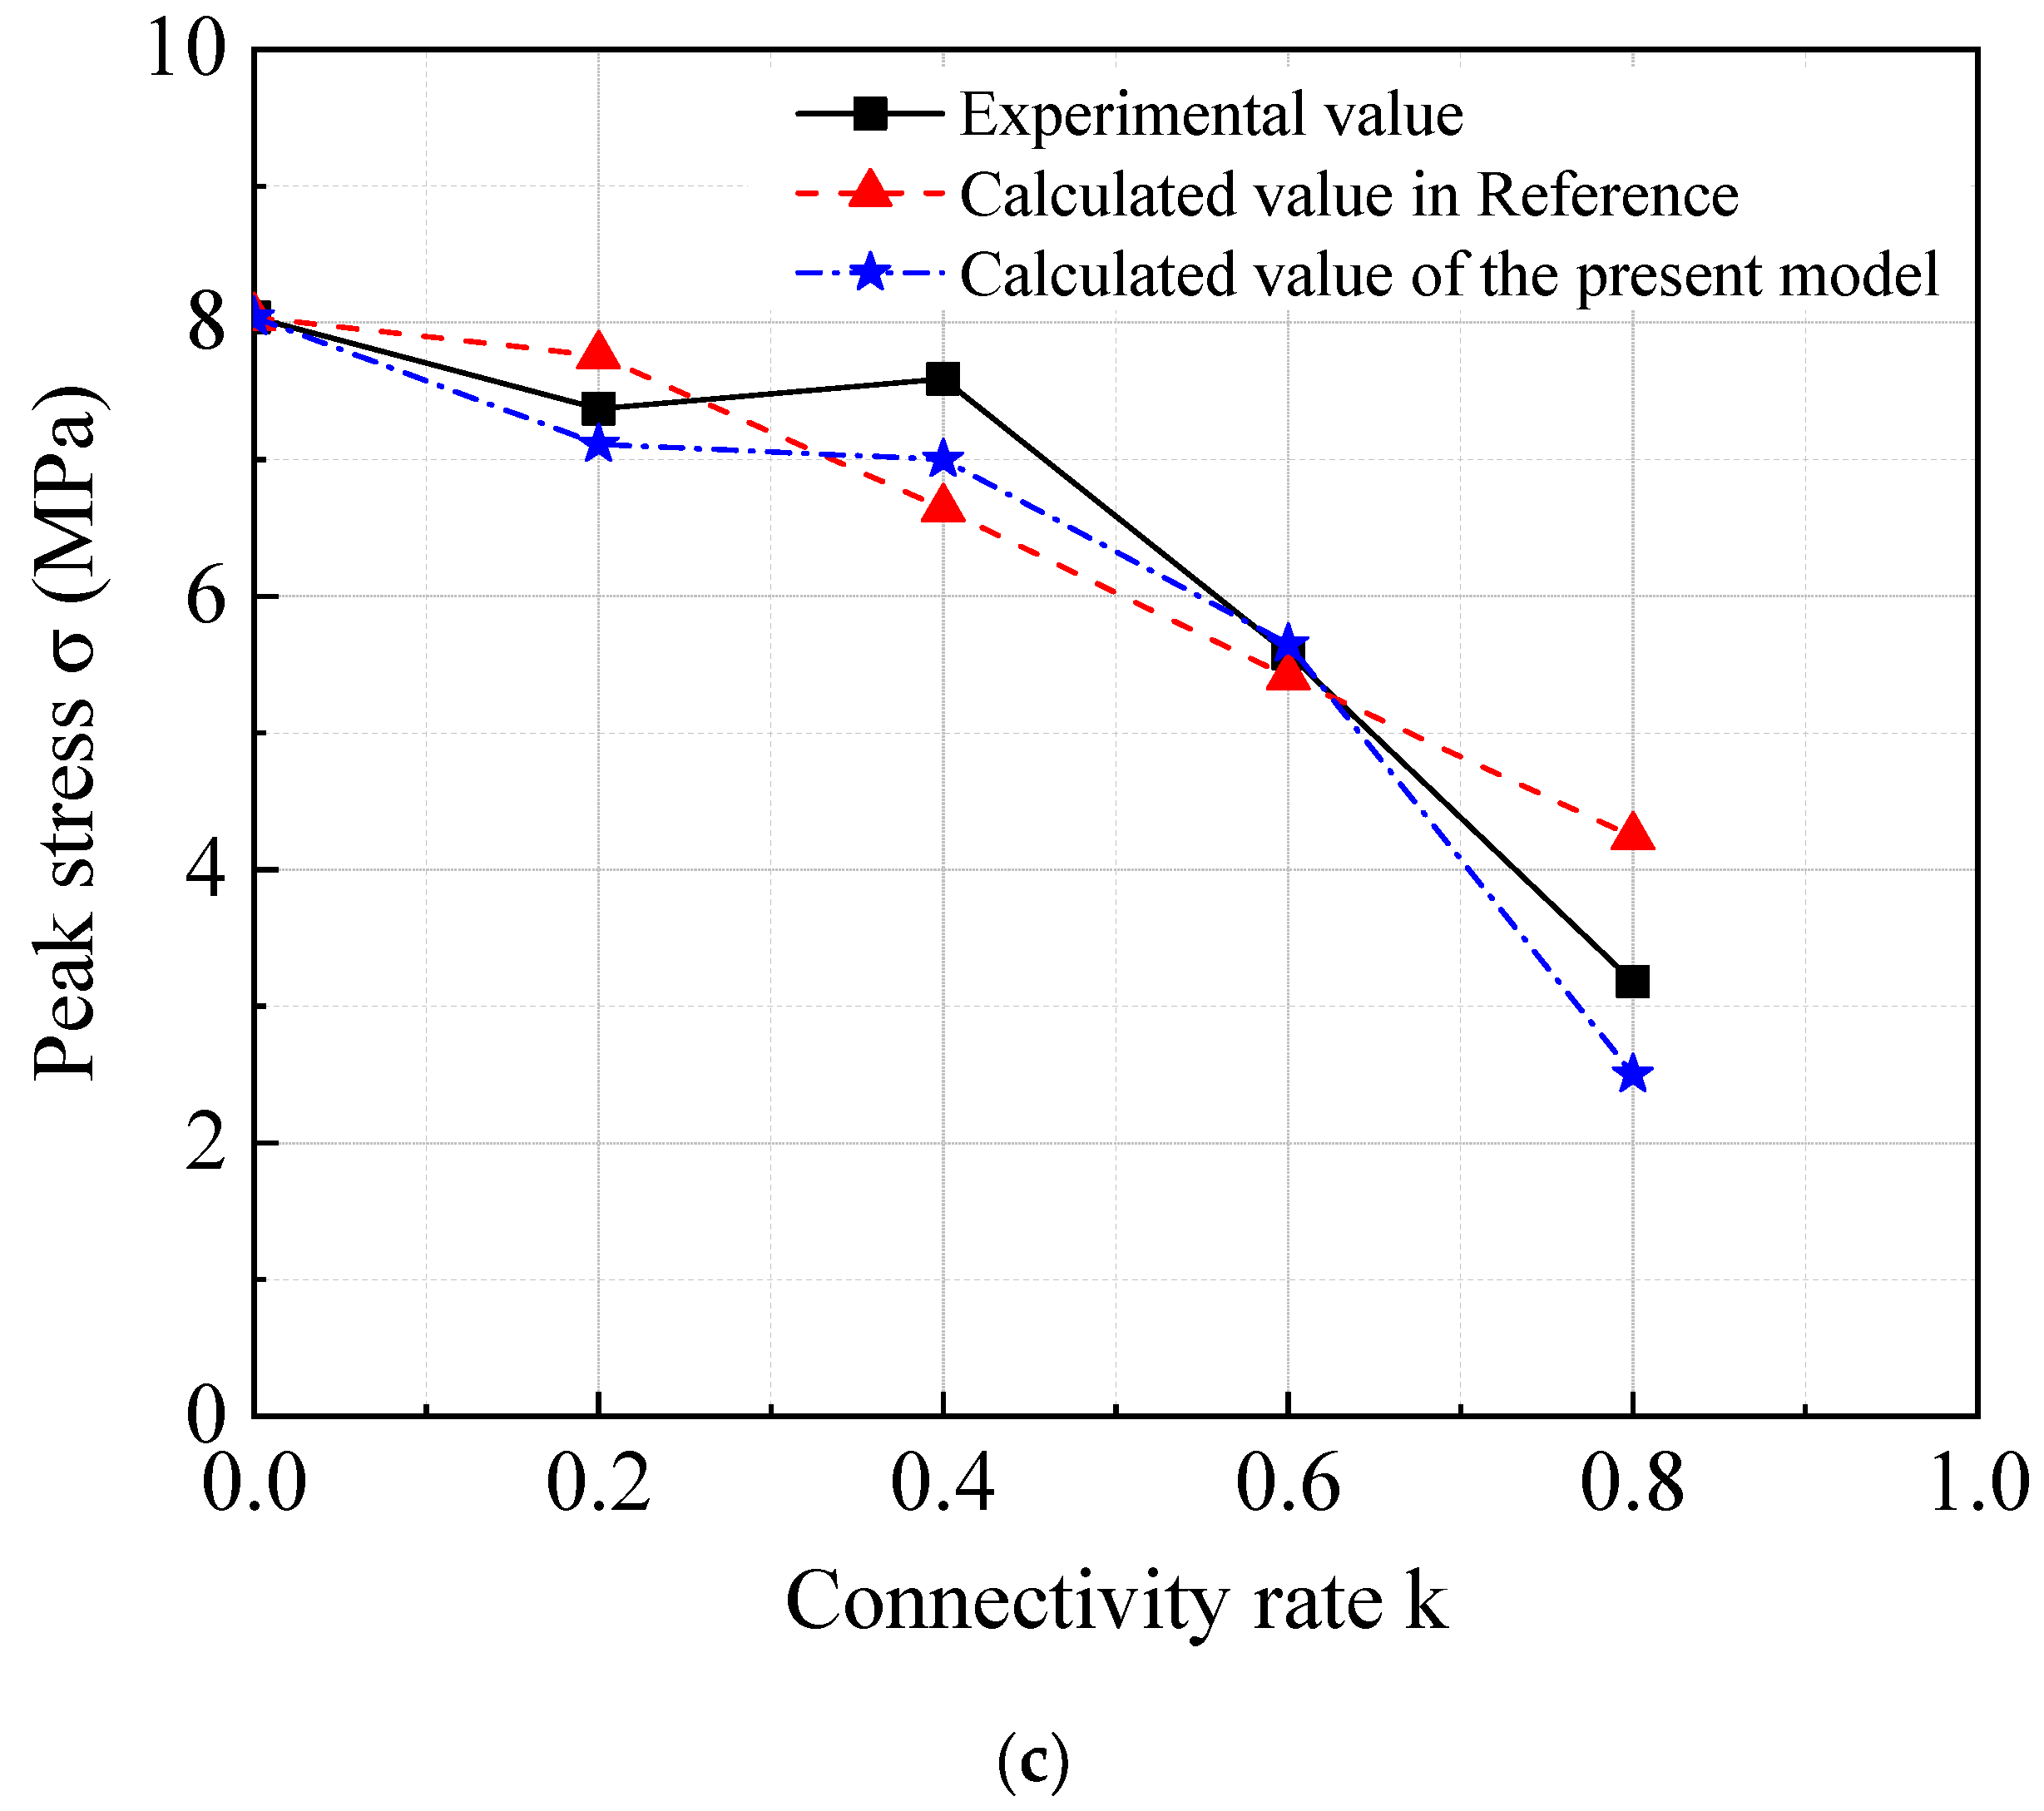
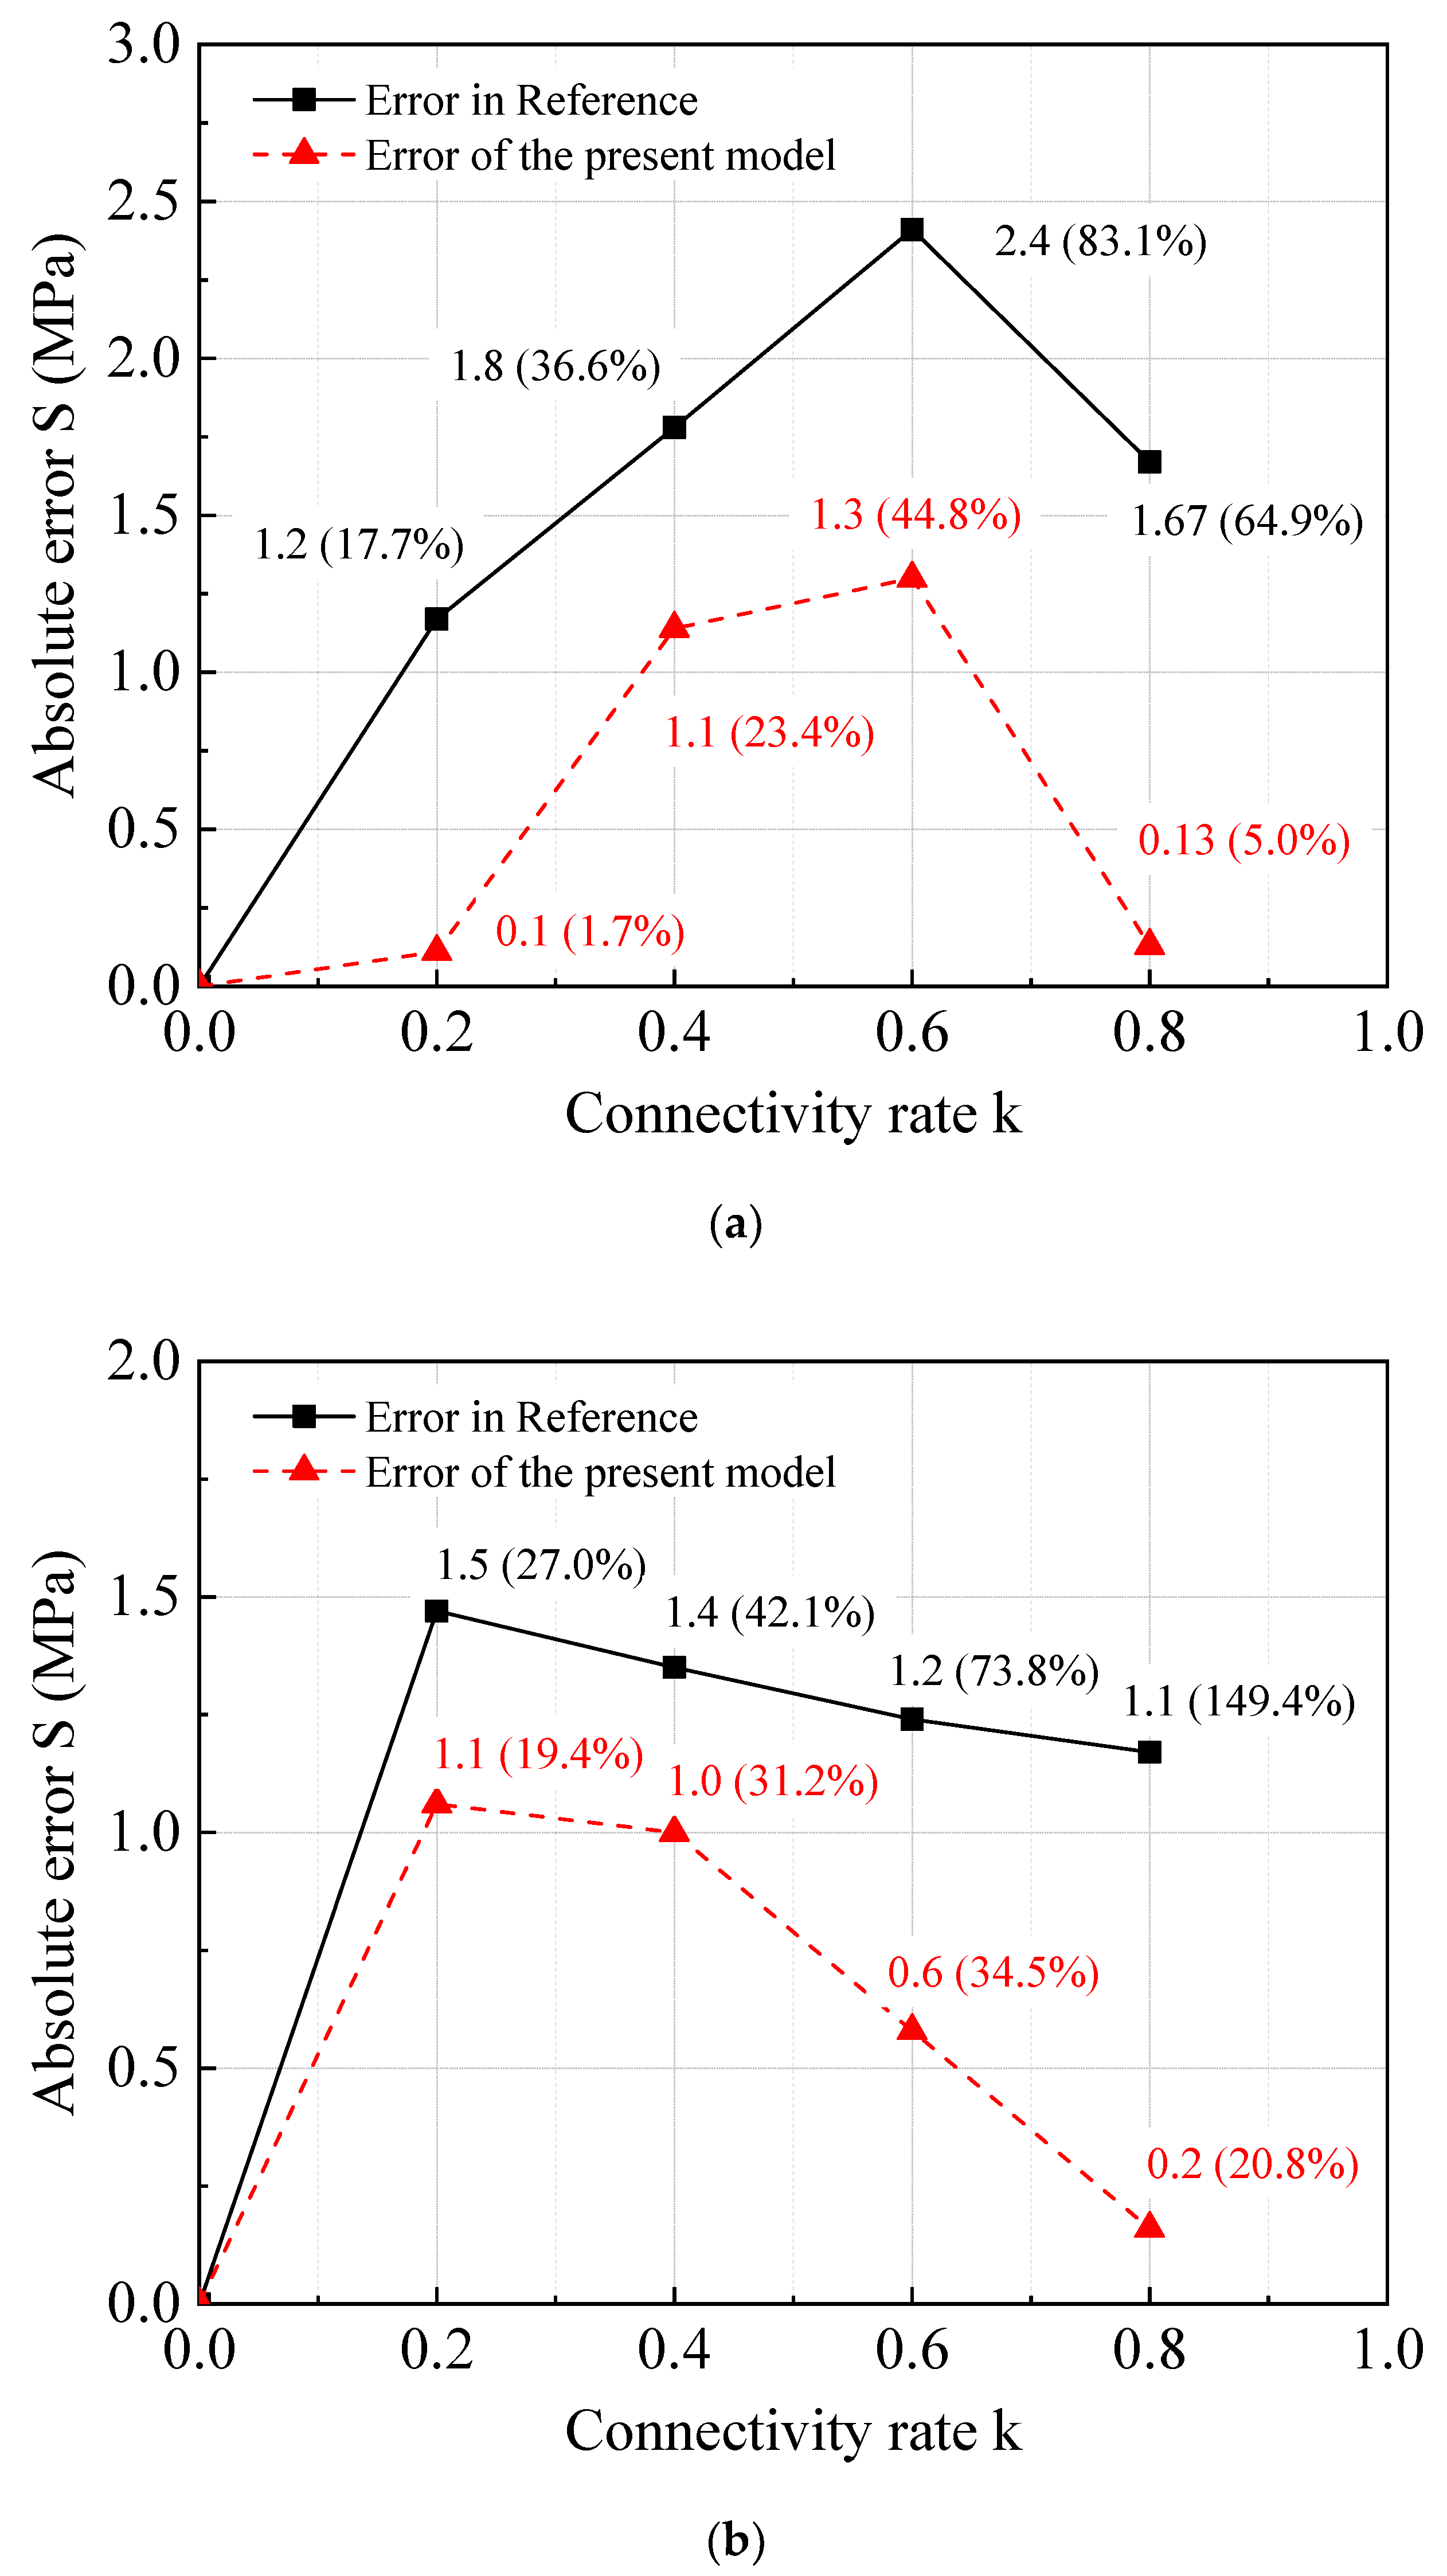
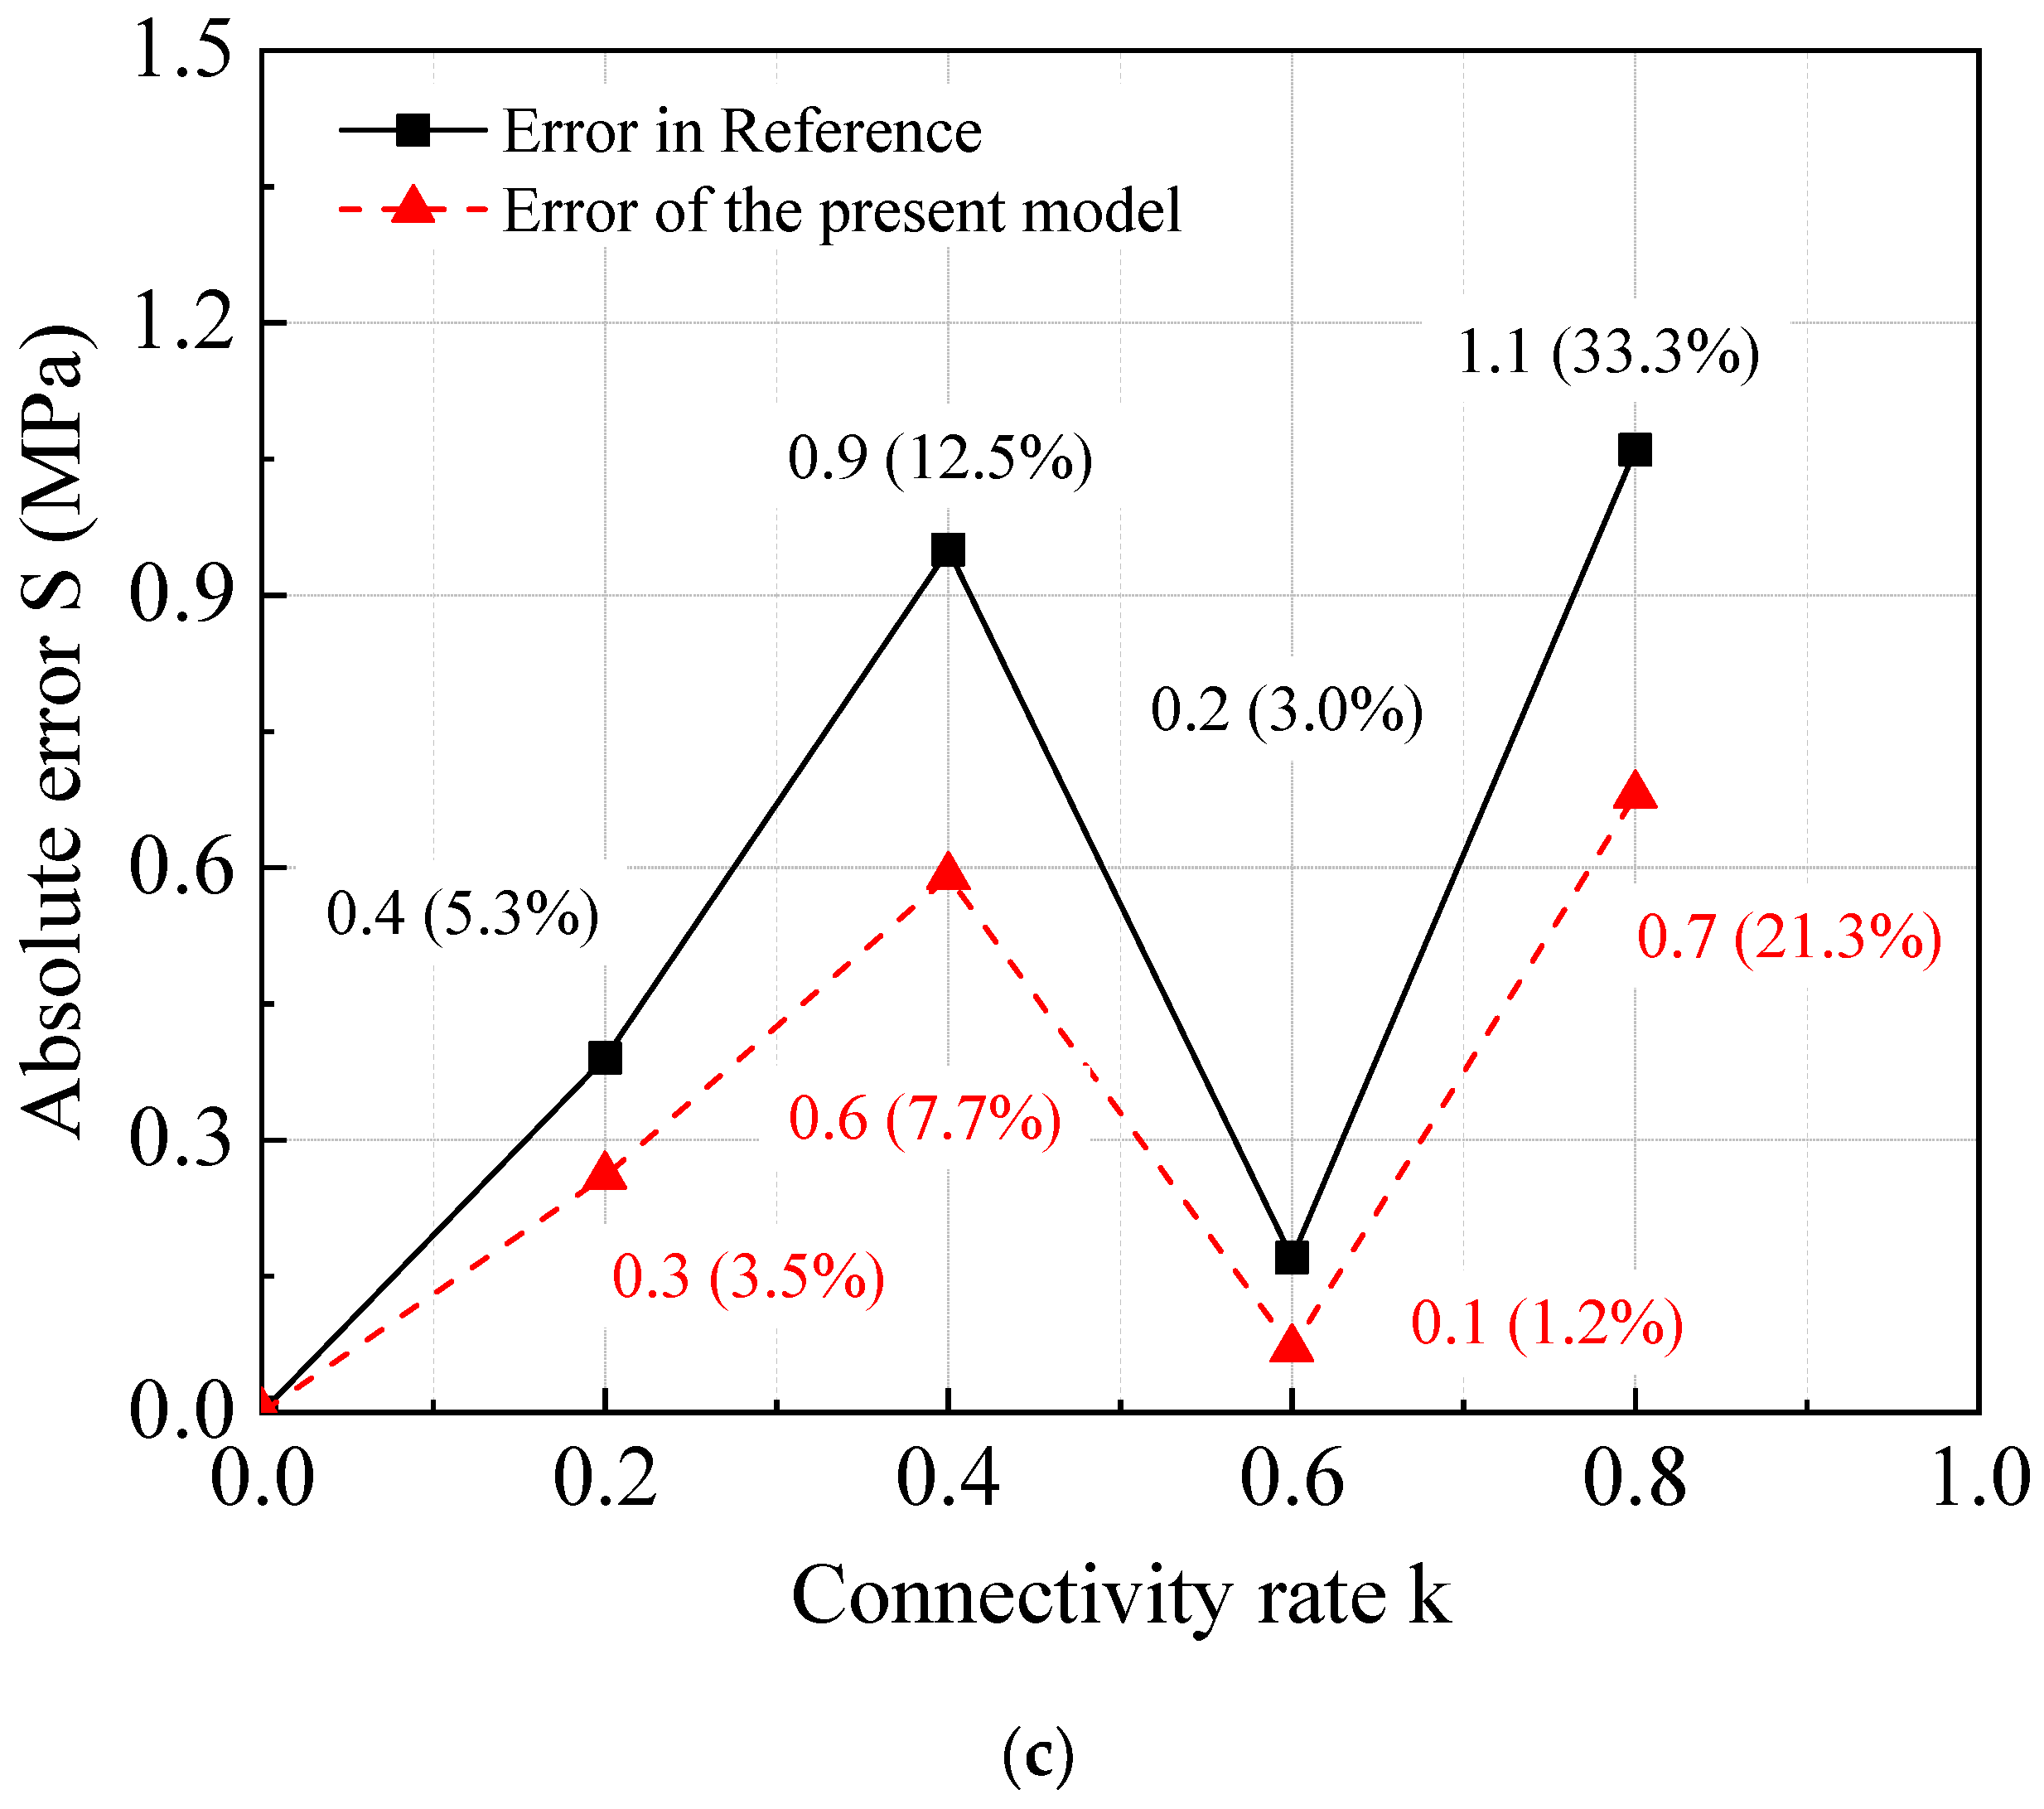
4. Example Calculation and Model Verification

To verify the validity of the model built in this paper, the experimental results and corresponding theoretical results of a plaster model test [13], which is deduced from the compound damage constitutive equation based on the Lemaitre hypothesis [22], are compared with the theoretical calculation results of this paper. The test piece is a 15 cm × 5 cm × 15 cm square slab, the prefabricated crack is the crack with penetrating thickness, the joint center distance h = 3 cm, the joint layer spacing B = 3 cm, and the arrangement mode is aligned. There are five values of joint connection rate K in the test, which are 0, 0.2, 0.4, 0.6, and 0.8. In the test, the loading is controlled by displacement, and the loading rate is 0.15 mm/min. The plane model of the test specimen is shown in Figure 3.
The definition of the connection rate of joint k is the same as the definition provided in Reference [13], namely, it is the area ratio within the plane of the joint, and when the values of k are 0.0, 0.2, 0.4, and 0.6, the corresponding joint lengths are 0.0, 0.6, 1.8, and 2.4 cm. When calculating the damage variable using Equation (33), the parameter value is the same as the value provided in Reference [13] and given in Table 2.
For comparing the influence of mesoscopic damage, for the calculation results under different failure criteria, based on the complete stress–strain curve of gypsum in [13], the corresponding mesoscopic damage variables under the generalized von Mises and Mohr–Coulomb criteria can be calculated as m = 3.88 ,   F 0 = 7.647 and m = 3.88 ,   F 0 = 11.02 , respectively. The stress–strain curves of the fitted complete plaster model under the Mohr–Coulomb and generalized von Mises criteria are given in Figure 4 [13], and the fitting effect is satisfactory when the stress level is less than 3 MPa. The calculation results of these two failure criteria are basically the same as the values acquired from the laboratory test, as shown in Figure 4. The main reason for this is that the microscopic damage has not yet evolved, which means that the elastic modulus of the rock mass is equal to the elastic modulus of the complete model. With an increase in the stress level, when the stress is greater than 3 MPa, in this paper, mesoscopic damage begins to evolve, and the theoretical calculation values are higher than the laboratory test results. The maximum deviation in the results between the two failure criteria and the laboratory tests are 0.69 MPa and 0.39 MPa, respectively, and the relative deviations are 12.0% and 6.8%. Clearly, the deviation of the theoretical arithmetic values from the Mohr–Coulomb failure criterion is greater, and the computed results under the generalized von Mises yield criterion agree well with the results from the laboratory test.
According to the above failure criteria, the influence factors of the microscopic damage variable calculations are analyzed with the generalized von Mises yield criterion, which produces results that more closely follow the results of the laboratory tests; this leads to the creation of the compound damage constitutive model presented in this paper. The compound damage variables can be calculated by substituting Equation (32) into the theoretical stress–strain curve relations of the model presented in this paper. The complete plaster model and stress–strain curve of the laboratory test assumes a joint inclination of α = 75° and a connectivity rate of k = 0.6. The fitting results of Equation (34), based on the model presented in this paper, and the stress–strain curve, presented in [13], are shown in Figure 5, while the calculation parameter is given in Table 2.
Figure 5 shows that the model presented in this paper fits well with the tested stress–strain curve for a joint inclination of α = 75° and a connectivity rate of k = 0.6 when the stress level is low (in this paper, the stress is less than 2 MPa); the experimental curves [23] and the theoretical curves of the model basically coincide, and the errors can be ignored. The main reason for this consistency is that the microscopic damage has not yet evolved, which means that the elastic modulus of the rock mass is equal to the elastic modulus of the complete model. With an increase in the stress level, when the stress is greater than 2 MPa, in this paper, microscopic damage begins to evolve, and the theoretical calculation values are higher than the results of the laboratory test. The maximum absolute error and maximum relative error are 0.25 and 5.7%, respectively, and the error is less than the acceptable standard. Compared with the error of the complete plaster model, the error of the damaged body from the laboratory test is clearly lesser. The analysis shows that the low stress levels of the damaged body caused the reduction in error.
With the increase in stress level, the joint damage of the rock mass changes from macroscopic damage to compound damage, including both initial macroscopic joint damage and microscopic damage. From the definition of the damage variables, the peak load strength of the rock mass σ f can be calculated using Equation (35), shown as [11]
σ = E ( 1 D ) ε f
where ε f is the strain value corresponding to the peak load. D is the compound damage variable of microscopic and macroscopic joints at the peak load and can be calculated using Equation (32).
To explain the rationality of the compound damage model in this paper, referring to the data in Reference [13], in this paper, the peak stresses of the compound damage model are calculated using Equation (35) for various joint angles and connectivity rates. Figure 6 shows curves that contain the peak values of the theoretical arithmetic results of the presented model in this paper, the values of the laboratory test from Reference [13], and the peak values of the theoretical arithmetic results of Reference [13]. Figure 6 clearly shows that the variations in the three curves are in good agreement. That is, the peak load value of the rock mass decreases with the increasing penetration rate.
The values of the laboratory test results and the peak values of the theoretical arithmetic results presented in Reference [13] are expressed as σ f and σ t 1 , respectively, and the peak load values of the theoretical arithmetic results of the compound damage model presented in this paper are expressed [24] as σ t 2 . The absolute error and relative error of the theoretical calculation and the laboratory test results can be calculated using Equations (36) and (37):
S = | σ t i σ f |
S S = S σ f × 100 %
In Figure 7, the variation in absolute error S , of which the peak load values of the theoretical model presented in this paper and peak load values of the theoretical arithmetic and laboratory test in Reference [13], are shown for different joint angles and connectivity rates. The corresponding relative error S S is marked in brackets.
Figure 7 shows that the calculation errors of the peak load of the theoretical model used in this paper and the calculation error from Reference [13] exhibit the same variation with the connectivity rate. On the whole, under different joint angles and connectivity rates, the total mean absolute error and relative error presented in this paper are 0.6 MPa and 17.6%, both of which are less than the corresponding values given in Reference [13], namely, 1.23 MPa and 43.1%. By analyzing the absolute error and relative error at the peak load, it is not difficult to determine that the theoretical calculation errors of the compound damage model presented in this paper are less than the corresponding values of error in Reference [13], that is, the results of the compound damage model [25] of this paper agree with the results of the laboratory test more closely than the results in Reference [13].
In this paper, based on a modified self-consistent method, a compound microscopic and macroscopic damage constitutive model is deduced, and a comparison of the theoretical calculation results of this paper with the corresponding results in Reference [13] confirms the rationality of this new compound damage constitutive model.

5. Discussion

(1) In this paper, for nonpersistent jointed rock masses, a self-consistent methodology is introduced that amends the traditional self-consistent method by increasing the number of joints one by one to account for the interaction among joints. Based on the Betti energy reciprocity theorem, this work deduces the new compound microscopic and macroscopic damage constitutive model. The joint compliance and hysteresis in normal loading are ignored in the model. The model has limitations in the uniformity of nonpersistent joint distribution, the assumption of uniform stress distribution, and the certainty of joint information.
(2) The comparison and analysis of the theoretical calculation results and laboratory test results of the compound damage model with the existing theories indicates the following: 1. The compound damage model in this paper more accurately fits the stress–strain curve from the laboratory test. 2. The theoretical calculation results for the compound damage model in this paper are consistent with the experimental results, i.e., peak load decreases as the connectivity rate increases. 3. Under different joint angles and connectivity rates, the theoretical calculations of the compound damage model are more aligned with the experimental results, verifying the correctness and rationality of the model.

Author Contributions

Writing—original draft, L.L.; Project administration, X.Y.; Writing—review and editing, J.W.; Software, Y.Z.; Validation, L.Z. All authors have read and agreed to the published version of the manuscript.

Funding

This research received no external funding.

Institutional Review Board Statement

Not applicable.

Informed Consent Statement

Not applicable.

Data Availability Statement

Not applicable.

Conflicts of Interest

The authors declare no conflict of interest. The funders had no role in the design of the study; in the collection, analyses, or interpretation of data; in the writing of the manuscript, or in the decision to publish the results.

References

  1. Kemeny, J.M.; Cook, N.G.W. Effective moduli, non-linear deformation and strength of a cracked elastic solid. Int. J. Rock Mech. Min. Sci. Geomech. Abstr. 1986, 23, 107–118. [Google Scholar] [CrossRef]
  2. Weibull, W. A statistical distribution function of wide applicability. J. Appl. Mech. 1951, 18, 293–297. [Google Scholar] [CrossRef]
  3. Keats, J.B.; Lawrence, F.R.; Wang, F.K. Weibull maximum likelihood parameter estimates with censored data. J. Qual. Technol. 1997, 29, 105–110. [Google Scholar] [CrossRef]
  4. Zhao, H.; Cao, W.; Li, X.; Zhang, L. Effect of volume changes on complete deformation behavior of rocks. J. Cent. South Univ. 2010, 17, 394–399. [Google Scholar] [CrossRef]
  5. Li, J.C.; Ma, G.W. Experimental study of stress wave propagation across a filled rock joint. Int. J. Rock Mech. Min. Sci. 2009, 46, 471–478. [Google Scholar] [CrossRef]
  6. Shojaei, A.; Taleghani, A.D.; Li, G. A continuum damage failure model for hydraulic fracturing of porous rocks. Int. J. Plast. 2014, 59, 199–212. [Google Scholar] [CrossRef]
  7. Zhao, Y.; Liu, H.; Lu, S. Damage constitutive model of jointed rock mass based on coupling macroscopic and mesoscopic flaws. J. Cent. South Univ. Sci. Technol. 2015, 46, 1489–1496. [Google Scholar]
  8. Yuan, X.; Liu, H.; Liu, J. 3-D constitutive model for rock masses with non-persistent joints based on compound damage. Chin. J. Geotech. Eng. 2016, 38, 91–99. [Google Scholar]
  9. Wei, L.D.; Xu, W.Y.; Yang, C.H. Study on damage constitutive model of rock with plastic strain. Chin. J. Rock Mech. Eng. 2005, 24, 5598–5603. [Google Scholar]
  10. Cao, W.; Zhang, S.; Zhao, M. Study on a statistical damage constitutive model with conversion between softening and harding properities of rock. Eng. Mech. 2006, 23, 110–115. [Google Scholar]
  11. Gao, W.; Wang, L.; Yang, D. Rock damage evolution based on energy principle. Chin. J. Rock Mech. Eng. 2011, 30, 4087–4092. [Google Scholar]
  12. Liu, Q.J.; Yang, L.D.; Cao, W.G. Statistical damage constitutive model for rock and back analysis of its parameters. Yanshilixue Yu Gongcheng Xuebao/Chin. J. Rock. Mech. Eng. 2005, 24, 616–621. [Google Scholar]
  13. Yuan, X.; Liu, H.; Liu, J. Constitutive model of rock mass with non-persistent joints based on coupling macroscopic and mesoscopic damages. Rock Soil Mech. 2015, 36, 2804–2814. [Google Scholar]
  14. Lei, G.; Yang, C.; Wang, G.; Chen, S.W.; Wei, X.; Huo, L. The development law and mechanical causes of fault influenced zone. Chin. J. Rock Mech. Eng. 2016, 35, 231–241. [Google Scholar]
  15. Gerrard, C.M. Elastic models of rock masses having one, two and three sets of joints. Int. J. Rock Mech. Min. Sci. Geomech. Abstr. 1982, 19, 15–23. [Google Scholar] [CrossRef]
  16. Zhang, M.; Wang, F.; Yang, Q. Statistical damage constitutive model for rocks based on triaxial compression tests. Yantu Gongcheng Xuebao/Chin. J. Geotech. Eng. 2013, 35, 1965–1971. [Google Scholar]
  17. Lou, Z. Foundation of Damage Mechanics; Xi’an Jiaotong University Press: Xi’an, China, 1991. [Google Scholar]
  18. Isida, M. On the In-plate Bending of a Strip with a Central Elliptical Hole. Trans. Jpn. Soc. Mech. Eng. 1956, 22, 809–814. [Google Scholar] [CrossRef] [Green Version]
  19. Kemeny, J.M.; Cook, N.G.W. Micromechanics of Deformation in Rocks. Toughening Mech. Quasi-Brittle Mater. 1991, 155–188. Available online: https://link.springer.com/chapter/10.1007/978-94-011-3388-3_10 (accessed on 30 December 2021).
  20. Bruner, W.M. Comment on ‘Seismic velocities in dry and saturated cracked solids’ by Richard J. O’Connell and Bernard Budiansky. J. Geophys. Res. 1976, 81, 2573–2576. [Google Scholar] [CrossRef]
  21. Steif, P.S. Crack extension under compressive loading. Eng. Fract. Mech. 1984, 20, 463–473. [Google Scholar] [CrossRef]
  22. Horii, H.; Nemat-Nasser, S. Estimate of stress intensity factors for interacting cracks. Adv. Aerosp. Struct. Mater. Dyn. 1983, 6, 111–117. [Google Scholar]
  23. Maghous, S.; Buhan, P.; Dormieux, L. Non-linear global elastic behaviour of a periodically jointed material. Mech. Res. Commun. 2002, 29, 45–51. [Google Scholar] [CrossRef]
  24. Taylor, L.; Chen, E.; Kuszmaul, J. Microcrack-induced damage accumulation in brittle rock under dynamic loading. Comput. Methods Appl. Mech. Eng. 1986, 55, 301–320. [Google Scholar] [CrossRef]
  25. Swoboda, G.; Shen, X.; Rosas, L. Damage Model for Jointed Rock Mass and Its Application to Tunnelling. Comput. Geotech. 1998, 22, 183–203. [Google Scholar] [CrossRef] [Green Version]
Figure 1. Schematic Diagram of the Wing Crack Growth Model.
Crystals 12 00352 g001
Figure 2. Model of a Cracked Rock Mass.
Crystals 12 00352 g002
Figure 3. Mechanical Model of a Fractured Rock Mass.
Crystals 12 00352 g003
Figure 4. Comparison of the Stress–Strain Curves.
Crystals 12 00352 g004
Figure 5. Comparison Between the Calculation and Test Results.
Crystals 12 00352 g005
Figure 6. Curves of Peak Strength at Various Joint Inclination Angles. (a) α = 15°. (b) α = 45°. (c) α = 75°.
Crystals 12 00352 g006aCrystals 12 00352 g006b
Figure 7. Curves of the Deviation in Peak Strength at Various Joint Inclination Angles. (a) α = 15°. (b) α = 45°. (c) α = 75°.
Crystals 12 00352 g007aCrystals 12 00352 g007b
Table 1. Values of f ( c , b , d ) .
d/2cb/2c
52.51.671.25
1.0001.0171.0751.2081.565
51.0161.0201.0751.2081.565
11.2571.2571.2581.2921.580
0.252.0942.0942.0942.0942.107
Table 2. Parameters for Calculation [13].
Elastic Modulus
E/GPa
Friction FactorJoint Density
ρv/cm−3
Joint Depth
B/cm
Plate Width
w/cm
Cohesion
/MPa
Internal Friction Angle
4.2500.115152.530
Publisher’s Note: MDPI stays neutral with regard to jurisdictional claims in published maps and institutional affiliations.

