Article

Gypsum Seeding to Prevent Scaling

by
Taona Malvin Chagwedera
,
Jemitias Chivavava
and
Alison Emslie Lewis
*
Crystallization and Precipitation Research Unit, University of Cape Town, Rondebosch, Cape Town 7700, South Africa
*
Author to whom correspondence should be addressed.
Crystals 2022, 12(3), 342; https://doi.org/10.3390/cryst12030342
Submission received: 29 October 2021 / Revised: 23 February 2022 / Accepted: 24 February 2022 / Published: 2 March 2022
(This article belongs to the Special Issue Recent Progress in Industrial Crystallization)

Abstract

:
Eutectic freeze crystallization (EFC) is a novel separation technique that can be applied to treat brine solutions such as reverse osmosis retentates. These are often a mixture of different inorganic solutes. The treatment of calcium sulphate-rich brines using EFC often results in gypsum crystallization before any other species. This results in gypsum scaling on the cooled surfaces of the crystallizer, which is undesirable as it retards heat transfer rates and hence reduces the yield of other products. The aim of this study was to investigate and understand gypsum crystallization and gypsum scaling in the presence of gypsum seeds. Synthetic brine solutions were used in this research because they allowed an in-depth understanding of the gypsum bulk crystallization process and scaling tendency without the complexity of industrial brines. A cooled, U-shaped stainless-steel tube suspended in the saturated solution was employed as the scaling surface. This was because a tube-shaped surface enabled the introduction of a constant temperature cold surface in the saturated solution and most industrial EFC crystallizers are constructed from stainless steel. Gypsum seeding was effective in decreasing the mass of scale formed on the heat transfer surface. The most effective seed loading was 0.25 g/L, which reduced scale growth rate by 43%. Importantly, this seed loading is six times the theoretical critical seed loading. The seeding strategy also increased the gypsum crystallization kinetics in the bulk solution, which resulted in an increase in the mass of gypsum product. These findings are relevant for the operability and control of EFC processes, which suffer from scaling problems. By using an appropriate seeding strategy, two problems can be alleviated. Firstly, scaling on the heat transfer surface is minimised and, secondly, seeding increases the crystallization kinetics in the bulk solution, which is advantageous for product yield and recovery. It was also recommended that the use of silica as a seed material to prevent gypsum scaling should be investigated in future studies.

1. Introduction

South Africa is an industrialized semi-arid country [1] that produces numerous saline solutions. Reverse osmosis (RO) is an economical and energy efficient way of treating these saline solutions. However, a highly concentrated brine stream (reverse osmosis retentate) is produced in the process, which must be treated before disposal. The brine production in South Africa is forecast to reach a peak daily production of 17,000 m3/day in 2030 compared to approximately 3000 m3/day in 2010 [2,3].
Conventional brine disposal methods in South Africa include discharging the brine into lined evaporation ponds, the use of mechanical evaporators, and injecting the brine into deep wells [3]. The main limitation of these methods is their inability to fully separate the brine into reusable products. As an example, evaporative methods result in the formation of a sludge, which is a mixture of salts that needs another disposal method [4]. In contrast, Eutectic Freeze Crystallization (EFC) is theoretically able to fully separate the brine into its constituents, thus having an advantage compared to evaporative methods.
Eutectic Freeze Crystallization (EFC) is a novel brine treatment process for separating the salts from water by cooling the brine to sub-eutectic temperatures. This results in the co-crystallization of ice and salts. The ice naturally floats to the top, because it is less dense than the brine, and the salts sink, because they are denser than the brine, making the products separable [5]. The salts produced can be sold depending on their purity and production quantities.
The treatment of calcium sulphate-rich brines, such as reverse osmosis retentates, using EFC, results in the formation of calcium sulphate dihydrate (gypsum) scale deposits on the cooled surfaces of the crystallizers and surfaces of ancillary equipment. This is due to the sparingly soluble nature of gypsum in water. Gypsum scaling is undesirable because the scale forms an insulating layer on the crystallizer heat exchange surfaces, thus retarding heat transfer rates and thereby lowering yields. Gypsum scaling also results in frequent stoppages to clean the scale layer.
Scaling or crystallization fouling is a process in which a deposit forms on a surface. This is due to either bulk crystallization followed by adhesion onto the surface or heterogeneous nucleation and growth on the surface [6]. Gypsum scaling due to adhesion is common for membrane processes [7,8,9]. Gypsum scaling on hot surfaces is a result of heterogeneous nucleation and growth [10,11]. There is no literature available for gypsum scaling mechanisms under cooling or freeze crystallization conditions, as previous studies [11,12,13,14,15] were conducted under heating crystallization conditions due to the recurrence of gypsum scaling in the handling of geothermal brines for energy production and water distillation.
Heterogeneous nucleation is a form of primary nucleation induced by foreign surfaces such as dust and vessel walls [16]. The nucleation energy barrier for heterogenous nucleation is higher than that for secondary nucleation. Secondary nucleation occurs in the presence of crystals of the material to be crystallized [17,18]. Seeding with parent crystals of the solute in a supersaturated solution lowers the nucleation energy barrier for the dissolved solute particles to crystallize [18].
Seed quality, seed surface area, and seed loading influence the effectiveness of a seeding protocol. Characteristics such as surface smoothness of seed crystals and the structural integrity of the seed crystals constitute the quality of the seeds. Jagadesh and co-workers [19] observed that precipitated potassium seeds were the most effective seed type to precipitate potassium alum from its solution compared to ground and commercial potassium seeds. This may have been due to the precipitated seed crystals having fewer strains in their crystal lattice, which are usually induced through milling. The strains in the crystal lattice are known to dampen the ability of crystals to grow [20].
Seed loading is a measure of the mass of seeds per unit volume of the supersaturated solution. The critical seed loading refers to the minimum amount of seeds required to promote growth without prior nucleation [21]. Doki and co-workers [22] give two correlations that can be used to determine the critical seed loading for a system. Equation (1) is used to determine the critical seed loading ratio using the mean seed crystal size, Ls.
C R * = 2.17 × 10 6   L s 2
where C R * = critical seed loading ratio;
Ls = mean seed crystal size (µm).
Equation (2) is then used to determine the critical seed loading of the system, using the critical seed loading ratio determined above, as well as the theoretical yield and the volume of the solution.
C S * = C R * × W T V
where C S * = critical seed loading (g/L)
WT = theoretical yield of the salt (g)
V = volume of the solution (L)
It has been found that specific seed surface area plays an important role. Wang and co-workers [23] showed that 25 µm seed crystals were the most effective in enhancing bulk crystallization compared to larger crystals; 48 µm and 75 µm.
Higher seed loading introduces more surface area for nucleation and growth in the system and thus increases the crystallization rate of the target material. Liu and Nancollas [24] observed that the induction time for gypsum crystallization was shortened by increasing the seed loading from 0.42 to 1.89 g/L. However, the addition of an excessive number of seeds above the critical seed loading was observed to have no pronounced effect on gypsum crystallization kinetics [24].
Seeding has been employed in batch crystallization systems to control the crystal size distribution of the product crystals [19,21,22,25]. It is also an established method to enhance bulk crystallization of the target salt or ice in the EFC context [26,27,28]. Bulk crystallization of gypsum from a reverse osmosis brine was increased significantly when the brine was seeded with gypsum crystals [29].
A few studies on the use of seeding as a method to prevent scaling have been published. Adams and Papangelakis [30] observed that introducing gypsum seed crystals at 10 g/L in a laboratory scale neutralization reactor resulted in a 50% decrease in the mass of scale formed at 70 °C. Wang and co-workers [23] established that seeding was more effective in preventing scaling in brine transportation pipes compared to brine dilution. Gainey et al. [31] reported that seeding in evaporators resulted in the elimination of the calcium sulphate scale at the Rosewell laboratory and pilot plants. The actual details of the seed characteristics and seed loading were not published.
In this work, seeding was tested as a method to prevent scaling under cooling crystallization conditions. The aim of the study was to investigate and understand the interaction of gypsum crystallization in the bulk and gypsum scaling on the crystallizer surfaces in the presence of gypsum seeds.

2. Materials and Methods

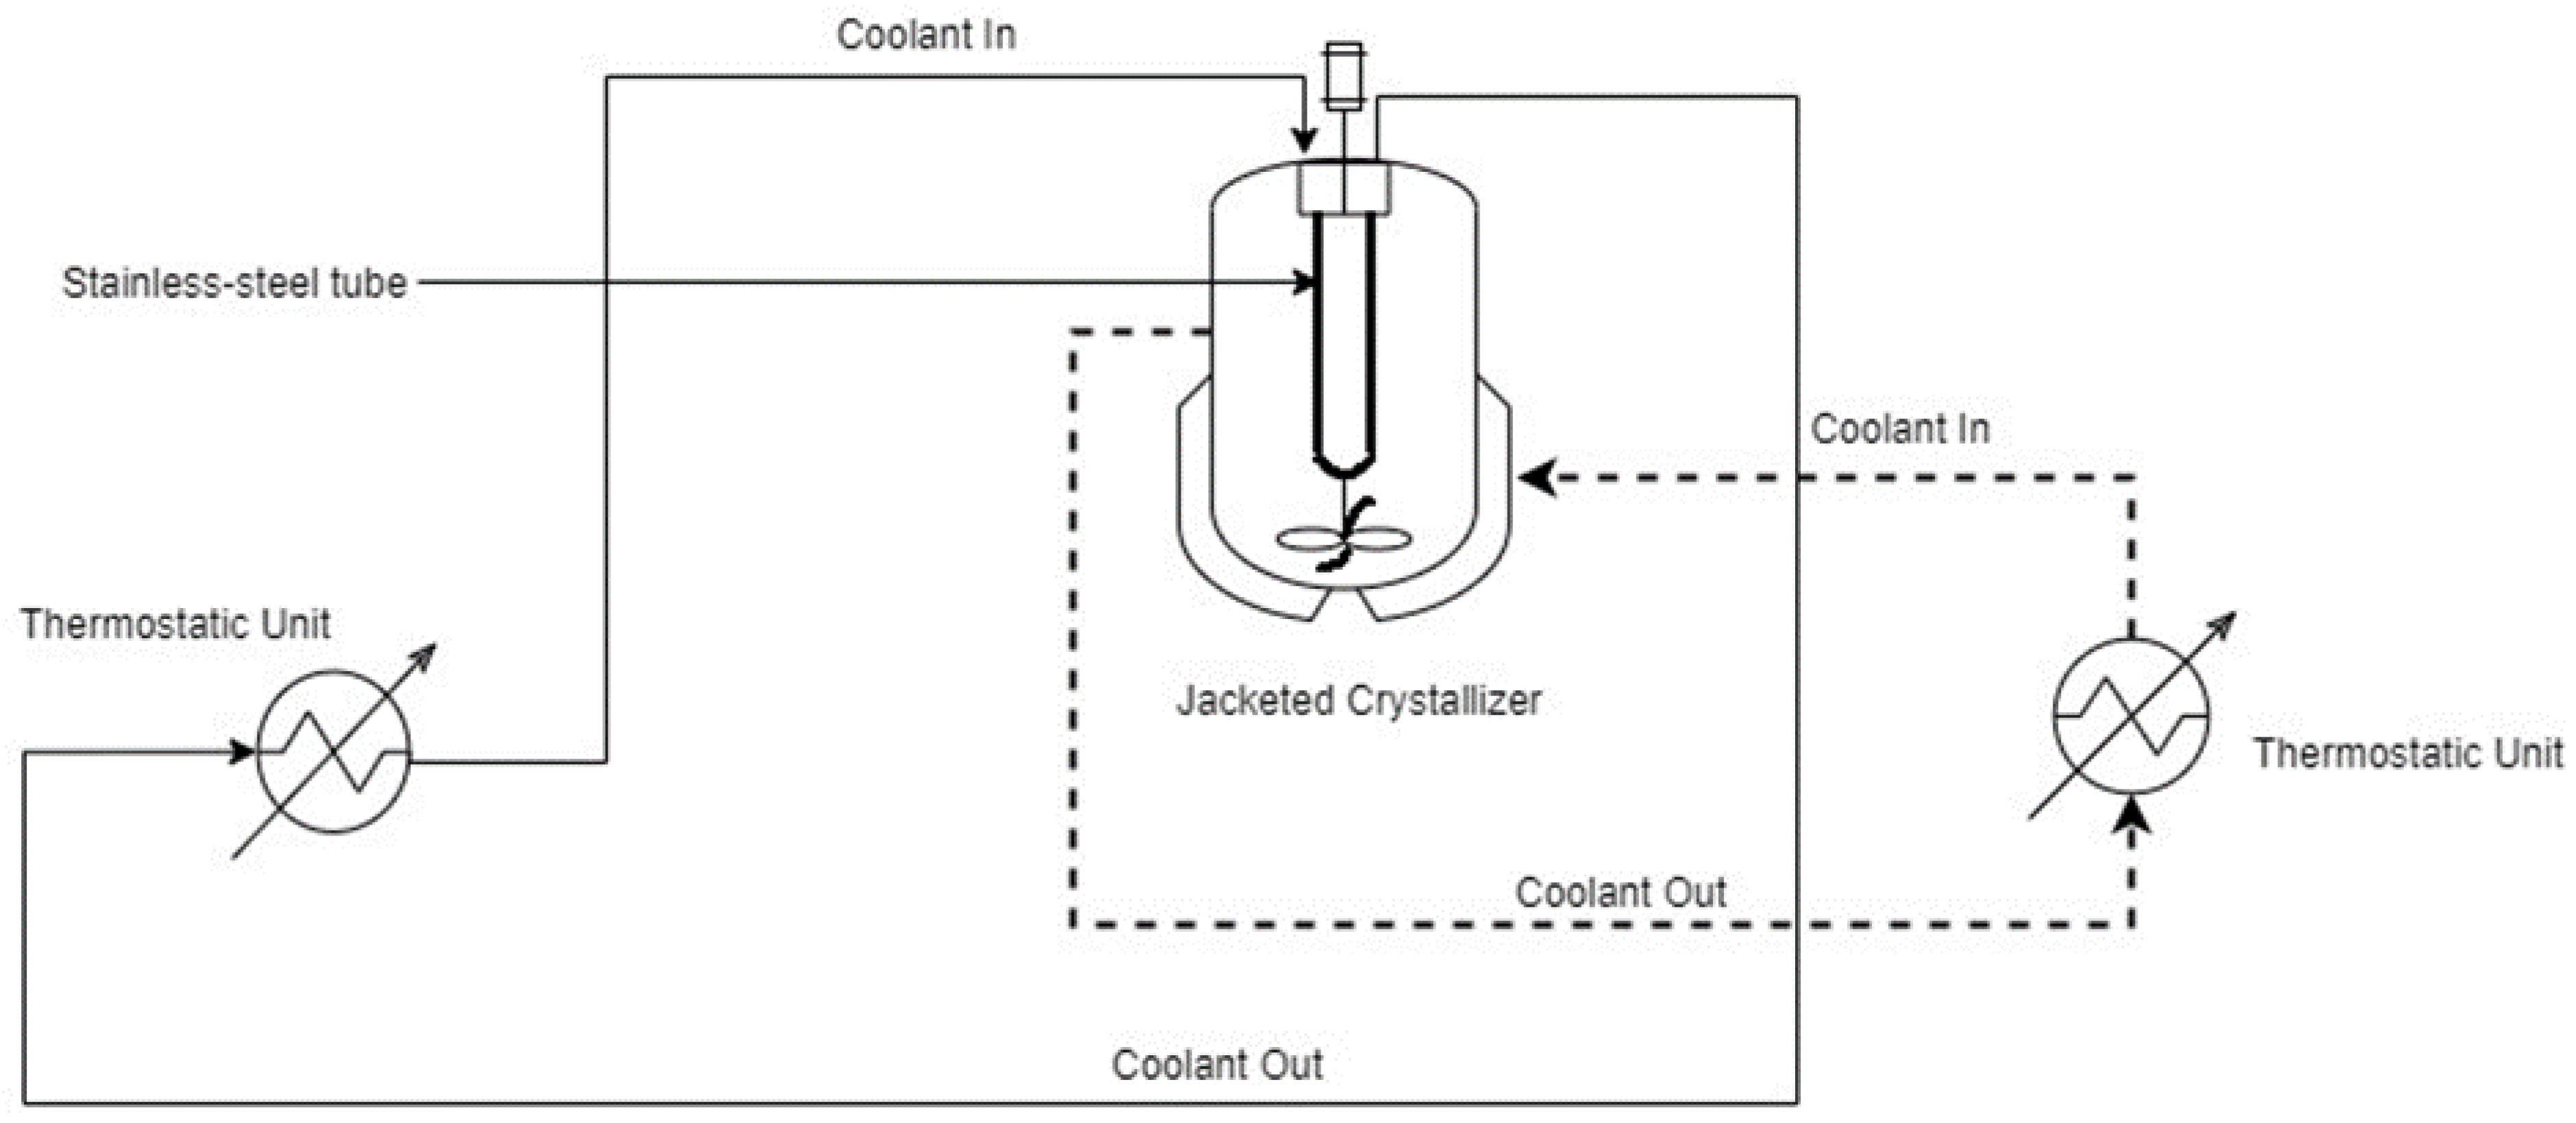
2.1. Experimental Equipment

The experiments were conducted using the apparatus shown in Figure 1. A jacketed and insulated glass crystallizer with a working volume of 1.25 L was used. A U-shaped stainless-steel tube, 290 mm long with an outer diameter of 3.18 mm, was suspended from the lid into the supersaturated solution. The tube was maintained at 0.0 °C by a Lauda Proline PP855 thermostatic unit (Lauda, Germany), which circulated polydimethylphenylsiloxane (Kryo 51™) through it to cool the solution from 22.3 to 3 °C.
The jacket of the crystallizer was maintained at 2.5 °C by a Lauda ECO RE1050G thermostatic unit (Lauda, Königshofen, Germany), which circulated polydimethylphenylsiloxane (Kryo 51™, Lauda, Königshofen, Germany) through it. The temperatures of the bulk solution, coolant into and out of the tube, and coolant into and out of the jacket of the crystallizer were measured to an accuracy of ±0.01°C, at 3-s intervals, using platinum resistance thermometers (Pt100) (Tempcontrol, Nootdorp, The Netherlands). The thermometers were connected to a CTR5000 precision bridge (ASL, Horsham, UK), which communicated with the computer via the ULog software (Ulog V6, ASL WIKA, Manchester, UK). A 4-blade pitched-blade impeller, attached to an overhead stirrer, was used to agitate the solution inside the crystallizer.

2.2. Feed Solution Preparation

The brine solution was prepared by reacting equal quantities of 0.11 M Ca(OH)2 (Merck, Modderfontein, South Africa) and 0.11 M H2SO4 (Sigma-Aldrich, Modderfontein, South Africa) in order to prepare a supersaturated calcium sulphate–water solution as illustrated by the reactions in Equation (3). The average concentration of the feed solution was 6.13 g/L CaSO4, as shown in Figure 7, resulting in an average starting supersaturation, S, of 7.71 that was calculated using the Debye–Huckel theory.
Ca(OH)2(aq) + H2SO4 = CaSO4(aq) + 2H2O
Feed solution preparation was not possible through dissolving reagent grade gypsum powder in de-ionised water because of the sparingly soluble nature of gypsum. The suspension formed from the reaction was filtered through a 0.22 µm cellulose acetate membrane (Kimix Chemical and Lab Supplies, Cape Town, South Africa) held by a 250 mL Merck Millipore glass holder connected to a vacuum pump at room temperature (23.5 °C). However, this filtration step does not completely eliminate nano fraction particles as determined by Oshchepkov and co-workers [32]. The filtrate was used as feed solution due to technological limitations to further remove nano-sized particles.

2.3. Seeds Preparation

Gypsum seeds were precipitated by mixing equal quantities of aqueous 0.6 M sodium sulphate solution (Merck, Modderfontein, South Africa) and 0.6 M calcium chloride solution (Merck, Modderfontein, South Africa) as illustrated by Equation (4). The resistivity of deionised water used to prepare both solutions was 10.9 MΩ-cm.
Na2SO4(aq) + CaCl2(aq) + 2H2O = CaSO4·2H2O(s) + 2NaCl(aq)
Calcium chloride solution was added one drop at a time to sodium sulphate solution at 70 °C to allow slow distribution of the supersaturation and precipitation of needle-type gypsum crystals. This method was adapted from Liu and Nancollas [24]. The suspension formed was filtered through a 0.22 µm cellulose acetate membrane held by a 250 mL Merck Millipore glass holder connected to a vacuum pump. Gypsum crystals were repeatedly washed with 0.50 L of deionised water to remove sodium chloride before they were dried.

2.4. Experimental Procedure

Briefly, 1.25 L of the feed solution was measured and transferred into the crystallizer. The overhead stirrer was set to 450 rpm, which is equivalent to a Reynolds number, (Re) of 4.21 × 10⁵, and the thermostatic units were switched on to start the experiment. Seed crystals with a mean size of 58 µm were added into the crystallizer at the start of the experiments in which seeding was employed.
At the end of the experiment, the thermostatic units and the overhead stirrer were switched off. The tube was removed from the lid and allowed to dry before it was weighed. The suspension in the crystallizer was filtered using the same apparatus as above and the filtrate was analysed for sulphate ion concentration.

2.5. Measurement/Analytical Techniques

The sulphate concentration for the feed solution and spent solution was analysed using the turbidimetric method. In this method, the sulphate ion is converted to barium sulphate through addition of barium chloride dihydrate (Merck, Modderfontein, South Africa) and the turbidity of the suspension is measured. A photometer (Merck Spectroquant Nova 60, Merck, Modderfontein, South Africa) set at a wavelength of 410 nm was used.
The mass of the scale was determined arithmetically from the difference between the mass of the scaled tube and the mass of the clean tube, which were both measured using a digital scale (Mettler™ Toledo ML204, Greinfensee, Switzerland) with an accuracy of ±0.0003 g.
Crystal size and morphology of the scaled tube were analysed using a Scanning Electron Microscope (Tescan™ MIRA3 Rise, TESCAN, Brno-Kohoutovice, Czech Republic).

3. Results and Discussion
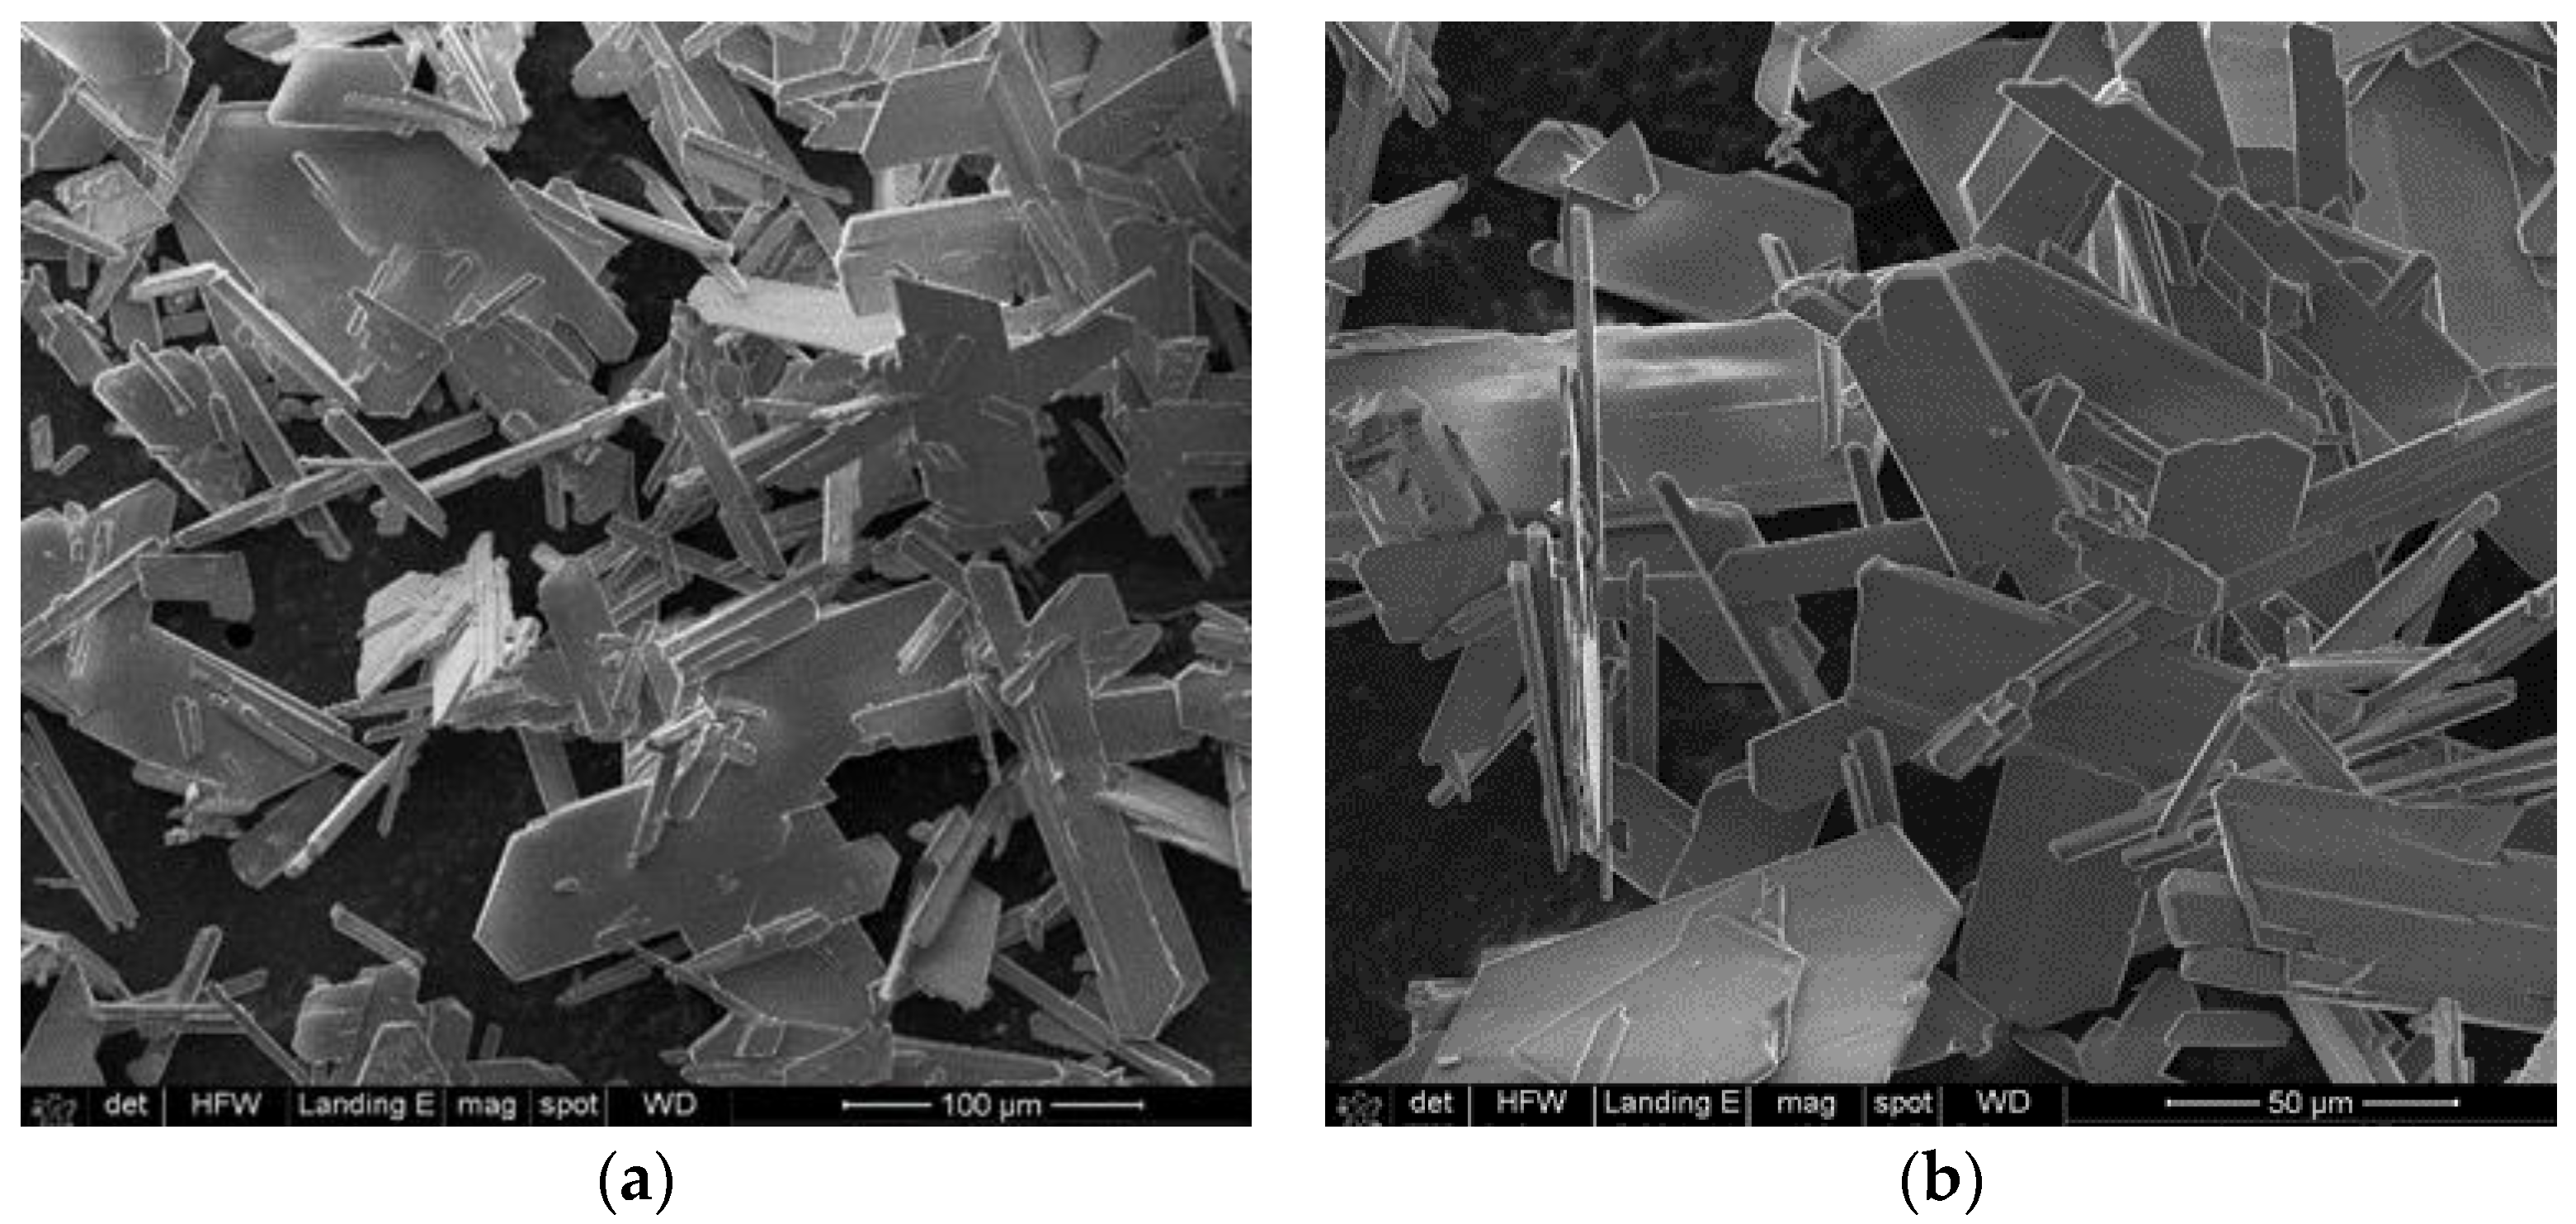
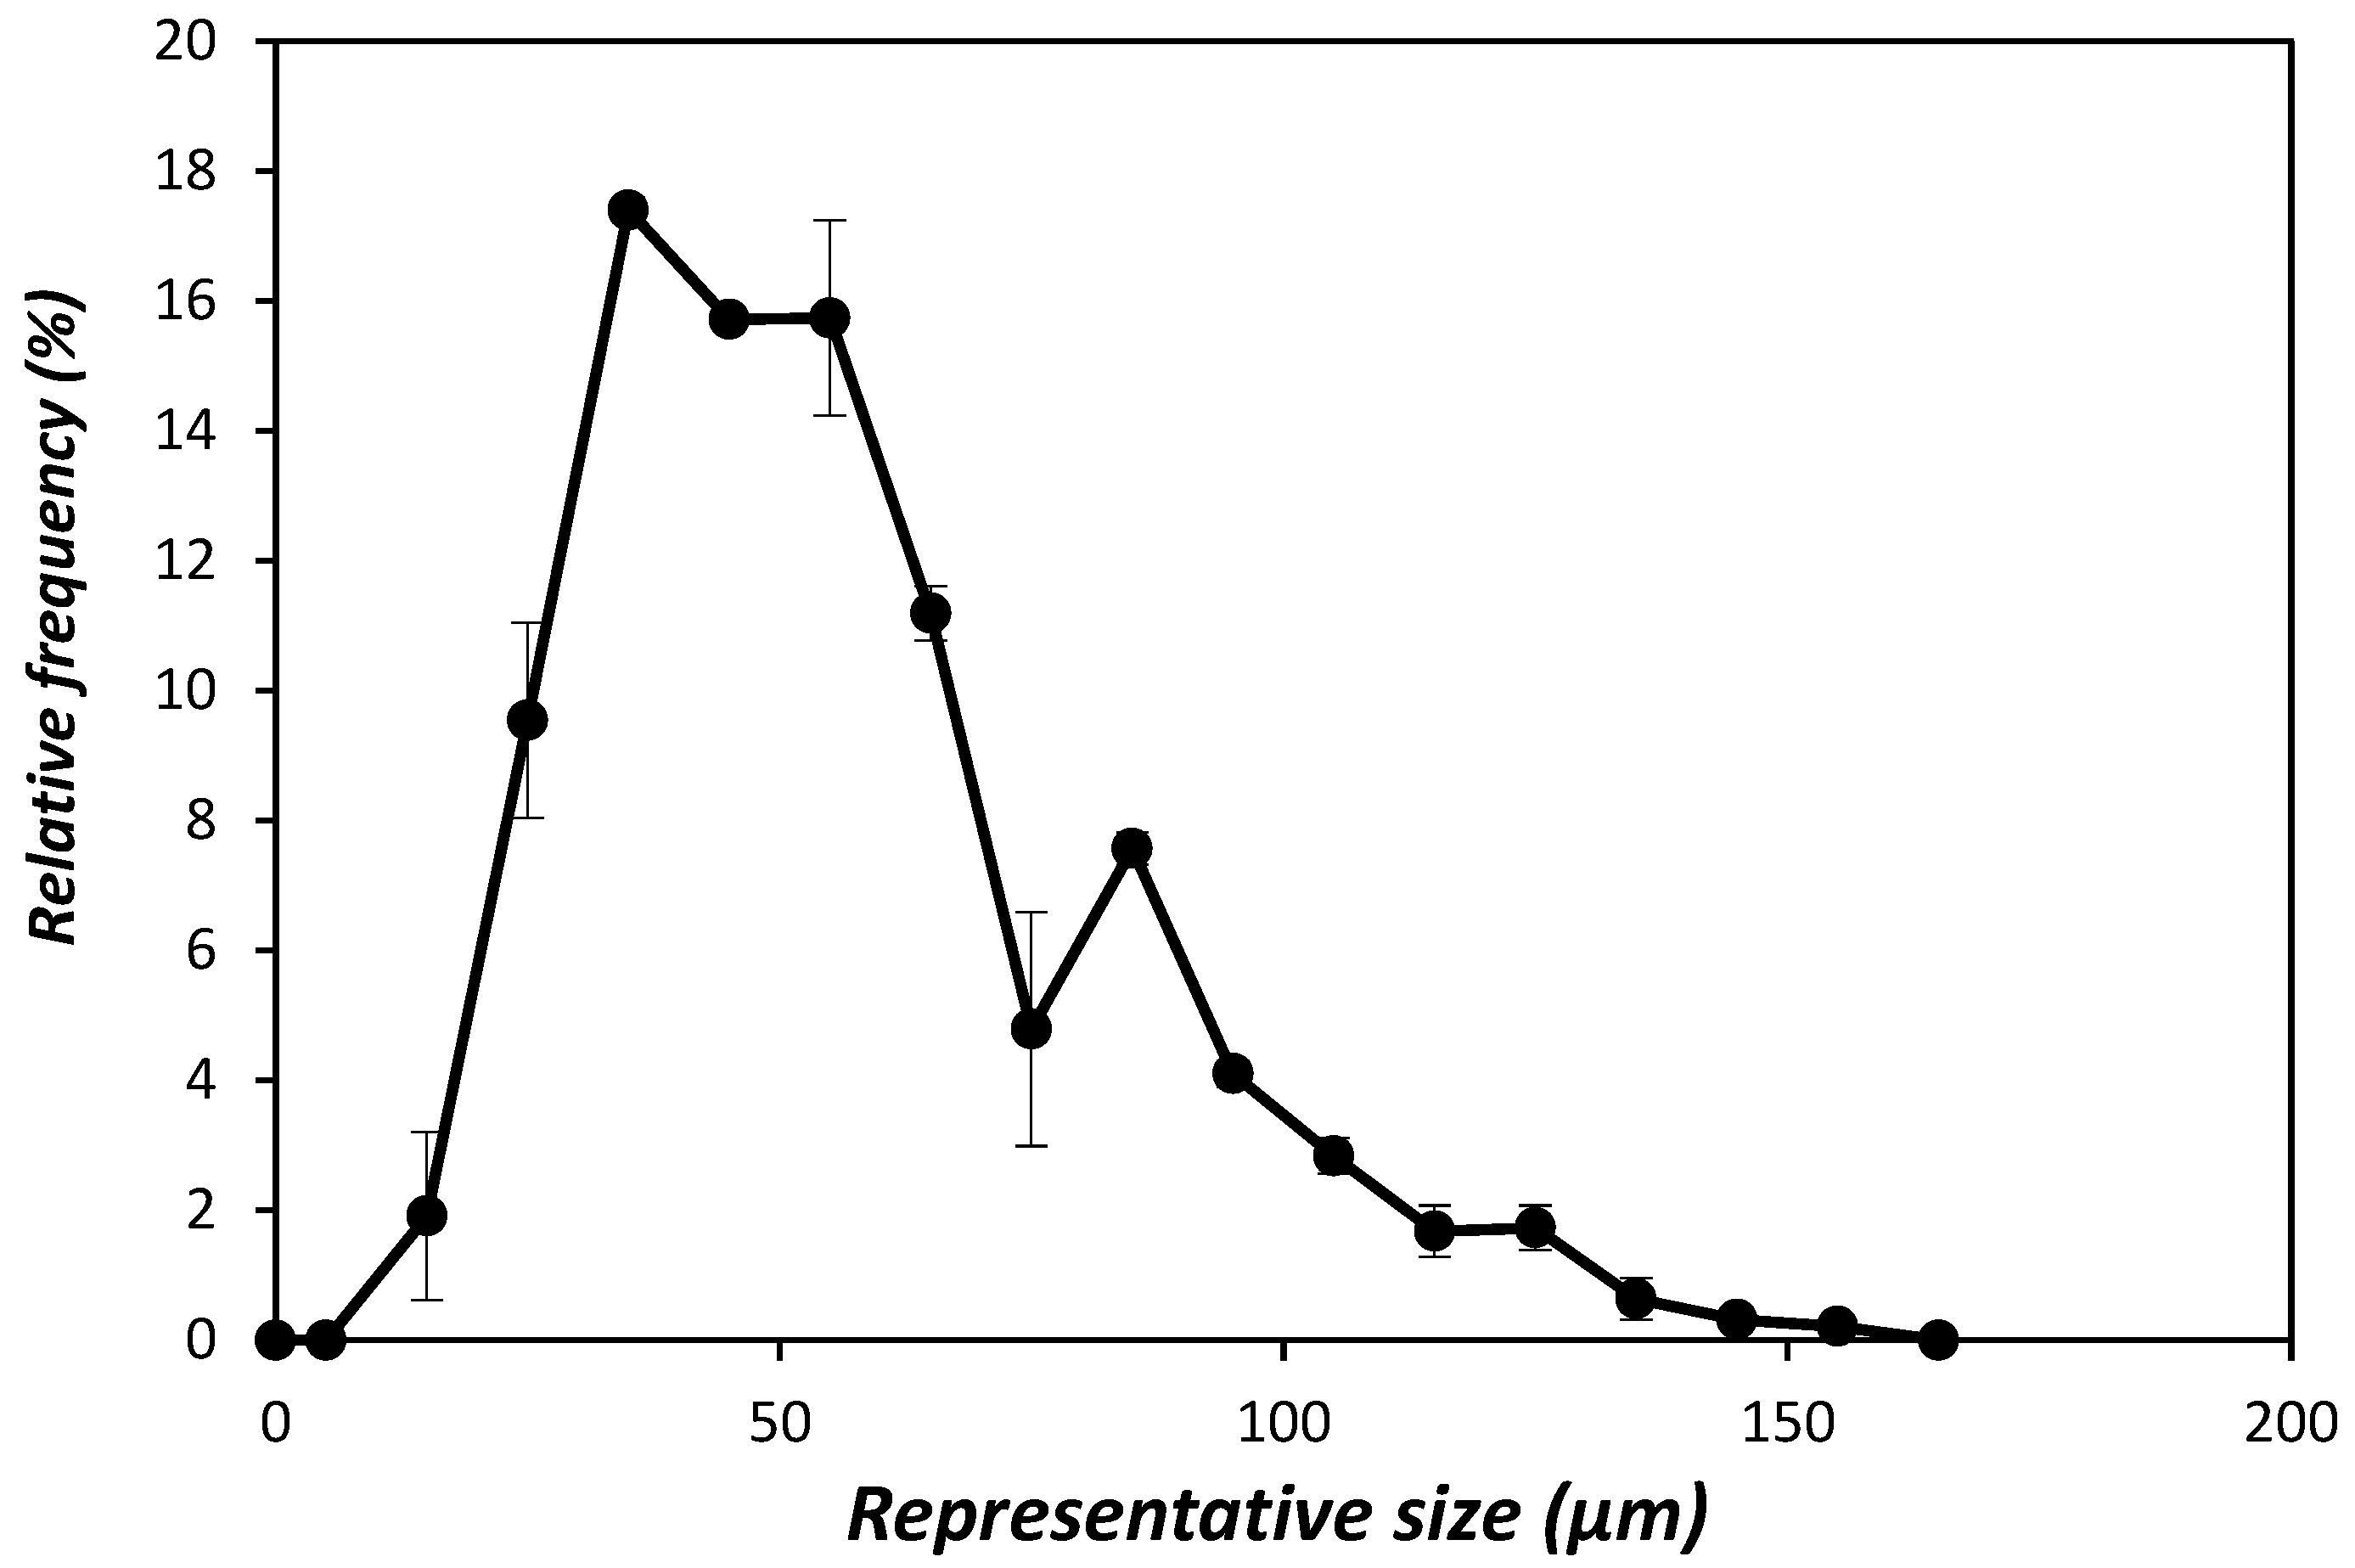
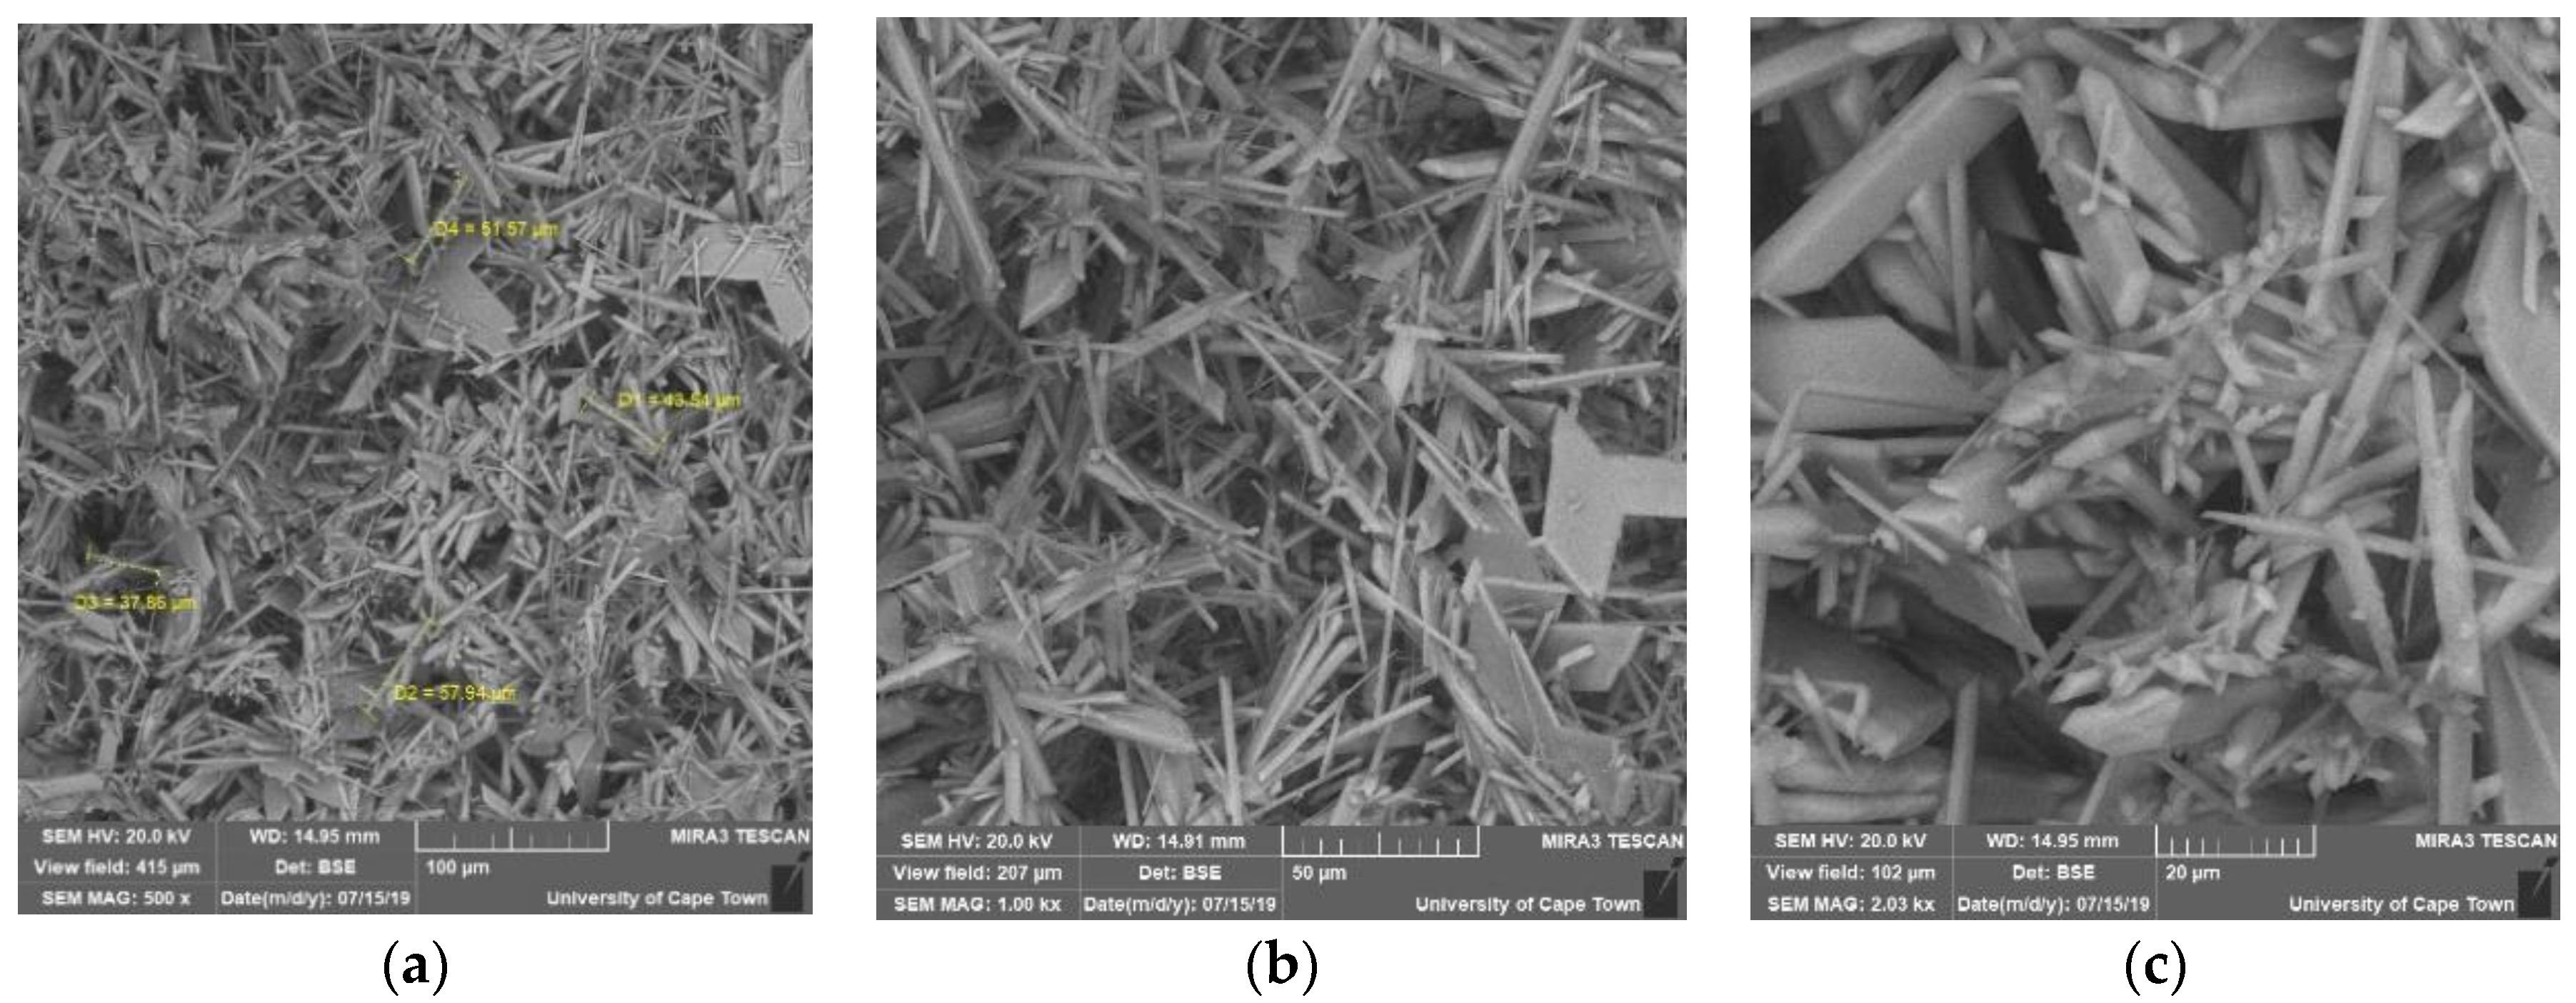
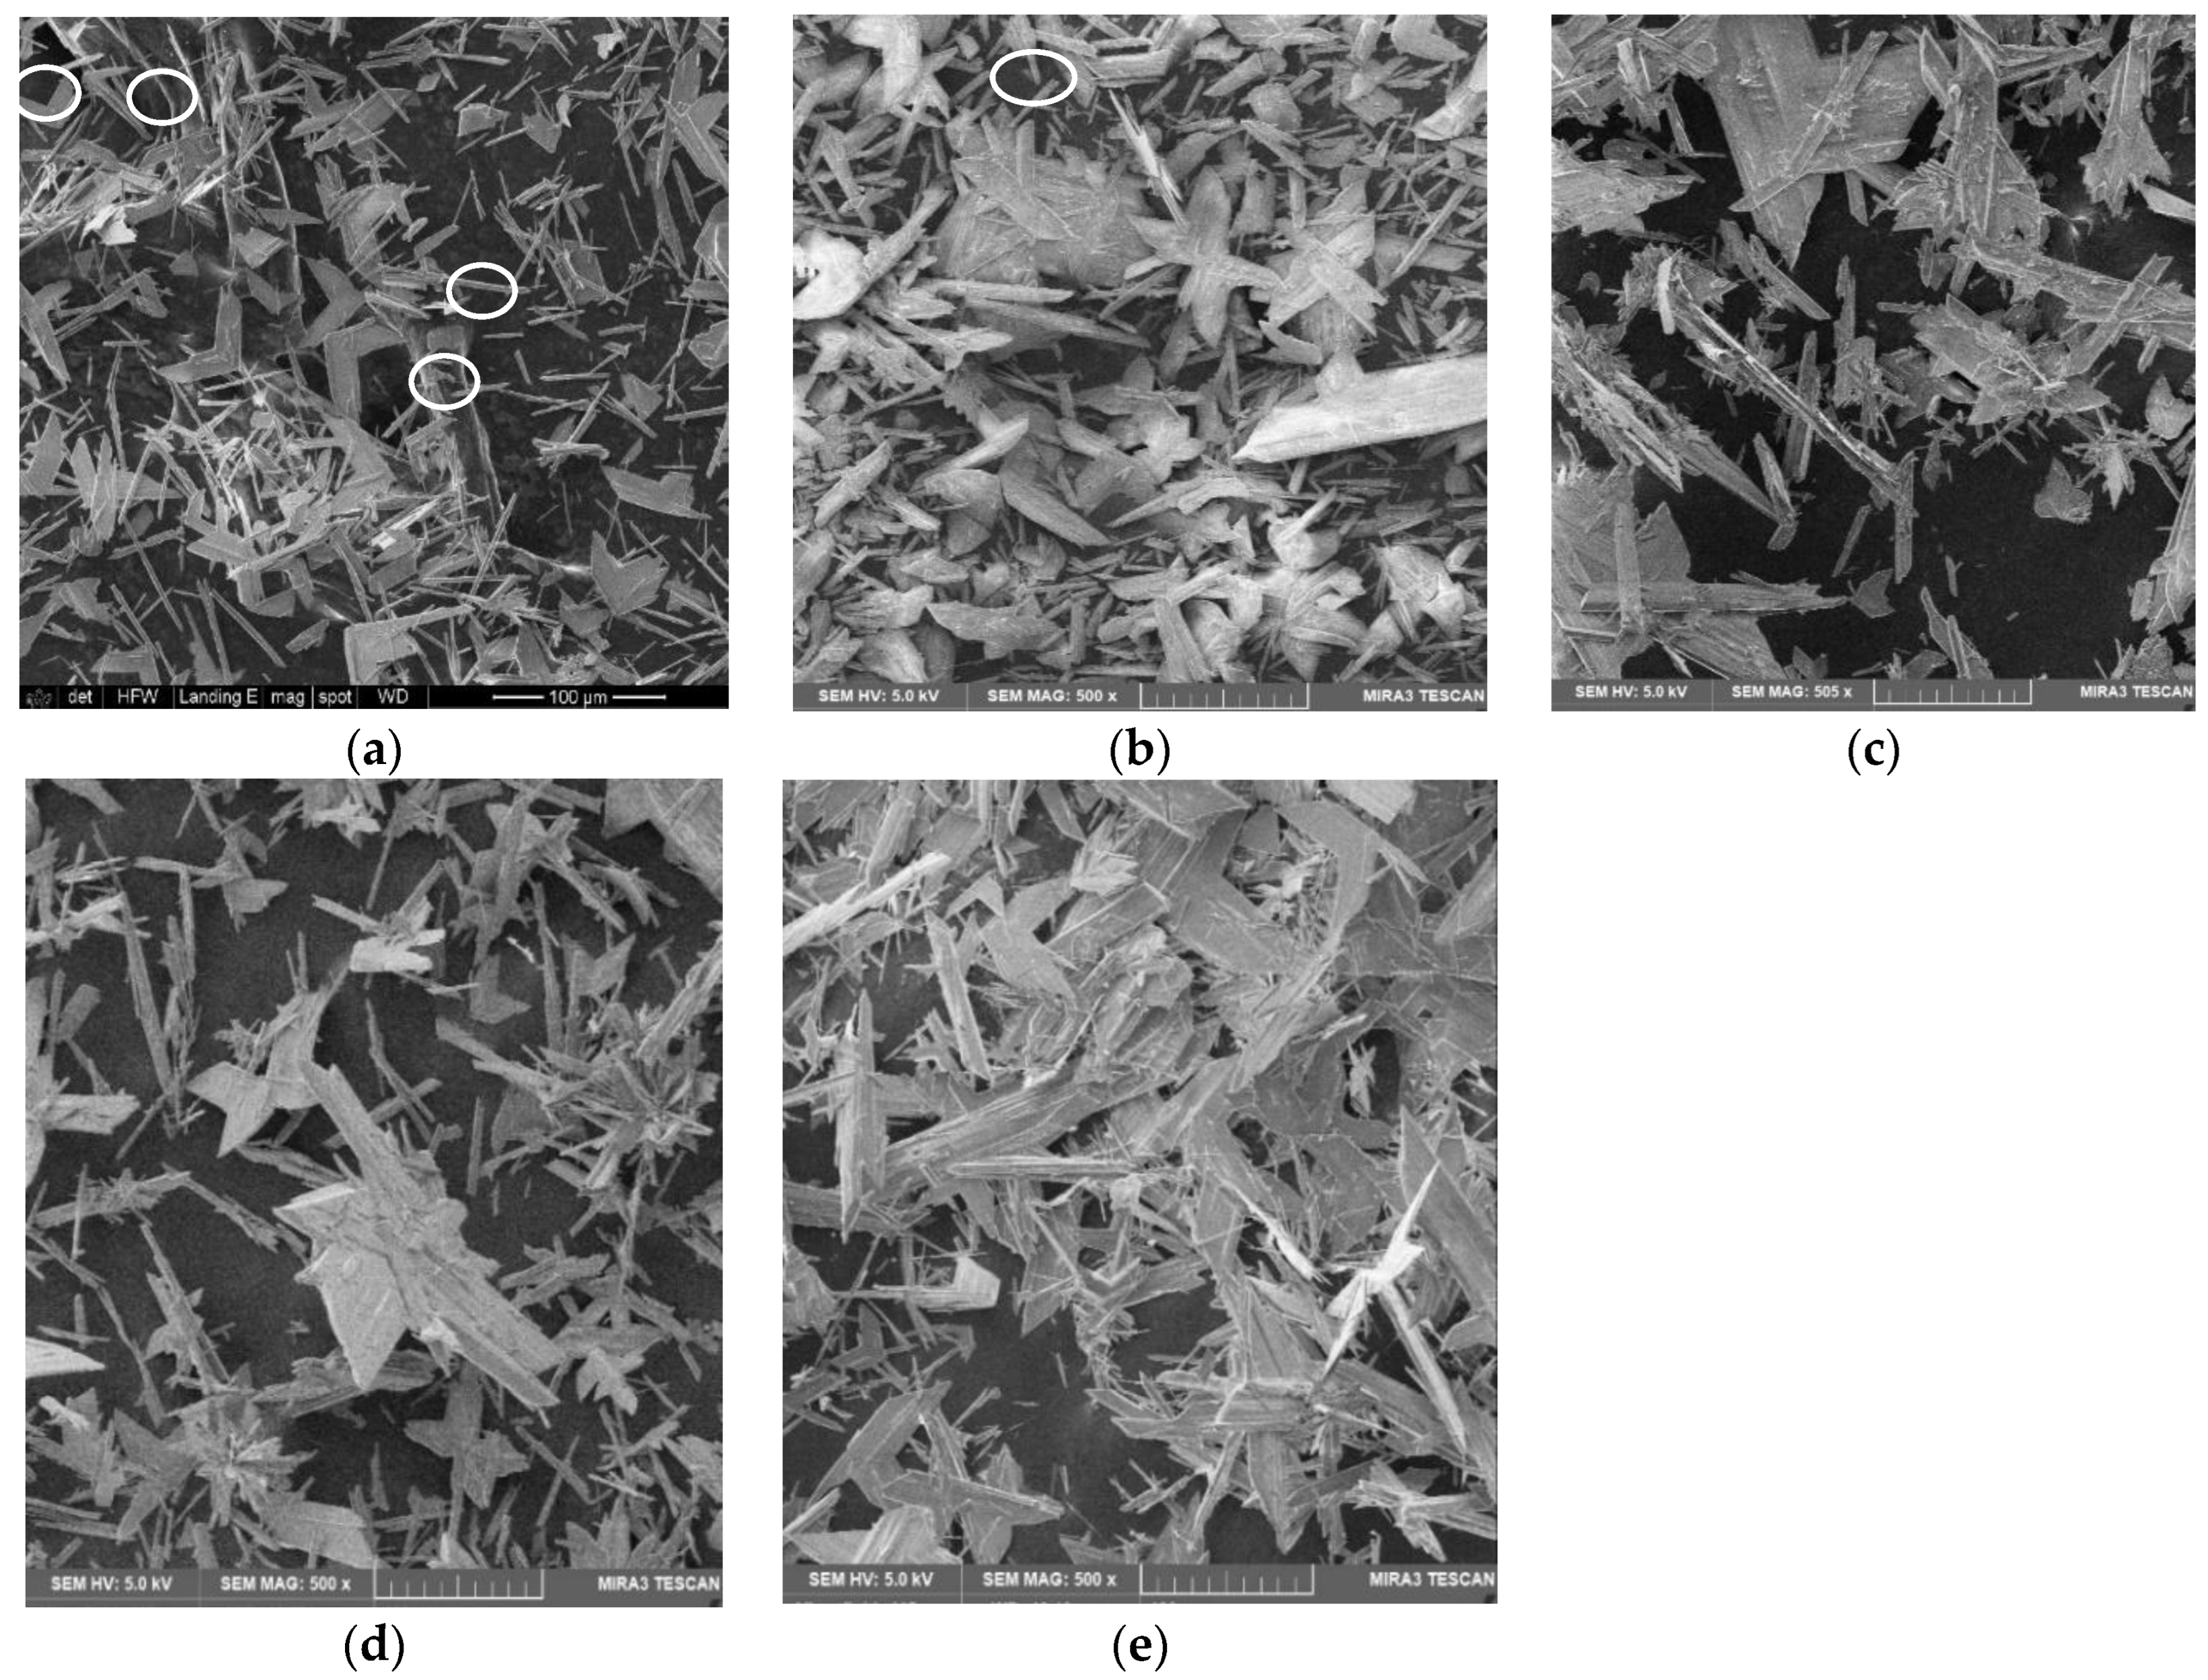
3.1. Seed Crystals

Figure 2 shows SEM micrographs of the seeds. The seed crystals were a mixture of the needle-type habit and prisms.
The crystal size distribution of the seed crystals is presented in Figure 3. An average of three samples was taken and most of the seed crystals (61%) were below 55 µm in size. The mean size of the seed crystals was 57 µm with a modal size of 26 µm.

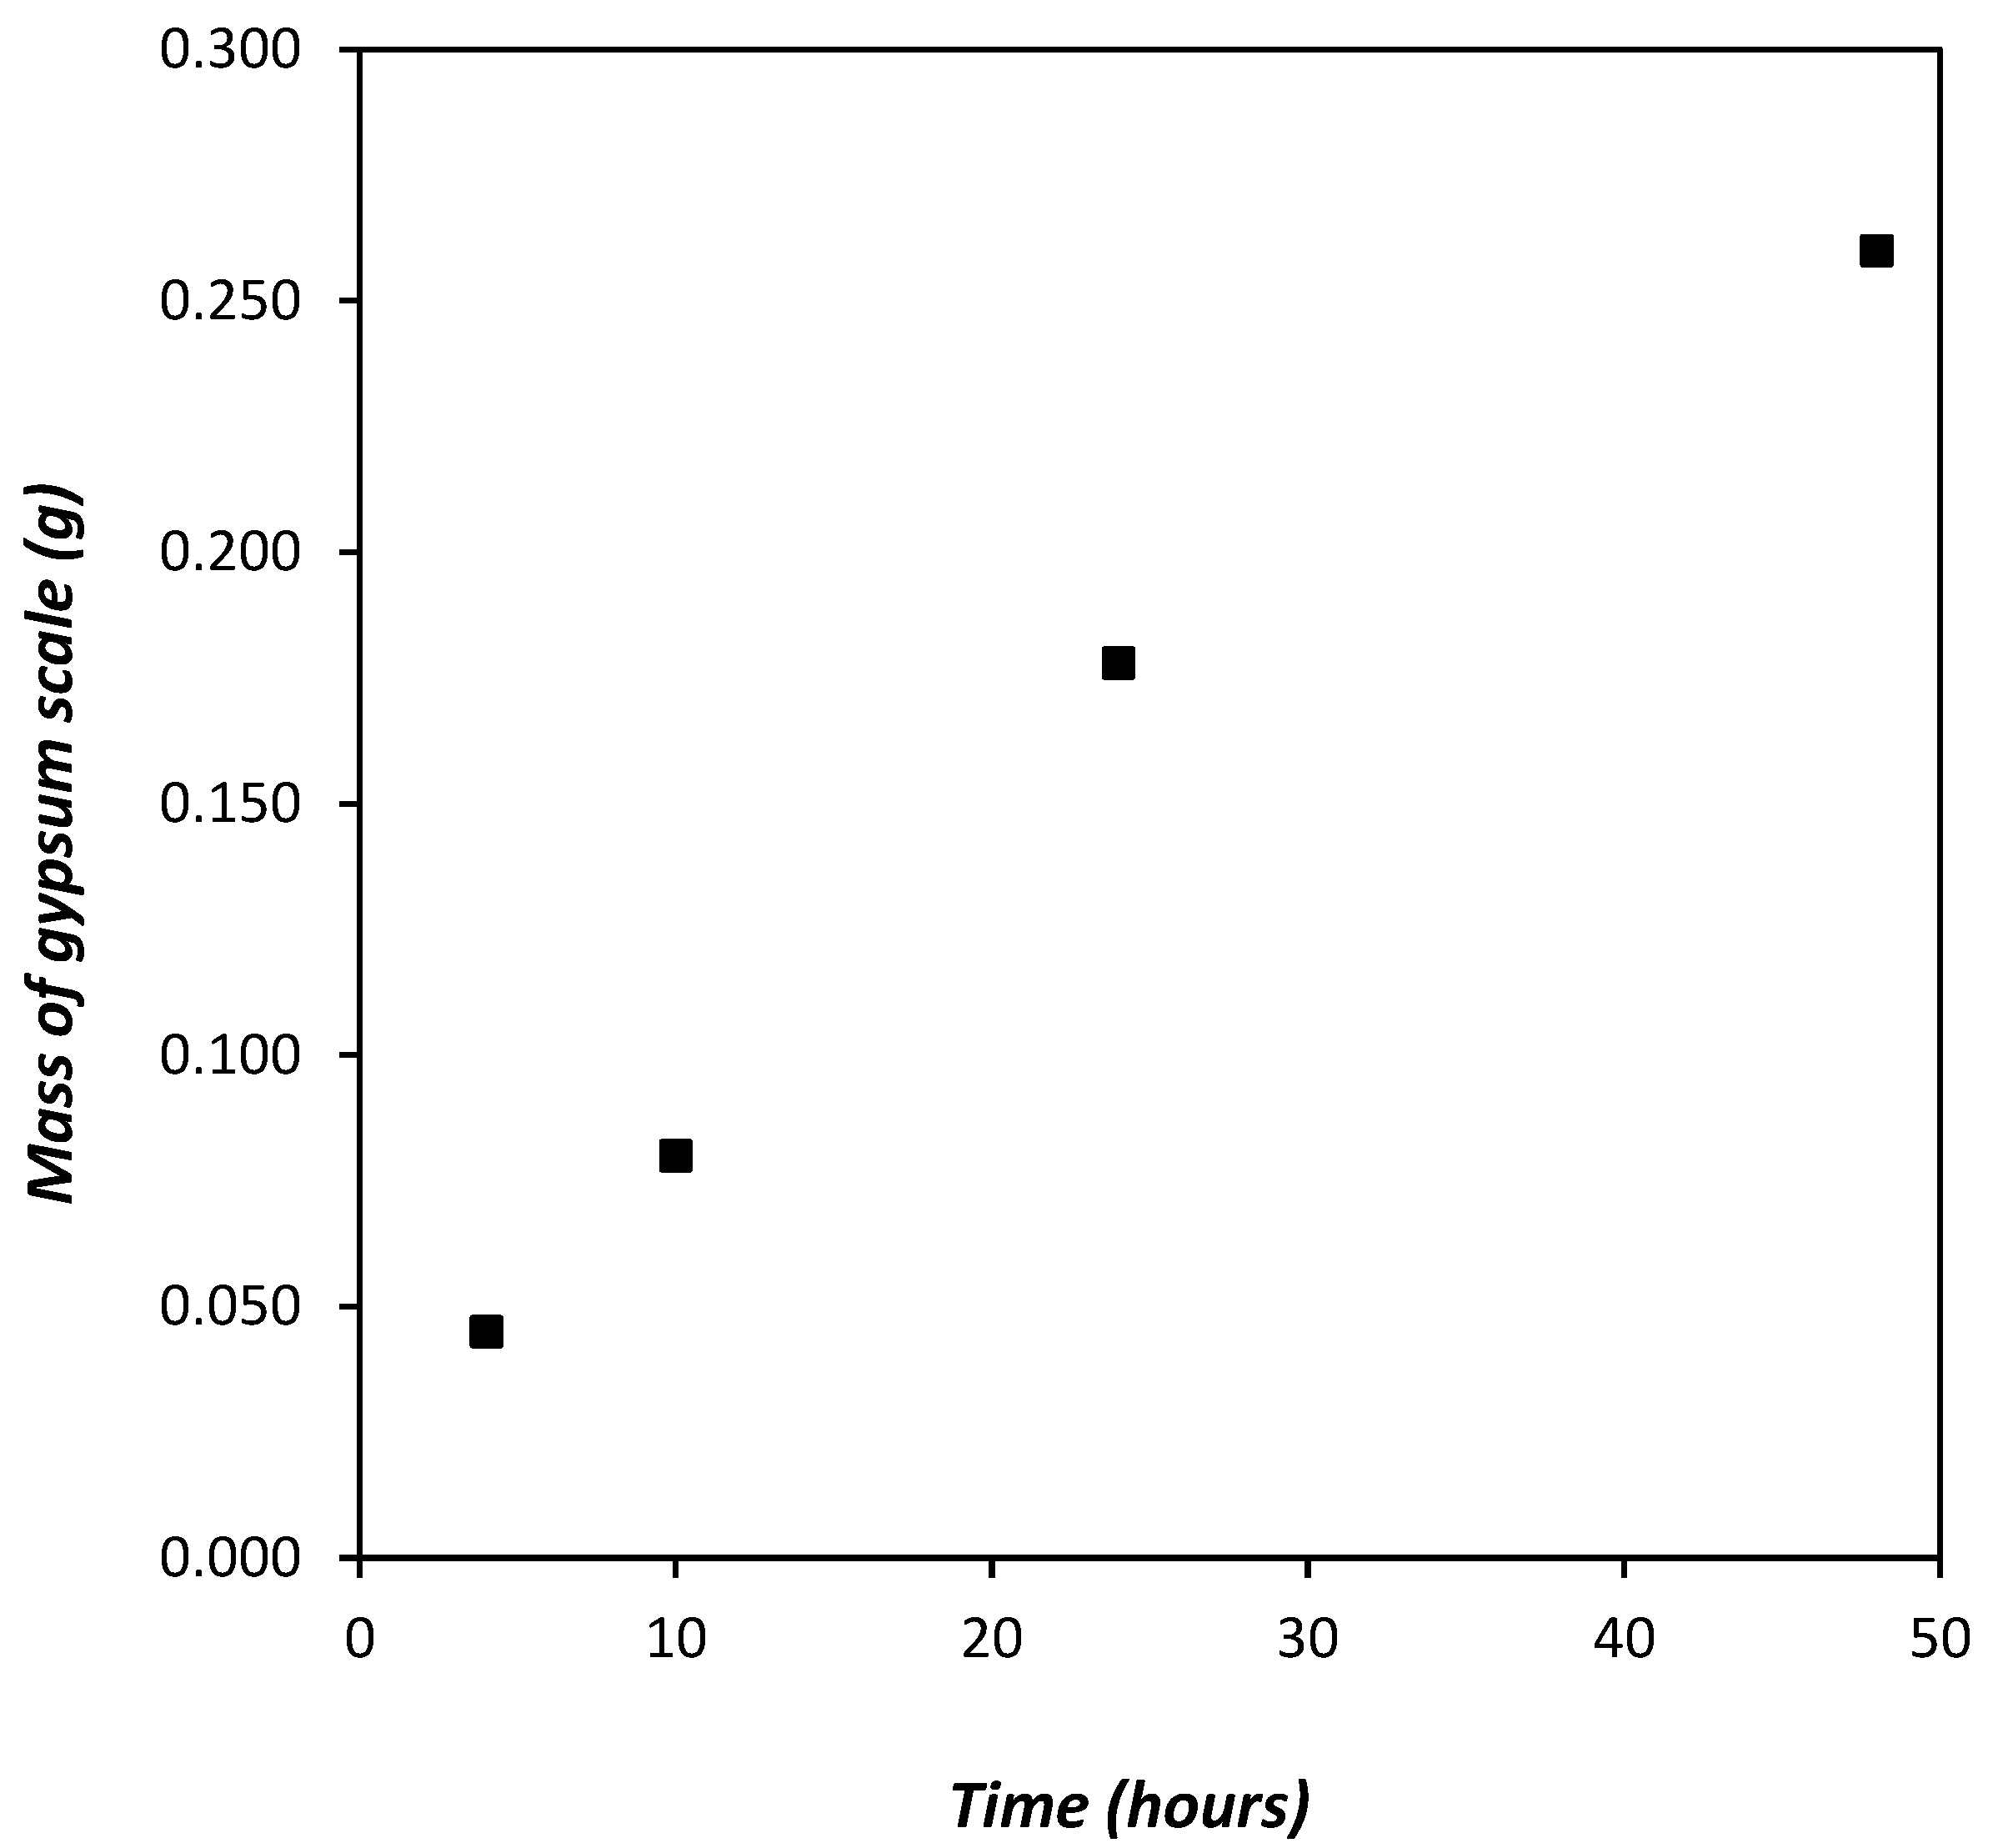
3.2. Preliminary Experiments

It was established that the required experiment run time was 4 h for a measurable mass of gypsum scale to be deposited on the stainless-steel tube. The mass of gypsum scale recorded was 0.045 g. The bulk solution temperature was 3 °C at the time of stopping the experiment. There was negligible mass of gypsum scale on the inner wall of the crystallizer. A temperature of 3 °C was maintained in all experiments as this allowed the study of gypsum scaling, testing the effectiveness of gypsum seeding, without the complexity caused by ice formation.
Figure 4 shows the micrographs of the scaled tube after running the experiment. The lighter phase represents the stainless-steel tube surface and the darker phase represents gypsum crystals. There was also a very thin layer of finely grained crystals, which could have been due to the adhesion of gypsum crystals when the tube was left to dry.
The micrographs presented in Figure 4 show that the tube was not fully covered with scale after running the experiment for 4 h. Needle-type crystals grew normal to the plane of the tube into the bulk solution; although, the expectation was that they would grow along the cold tube surface, which provided high local supersaturation conditions. This was due to the difference in the crystallographic structure of stainless steel and gypsum, which inhibited the growth of crystals along the plane of the tube. It is also possible that the integration of gypsum lattice units into the scale crystals that crystallized first on the tube could have caused the gypsum crystals to grow into the bulk solution. There were tiny crystals that were lying parallel to the tube, possibly due to the adhesion of crystals precipitated in the bulk solution or shearing of crystals by fluid motion. The fluid motion around the tube was turbulent (Re = 4.21 × 10⁵).
The experiment duration was increased further by 6 h to develop an understanding of how the scale crystals grew. The mass of scale deposited on the tube was 0.080 g and the final temperature of the solution was 3 °C. The longer experiment time did not change the predominant habit of crystals, with needle-type crystals of varying lengths constituting the scale layer. Growth of the crystals was also into the bulk solution, which resulted in small ‘islands’ of the tube that were not fully covered with gypsum scale.
An increase in the duration of the experiment to 24 h resulted in an increase in the mass of gypsum scale that deposited on the stainless-steel tube. However, the increase was not linear as was the case when the experiment duration was further increased to 48 h from 24 h. This was due to the decrease in the supersaturation of the system with time. Choi and co-workers [33] asserted that gypsum crystallization rates decrease in batch tests as the calcium ion concentration decreases. The mass of gypsum scale deposited on the tube after 24 h and 48 h was 0.179 g and 0.260 g, respectively. Figure 5 shows the increase in the mass of scale deposited on the tube as the run time was increased.
Figure 6 shows the micrographs of the scaled tube after 48 h. In the micrographs, the darker phase represents the stainless-steel tube surface, and the lighter phase represents gypsum crystals.
Figure 6a shows that the scale layer was predominantly composed of needle-type crystals varying in length between 40 and 100 µm. Most of the smaller sized crystals were on the top surface of the scale layer while the larger sized crystals were underneath. This was possibly because the underlying crystals crystallized first and had more time to grow and, hence, became larger than the top surface crystals.
Figure 6c shows attachment of smaller sized crystals to the larger crystals. This could have been due to the underlying crystals serving as growth sites for subsequent scale crystals. There was crystal twinning during scale layer growth as depicted in Figure 6a,b (white circles). The twinning may have resulted from the combination of moderate supersaturation conditions at the start of the experiment, prolonged growth time, and close contact with the cold tube surface where heat transfer was the highest.
Analysis of the micrographs of the scaled tube acquired after each preliminary experiment enabled the formulation of a possible mechanism of gypsum scaling on the tube, even though it was not conclusive. Gypsum scale layer was predominantly composed of needle-type crystals showing that the stainless-steel tube did not alter its habit under moderate supersaturation conditions present in the system. This is similar to what was observed by Amjad [10], although on a brass tube. The phenomenon would support the notion of gypsum scaling through adhesion. However, the plausible reasons for gypsum scaling through adhesion were outweighed by those for heterogeneous nucleation and supported by the micrographs.
It was proposed that gypsum scaling on the stainless-steel tube most likely proceeded via heterogeneous nucleation followed by growth. The growth of the scale layer crystals was into the bulk solution. Gypsum scaling was found to begin between 0 and 30 min. Based on this, it was decided that gypsum seeds would be added at the beginning of the experiment.

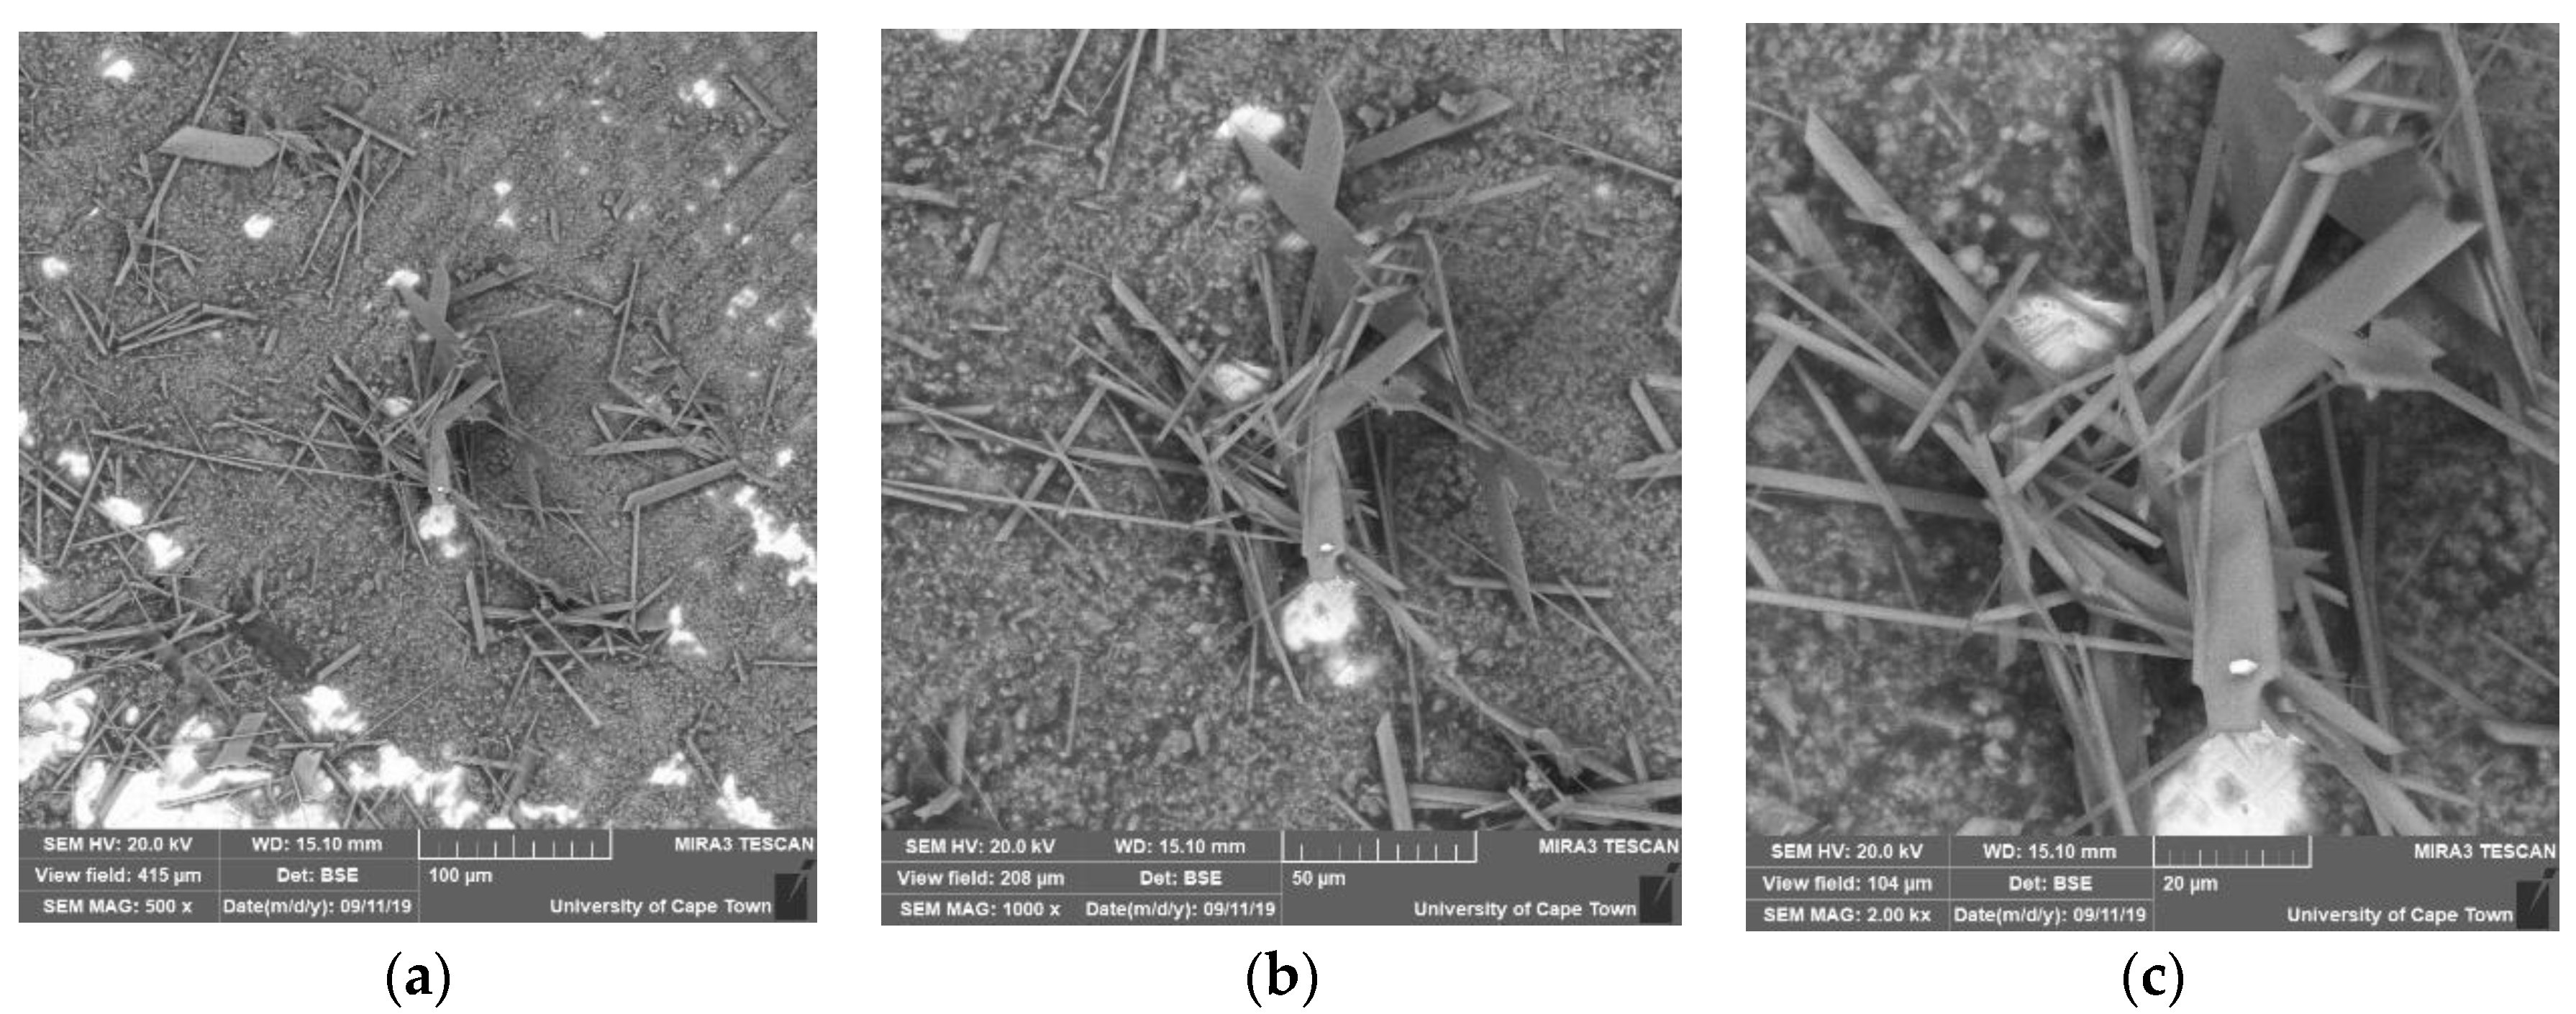
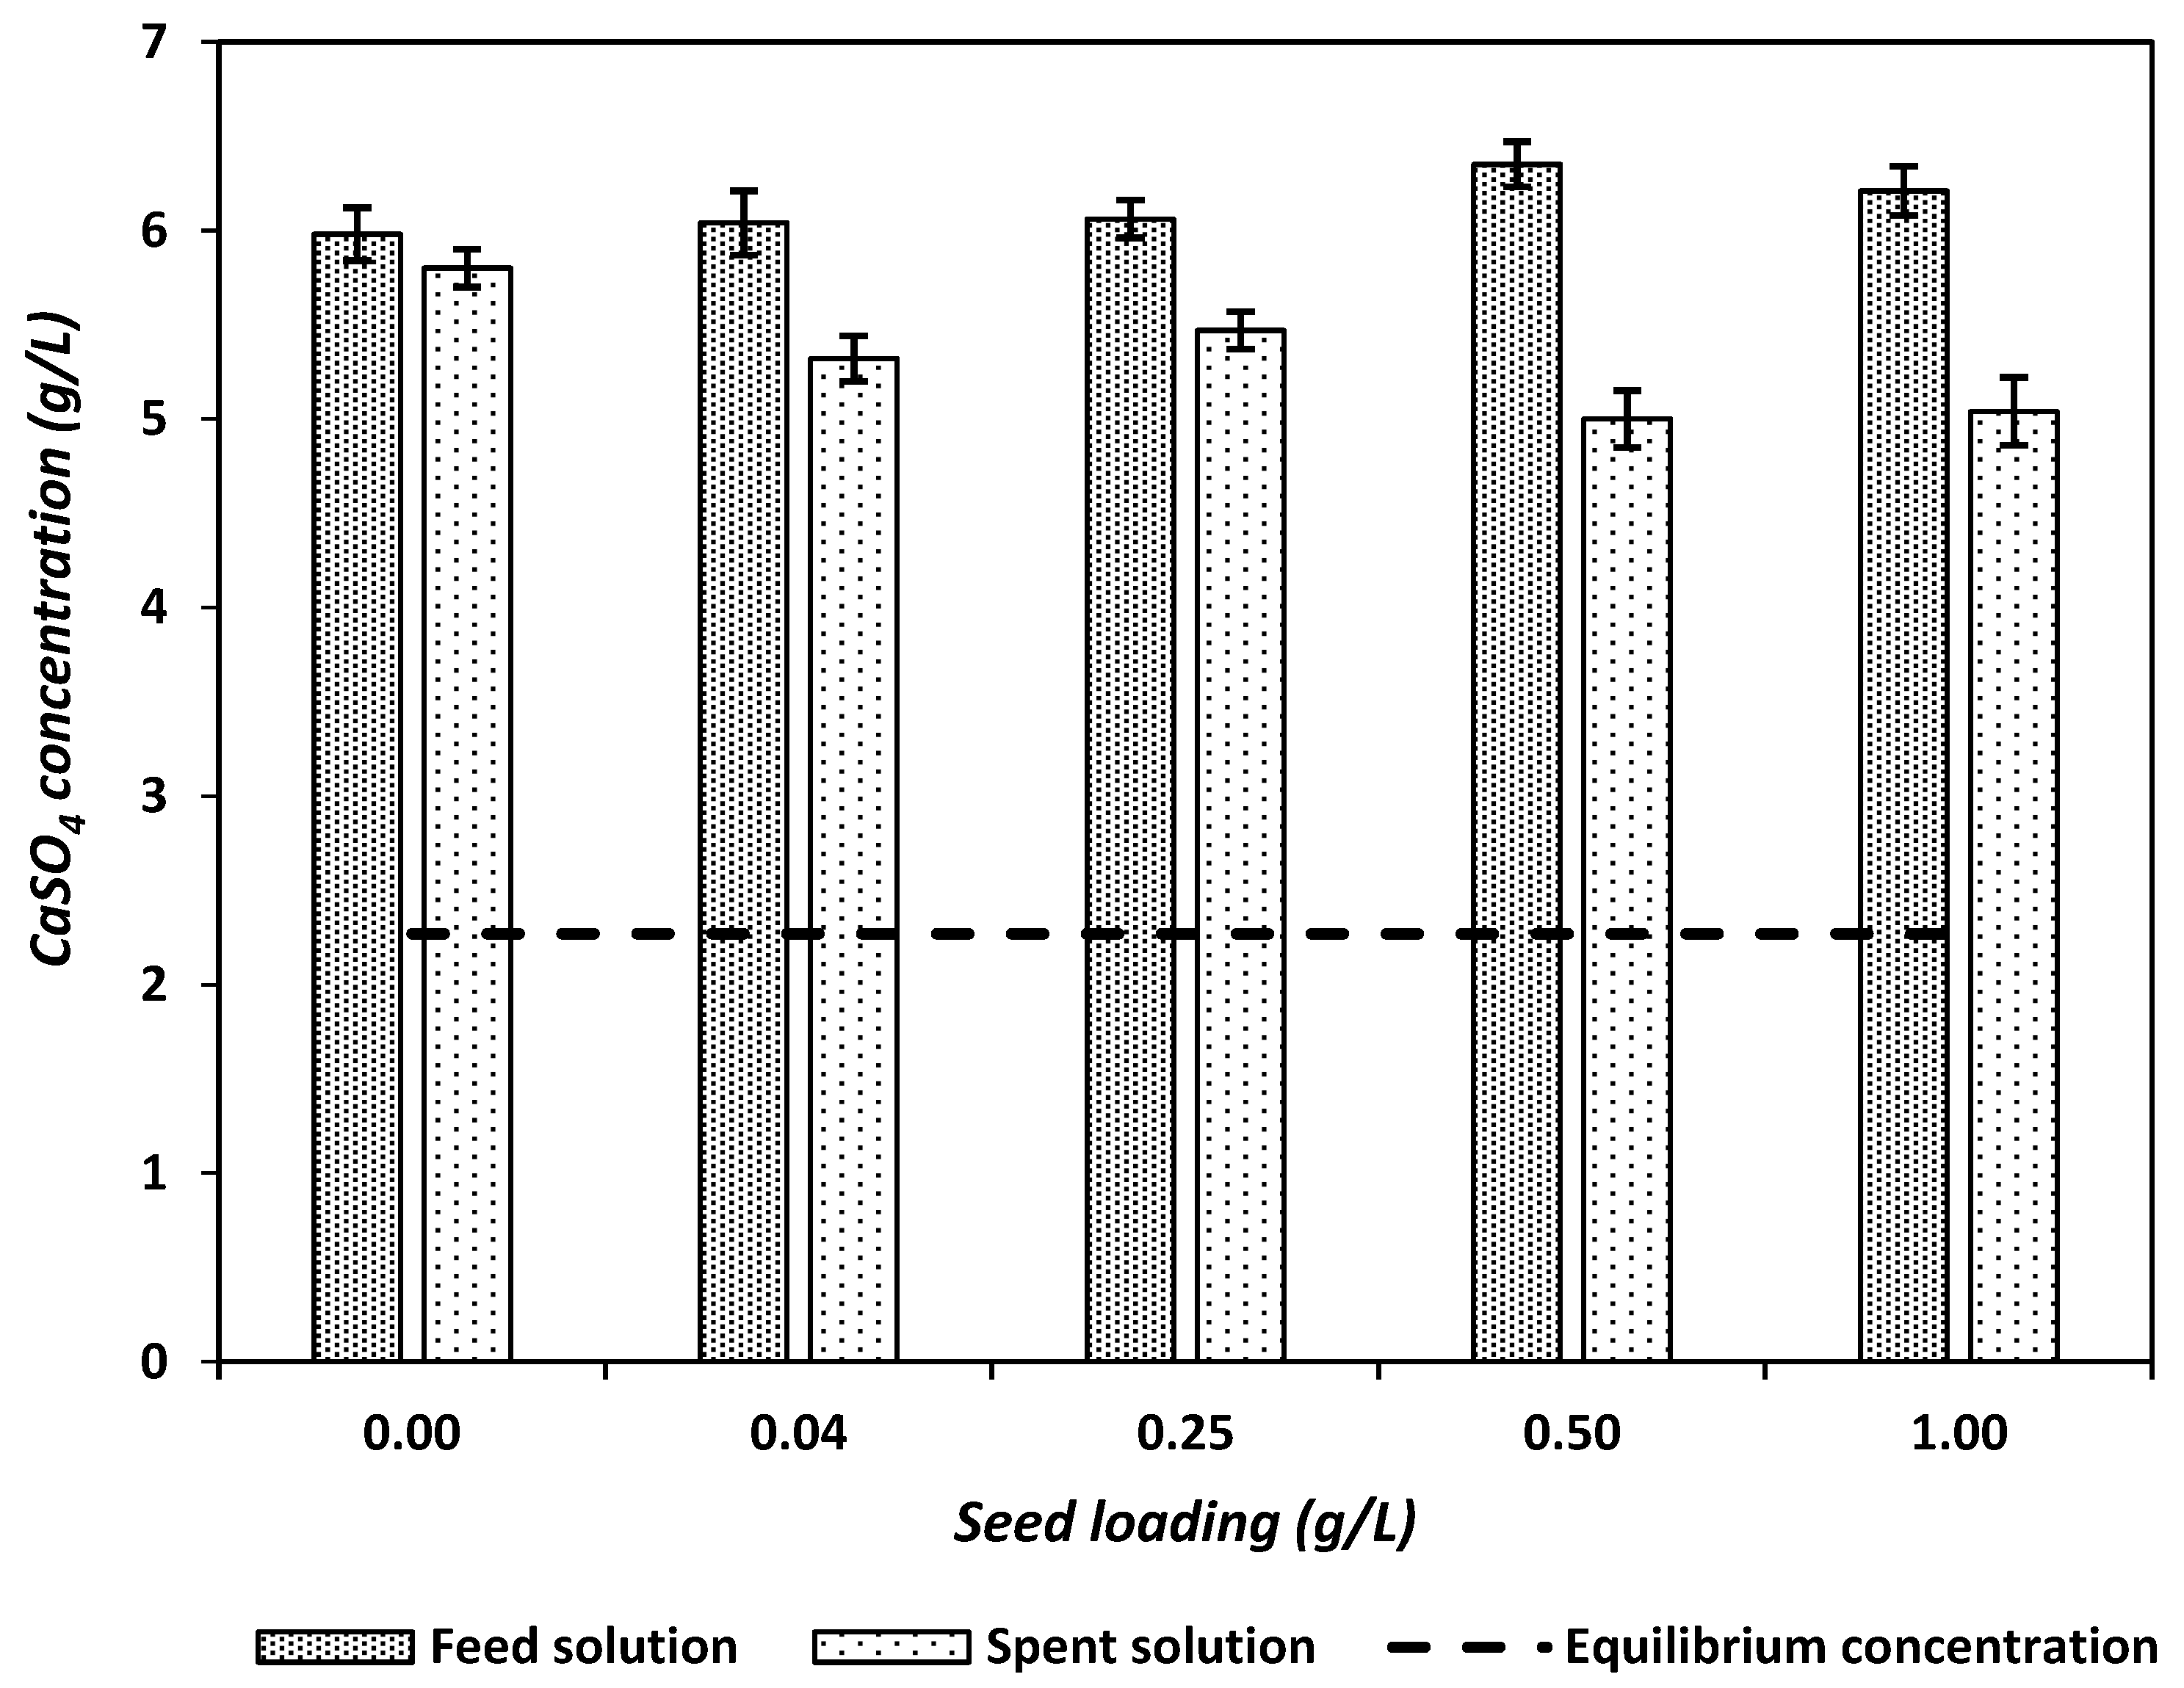
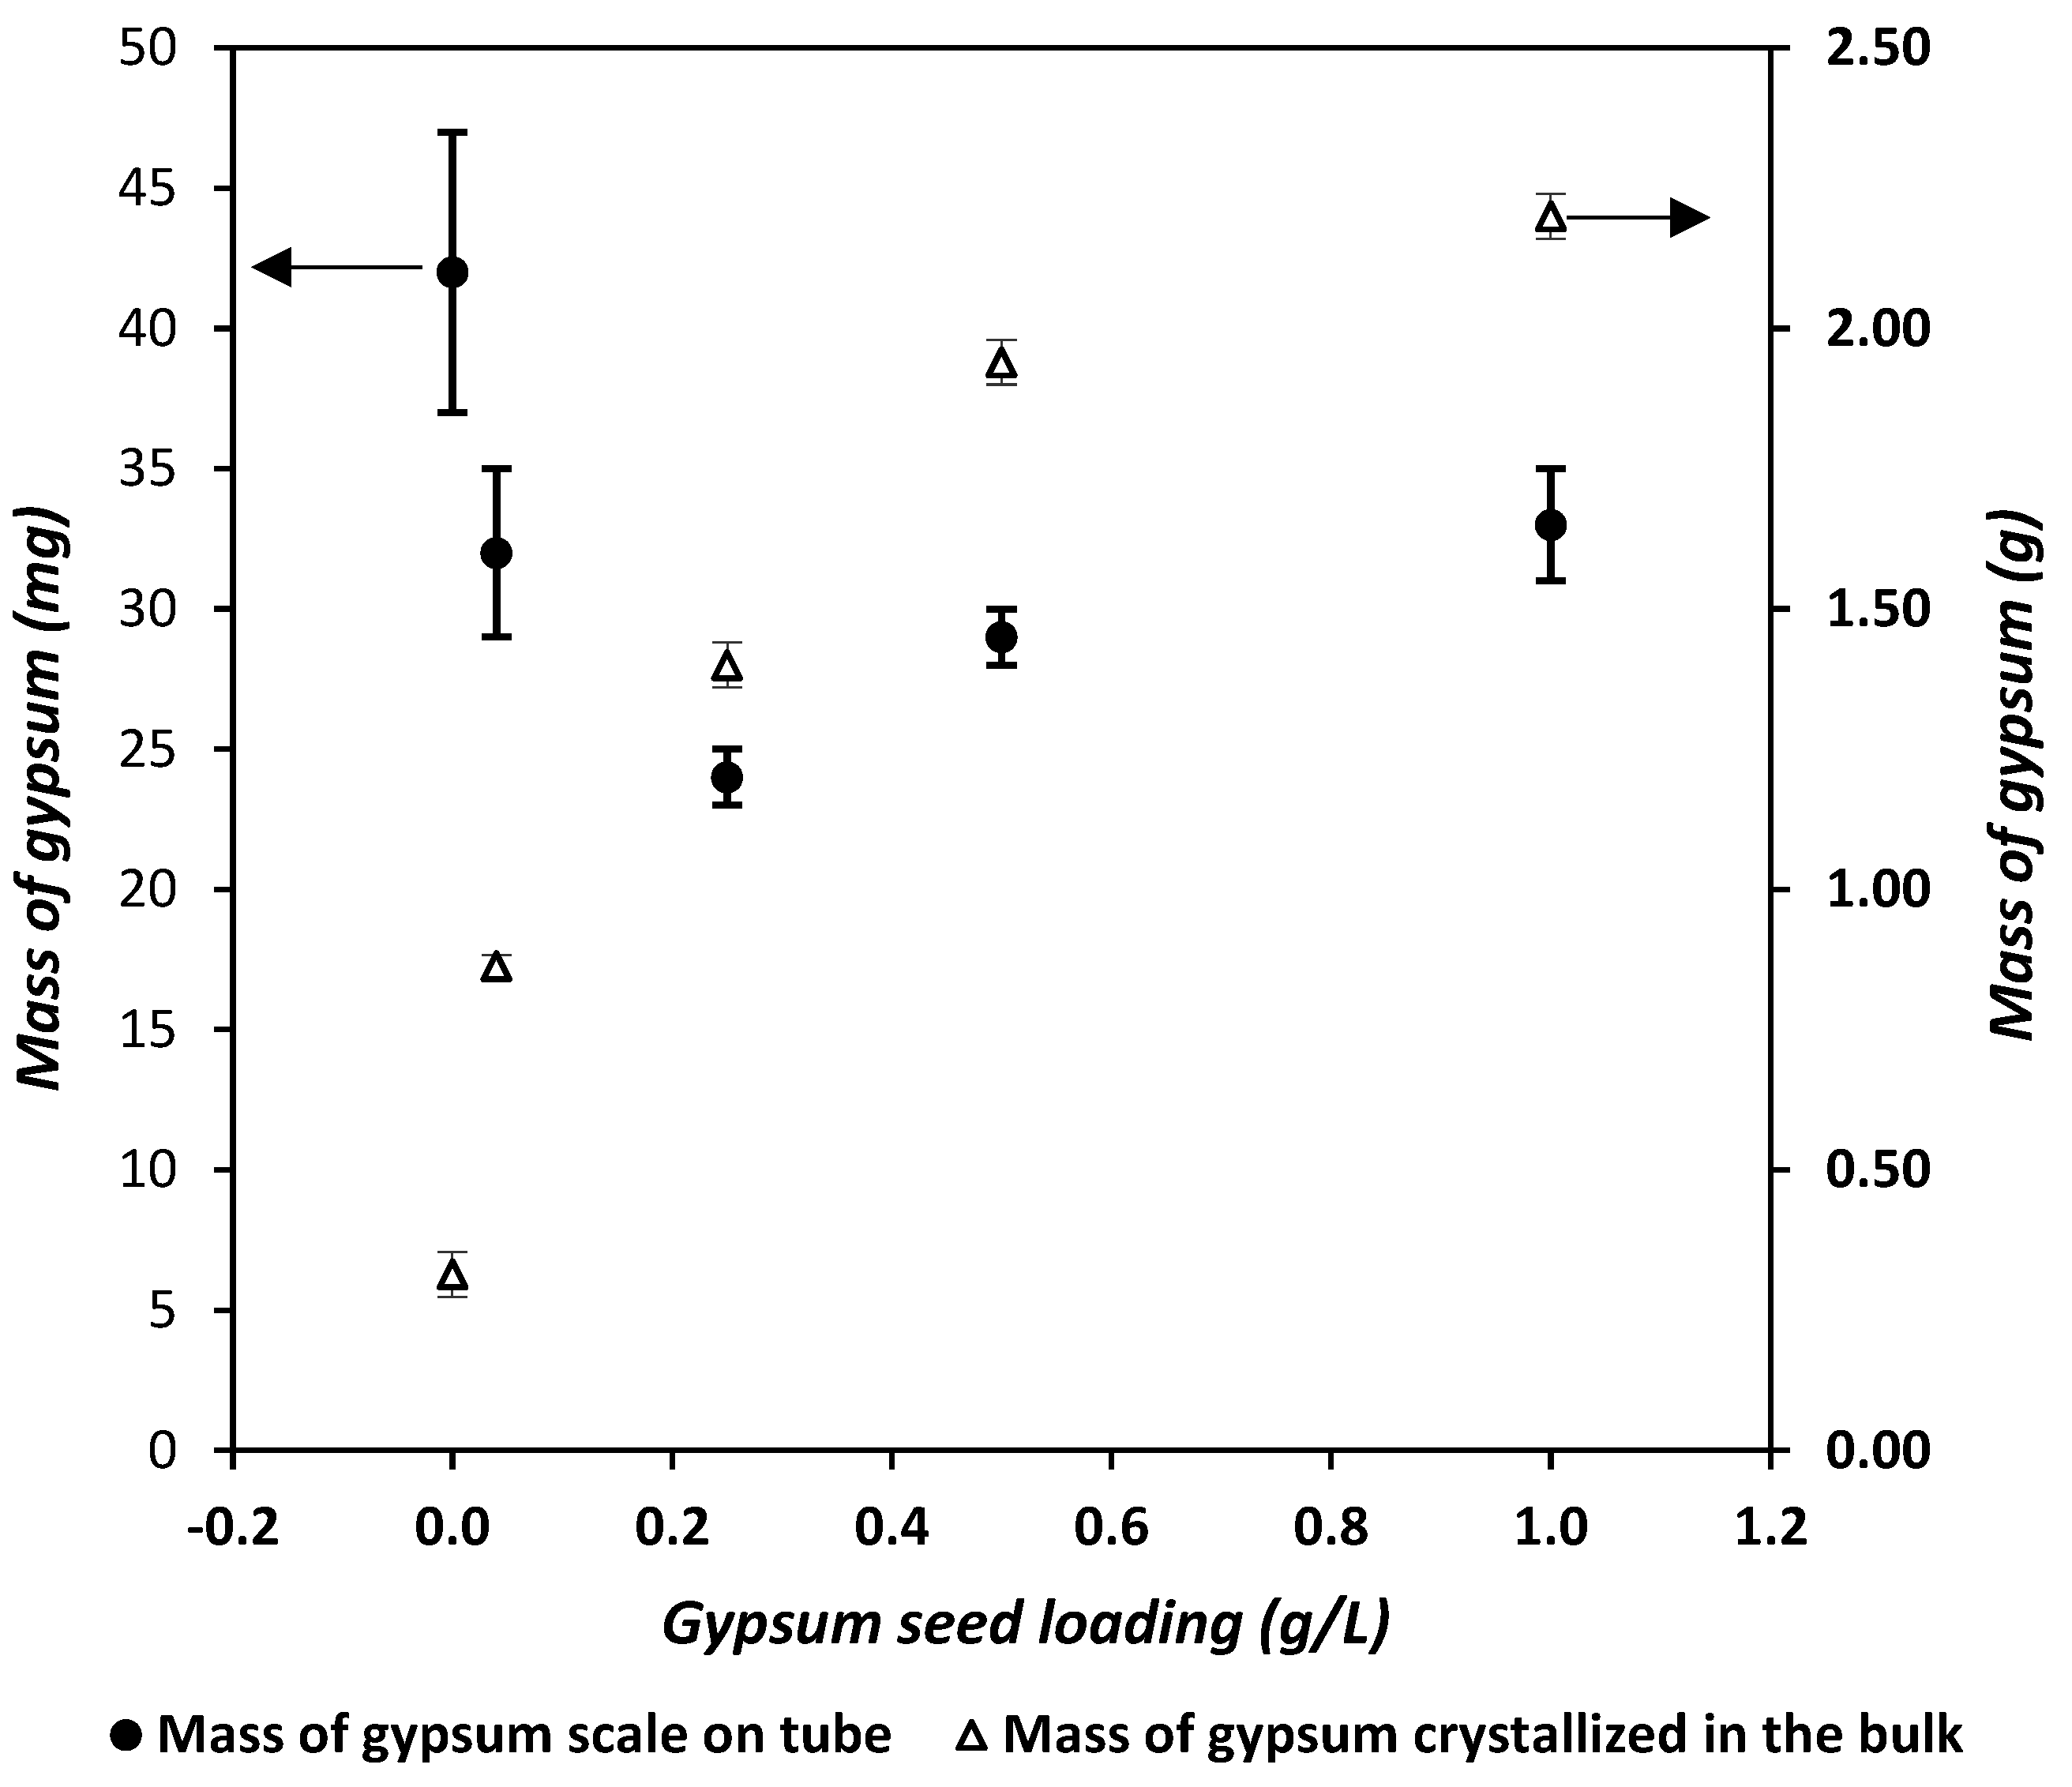
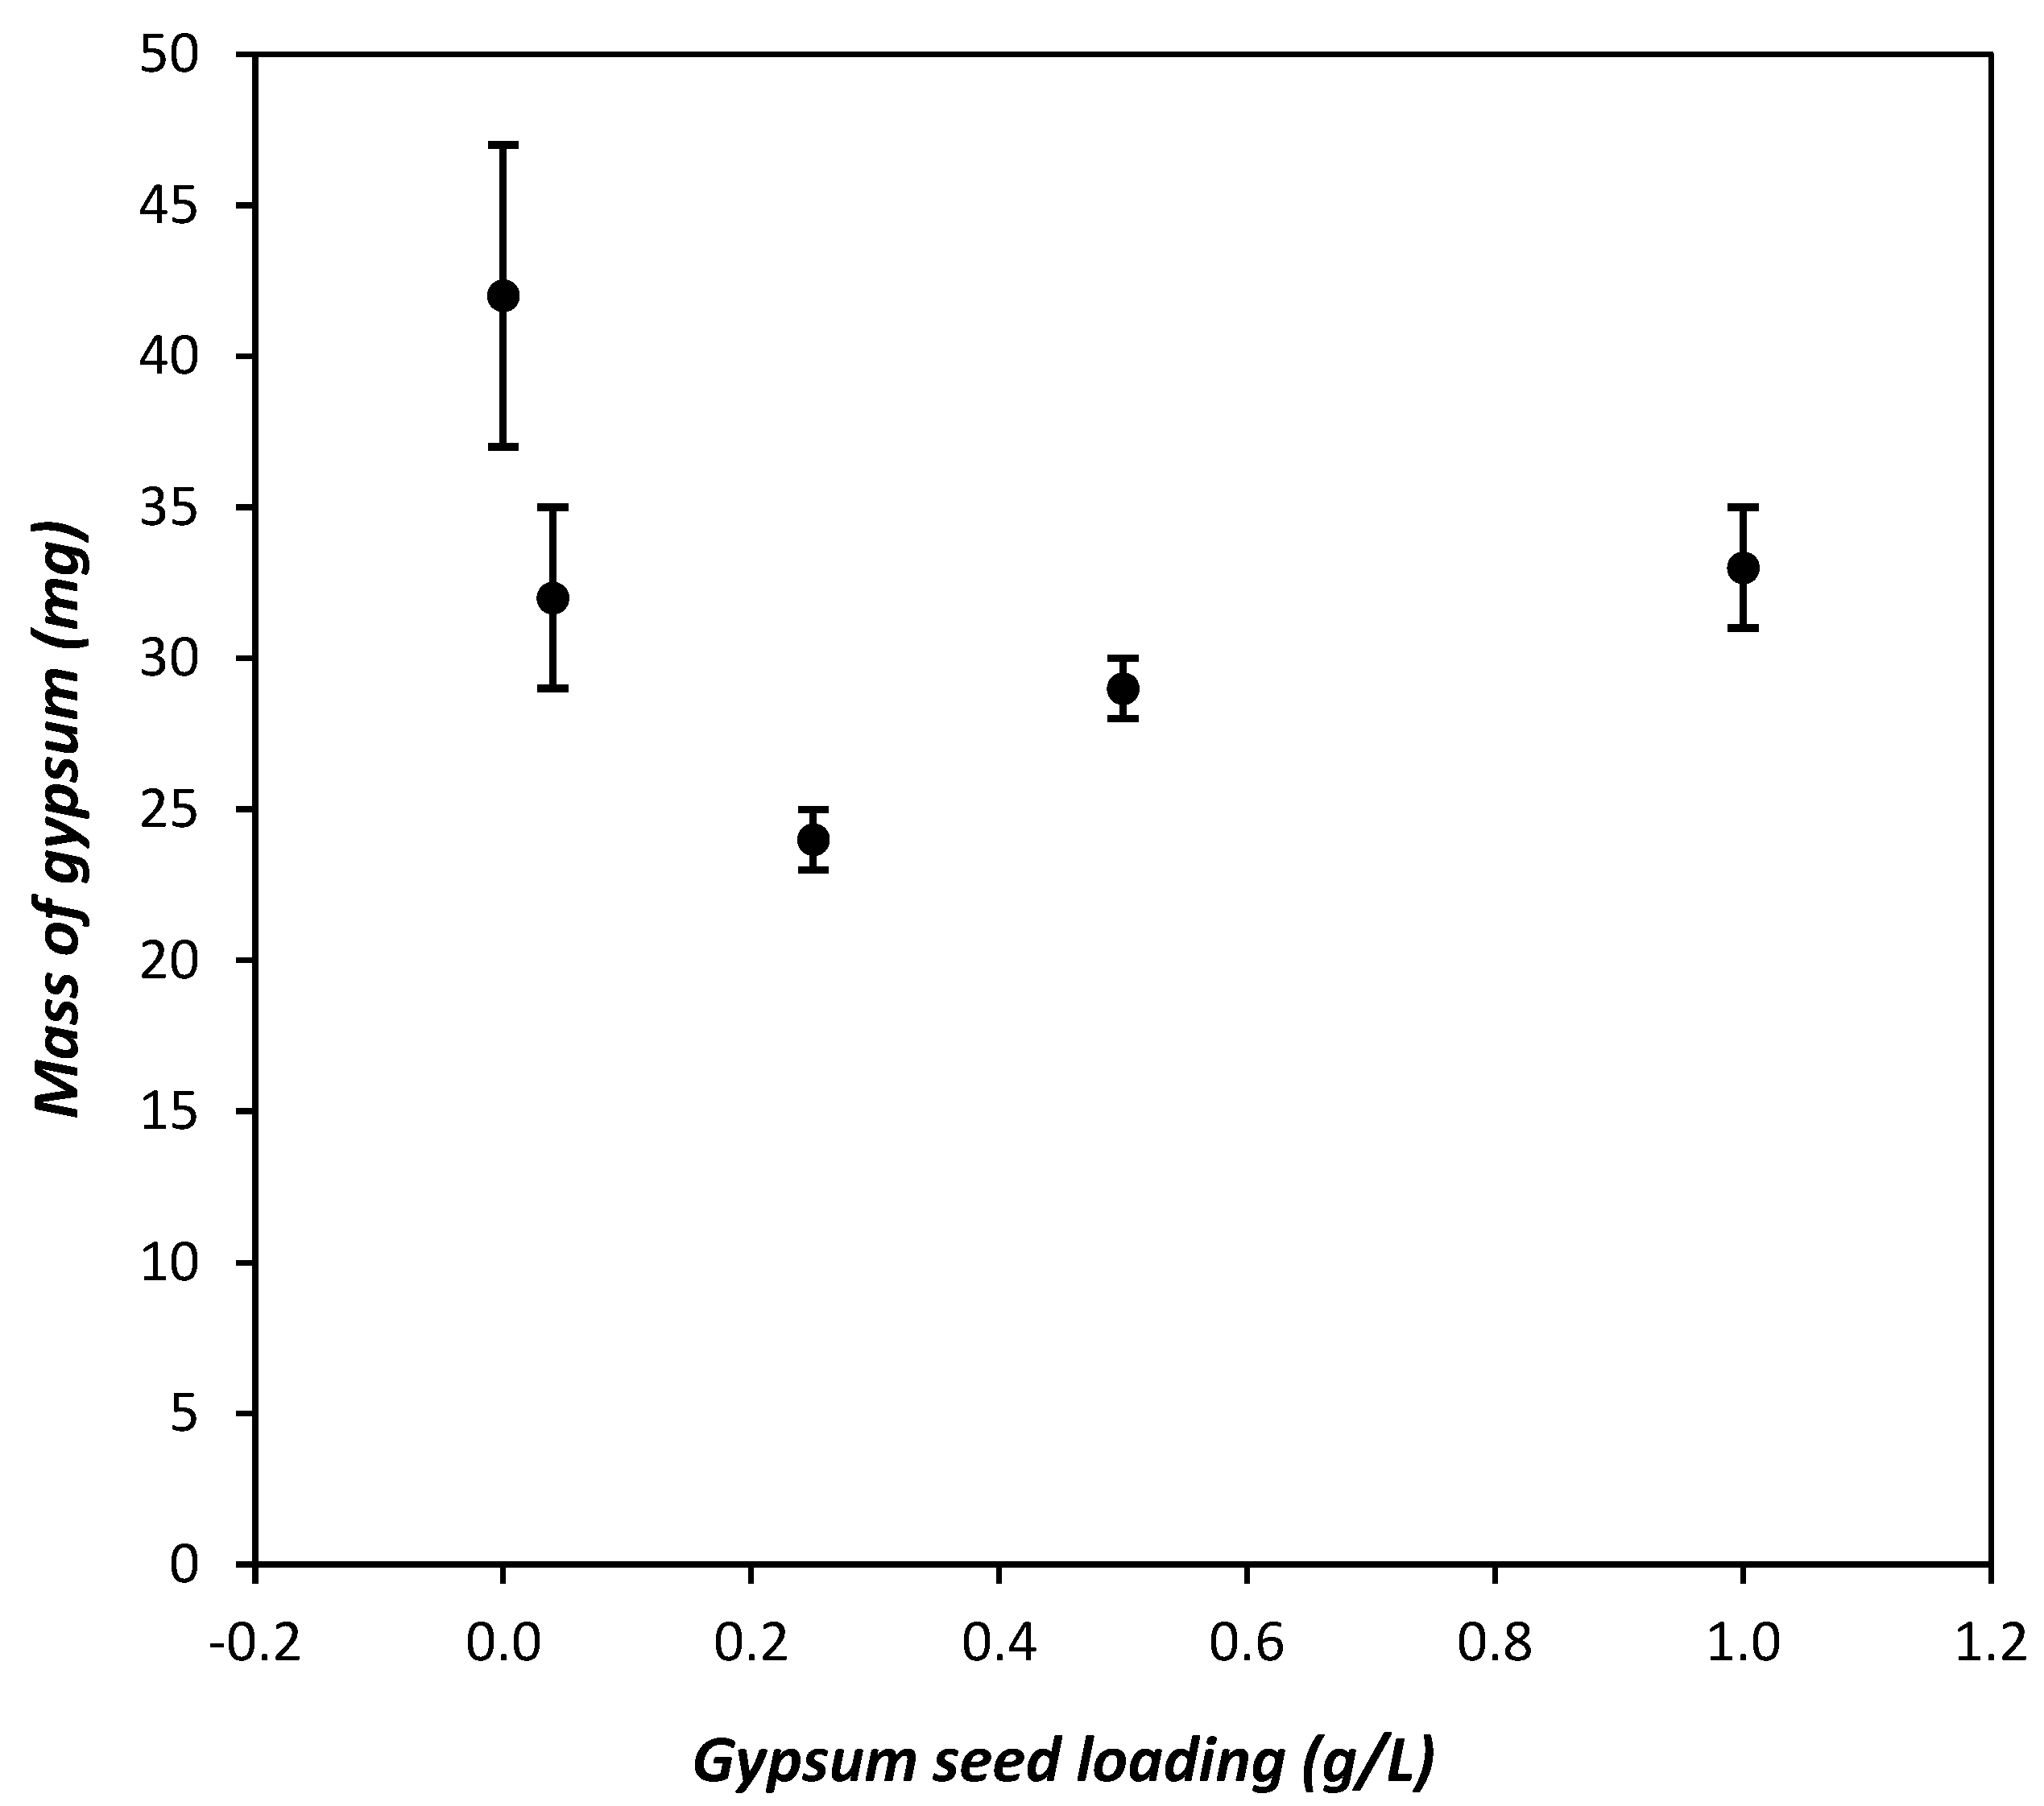
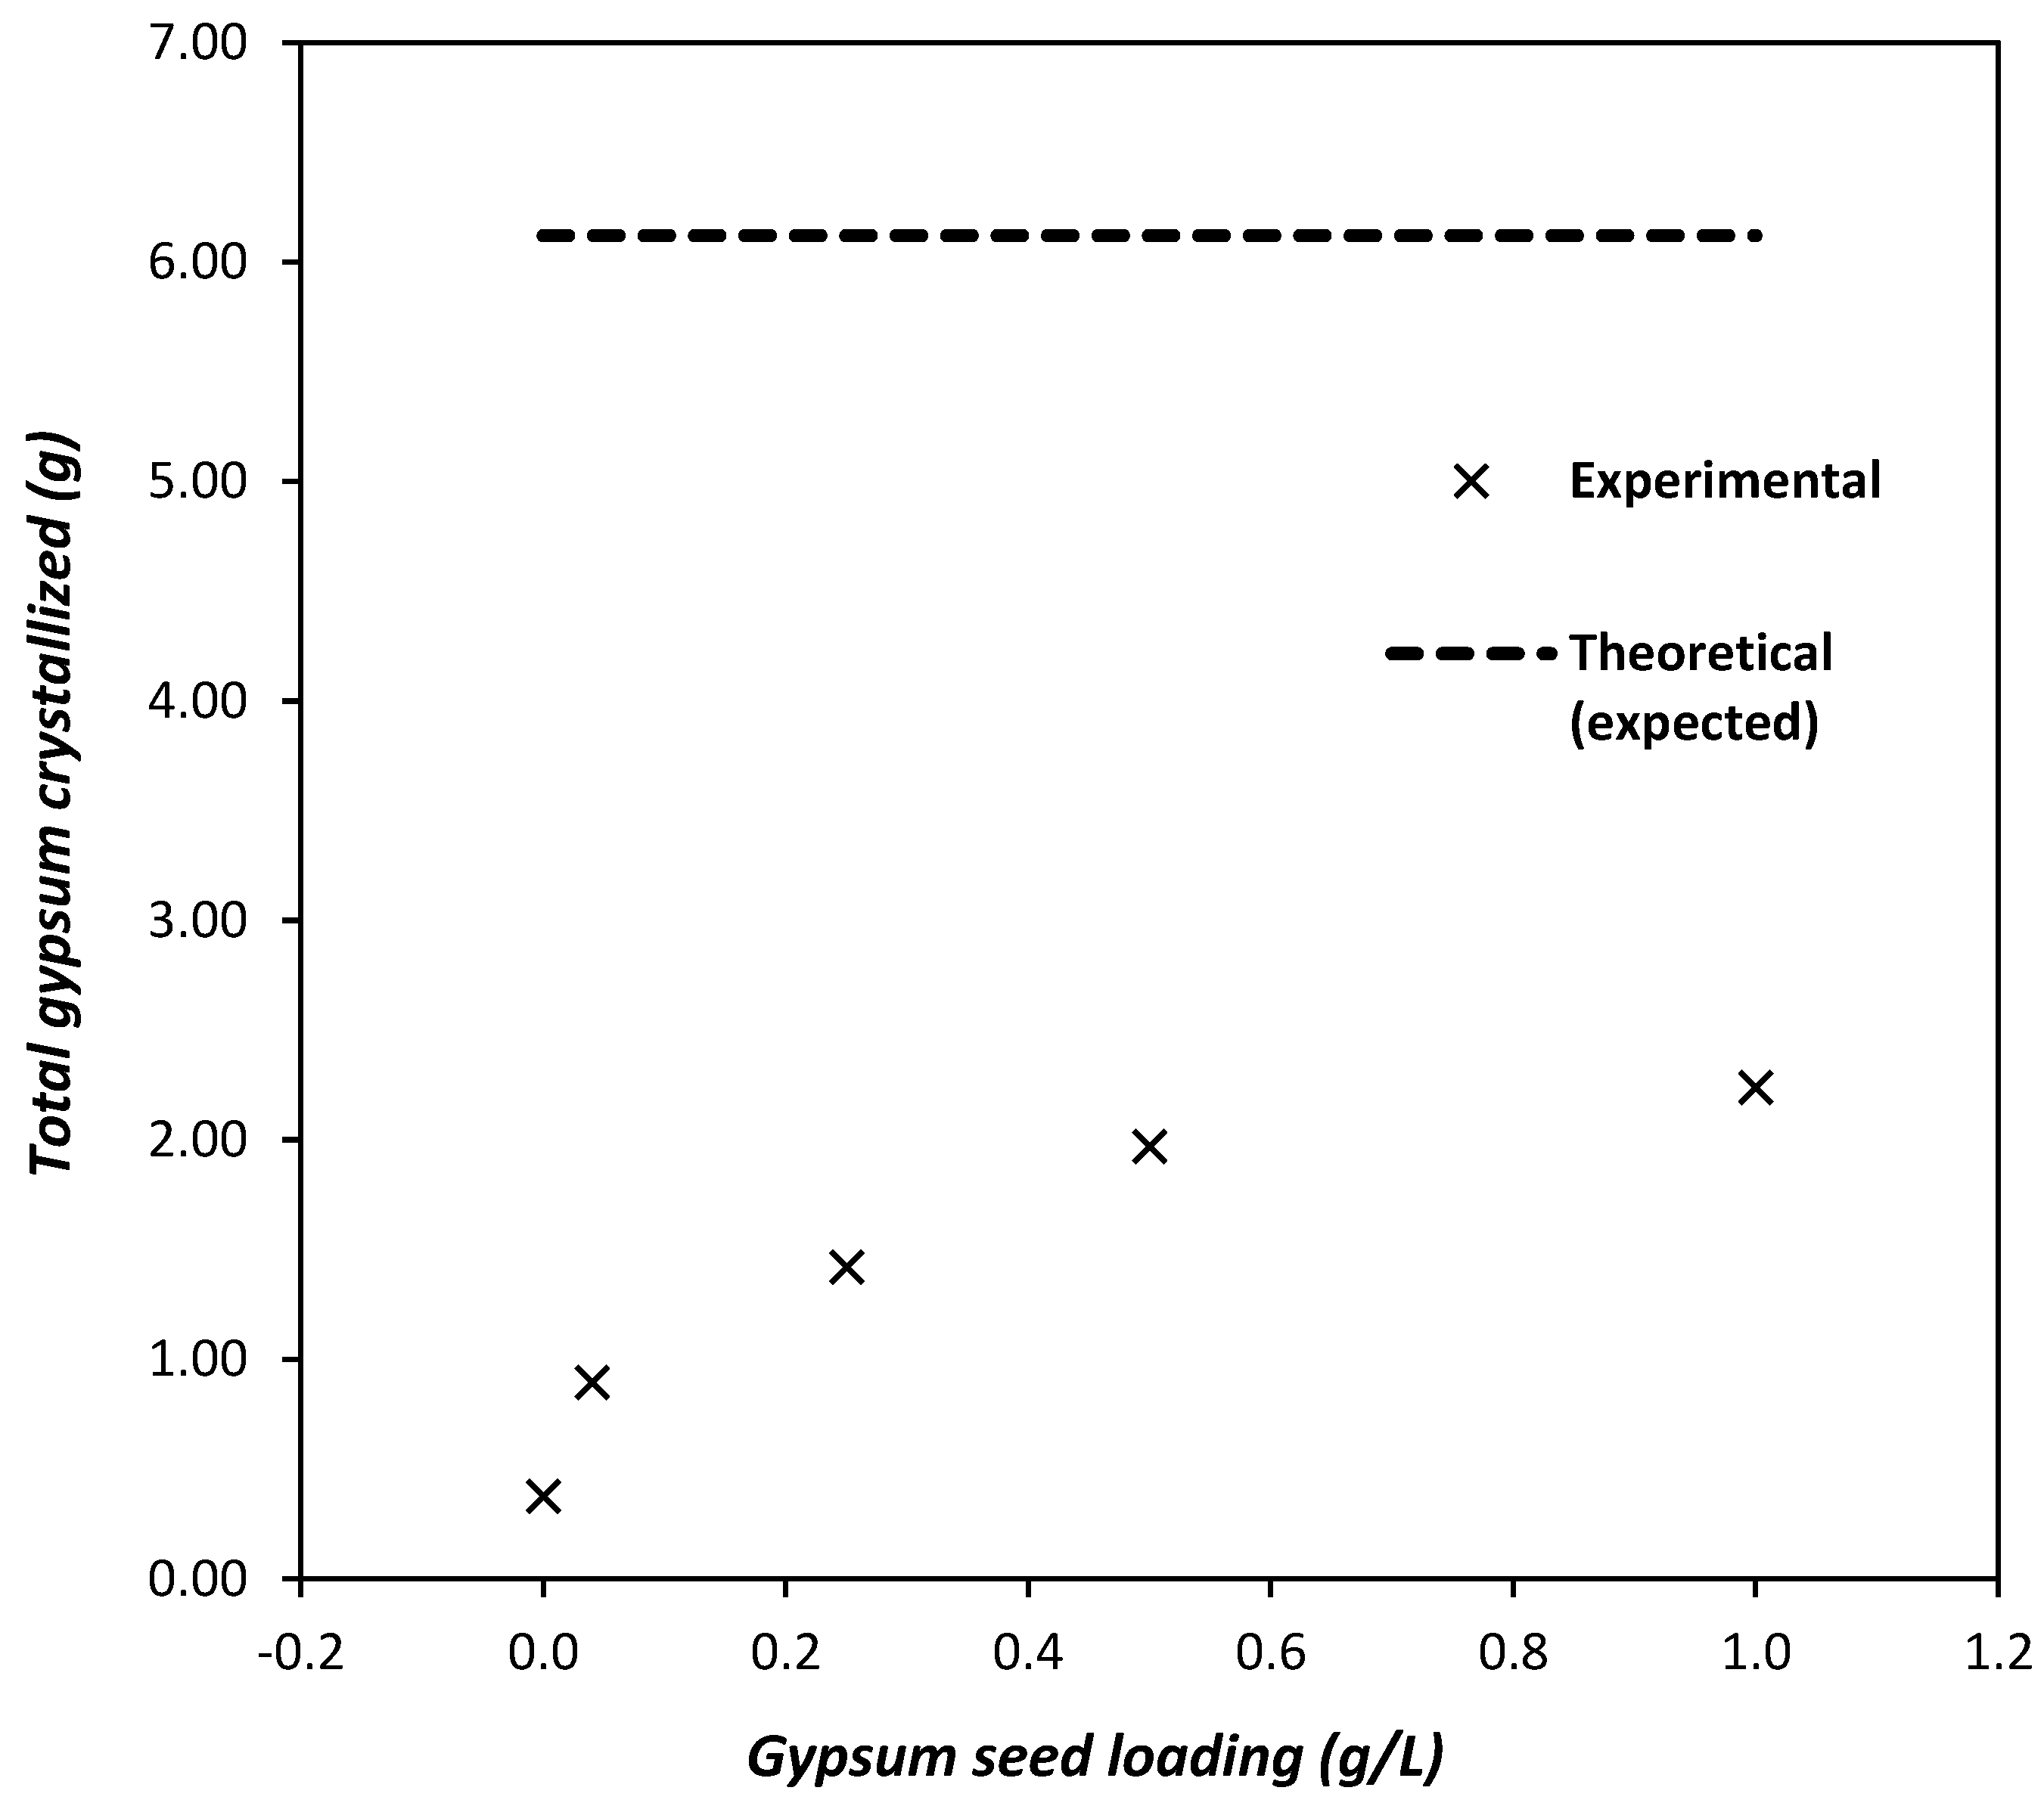
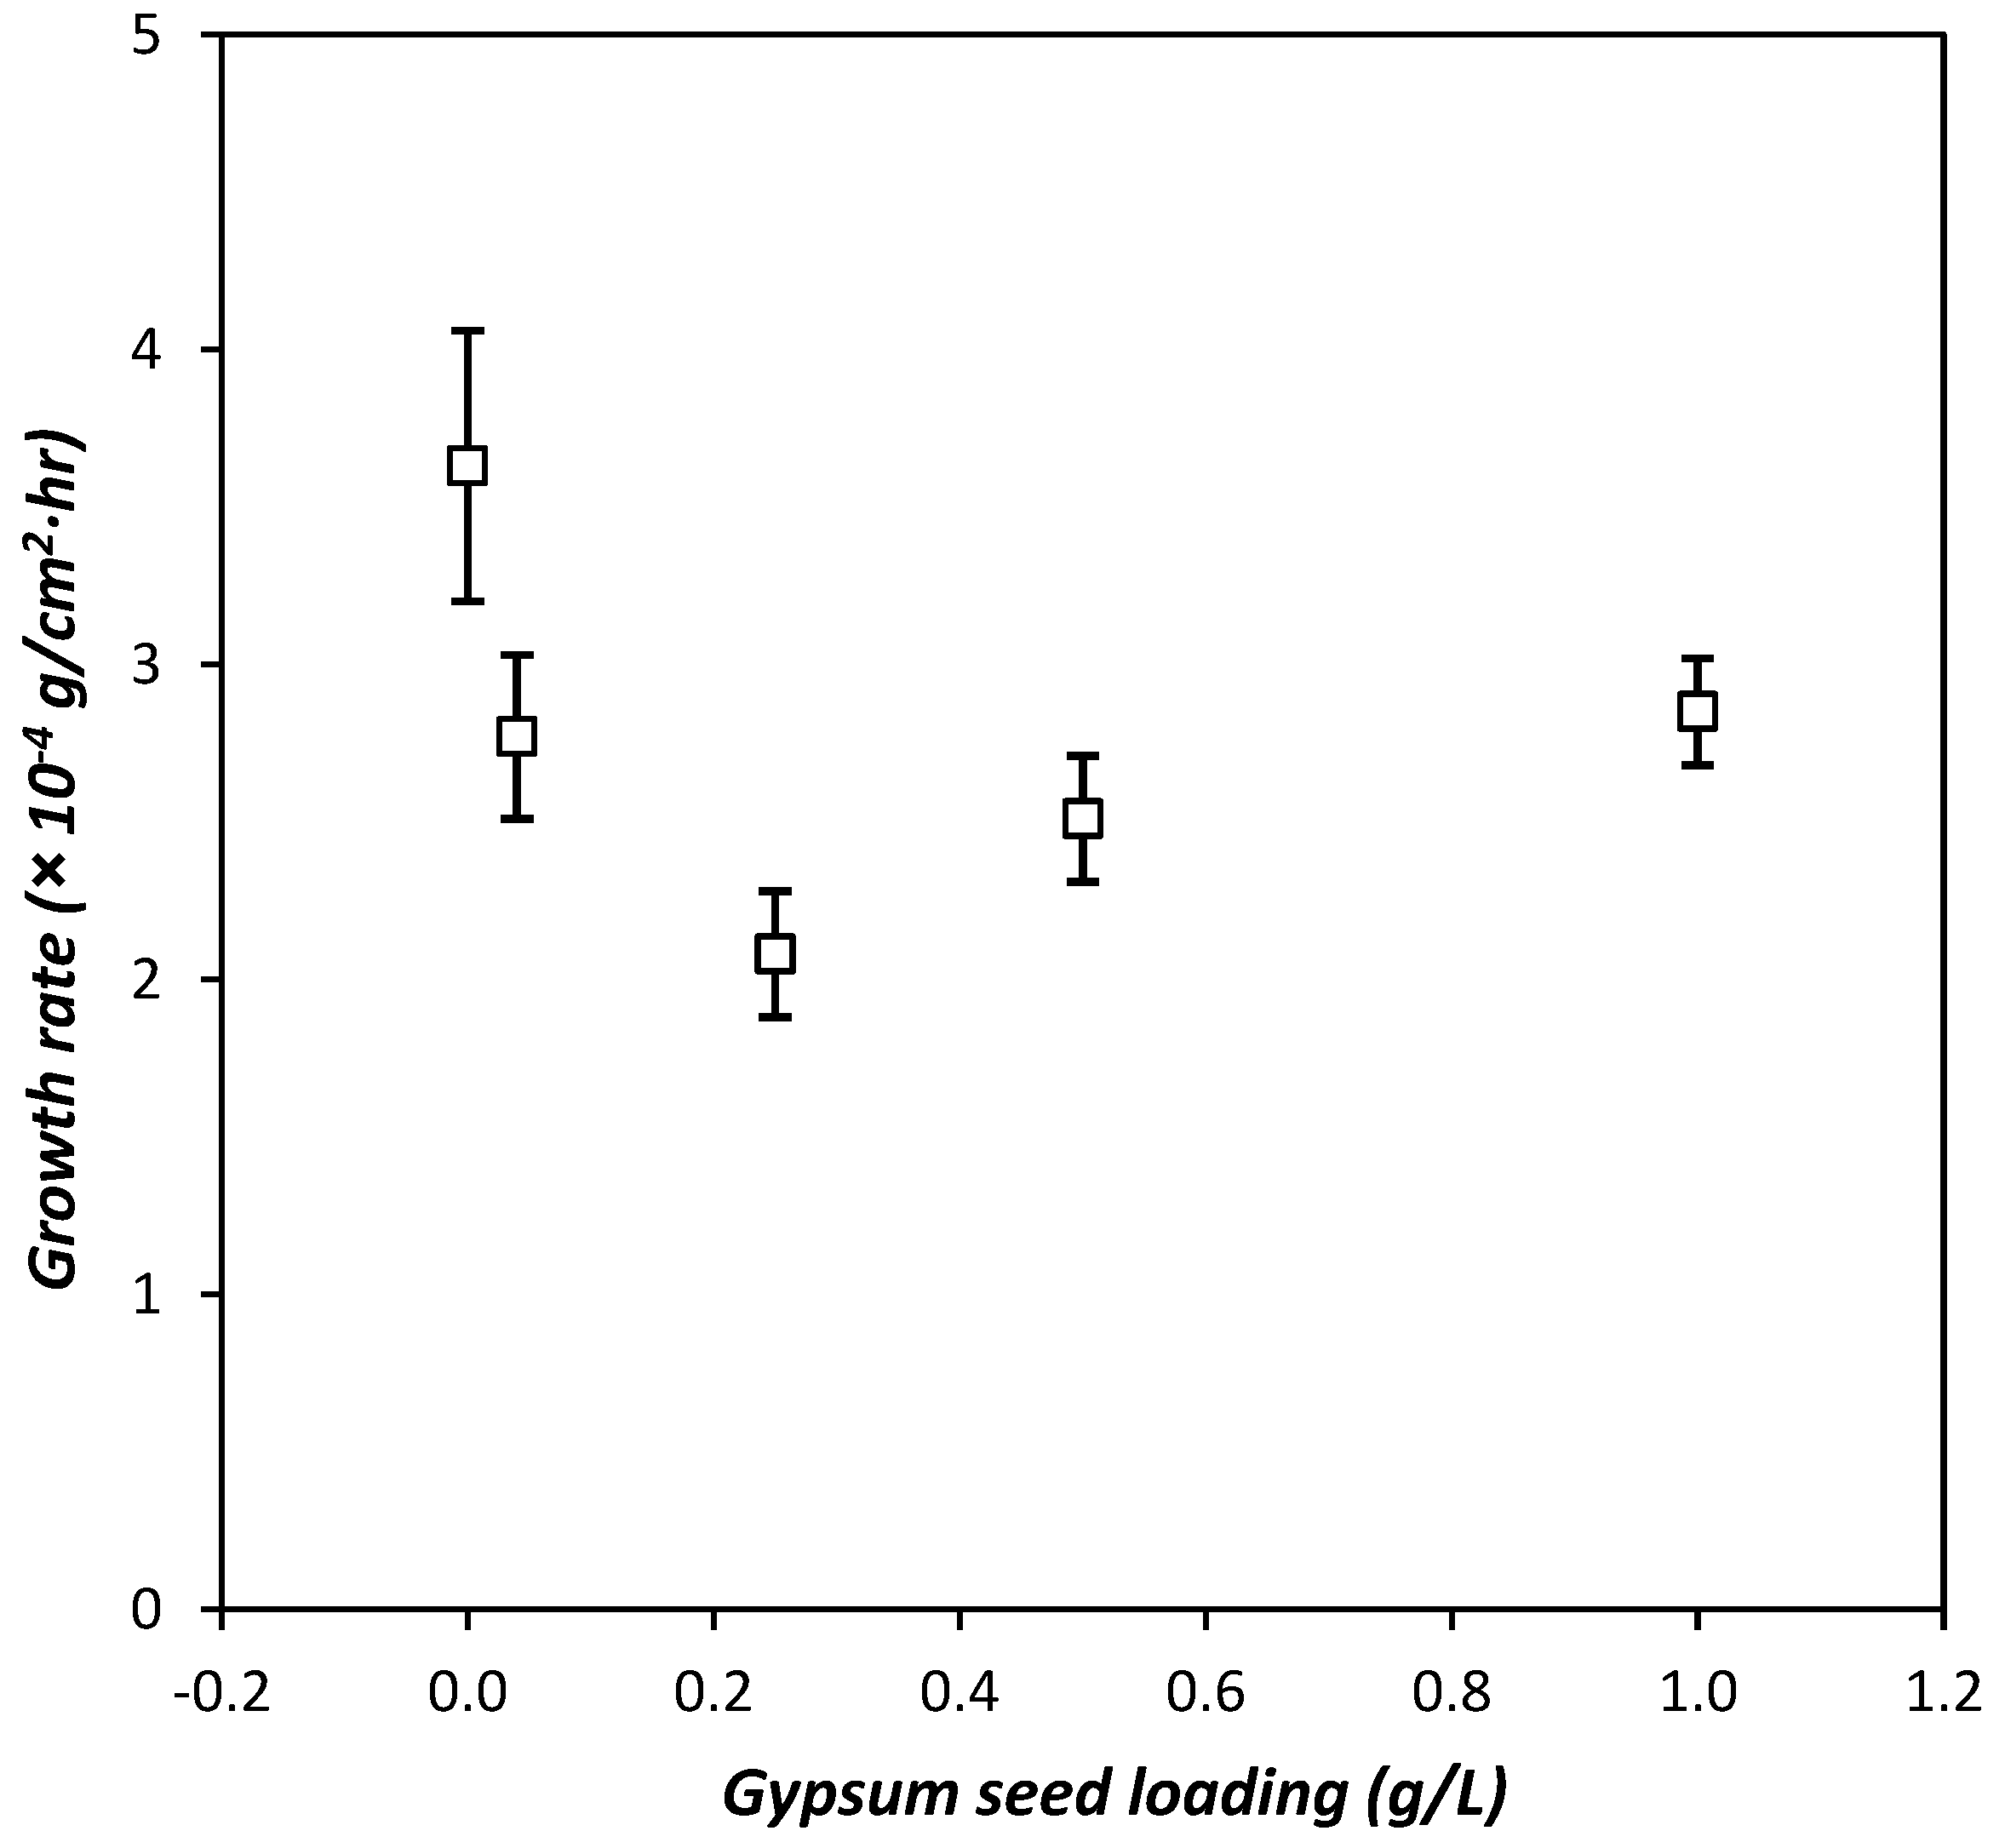
3.3. Effect of Increasing Gypsum Seed Loading on Gypsum Scale Formation

Synthetic gypsum seeds of the type described earlier were used. At the time the experiments were stopped, the calcium sulphate concentration was on average 5.33 g/L, which is above the thermodynamic equilibrium concentration of 2.27 g/L at 3 °C [34]. Since the calcium sulphate concentration in the spent solutions was double the equilibrium concentration, more gypsum may have theoretically crystallized from the solution if the experiments were run for longer. Gypsum crystallization kinetics were generally slow. Figure 7 is a graphical representation of the changes in solution concentration from feed to spent solution for 4-h run times plotted on the same axis for the different experiments.
The graph shows that the average change in concentration between the feed solution and the spent solution for all seed loadings was 1.0 g/L CaSO4. At seed loadings less than 0.50 g/L, the least average change in concentration of 0.50 g/L CaSO4 was recorded while at 1.0 g/L this change in concentration was 1.76 g/L CaSO4. The significant concentration change at higher seed loading was a result of faster gypsum crystallization kinetics.
Figure 8 shows the mass of gypsum scale that deposited on the tube and the mass of gypsum that crystallized in the bulk solution as a function of gypsum seed loading. The x-axis is from a minimum value of −0.2 to show the data points at 0.0 g/L. Figure 8 shows that the mass of gypsum that deposited on the stainless-steel tube was several orders of magnitude less than the mass of gypsum that crystallized in the bulk solution.
The mass of gypsum that crystallized in the bulk solution increased rapidly as gypsum seed loading was increased due to faster gypsum crystallization kinetics. The increase in seed loading increased the available surface area with favourable energetics for gypsum growth to occur. In addition, the abundance of gypsum crystals in suspension increased crystal–crystal, crystal–impeller, and crystal–crystallizer surface collisions. These collisions increased the rate of secondary nucleation, which requires the lowest activation energy; thus, crystallization kinetics increased. The observed increase in crystallization rates as the seed loading was increased corroborated the results found by Choi and co-workers [33], where they observed that the induction time shortened in the presence of seeds compared to unseeded solutions.
Although the tube was the heat transfer surface area and the coldest part of the apparatus, causing high local supersaturation, less mass of gypsum crystallized on it than in the bulk solution. This is because the surface area provided by the tube (28.9 cm2) was very small compared to that provided by the bulk solution (1415 cm2) and the seed material. Surface area is a key determinant of crystallization rate processes. The surface area provided by the bulk solution was calculated using the internal dimensions of the crystallizer. It was difficult to quantify the surface area provided by gypsum seeds at the different seed loadings due to technological limitations. In addition, the surface area provided by the tube had poor energetics for gypsum nucleation and growth compared to the gypsum seeds.
A zoomed view of Figure 8 showing the change in the mass of gypsum scale with increase in gypsum seed loading is presented in Figure 9. The x-axis has a minimum value of −0.2 to show the data point at 0.0 g/L.
Figure 9 shows that the highest mass of gypsum scale deposited on the tube in the control experiment. The mass of scale deposited on the tube decreased in the presence of gypsum seeds because the added seeds consumed some of the available supersaturation to sufficiently low levels to decrease the rate of heterogenous nucleation on the tube, but still promoting secondary nucleation in the bulk solution. An increase in gypsum seed loading (specific surface area) decreased the mass of scale up to the seed loading of 0.25 g/L. Beyond the seed loading of 0.25 g/L, a further increase in gypsum seeds resulted in an increase in the mass of gypsum scale deposited. Although the mass of gypsum scale deposited on the tube increased at seed loadings greater than 0.25 g/L, it was still less than the amount deposited in the control experiment without seeding.
Contrary to expectation, the mass of gypsum scale deposited on the tube when the critical seed loading was employed was not the lowest. It was anticipated that the mass of gypsum scale deposited on the tube would be the least at the critical seed loading because this seed loading is associated with growth without any prior nucleation. Hence, at seed loadings greater than the critical seed loading the surface area provided by the seeds would have been in excess compared to the available supersaturation. Instead, the lowest mass of scale deposited on the tube was realised when a seed loading approximately six times higher than the critical seed loading (0.25 g/L) was employed. This deviation could have been because the surface area provided by the critical seed loading was too small to sufficiently reduce nucleation on the stainless-steel tube surface any further.
In addition, the calculated contact angle for gypsum nuclei to form on a stainless-steel surface was small. The contact angle calculation was done using Equation (A1) provided in the Appendix A together with the values from literature which were used (Table A1). A range of the contact angle was determined since the dispersive component of gypsum surface free energy was found as a range. The contact angle range found was 16° to 50°. The lower limit of the contact angle range implies the degree of wetting was high, thus heterogeneous nucleation of gypsum on stainless-steel occurred easily. The respective surface energy reduction factors, f(∅), for the contact angles calculated using Equation (A2) (see Appendix A) were 0.001 and 0.08. This shows that the nucleation work on the stainless-steel tube which needed to be overcame by the dissolved gypsum molecules was low.
The relative ease of gypsum to heterogeneously nucleate [17,18] on the stainless-steel tube as determined from the contact angle calculations may have hampered the ability of gypsum seed crystals to sufficiently reduce heterogeneous nucleation. Figure 9 shows that increasing gypsum seed loading six times from 0.04 to 0.25 g/L only resulted in a further 25% reduction in scale mass.
At seed loadings greater than 0.25 g/L, the specific surface area provided by the seeds could have been in excess for this system since the contact angle calculations showed that the degree of wetting on stainless-steel tube was relatively high, resulting in some of the seed crystals possibly adhering onto the tube surface. It should be noted that the scaling mechanism postulated for these experiments in which gypsum seeding was employed is different to the one for the preliminary experiments where there was no seeding. This is because the presence of gypsum seeds in relatively high quantities (0.50 and 1.0 g/L) made adhesion a possibility. However, this may not have been to a great extent since the mass of scale deposited on the tube in these experiments remained lower than that deposited in the control experiment.
The total amount of gypsum crystallized from the experiment was computed as the sum of the mass of gypsum scale and the mass of gypsum crystallized in the bulk solution. Figure 10 shows the total mass of gypsum crystallized as a function of gypsum seed loading.
The graph shows that the total mass of gypsum crystallized from the solution was much less than the theoretical yield expected. Theoretical yield was calculated using the feed solution concentration and the thermodynamic equilibrium concentration at 3 °C. This may have been due to slow gypsum crystallization kinetics stated earlier. Preliminary experiments, which were ran for 48 h, did not yield a spent solution concentration that is comparable to the thermodynamic equilibrium concentration.
Figure 11 shows the micrographs of the scaled tube at different seed loadings. The light phase represents the stainless-steel surface while the dark phase represents gypsum crystals.
The micrographs show that the predominant habit of the crystals that formed the scale layer was needles. An increase in gypsum seed loading led to fewer scale layer crystals per unit area of the tube because some of the available supersaturation was consumed by the seeds, leaving less available for heterogeneous nucleation and growth on the tube. Additionally, more gypsum seed crystals meant fewer prism-shaped crystals in the scale layer, as some of the supersaturation for growth of needle-type crystals into prisms was consumed by the gypsum seeds.
The growth direction of the crystals that formed the scale layer was comparable to that which was observed in the preliminary experiments at different durations. Figure 12 shows the normalized growth rate of the scale layer as a function of seed loading. The minimum on the x-axis (−0.2) was chosen to ensure the data point at 0.0 g/L would show clearly.
The graph shows that the normalised scale growth rate followed the same trend as was observed for the mass of scale deposited on the tube (Figure 9). The normalised scale growth rate was calculated by dividing the mass of gypsum scale by the product of the experiment duration and the tube surface area (same divisor). The experiment duration and the tube surface area were constants, hence the similarity in the trends.
The micrographs of the crystals recovered from the suspension at the end of each experiment are presented in Figure 13. The light phase represents the gypsum crystals and the dark phase represents the mounting glue.
The micrographs show that in the control experiment (Figure 13a), the crystals in the bulk solution were composed predominantly of needle-type crystals. There was evidence of some crystal twinning (white circles). The addition of 0.04 g/L seed crystals to the system decreased the proportion of needle-type crystals and the degree of twinning (Figure 13b). As the seed loading was increased, the habit of the crystals transformed from being predominantly needle-type to prisms. This was because in the absence of seeds, the supersaturation was relatively high and numerous crystallites were birthed. The available supersaturation was distributed among the crystallites for their growth, which resulted in needle-type habit. The presence of seeds and increase thereof possibly reduced the degree of nucleation and promoted crystal growth resulting in the formation of prisms.

4. Conclusions

Gypsum scale formation on the cooled stainless-steel tube was most likely a result of heterogenous nucleation and growth. The micrographs of the scaled tube showed that the rough patches on the stainless-steel tube were nucleation sites for gypsum scale.
Gypsum seeding was effective in decreasing the mass of gypsum scale deposited on the stainless-steel tube. This was attributed to the gypsum seeds providing a surface area that had favourable energetics for gypsum crystallization compared to the tube surface. The most effective seed loading was 0.25 g/L.
The amount of gypsum crystallized in the bulk solution increased as gypsum seed loading was increased. This was due to the increase in specific surface area that had growth sites on which gypsum dissolved in solution could crystallize.
These findings are relevant for the operability and control of EFC processes, which suffer from scaling problems. By using an appropriate seeding strategy, two problems can be alleviated. Firstly, scaling on the heat transfer surface is minimised and, secondly, seeding increases the crystallization kinetics in the bulk solution, which is advantageous for product yield and recovery.
This is of great importance towards scaling-up EFC for industrial applications. Beyond that, seeding to prevent scaling has potential applicability in other processes where the scale is regarded a product and/or purity is of importance, thus making addition of polymeric scale inhibitors undesirable.

5. Recommendation

There is need to investigate the effect of silica as a seed material to prevent gypsum scale formation. The gypsum crystallized in the bulk solution was still to a greater extent composed of fines, which poses separation problems in EFC. Silica is a robust and inert material that can ideally maintain its structural integrity throughout the experiment. If gypsum dissolved in solution can crystallize on silica, then there is a possibility of yielding coarser silica-gypsum crystals that may be relatively easy to separate from ice during EFC.

Author Contributions

Data curation, A.E.L.; Investigation, T.M.C.; Methodology, J.C. All authors have read and agreed to the published version of the manuscript.

Funding

This research was funded by Julian Baring Scholarship and University of Cape Town grant number. The APC was funded by University of Cape Town.

Institutional Review Board Statement

Not applicable.

Informed Consent Statement

Not applicable.

Data Availability Statement

The data presented in this study are available on request from the corresponding author.

Acknowledgments

The authors would like to acknowledge and thank Gerda van Rosmalen, who gave us some very valuable input at the early stages of this work. The authors would also like to thank the Julian Baring Scholarship Fund, all members of the Crystallization and Precipitation Research Unit, and the Mechanical Workshop in the Chemical Engineering Department at the University of Cape Town. Special mention goes to Miranda Waldron, Electron Microscope Unit.

Conflicts of Interest

The authors declare no conflict of interest.

Appendix A

γ s l = γ c s + γ c l cos θ
Δ G H e t e r o g e n e o u s   = f ( ) Δ G H o m o g e n e o u s
Table A1. Parameters used to calculate contact angle.
Parameter.Value/Range (mJ/m2)Source
Stainless-steel surface free energy, γ s 37[35]
Dispersive component of stainless-steel surface free energy, γ s d 33.72[36]
Water surface tension, γ l 72.8[37]
Dispersive component of water surface tension, γ l d 21.8[37]
Gypsum surface free energy, γ g 37[18]
Dispersive component of gypsum surface free energy, γ g d 25.7–47.1[37]

References

  1. Fakir, S. The Industrialisation Debate in SA—What Are the Lessons? Available online: https://www.engineeringnews.co.za/article/the-industrialisation-debate-in-sa-what-are-the-lessons-2018-09-21/rep_id:4136 (accessed on 27 October 2020).
  2. Claassen, M.; Masangane, W. The Current State and Future Priorities of Brine Research in South Africa: Workshop Proceedings; KV338/15; W.R. Commission: Pretoria, South Africa, 2015. [Google Scholar]
  3. Van der Merwe, I.W.; Lourens, A.; Waygood, C. An Investigation of Innovative Approaches to Brine Handling; 1669/1/09; W.R. Commission: Pretoria, South Africa, 2010. [Google Scholar]
  4. Macedonio, F.; Katzir, L.; Geisma, N.; Simone, S.; Drioli, E.; Gilron, J. Wind-Aided Intensified eVaporation (WAIV) and Membrane Crystallizer (MCr) integrated brackish water desalination process: Advantages and drawbacks. Desalination 2011, 273, 127–135. [Google Scholar] [CrossRef]
  5. Randall, D.G.; Nathoo, J.; Lewis, A.E. A case study for treating a reverse osmosis brine using Eutectic Freeze Crystallization—Approaching a zero waste process. Desalination 2011, 266, 256–262. [Google Scholar] [CrossRef]
  6. Helalizadeh, A.; Müller-Steinhagen, H.; Jamialahmadi, M. Mixed salt crystallisation fouling. Chem. Eng. Process. Process Intensif. 2000, 39, 29–43. [Google Scholar] [CrossRef] [Green Version]
  7. Benecke, J.; Haas, M.; Baur, F.; Ernst, M. Investigating the development and reproducibility of heterogeneous gypsum scaling on reverse osmosis membranes using real-time membrane surface imaging. Desalination 2018, 428, 161–171. [Google Scholar] [CrossRef]
  8. Jaramillo, H.; Boo, C.; Hashmi, S.M.; Elimelech, M. Zwitterionic coating on thin-film composite membranes to delay gypsum scaling in reverse osmosis. J. Membr. Sci. 2021, 618, 118568. [Google Scholar] [CrossRef]
  9. Matin, A.; Rahman, F.; Shafi, H.Z.; Zubair, S.M. Scaling of reverse osmosis membranes used in water desalination: Phenomena, impact, and control; future directions. Desalination 2019, 455, 135–157. [Google Scholar] [CrossRef]
  10. Amjad, Z. Calcium sulfate dihydrate (gypsum) scale formation on heat exchanger surfaces: The influence of scale inhibitors. J. Colloid Interface Sci. 1988, 123, 523–536. [Google Scholar] [CrossRef]
  11. Hasson, D.; Avriel, M.; Resnick, W.; Rozenman, T.; Windreich, S. Mechanism of Calcium Carbonate Scale Deposition on Heat-Transfer Surfaces. Ind. Eng. Chem. Fundam. 1968, 7, 59–65. [Google Scholar] [CrossRef]
  12. Gill, J.S.; Nancollas, G.H. Kinetics of growth of calcium sulfate crystals at heated metal surfaces. J. Cryst. Growth 1980, 48, 34–40. [Google Scholar] [CrossRef]
  13. Linnikov, O.D. Investigation of the initial period of sulphate scale formation Part 1. Kinetics and mechanism of calcium sulphate surface nucleation at its crystallization on a heat-exchange surface. Desalination 1999, 122, 1–14. [Google Scholar] [CrossRef]
  14. Linnikov, O.D. Investigation of the initial period of sulphate scale formation Part 2. Kinetics of calcium sulphate crystal growth at its crystallization on a heat-exchange surface. Desalination 2000, 128, 35–46. [Google Scholar] [CrossRef]
  15. Mwaba, M.G.; Rindt, C.C.M.; Van Steenhoven, A.A.; Vorstman, M.A.G. Experimental investigation of CaSO4 crystallization on a flat Plate. Heat Transf. Eng. 2006, 27, 42–54. [Google Scholar] [CrossRef]
  16. Kashchiev, D. On the relation between nucleation work, nucleus size, and nucleation rate. J. Chem. Phys. 1982, 76, 5098–5102. [Google Scholar] [CrossRef]
  17. Mersmann, A.; Eble, A.; Heyer, C. Crystal Growth. In Crystallization Technology Handbook; Mersmann, A., Ed.; Marcel Dekker, Inc.: New York, NY, USA, 2001. [Google Scholar]
  18. Mullin, J.W. Crystallization, 4th ed.; Butterworth-Heinemann: Oxford, UK, 2001. [Google Scholar]
  19. Jagadesh, D.; Kubota, N.; Yokota, M.; Sato, A.; Tavare, N.S. Large and mono-sized product crystals from natural cooling mode batch crystallizer. J. Chem. Eng. Jpn. 1996, 29, 865–873. [Google Scholar] [CrossRef] [Green Version]
  20. Lewis, A.E.; Seckler, M.; Kramer, H.J.M.; Rosmalen, G. Industrial Crystallization: Fundamentals and Applications; Cambridge University Press: Cambridge, UK, 2015. [Google Scholar]
  21. Doki, N.; Kubota, N.; Sato, A.; Yokota, M.; Hamada, O.; Masumi, F. Scaleup experiments on seeded batch cooling crystallization of potassium alum. AIChE J. 1999, 45, 2527–2533. [Google Scholar] [CrossRef]
  22. Doki, N.; Kubota, N.; Yokota, M.; Chianese, A. Determination of critical seed loading ratio for the production of crystals of uni-modal size distribution in batch cooling crystallization of potassium alum. J. Chem. Eng. Jpn. 2002, 35, 670–676. [Google Scholar] [CrossRef]
  23. Wang, H.; Wang, D.; Li, Z.; Demopoulos, G.P. Solubility and scale prevention of gypsum in transportation pipes of well brine with salinities up to 5 M at temperature range of 278–298 K. Desalination Water Treat. 2012, 22, 78–86. [Google Scholar] [CrossRef] [Green Version]
  24. Liu, S.T.; Nancollas, G.H. The kinetics of crystal growth of calcium sulfate dihydrate. J. Cryst. Growth 1970, 6, 281–289. [Google Scholar] [CrossRef]
  25. Doki, N.; Kubota, N.; Sato, A.; Yokota, M. Effect of cooling mode on product crystal size in seeded batch crystallization of potassium alum. Chem. Eng. J. 2001, 81, 313–316. [Google Scholar] [CrossRef]
  26. Aspeling, B.J.; Chivavava, J.; Lewis, A.E. Selective salt crystallization from a seeded ternary eutectic system in Eutectic Freeze crystallization. Sep. Purif. Technol. 2020, 248, 117019. [Google Scholar] [CrossRef]
  27. Randall, D.G.; Nathoo, J.; Lewis, A.E. Seeding for selective salt recovery during eutectic freeze crystallization. In Proceedings of the International Mine Water Conference, Pretoria, South Africa, 19–23 October 2009. [Google Scholar]
  28. Randall, D.G. Development of a Brine Treatment Protocol Using Eutectic Freeze Crystallization. Ph.D. Thesis, University of Cape Town, Cape Town, South Africa, 2010. [Google Scholar]
  29. Randall, D.G.; Mohamed, R.; Nathoo, J.; Rossenrode, H.; Lewis, A.E. Improved calcium sulfate recovery from a reverse osmosis retentate using eutectic freeze crystallization. Water Sci. Technol. 2013, 67, 139–146. [Google Scholar] [CrossRef] [PubMed]
  30. Adams, J.F.; Papangelakis, V.G. Gypsum scale formation in continuous neutralization reactors. Can. Metall. Q. 2013, 39, 421–432. [Google Scholar] [CrossRef]
  31. Gainey, R.J.; Thorp, C.A.; Cadwallader, E.A. CaSO4 seeding prevents CaSO4 scale. Ind. Eng. Chem. 1963, 55, 39–43. [Google Scholar] [CrossRef]
  32. Oshchepkov, M.; Popov, K.; Kovalenko, A.; Redchuk, A.; Dikareva, J.; Pochitalkina, I. Initial stages of gypsum nucleation: The role of “nano/microdust”. Minerals 2020, 10, 1083. [Google Scholar] [CrossRef]
  33. Choi, J.Y.; Lee, T.; Cheng, Y.; Cohen, Y. Observed crystallization induction time in seeded gypsum crystallization. Ind. Eng. Chem. Res. 2019, 58, 23359–23365. [Google Scholar] [CrossRef]
  34. OLI Systems Inc. OLI Studio 10.0 User Guide; OLI Systems Inc.: Morris Plains, NJ, USA, 2020. [Google Scholar]
  35. MacAdam, J.; Parsons, S.A. Calcium carbonate scale formation and control. Environ. Sci. Bio Technol. 2004, 3, 11. [Google Scholar] [CrossRef]
  36. Ozbay, S.; Erbil, H.Y. Ice accretion by spraying supercooled droplets is not dependent on wettability and surface free energy of substrates. Colloids Surf. A Physicochem. Eng. Asp. 2016, 504, 210–218. [Google Scholar] [CrossRef]
  37. Nikoo, A.H.; Kalantariasl, A.; Malayeri, M.R. Propensity of gypsum precipitation using surface energy approach. J. Mol. Liq. 2020, 300, 112320. [Google Scholar] [CrossRef]
Figure 1. Batch crystallizer with cooled stainless-steel tubing suspended from the lid.
Crystals 12 00342 g001
Figure 2. Micrographs of the seed crystals. Scale bar = 100 µm in 4.2 (a) and 50 µm in 4.2 (b).
Crystals 12 00342 g002
Figure 3. Crystal size distribution of gypsum seed crystals.
Crystals 12 00342 g003
Figure 4. Micrographs of a scaled tube after running the experiment for 4 h. Scale bar = 100 µm (a), 50 µm (b) and 20 µm (c) respectively.
Crystals 12 00342 g004
Figure 5. Mass of gypsum scale deposited on the stainless-steel tube as a function of time.
Crystals 12 00342 g005
Figure 6. Micrographs of a scaled tube after running the experiment for 48 h. Scale bar = 100 µm (a), 50 µm (b) and 20 µm (c) respectively.
Crystals 12 00342 g006
Figure 7. CaSO4 concentration in solutions as a function of gypsum seed loading.
Crystals 12 00342 g007
Figure 8. Seed loading against mass of gypsum scale deposited on the tube and mass of gypsum crystallized in the bulk solution.
Crystals 12 00342 g008
Figure 9. Seed loading against mass of gypsum scale deposited on the tube.
Crystals 12 00342 g009
Figure 10. Total mass of gypsum crystallized as a function of gypsum seed loading.
Crystals 12 00342 g010
Figure 11. Micrographs of the scaled tube (a) control experiment, (b) CS = 0.04 g/L , (c) CS = 0.25 g/L, (d) CS = 0.50 g/L, (e) CS = 1.0 g/L. Scale bar = 100 µm.
Crystals 12 00342 g011
Figure 12. Normalized gypsum scale growth rate as a function of seed loading.
Crystals 12 00342 g012
Figure 13. Micrographs of the solid suspension at the end of the experiment (a) control experiment, (b) CS = 0.04 g/L, (c) CS = 0.25 g/L (d) CS = 0.50 g/L, and (e) CS = 2.01 g/L. Scale bar = 100 µm.
Crystals 12 00342 g013
Publisher’s Note: MDPI stays neutral with regard to jurisdictional claims in published maps and institutional affiliations.

