Article

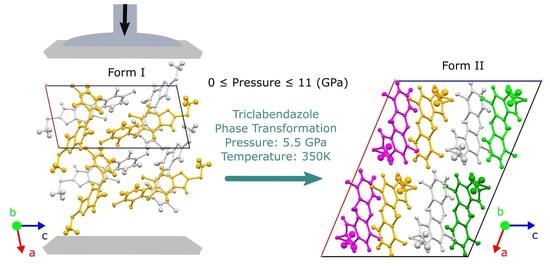
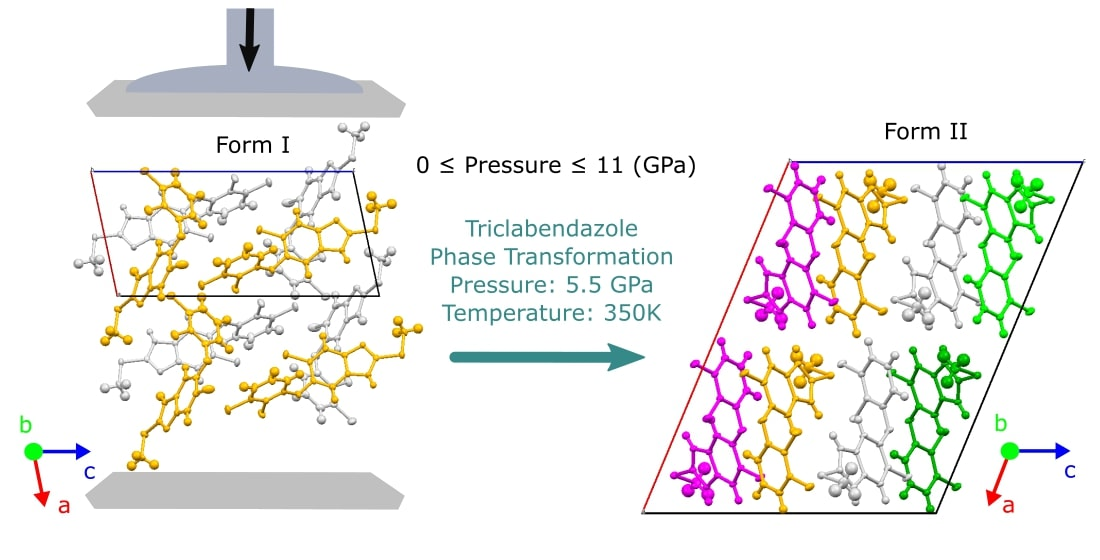
A Solid-Solid Phase Transformation of Triclabendazole at High Pressures

1
Shanghai Key Laboratory of Maternal Fetal Medicine, Shanghai First Maternity and Infant Hospital, School of Medicine, Tongji University, Shanghai 200092, China
2
Key Laboratory for Thin Film and Microfabrication of Ministry of Education, Department of Micro/Nano Electronics, School of Electronic Information and Electrical Engineering, Shanghai Jiao Tong University, Shanghai 200240, China
*
Authors to whom correspondence should be addressed.
Crystals 2022, 12(2), 300; https://doi.org/10.3390/cryst12020300
Submission received: 14 December 2021 / Revised: 24 January 2022 / Accepted: 28 January 2022 / Published: 21 February 2022
(This article belongs to the Special Issue Computational and Experimental Approaches in Pharmaceutical Crystals)

Abstract

:
Triclabendazole is an effective medication to treat fascioliasis and paragonimiasis parasitic infections. We implemented a reliable quantum mechanical method which is density functional theory at the level of ωB97XD/6-31G* along with embedded fragments to elucidate stability and phase transition between two forms of triclabendazole. We calculated crystal structure parameters, volumes, Gibbs free energies, and vibrational spectra of two polymorphic forms of triclabendazole under different pressures and temperatures. We confirmed form I was more stable than form II at atmospheric pressure and room temperature. From high-pressure Gibbs free energy computations, we found a pressure-induced phase transformation between form I (triclinic unit cell) and form II (monoclinic unit cell). The phase transition between forms I and II was found at a pressure and temperature of 5.5 GPa and ≈350 K, respectively. In addition, we also studied the high-pressure polymorphic behavior of two forms of triclabendazole. At the pressure of 5.5 GPa and temperature from ≈350 K to 500 K, form II was more stable than form I. However, at temperatures lower than ≈350 K, form I was more stable than form II. We also studied the effects of pressures on volumes and Raman spectra. To the best of our knowledge, no such research has been conducted to determine the presence of phase transformation between two forms of triclabendazole. This is a case study that can be applied to various polymorphic crystals to study their structures, stabilities, spectra, and phase transformations. This research can assist scientists, chemists, and pharmacologists in selecting the desired polymorph and better drug design.

Graphical Abstract

1. Introduction

Fascioliasis, known as liver fluke disease, is a water- and food-borne zoonotic disease caused by two parasite species of Fasciola: the Fasciola hepatica and Fasciola gigantica [1]; it affects a large number of animals, predominantly goats, sheep, and cattle [2]. Human fascioliasis is mainly caused by consuming wild aquatic which is categorized as a plant or food-borne parasitic infection [3]. According to the WHO, fascioliasis is a parasitic neglected tropical disease [4]. Over the past two decades, human fascioliasis obtained significance as an essential parasitic infection in humans [3]. The common occurrence of human fascioliasis is due to frequent intake of metacercaria encysted vegetables or through contaminated water, especially in Bolivia, Peru, Cuba, China, Iran, Vietnam, and Egypt [5]. Human fascioliasis has become a serious concern due to nearly 2.5 million people being infected all around the world, and approximately 180 million are at risk [2]. Moreover, estimations claim the rise of affected peoples from 2 million, up to 17 million peoples, or even higher, which depends on unknown situations in Asia and Africa [2]. Triclabendazole (TCBZ) is a benzimidazole anthelmintic that has a specific flukicidal effect in small and large domestic ruminants against mature and immature stages of Fasciola gigantica and Fasciola hepatica [6]. Over two decades, TCBZ has been used as the only drug of choice in treating liver fluke diseases in livestock and recently has been used successfully to treat humans affected by fascioliasis [7]. TCBZ has been used in many parts of the world after its approval in Egypt and France in 1997 and 2002, respectively [8]. More recently, the US Food and Drug Administration (FDA) approved TCBZ to treat human fascioliasis [9]. The synthesis of TCBZ was reported in a US patent, No. 4,197,307, with the melting point given as 175–176 °C (form I), however, polymorphic information was not provided [10]. Kuhnert-Brandsttter and Porsche reported two polymorphic phases of TCBZ, Mod. I and Mod. II, having melting points of 174–176 °C and 164–166 °C, respectively, obtained by melt-film preparations [11]. Tothadi et al. demonstrated polymorphic forms of TCBZ in detail, and also presented experimental observations of FT-IR for forms I and II [12]. Tothadi et al. described the unit cell of form I, consisting of tautomer A only in two dissimilar conformations, whereas form II was a mixture of tautomers A and B with a ratio equal to 1:1 [12]. Therefore, the polymorph of TCBZ is complex and unique in the sense that it allows the co-existence of conformational and tautomeric forms in the polymorphs. As they have different compositions, the crystal phases of TCBZ may possess different chemical and physical properties, which are currently considered a serious issue by the pharmaceutical industries and its regulatory bodies, as these dissimilarities may affect the critical aspects of the drug, such as solubility and bioavailability [13]. Therefore, to avoid such occurrences, it is essential to study and identify such physical conditions where phase transformation between two forms of TCBZ occurs. Moreover, it was discovered during a Food and Drug Administration (FDA) application in the United States for TCBZ as an investigational new drug that polymorphic forms could significantly affect the drug’s solubility [13]. Thus, it is essential to observe the behavior of each form under different environmental and physical conditions, especially at different temperatures and pressures. Previously, no such study has been conducted to determine the phase transition of TCBZ under high pressures.
Here, we utilized a computational method to find phase transitions between two forms of TCBZ. Ab initio computations were performed at different pressures to calculate Gibbs free energy in a temperature range from 0 K to 500 K, with a step size of 1 K [14]. The advanced machinery reported here enabled ab initio computations of Gibbs free energy of general pharmaceutical crystals at finite temperatures and pressures, which might help in finding phase transformation. We implemented density functional theory (DFT) at the level of the ωB97XD/6-31G* functional to optimize crystal structures [15]. Drug molecules are generally large in molecular size; the traditional ab initio computational method is not applicable to such large molecules. Hence, we utilized the quantum mechanical method with embedded fragmentation [16,17,18,19]. It is a method that divides the internal energy of a TCBZ crystal per unit cell into proper combinations of monomers and overlapping dimer energies that are embedded in the electrostatic field of the crystalline environment [20]. The embedded field, which is comprised of self-consistently determined atomic charges at the Hartree-Fock level, is an important method [21]. As the embedded fragment quantum mechanical method comprises one-body and two-body interactions, it can effectively treat large molecules/crystals, for example, pharmaceutical crystals [18]. Furthermore, quantum mechanics was used to compute the interaction energies between two fragments separated by a threshold distance, while charge-charge Coulomb interactions were used to compute the interaction energies between long-range interacting fragments [19].
The stabilities, volumes, Gibbs free energies, Raman, and IR spectra of two forms of TCBZ are studied under different pressures. The computation of the Gibbs free energy differences was successfully used to identify phase transformation among different forms of polymorphic crystals [15,21,22]. Our predicted results matched well with experimental results [12]. We utilized pressure ranges from 0 GPa to 11 GPa to identify stable polymorphs and phase transition between two forms of TCBZ. According to the calculation of the Gibbs free energy difference between two forms of TCBZ, we found phase transformation at a pressure and temperature of 5.5 GPa and ≈350 K, respectively. Moreover, we also calculated FT-IR spectra and compared them with experimental results. In the end, we presented Raman spectra under different pressures to study the effects of pressure on Raman spectra. This work can guide scientists to identify stable forms of polymorphic molecules and is also applicable to pharmaceutical and related subjects.

2. Methods

2.1. Structure Optimization and Energy Calculation

The crystal structure of TCBZ form I has only one tautomer, whereas form II has two tautomers [12]. Moreover, the supercell of TCBZ form II is very large since it contains 248 atoms and two different tautomers; our computational method can treat one tautomer at a time. To obtain results using the original structure of TCBZ form II, we need to treat both tautomers separately and then average the results of both tautomers. However, it would require double the amount of time and computational resources to complete this job. Furthermore, TCBZ form II reveals tautomerism because of facile hydrogen on the imidazole group [12]. These types of tautomers have slightly different energies [23]. Thus, considering only one tautomer would not significantly affect the results. Moreover, it would save time and computation costs. According to assumption, forms I and II of TCBZ contain tautomer A only, which can be seen in Figure 1a, Figures S1 and S2.
For crystal structure optimizations, we adopted a quasi-Newton algorithm [23]. Considering the molecular size of TCBZ and the number of molecules in the supercell, we employed the “embedded fragment method“ [24] with a DFT level of ωB97XD/6-31G* to calculate Gibbs free energy of TCBZ form I and form II. The Hessian matrix approximation was updated using the BFGS procedure [25] and the convergence criterion for the maximum gradient was set to 0.001 Hartree/Bohr. The embedded fragment method, as the name implies, is a process that breaks a large molecule into small fragments. As the embedded fragment method divides the total energy per unit cell of the crystal into an appropriate combination of the energies of monomers and dimers, it can therefore treat the macromolecules effectively [15]. The individual molecule is designated as a segment, and the interaction energies between two segments, in close contact with each other, are calculated by quantum mechanics. The interaction energy between the two distant segments is calculated according to Coulomb’s law of charge-charge interactions [14]. The DFT calculations, accounting for environmental influences, are embedded in an electrostatic field represented by the point charges of the remaining system. The internal energy ( T i ) of a unit cell for the molecular crystal system is calculated by:
T i = j T j 0 + j , k , j < k R j k λ T j 0 k 0 T j 0 T k 0 + 1 2 n = S S 1 δ n 0 j , k R j k λ T j 0 k n T j 0 T k n + T LR
where the three-integer index of a unit cell is represented by a variable ‘n’. The quantum mechanical energy of the jth molecules in the nth unit cell is represented by T j n . The quantum mechanical energy of dimers is represented by T j 0 k n , where j and k represent an index of molecules with respect to the 0th central unit cell and nth unit cell [14,26,27]. The crystal system is represented by a 3 × 3 × 3 supercell. The 1st part of Equation (1) calculates all the single molecular energies in the 0th unit cell, which is in the center. The 2nd part represents the two-body quantum mechanical interaction that has a shorter distance than λ (where λ is a given cutoff distance which is set to 4 Å in this work). The 3rd part of Equation (1) provides the interactions between one molecule in the central unit cell and the other in the nth unit cell whose distance is shorter than λ , where S = 1 is an index of the unit cell. Quantum mechanics is used to calculate short-range interactions (the first three parts in Equation (1)). It is calculated in the electrostatic field of the rest, where ωB97XD/6-31G* level is used to fit electrostatic potential variations. The background charges are represented by the 11 × 11 × 11 supercell [14]. The Coulomb’s charge-charge interactions are employed to approximately treat long-range interactions between two molecules of dimers whose distance is larger than λ . The long-range electrostatic interactions are represented by T LR in a 41 × 41 × 41 supercell [14]. All quantum mechanical calculations were performed by the Gaussian09 program [28]. The enthalpy ( E t h ) for each unit cell can be calculated by considering the effect of external pressure as follows:
E t h = T i + P V
where the internal energy, external pressure, and unit cell volume are denoted by T i , P and V , respectively.
U v = 1 K n k ω n k 1 2 + 1 e β ω n k 1
S v = 1 β T K n k β ω n k e β ω n k 1 l n 1 e β ω n k
E f r e e = E t h + U v T S v
The U v is the internal energy of phonons, calculated using harmonic approximation which is given in Equation (3). The entropy ( S v ) is given in Equation (4), where the frequency of phonon with lattice vector k is represented by ω n k . β = 1 / k 0 T and k 0 is the Boltzmann constant. The capital K is the product of all k, which are evenly spaced grid points in the reciprocal unit cell. The k-grid of 21 × 21 × 21 has been used in this study, where K = 9 , 261 . The calculation of Gibbs free energy ( E f r e e ) with effects of temperature and pressure in a unit cell is given by Equation (5). We employed DFT/ωB97XD/6-31G* to optimize crystal structure as well as to calculate enthalpy ( H t h ), the internal energy of phonons ( U v ), and entropy ( S v ).

2.2. Computation of Raman Spectra

For a periodic molecular system, the dynamical matrix, D, in terms of the force constant matrix, H, is given below, which is explained in detail somewhere else [29].
D r p , r q , k = 1 m p m q n = R R H r p , 0 , r q , n e i k R n
where mp and mq represent masses of atoms p and q, respectively. The k denotes a Brillouin zone point that is known. At equilibrium geometry, the second order derivative of the total energy in a unit cell, that corresponds to atoms p and q in the 0th and the nth cells, is represented by H(rp,0, rq,n) in Equation (6). For quantum mechanical treatment, the number of nearby unit cells is truncated at R = 1, and the number of k-points in each dimension is set to 21. Solving the dynamic matrix D r p , r q , k yields the vibrational frequencies and normal modes of the periodic molecular systems. The activation of Raman and IR spectra is calculated by zone-center (k = 0) vibrations with nonzero intensities. The vibrational frequencies are calculated using the force-constant matrix D(0). As a result, we can calculate the IR intensity (In0) and Raman intensity (Rn0) for the fundamental transition of the mode in the nth phonon branch with wave vector k = 0, as revealed by the derivatives given below:
I n 0 i l , m , n μ i Q n 0 2
R n 0 3 2 i l   b , m , n α i i Q n 0 2 + 21 2 i l , m , n j l , m , n α i j Q n 0 2
where Qn0 represents the corresponding normal mode. The embedded fragment and quantum mechanical method can be used to drive derivatives of the dipole moment μ i / Q n 0 and the polarizability α i j / Q n 0 in the central unit cell.

3. Results and Discussion

The crystal structure parameters for TCBZ form I and form II were taken from the Cambridge Structural Database with CSD refcodes of CARSOF [12] and CARSUL [12], respectively. The TCBZ form I with the space group of P-1, has a triclinic unit cell and a volume of 1499.1 Å3. TCBZ form II with a space group of C 2/c has a monoclinic unit cell and a volume of 2872.2 Å3. The molecular structure of TCBZ is given in Figure 1a. TCBZ reveals tautomerism due to the facile hydrogen, which migrates on the imidazole moiety [13], as shown in Figure 1. In other words, imidazole group has two N atoms, one of which will have a double bond whereas another N atom will possess a single bond, and this double bond is rotating. Tothadi et al., studied the unit cell of TCBZ form I which comprised of tautomer A only in two unlike conformations, whereas form II was a mixture of tautomers A and B with a ratio equal to 1:1 [12]. However, in our computation, we assumed both forms (I and II) have only one tautomer, which is tautomer A. Figure 1b represents the crystal packing of two forms of TCBZ along the a-axis, b-axis, and c-axis. The detailed comparison of observed/experimental and calculated crystal structures at atmospheric and high pressure (5.5 GPa) are provided in the supporting information (SI); see Figures S1 and S2. In addition, we also compared the H–N bond length; the average H–N bond length of experimental [12] form I was ≈0.87 Å, however, from our computational results, the average H–N bond length of form I at atmospheric pressure was ≈1.03 Å. This difference in N–H bond length may be because of the difference between experimental and predicted crystal structures. Moreover, at a pressure of 5.5 GPa, the average bond length of H–N increased to ≈1.04 Å, which may be because of the lower density of form I [12]. For form II of TCBZ, the average H–N bond length from the experimental [12] crystal structure was obtained as ≈0.89 Å, however, from our computation, it was ≈1.011 Å. Moreover, at a pressure of 5.5 GPa, the average bond length of H–N remained the same, which may be because of the higher density of form II [12]. In addition, as we assumed both forms contain only one type of tautomer (tautomer A), therefore, our calculated structures also contain only one type of tautomer at both atmospheric and high pressures. Crystal structure diagrams for both forms at atmospheric and high pressures are given in Figures S1 and S2. The comparison of observed [12] and computed crystal structure parameters for both forms at atmospheric pressure was given in Table 1, where we kept angles fixed. Moreover, crystal structure parameters of both forms calculated under higher pressures are given in Table S1.

3.1. Pressure Dependence of Volume

We calculated crystal structure parameters of TCBZ form I and form II at variable pressures. The crystal structure parameters were optimized at a temperature of 0 K and the pressure was varied from 0 GPa to 11 GPa with a step size of about 2 GPa. In addition, we selected a smaller step size where we expected phase transformation. The most important property to observe for a crystal studied under pressure is the change in volume. Figure 2 shows the change in volume with respect to pressure for both forms of TCBZ. We can observe that as pressure increases, the volumes of both forms decrease almost similarly, as shown in Figure 2. Moreover, a comparison of crystal structure parameters and volumes of both forms calculated at atmospheric and higher pressures are given in Table S1.

3.2. Gibbs Free Energy Difference

From our results of the Gibbs free energy difference, we can observe pressure-induced phase transition between form I and form II of TCBZ. At 0 K and atmospheric pressure, the difference of Gibbs free energy between form I and form II is positive which means form II is less stable than form I. Moreover, the Gibbs free energy difference at these conditions is about 35 kJ/mol, which is not so high. We can achieve this gap of Gibbs free energy by means of increasing pressures. We found phase transformation at a pressure and temperature of 5.5 GPa and ≈350 K, respectively. From 0 Gpa up to 5 Gpa, form II is less stable than form I in the temperature range studied (0–500 K). However, at 6 GPa, form I becomes less stable than form II in the temperature range studied. Moreover, at an external pressure of 5.5 GPa, form II is less stable than form I at a temperature less than ≈350 K, however, at a temperature higher than ≈350 K, form I is less stable than form II (Figure 3). In addition, we also calculated Gibbs free energies at 7 GPa and 11 GPa, where form II is more stable than form I in the temperature range studied; see Figure S3. The computation of phase transformation at different temperatures and pressures enabled us to make a full phase diagram with temperature and pressure ranges from 0 to 500 K and 1 atm to 11 GPa, respectively. Moreover, TCBZ has two tautomers originally [12] but we considered only one tautomer for TCBZ form II. This assumption may affect our results slightly [30].

3.3. Vibrational Spectra

The vibrational spectra have been used to accurately identify phase transition and other structural changes [31]. Moreover, vibrational spectra can be used as a fingerprint to distinguish it from other crystals and polymorphs. Raman and IR spectra are calculated at a temperature of 0 K.

3.3.1. FT-IR Spectra

We predicted IR spectra and compared them with experimental [12] results. FT-IR spectra for forms I and II were calculated at atmospheric pressure and 0 K temperature, whereas observed spectra were performed at atmospheric pressure and room temperature. Figure 4a shows FT-IR spectra of TCBZ form I at wavenumbers from 1100 to 1650 cm−1, where purple and green colors represent experimental [12] and calculated results. We predicted FT-IR peaks with nos. 1–8 very well, however, agreement for peak nos. 2* and 3* are not as good; see Figure 4a. For FT-IR spectra of TCBZ form I at wavenumbers from 2600 to 3700 cm−1, where purple and green curves represent experimental [12] and calculated results, see Figure 4b. As we can see from Figure 4, observed [12] and calculated results match fairly well.
Figure 5a shows FT-IR spectra of TCBZ form II at wavenumbers from 1100 to 1650 cm−1, where purple and green curves represent experimental [12] and calculated results. We predicted FT-IR peaks with nos. 1–9 very well, however, our calculation could not resolve peaks nos. 6 and 6*, yielding only one peak no. 6. Figure 5b shows the FT-IR spectra of TCBZ form II at wavenumbers from 2600 to 3700 cm−1, where purple and green curves represent experimental [12] and calculated results. We predicted FT-IR peaks with no. 1–3 fairly well.

3.3.2. Raman Spectra Calculation

Calculated Raman spectra of TCBZ are given in Figure 6. As we were not able to find experimental Raman spectra for TCBZ forms I and II, here we provide a comparison of Raman spectra computed for the two forms at different pressures. At atmospheric pressure, form I with purple color curve and form II with blue color curve show five and three characteristic peaks, respectively. Raman spectra under the pressure of 5.5 GPa for forms I and II are presented with green and yellow colors, respectively. At 5.5 GPa pressure, form I showed a reduction in the number of peaks. At atmospheric pressure, form I showed five peaks and at 5.5 GPa, it showed three peaks only, with a broadened peak (labeled with “3”). As both forms showed changes in Raman spectra under high pressures, this means there is an effect of pressure on the crystal structures of both forms.

4. Conclusions

Polymorph control is highly desirable for all pharmaceutical industries that manufacture and/or use crystalline products. This will allow us to improve the functionality of the products. In this paper, we calculated pressure-dependent crystal structures, Gibbs free energies, and compared stabilities of two forms of TCBZ, based on the DFT and embedded fragment method. We found phase transformation between form I and form II of TCBZ at a pressure and temperature of 5.5 GPa and ≈350 K, respectively. In addition, we studied IR spectra and compared them with experimental results. Moreover, we also provided Raman spectra at atmospheric and high pressure (5.5 GPa). As two forms of TCBZ have different chemical and physical properties that can cause serious issues, this has been considered by the pharmaceutical industries and regulatory authorities. By knowing and avoiding such environmental conditions (i.e., temperatures and pressures) which may lead a form to transform to another form, one can avoid critical aspects of the drugs. Thus, these findings are playing very important roles in designing, manufacturing, packing, transporting, and storing the TCBZ drugs. This study can be applied to any other polymorphs to study their polymorphic behavior under different physical conditions.

Supplementary Materials

The following supporting information can be downloaded at: https://www.mdpi.com/article/10.3390/cryst12020300/s1, Table S1. The calculated and experimental crystal structures of triclabendazole forms I and II at different pressures. Figure S1. Experimental (red) and calculated (green) crystal structures of TCBZ form I. (a) shows overlay of experimental and predicted crystal structures at atmospheric pressure. (b) shows overlay of experimental at atmospheric pressure and computed structure at 5.5 GPa. Figure S2. Experimental (red) and calculated (cyan) crystal structures of TCBZ form II. (a) shows overlay of experimental and predicted crystal structures at atmospheric pressure. (b) shows overlay of experimental at atmospheric pressure and computed structure at 5.5 GPa. Figure S3. Calculated Gibbs free energy differences between TCBZ forms I and II at different pressures with respect to temperatures from 0 K to 500 K.

Author Contributions

Conceptualization, J.L.; methodology, I.A. and J.T.; software, Y.H. and I.A.; validation, Z.W., Y.Z. and J.L.; formal analysis, I.A.; investigation, I.A., Y.H. and J.L.; resources, Z.W., Y.Z. and J.L.; data curation, I.A., J.T. and Y.H.; writing—original draft preparation, I.A.; writing—review and editing, Y.H. and J.L.; visualization, I.A.; supervision, J.L.; project administration, J.L.; funding acquisition, J.L. All authors have read and agreed to the published version of the manuscript.

Funding

National Key R&D Program of China (No. 2021YFC2100100); National Natural Science Foundation of China (Nos. 21901157, 81901069); Shanghai Science and Technology Project of China (No. 21JC1403400); and SJTU Global Strategic Partnership Fund (2020 SJTU-HUJI).

Institutional Review Board Statement

Not applicable.

Informed Consent Statement

Not applicable.

Data Availability Statement

The data of generating the structures in this study are available from the corresponding author upon reasonable request.

Acknowledgments

The authors are grateful for the financial support provided by the National Key R&D Program of China (No. 2021YFC2100100), the National Natural Science Foundation of China (Nos. 21901157, 81901069), the Shanghai Science and Technology Project of China (No. 21JC1403400), and the SJTU Global Strategic Partnership Fund (2020 SJTU-HUJI).

Conflicts of Interest

The authors have no relevant financial or non-financial interest to disclose.

References

  1. Mas-Coma, S.; Valero, M.A.; Bargues, M.D. Chapter 2 Fasciola, Lymnaeids and Human Fascioliasis, with a Global Overview on Disease Transmission, Epidemiology, Evolutionary Genetics, Molecular Epidemiology and Control. In Advances in Parasitology; Elsevier: Amsterdam, The Netherlands, 2009; Volume 69, pp. 41–146. ISBN 978-0-12-374795-2. [Google Scholar]
  2. Ashrafi, K.; Bargues, M.D.; O’Neill, S.; Mas-Coma, S. Fascioliasis: A Worldwide Parasitic Disease of Importance in Travel Medicine. Travel Med. Infect. Dis. 2014, 12, 636–649. [Google Scholar] [CrossRef] [PubMed]
  3. Mas-Coma, S.; Valero, M.A.; Bargues, M.D. Fascioliasis. In Digenetic Trematodes; Toledo, R., Fried, B., Eds.; Advances in Experimental Medicine and Biology Book Series; Springer International Publishing: Cham, Switzerland, 2019; Volume 1154, pp. 71–103. ISBN 978-3-030-18615-9. [Google Scholar]
  4. Duthaler, U.; Smith, T.A.; Keiser, J. In Vivo and In Vitro Sensitivity of Fasciola hepatica to Triclabendazole Combined with Artesunate, Artemether, or OZ78. Antimicrob Agents Chemother 2010, 54, 4596–4604. [Google Scholar] [CrossRef] [PubMed] [Green Version]
  5. Mas-Coma, S.; Bargues, M.D.; Valero, M.A. Human Fascioliasis Infection Sources, Their Diversity, Incidence Factors, Analytical Methods and Prevention Measures. Parasitology 2018, 145, 1665–1699. [Google Scholar] [CrossRef] [PubMed] [Green Version]
  6. Takeba, K.; Fujinuma, K.; Sakamoto, M.; Miyazaki, T.; Oka, H.; Itoh, Y.; Nakazawa, H. Simultaneous Determination of Triclabendazole and Its Sulphoxide and Sulphone Metabolites in Bovine Milk by High-Performance Liquid Chromatography. J. Chromatogr. A 2000, 882, 99–107. [Google Scholar] [CrossRef]
  7. Fairweather, I. Triclabendazole: New Skills to Unravel an Old(Ish) Enigma. J. Helminthol. 2005, 79, 227–234. [Google Scholar] [CrossRef]
  8. Gandhi, P.; Schmitt, E.K.; Chen, C.-W.; Samantray, S.; Venishetty, V.K.; Hughes, D. Triclabendazole in the Treatment of Human Fascioliasis: A Review. Trans. R. Soc. Trop. Med. Hyg. 2019, 113, 797–804. [Google Scholar] [CrossRef] [PubMed] [Green Version]
  9. US Food and Drug Administration. Drug Trials Snapshots: EGATENS Food and Drug Administration. Drug Trials Snapshots: EGATEN. 2019. Available online: https://www.fda.gov/drugs/drug-trials-snapshots-egaten (accessed on 29 April 2019).
  10. Gallay, J.-J.; Kuhne, M.; Meyer, A.; Rechsteiner, O.; Schellenbaum, M. 2-Alkylthio-, 2-Alkylsulphinyl- and 2-Alkylsulfonyl-6-Phenylbenzimidazoles as Anthelmintic Agents. U.S. Patent 4,197,307, 10 April 1978. [Google Scholar]
  11. Kuhnert-Brandst, M. Contribution to polymorphism of drugs, 7 communication: Famotidine, flupirtine maleate, GYKI-51189,paxamate, propentofylline and triclabendazole. Sci. Pharm. 1990, 58, 55–67. [Google Scholar]
  12. Tothadi, S.; Bhogala, B.R.; Gorantla, A.R.; Thakur, T.S.; Jetti, R.K.R.; Desiraju, G.R. Triclabendazole: An Intriguing Case of Co-Existence of Conformational and Tautomeric Polymorphism. Chem. Asian J. 2012, 7, 330–342. [Google Scholar] [CrossRef] [PubMed]
  13. Salazar-Rojas, D.; Kaufman, T.S.; Maggio, R.M. A Comprehensive Approach toward Concomitant Triclabendazole Polymorphism in Pharmaceutical Products. J. Drug Deliv. Sci. Technol. 2021, 62, 102386. [Google Scholar] [CrossRef]
  14. Li, J.; Sode, O.; Voth, G.A.; Hirata, S. A Solid–Solid Phase Transition in Carbon Dioxide at High Pressures and Intermediate Temperatures. Nat. Commun. 2013, 4, 2647. [Google Scholar] [CrossRef]
  15. Tang, J.; Han, Y.; Ali, I.; Luo, H.; Nowak, A.; Li, J. Stability and Phase Transition Investigation of Olanzapine Polymorphs. Chem. Phys. Lett. 2021, 767, 138384. [Google Scholar] [CrossRef]
  16. He, X.; Zhu, T.; Wang, X.; Liu, J.; Zhang, J.Z.H. Fragment Quantum Mechanical Calculation of Proteins and Its Applications. Acc. Chem. Res. 2014, 47, 2748–2757. [Google Scholar] [CrossRef] [PubMed]
  17. Liu, J.; Qi, L.-W.; Zhang, J.Z.H.; He, X. Fragment Quantum Mechanical Method for Large-Sized Ion–Water Clusters. J. Chem. Theory Comput. 2017, 13, 2021–2034. [Google Scholar] [CrossRef] [PubMed]
  18. Han, Y.; Ali, I.; Wang, Z.; Cai, J.; Wu, S.; Tang, J.; Zhang, L.; Ren, J.; Xiao, R.; Lu, Q.; et al. Machine Learning Accelerates Quantum Mechanics Predictions of Molecular Crystals. Phys. Rep. 2021, 934, 1–71. [Google Scholar] [CrossRef]
  19. Hao, X.; Liu, J.; Ali, I.; Luo, H.; Han, Y.; Hu, W.; Liu, J.; He, X.; Li, J. Ab Initio Determination of Crystal Stability of Di-p-Tolyl Disulfide. Sci. Rep. 2021, 11, 7076. [Google Scholar] [CrossRef]
  20. Hao, X.; Liu, J.; Luo, H.; Han, Y.; Hu, W.; Liu, J.; Li, J.; He, X. Crystal Structure Optimization and Gibbs Free Energy Comparison of Five Sulfathiazole Polymorphs by the Embedded Fragment QM Method at the DFT Level. Crystals 2019, 9, 256. [Google Scholar] [CrossRef] [Green Version]
  21. Luo, H.; Hao, X.; Gong, Y.; Zhou, J.; He, X.; Li, J. Rational Crystal Polymorph Design of Olanzapine. Cryst. Growth Des. 2019, 19, 2388–2395. [Google Scholar] [CrossRef]
  22. Luo; Liu; He; Li Low-Temperature Polymorphic Transformation of β-Lactam Antibiotics. Crystals 2019, 9, 460. [CrossRef] [Green Version]
  23. Dennis, J.E., Jr.; Moré, J.J. Quasi-Newton Methods, Motivation and Theory. SIAM Rev. 1977, 19, 46–89. [Google Scholar] [CrossRef] [Green Version]
  24. Beran, G.J.O. Modeling Polymorphic Molecular Crystals with Electronic Structure Theory. Chem. Rev. 2016, 116, 5567–5613. [Google Scholar] [CrossRef]
  25. Head, J.D.; Zerner, M.C. A Broyden—Fletcher—Goldfarb—Shanno Optimization Procedure for Molecular Geometries. Chem. Phys. Lett. 1985, 122, 264–270. [Google Scholar] [CrossRef]
  26. Liu, J.; He, X. Accurate Prediction of Energetic Properties of Ionic Liquid Clusters Using a Fragment-Based Quantum Mechanical Method. Phys. Chem. Chem. Phys. 2017, 19, 20657–20666. [Google Scholar] [CrossRef] [PubMed]
  27. Liu, J.; He, X.; Zhang, J.Z.H.; Qi, L.-W. Hydrogen-Bond Structure Dynamics in Bulk Water: Insights from Ab Initio Simulations with Coupled Cluster Theory. Chem. Sci. 2018, 9, 2065–2073. [Google Scholar] [CrossRef] [PubMed] [Green Version]
  28. Frisch, M.J.; Trucks, G.W.; Schlegel, H.B.; Scuseria, G.E.; Robb, M.A.; Cheeseman, J.R.; Scalmani, G.; Barone, V.; Mennucci, B.; Petersson, G.A.; et al. Gaussian 09 Citation; Gaussian, Inc.: Wallingford, CT, USA, 2009. [Google Scholar]
  29. Han, Y.; Liu, J.; Li, J. Molecular Structure Determination of Solid Carbon Dioxide Phase IV at High Pressures and Temperatures Based on Møller-Plesset Perturbation Theory. Int. J. Quantum Chem. 2020, 120, e26397. [Google Scholar] [CrossRef]
  30. Ramírez, F.J.; Tuñón, I.; Collado, J.A.; Silla, E. Structural and Vibrational Study of the Tautomerism of Histamine Free-Base in Solution. J. Am. Chem. Soc. 2003, 125, 2328–2340. [Google Scholar] [CrossRef]
  31. Manimunda, P.; Syed Asif, S.A.; Mishra, M.K. Probing Stress Induced Phase Transformation in Aspirin Polymorphs Using Raman Spectroscopy Enabled Nanoindentation. Chem. Commun. 2019, 55, 9200–9203. [Google Scholar] [CrossRef]
Figure 1. Crystal structures of a triclabendazole molecule. (a) Molecular structure of triclabendazole, where the cyan, gray, green, red, purple, and yellow-colored spheres represent H, C, Cl, O, N, and S atoms, respectively. (b) TCBZ crystal structures of forms I and II with molecular arrangements in the a-axis, b-axis, and c-axis, where molecules were colored by the operation of symmetry.
Crystals 12 00300 g001
Figure 2. Pressure-dependent volume changes of TCBZ form I (blue curve) and form II (orange curve) at 0 K temperature.
Crystals 12 00300 g002
Figure 3. Gibbs free energy differences as a function of temperature for forms I and II. The green, sky-blue, orange, yellow, and blue curves represent pressures of 0.0001 GPa (atmospheric pressure), 1 GPa, 5 GPa, 5.5 GPa, and 6 GPa, respectively. The phase transformation occurs at a pressure and temperature of 5.5 GPa and ≈350 K, respectively.
Crystals 12 00300 g003
Figure 4. FT-IR spectra of triclabendazole form I at frequencies (a) from 1100 cm−1 to 1600 cm−1 and (b) from 2600 cm−1 to 3600 cm−1. The purple curve represents experimental (Exp.) results [12] which were conducted at atmospheric pressure and room temperature. The green curve represents calculated (Cal.) results, which were obtained at atmospheric pressure and a temperature of 0 K.
Crystals 12 00300 g004
Figure 5. FT-IR spectra of triclabendazole form II at frequencies (a) from 1100 cm−1 to 1600 cm−1 and (b) from 2600 cm−1 to 3600 cm−1. The purple curve represents experimental (Exp.) results [12] which were conducted at atmospheric pressure and room temperature. The green curve represents calculated (Cal.) results, which were obtained at atmospheric pressure and a temperature of 0 K.
Crystals 12 00300 g005
Figure 6. Calculated Raman spectra of triclabendazole form I and form II. The purple and blue curves show form I and form II at atmospheric pressure, whereas green and yellow curves show forms I and II at 5.5 GPa external pressure.
Crystals 12 00300 g006
Table 1. Comparison between experimental and calculated crystal structure parameters of form I and form II of TCBZ.
ParametersExp. Form I [12]DFT Form IExpt. Form II [12]DFT Form II
a (Å)9.6589.63221.27721.282
b (Å)10.18310.1848.8968.891
c (Å)17.77517.69416.44716.725
Publisher’s Note: MDPI stays neutral with regard to jurisdictional claims in published maps and institutional affiliations.

