Article

Natural Porous Carbon Derived from Popped Rice as Anode Materials for Lithium-Ion Batteries

by
Ruttapol Boonprachai
1,
Thanapat Autthawong
1,2,
Orapim Namsar
1,
Chawin Yodbunork
1,
Waewwow Yodying
1 and
Thapanee Sarakonsri
1,2,3,*
1
Department of Chemistry, Faculty of Science, Chiang Mai University, Chiang Mai 50200, Thailand
2
Material Science Research Center, Faculty of Science, Chiang Mai University, Chiang Mai 50200, Thailand
3
Center of Excellence for Innovation in Chemistry (PERCH-CIC), Chiang Mai University, Chiang Mai 50200, Thailand
*
Author to whom correspondence should be addressed.
Crystals 2022, 12(2), 223; https://doi.org/10.3390/cryst12020223
Submission received: 27 December 2021 / Revised: 31 January 2022 / Accepted: 2 February 2022 / Published: 3 February 2022

Abstract

:
Popped rice carbons (PC) were derived from popped rice by using a facile and low-cost technique. PC was then activated by different kinds of activating agents, such as potassium hydroxide (KOH), zinc chloride (ZnCl2), iron (III) chloride (FeCl3), and magnesium (Mg), in order to increase the number of pores and specific surface area. The phase formation of porous activated carbon (PAC) products after the activation process suggested that all samples showed mainly graphitic, amorphous carbon, or nanocrystalline graphitic carbon. Microstructure observations showed the interconnected macropore in all samples. Moreover, additional micropores and mesopores were also found in all PAC products. The PAC, which was activated by KOH (PAC-KOH), possessed the largest surface area and pore volume. This contributed to excellent electrochemical performance, as evidenced by the highest capacity value (383 mAh g−1 for 150 cycles at a current density of 100 mA g−1). In addition, the preparation used in this work was very simple and cost-effective, as compared to the graphite preparation. Experimental results demonstrated that the PAC architectures from natural popped rice, which were activated by an optimal agent, are promising materials for use as anodes in LIBs.

Graphical Abstract

1. Introduction

The growing demand for the usability of portable electronic devices (e.g., smartphones, cameras, laptops, medical devices, and other modern-life appliances), and the driving force of renewable energy industries and electric vehicles (EVs), can widely trigger research on batteries [1,2,3]. Lithium-ion batteries (LIBs) attract the most attention because the energy storage and working potential of LIBs are higher than those of other batteries. Moreover, LIBs have almost no memory effects and low amounts of environmental pollutants, which means they dominate the battery market [4]. The key to fabricating the collective potential of LIBs is almost determined by the performance of the electrode itself [5]. It is well known that graphitized carbon material is commercially used as negative electrodes in LIBs because of its high structural stability and reversibility. The regular distance between graphite planes can appropriately accommodate the size of Li+, which has the possibility to form stable Li intercalation due to the discharge–charge process [6,7]. Besides stability, commercial graphite has high conductivity, which can improve electrons and ions diffusion in the electrode. However, it has a limited theoretical capacity (372 mAh g−1) and high temperature in the synthesis process (more than 2500 °C). Pleasantly, the graphitization temperature is decreased by catalysts which can transform the amorphous carbon to graphitized carbon at a temperature of around 800–1000 °C [8,9]. Transition metals such as iron, cobalt, nickel, and magnesium have been widely studied in the catalytic graphitization process [10,11].
In addition to graphite, amorphous carbon and porous carbon materials appeal to researchers, owing to cost efficiency, environmental benefits, and sustainability. Amorphous carbon can be easily extracted at a low temperature from biomass materials (i.e., rice husk, bamboo leaves, pollen grains, cotton, etc., [12,13,14,15,16]), which have been widely studied in battery storage. On the other hand, porous carbon materials are also among the materials that are getting attention in battery applications, due to their porosity and high surface areas. These properties improved contact between the materials and the electrolytes, which led to a reduction of the distance the lithium ions must diffuse. This, in turn, resulted in a good-rate performance [12]. Moreover, porous carbons can obtain a higher capacity than graphitized carbon due to expanded interlayer distances and shortened ion transportation pathways [7]. Apart from battery applications, the carbonaceous- and porous-based materials have also been utilized in several applications, such as electrocatalysts and capacitors [17,18,19]. Commonly, the techniques of synthesized amorphous carbon are directly pyrolysis or hydrothermal treatment, which use lower temperatures than the techniques of synthesized graphite. Hemicellulose, cellulose, and lignin in biomass, can be decomposed to create porous structures at different temperatures. Biomass-derived carbon can keep natural-characteristic structures, such as the shape, tube and pore of each biomass. These structures have a significant impact on electrochemical performance [20]. Therefore, many researchers have begun to focus on the morphology of biomass-derived carbon to use as anode materials in LIBs. Recently, amorphous carbon materials with interconnected porous networks have been seen as promising candidates for various storage applications in the electrochemical energy community (i.e., lithium-ion batteries, sodium-ion batteries, and supercapacitors, etc. [21,22,23]). The special attractiveness of the interconnected porous networks is in the ability of mass mobilization and accessibility within porous structures [24]. The large mesopore content promotes ion transport and meso- and micropores support ion storage with increases of the local uptake rate of Li+ [25,26]. Therefore, activating agents (ZnCl2, H3PO4, KOH, K2CO3, and FeCl3, etc.) were used to improve pore content in carbon structures during the thermal treatment process [27,28,29].
H. Jianhua et al. [30] reported on the preparation of puffed rice carbon. The rice was chosen as a starting material source, which was converted into puffed rice by a heated pressure vessel in a closed container. The starch-containing materials were expanded, transforming into expanded porous-network materials, with a 10-fold increase of volume and surface area via the bombing process [24]. After being activated by KOH and thermal treatment, the puffed rice carbon with honeycomb-like macrostructures exhibited high specific surface areas (3326 m2 g−1) [30]. Interestingly, popped rice can be prepared by Thai local wisdom. It is used in various Thai ceremonies and can be easily prepared from paddy. The preparation of popped rice uses low temperatures for a few minutes in a pan. This process involves compression and the instantaneous release of the internal vapor pressure in the paddy. Using this method, the porous material can be easily received in a rapid process, which is clean and eco-friendly. This method is more convenient than a heated pressure vessel in a closed container and it is also easy to expand production capacity.
This research is a guideline for the material designing and structural optimization of high-performance porous carbon materials from biomass sources to cater to the increasing demands for energy that is eco-friendly. This article highlights the facile synthesis and development of porous carbon materials from paddy by using different types of activating agents. Their final characteristics and electrochemical performances were also investigated to evaluate the potential of these materials for use as anodes in LIBs.

2. Materials and Methods

2.1. Material Preparation

San-Pah-Tawng paddy was used as a raw material in this research, which was collected in Chiang Mai, Thailand. To prepare the popped rice carbon (PC), the paddy was first placed into the pot (Kashiwa, Chiba Prefecture, Japan, KW-378) and then was heated. After 1–2 min, the moisture in the paddy became a vapor that was collected within the hole of rice. When the pressure was suitable, it popped out of the pericarp to become the popped rice. After that, it was heated at 500 °C for 1 h with a heating rate of 5 °C min−1 under nitrogen flow to form popped rice carbon. After pre-calcination, it was mixed with different types of activating agents. The activating agents used in this work were potassium hydroxide (KOH; QRëC, 25%, AR grade, Selangor, Malaysia), zinc chloride (ZnCl2; Sigma-Aldrich, >98%, Reagent grade, MO, USA), Iron (III) chloride hexahydrate (FeCl3·6H2O; Sigma-Aldrich, Reagent grade, >98%, St. Louis, MO, USA), and magnesium powder (Mg; Sigma-Aldrich, 98%, Reagent grade, St. Louis, MO, USA). The ratio of the popped rice carbon: activating agent was 1:2 wt%. The KOH and ZnCl2 were prepared as solution in deionized (DI) water before it was stirred overnight while Mg and FeCl3 were directly mixed by mortar. The mixture products were dried at 100 °C overnight and then the activated products were thermally treated at 800 °C for 3 h with a heating rate of 5 °C min−1 under nitrogen gas flow. After the treatment process, all samples were soaked in 2 M hydrochloric acid (HCl; RCI Labscan, 37%, AR grade, Samutsakorn, Thailand) to rinse the activating agents. Finally, all products were again rinsed and neutralized with deionized water before being dried. All final products were collected and therefore can be labeled as PAC-KOH, PAC-ZnCl2, PAC-FeCl3, and PAC-Mg. All PAC products were then characterized in a comparison with non-activated PC sample.

2.2. Material Characterizations

Phase formation of the synthesized products was investigated by X-ray diffractometer (XRD; Rigaku Miniflex II desktop, Tokyo, Japan). Morphology and structure of the produced materials were examined using a scanning electron microscope (SEM; JEOL, JSM-IT300, Tokyo, Japan). To study the characteristic of crystal structure and graphitic degree, Raman spectra were operated by Raman spectrometer (Jobin Yvon Horiba, model T64000 triple monochromator, Palaiseau, France). The surface area and the pore size distribution were obtained using the Brunauer–Emmett–Teller (BET; Model Autosorb 1 MP Quantachrome, Boynton Beach, FL, USA) method and Barrett–Joyner–Halenda (BJH) theory.

2.3. Electrochemical Measurements

All the prepared samples were manufactured as CR 2016-type coin cells to examine the electrochemical performances. Working electrodes were made by combining synthetic sample, conductive Super-P (NCM HERSBIT Chemical Co. Ltd., Beijing, China), and sodium alginate (SA) binder (Loba Chemie, 91%, Food grade, Mumbai, India) in a weight ratio of 70:15:15 in DI water to create the homogeneous slurry. The mixed slurry was then cast on Cu-foil with a thickness of 150 µm and dried overnight in a vacuum oven at 80 °C to eliminate the solvent and moisture. The prepared electrodes were then trimmed into a 15 mm diameter circular to serve as an anode electrode. To avoid moisture and oxygen, the coin cell was built in an argon-filled glove box. A lithium metal chip was employed as the counter electrode in the coin cell construction. Both sides of the electrodes were separated using a polypropylene (PP; Celgard 2400, Xiamen TOB New Energy Technology Co., Ltd, Fujian, China) membrane, and then bathed in a 1 M lithium hexafluorophosphate (LiPF6) solution in 1:1 ethylene carbonate (EC)/dimethyl carbonate (DMC) (v/v) + 10% fluoroethylene carbonate (FEC) (Sigma Aldrich, Oakville, ON, Canada). The electrochemical measurements were examined in terms of galvanostatic discharge/charge and cycle stability for 150 cycles at a current density of 100 mA g−1 on a battery test system (Neware BTS-4000, Shenzhen, China), which fixed a cut-off voltage window of 0.01–3.00 V at room temperature.

3. Results

After the PC products were activated by different types of activating agents, the phase formations and structural characteristics of the activated PAC were first analyzed and compared to the non-activated PC, as shown in Figure 1a. The XRD pattern of the non-activated PC product showed two broadened peaks at 16°–32° and 37°–50°, which were assumed to be amorphous carbon or nanocrystalline graphite. When the PC product was activated by KOH and ZnCl2, it was observed that two broadened peaks were still detected, indicating that the amorphous carbon or nanocrystalline graphitic carbon still existed in both samples. Interestingly, the intensity of the broadening peaks located at 16°–32° of the PAC-KOH sample was much weaker and broader than that of the PAC-ZnCl2, which indicated a high derivative of d-spacing values in this sample. In the case of PAC-FeCl3 sample, the broadened peaks, and a little peak located at ~26° (corresponded to (002) of graphitic carbon [4]), were observed in the XRD pattern. This suggested the coexistence of amorphous carbon (or nanocrystalline graphite) and a low crystalline graphitic phase in this sample. The low crystalline graphitic phase in the PAC-FeCl3 sample was formed by catalytic graphitization, which occurred simultaneously during the activation process. The reason was because the FeCl3 can not only participate as an activating agent, but also act as a catalyst. According to a previous report by Xu et al. [31], FeCl3 could thermally decompose into iron (III) oxide (Fe2O3). The oxide product could be further reduced into iron (II, III) oxide (Fe3O4) by carbothermal reduction, as shown in Equations (1)–(3):
200–330 °C: FeCl3 + 2H2O → FeOOH + 3HCl
330–700 °C: 2FeOOH → Fe2O3 + H2O
6Fe2O3 + C → 4Fe3O4 + CO2
When the temperature increased to 700–800 °C, iron oxides would be reduced by carbon, which resulted in iron metal, as displayed in Equations (4)–(6). These reactions also induce pore formation in final products [32]:
700–800 °C: 2Fe2O3 + 3C → 4Fe + 3CO2
Fe3O4 + 2C → 3Fe + 2CO2
Fe3O4 + 4C → 3Fe + 4CO
The iron metal acted as the catalyst to convert amorphous carbon into graphitic carbon through iron carbide formation, then subsequently decomposed into iron and graphitic carbon [33]:
800 °C: 3Fe + C → Fe3C
Fe3C → 3Fe + C (graphitic carbon)
For the PAC-Mg product, two peaks located at ~26° and ~44°, of a low crystalline graphitic phase, were mainly observed. This result indicated that the Mg was a catalyst in the graphitization process, which could increase the graphitization degree in the carbon structure. During the thermal treatment process, amorphous carbon reacted with a metal catalyst to form metal carbides. The metal carbides can decompose to graphitic carbon and metal. The graphitization reactions by metal catalysts occurred as expressed in Equation (9) [32]:
M + C → MC (carbide) → graphitic carbon + M
After the activation process, the byproducts in this work were eliminated by acid treatment.
To further investigate the structural formation of the non-activated PC and PAC products, Raman spectroscopy was employed. Raman spectra of all five samples are shown in Figure 1b. It can be seen that the spectra of all five samples exhibited two obvious characteristic peaks located at ~1338 cm−1 and ~1583 cm−1, which corresponded to the disordered (D band) and graphitic (G band) structure of carbon [34,35]. According to the XRD results, the graphitic carbon peaks were found in PAC-Mg and PAC-FeCl3 samples. Moreover, graphitic materials displayed less broad D bands proportional to the sharpness of the graphitic peaks in the XRD patterns, which further confirmed the presence of the graphitic phase. Hence, the ID/IG of all samples were calculated to indicate the graphitization degree of the graphitic carbon material. Larger values of ID/IG referred to the lower graphitization degree [32]. The ID/IG values of non-activated PC, PAC-KOH, PAC-ZnCl2, PAC-FeCl3, and PAC-Mg samples were 1.90, 2.05, 2.02, 1.78, and 1.15, respectively. The ID/IG values of PAC-FeCl3 and PAC-Mg samples were lower than other PAC samples, suggesting that both samples exhibited a higher graphitization degree than other PAC samples, which was consistent with previous XRD results. For non-activated PC, PAC-KOH, and PAC-ZnCl2 which exhibited higher ID/IG values, it was clear that the D bands presented in Raman spectra were broader than that of the graphitic materials. The broadening of D bands indicated more variety of defects in amorphous carbon, which could be assumed to be the raw materials that were decomposed to create porous structures during the activation process [36]. However, the presence of the D band could also be generated from the edges of the graphitic planes. Therefore, it was also possible that the non-activated PC, PAC-KOH, and PAC-ZnCl2 materials possessed nanocrystalline characteristics [37,38].
The influence of the activating agents on the surface structure and micromorphology of the PC and PAC products can be investigated by the SEM technique. Figure 2 shows SEM images of non-activated PC, and the PAC samples. The non-activated PC sample showed the interconnected macropores with a pore diameter of ~10 µm. The macroporous networks were formed by the compression and instantaneous release of the internal vapor pressure in the paddy [24]. However, some interconnected macropores, which broke the carbon sheets into individual sheets, were also observed in the non-activated PC sample, as shown in Figure 2b. The sizes of the broken carbon sheets were in the range of 10–20 μm. Figure 2c–f shows SEM images of PAC-KOH, PAC-ZnCl2, PAC-FeCl3, and PAC-Mg samples, respectively. The PAC-KOH, PAC-ZnCl2, and PAC-FeCl3 samples showed a random distribution of pores in the macroporous networks. In addition, the agglomeration of spherical particles on the interconnected macropores is detected in the PAC-Mg sample. However, it is difficult to observe the resulting improvement in porosity (micropore and mesopore) from SEM images. Further studies to confirm the improvement will be discussed in the BET section.
The physical adsorption method of nitrogen gas was used to measure the specific surface area of all five samples, as shown in Figure 3a–e. In Figure 3a–e, the N2 adsorption-desorption isotherm of non-activated PC, PAC-FeCl3, and PAC-Mg were measured at 77 K. The measured adsorption isotherms of non-activated PC, PAC-FeCl3, and PAC-Mg can be classified as type IV (IUPAC classification) [39]. The initial part of this isotherm shows the formation of a monolayer adsorption, followed by a formation of a multilayer adsorption. However, the hysteresis of all three samples indicated adsorption and desorption from mesoporous materials. On the other hand, the measured adsorption isotherms of PAC-KOH and PAC-ZnCl2, which can be classified as type I (IUPAC classification), corresponded to the microporous adsorbent of activated carbon. Furthermore, the hysteresis in PAC samples indicated the capillary condensation of adsorption and desorption in mesoporous materials [40]. Table 1 also lists the surface areas and pore-structure parameters of the non-activated PC and PAC samples after using activating agents. When the PC was activated by KOH, ZnCl2, and FeCl3, the surface area was significantly increased from 56 m2 g−1 (non-activated PC) to 1695.58 m2 g−1 (PAC-KOH), 1677.66 m2 g−1 (PAC-ZnCl2) and 732.62 m2 g−1 (in PAC-FeCl3). However, the PAC-Mg sample had a surface area of 46.34 m2 g−1, which was lower than that of the non-activated sample. It can be seen that the PAC-KOH and PAC-ZnCl2 samples exhibited higher surface areas than PAC-FeCl3 and PAC-Mg. In addition to the effects of the strong activating agent, the different mixing methods between the activating agent and non-activated PC also played an important role in the increase of the surface area. The PAC-KOH and PAC-ZnCl2 samples used the mixing method in the solution, which was indirect precipitation. This indirect precipitation from the salt solution caused the activating agents to diffuse into the inside of the non-activated PC structure [41]. This, in turn, resulted in a good agent distribution and an increase of the contact area between the non-activated PC and activating agents in the activation process. The increase of the contact area contributed to more activation and higher surface areas in PAC samples. Meanwhile, the PAC-FeCl3 and PAC-Mg samples used the solid-state mixing method, the distribution of which depends on the particle sizes of activating agents [41]. From this limitation, the contacting area (between the non-activated PC and activating agents) in the solid-state mixing is lower than in the solution mixing. The reduction of the contact area led to a reduction of sites for activation. Because of the reasons above, the surface areas of the PAC-KOH and PAC-ZnCl2 samples were greatly improved compared to the PAC-FeCl3 and PAC-Mg samples. When considering pore density in terms of pore volume, it was found that the pore volume of all four activated samples increased compared to the non-activated sample (0.0720 cm3 g−1). The pore volume of PAC-KOH, PAC-ZnCl2, PAC-FeCl3, and PAC-Mg was 0.9442, 0.9364, 0.3725, and 0.1119 cm3 g−1, respectively. The pore volume in this study was directly proportional to the surface area of all PAC samples. Namely, the samples that had higher surface areas also had higher pore volumes. These experimental results revealed that the highest pore volume was achieved in the PAC-KOH sample, while the PAC-Mg sample possessed the lowest pore volume. This is because solid-state sintering by Mg could cause the pores to shrink and collapse. Consequently, the pores became spherical and isolated [41]. These effects led to the reduction of pore volume in the PAC-Mg sample.
These results indicated that KOH, ZnCl2, and FeCl3 can improve porosity in the carbon structure of PAC samples. The reaction mechanisms of the activation processes by KOH, ZnCl2, and FeCl3 were discussed as follows.
The reaction mechanisms of KOH were first described in Equation (10). During the activation process, carbon reacted with KOH to transform into carbonate ion and potassium carbonate (K2CO3), then both products intercalated in carbon. At high temperatures, K2CO3 decomposed to a carbon gasification of carbon dioxide (CO2), which advocated to form pores [42]:
6KOH + 2C → 2K + 3H2 + 2K2CO3
In the part of the activation processes by ZnCl2, the reaction mechanisms were described in Equations (11) and (12) [43,44]. The glycosidic bonds in the popped rice carbon structure were eliminated by ZnCl2, which acted as a strong dehydrating agent and a cutting catalyst. With increasing temperatures, the dehydration reactions and the cutting of biopolymer chains formed the slippage of the short polymer chains and promoted the formation of the fluid phase. Then, zinc oxide chloride hydrate (Zn2OCl2·2H2O) was obtained after ZnCl2 reacted with H2O:
CxHyOz + 2ZnCl2 → CxHy−6Oz−3 + Zn2OCl2·2H2O + 2HCl + Tar
At high temperatures, the Zn2OCl2·2H2O was decomposed to gasify ZnCl2. This gas could diffuse in the fluid phase to produce the micro- and mesopores:
Zn2OCl2·2H2O → ZnCl2 + ZnO + 2H2O
The reaction mechanisms of the activation processes by FeCl3 were described in Equations (13)–(18) [31,44]. When temperatures increased, FeCl3 decomposed to create iron oxyhydroxides (FeOOH), and then FeOOH decomposed to form Fe2O3. The carbon reacted with Fe2O3 to form Fe3O4 via a reduction reaction (Equations (13)–(15)):
FeCl3 + 2H2O → FeOCl·H2O + 2HCl → FeOOH + 3HCl
2FeOOH → Fe2O3 + H2O
3Fe2O3 + C → 2Fe3O4 + CO
At high temperatures, Fe2O3 and Fe3O4 acted as catalysts for the separation of adjacent carbon. Both catalysts reacted with carbon into low molecular weight gases, like carbon monoxide (CO) and CO2 (Equations (16)–(18)), favoring the formation of pores in the carbon structure:
2Fe2O3 + 3C → 4Fe + 3CO2
Fe3O4 + 2C → 3Fe + 2CO2
Fe3O4 + 4C → 3Fe + 4CO
After the activation and heat treatment process, the remaining activating agent in the PAC samples was removed by acid treatment.
Based on Table 1, the average pore size of all five samples was also investigated. It can be clearly seen that KOH and ZnCl2 were the strongest activating agents to create porous carbon structures, with an average pore size in the range of ~1.1 nm. In addition, FeCl3 can also create the porous structure with a similar pore size of ~1.0 nm, but its efficiency to create pores was lower than those of the KOH and ZnCl2 agents. Nevertheless, Mg can partially produce pores in the PAC structure, but the average pore size was relatively high (~4.8 nm).
The pore size distribution was explained in the terms of differential pore volume versus diameter (dV/dD) to present pore size distributions which were calculated through Equation (19) [45]:
d V d D = V i + 1 V i D i + 1 D i
The pore size distribution was evaluated by BJH theory (Figure 3f). From all samples, there existed a broad peak with a range from 1.5 to 5.0 nm. After the PC sample was activated by the activating agents, it can be found that the dV/dD peak intensity increased compared to the non-activated PC sample. The increase of dV/dD peak intensity indicated the increase in the number of pores. This suggested that the pore size of the non-activated PC sample was improved after activation processes. Furthermore, the samples PAC-KOH and PAC-ZnCl2 showed a sharp peak at around 1.5 nm. This sharp peak reflected that activating agents such as KOH and ZnCl2 can create a high content of micropores (<2 nm [46]). These obviously increased pores (micropores and mesopores) will improve ion transport and ion storage in electrochemical performances [26,47].
In order to estimate the performances of the PAC samples for use as anode materials in LIBs, the electrochemical performances of the PAC samples were investigated compared to the non-activated PC samples. Figure 4a–e shows the discharge/charge curves of the non-activated PC and the PAC electrodes at a constant current density of 100 mA g−1. In the first cycle, the specific discharge capacities of the non-activated PC, PAC-KOH, PAC-ZnCl2, PAC-FeCl3, and PAC-Mg were 841, 2008, 911, 1004, and 356 mAh g−1, respectively, and the specific charge capacities were 283, 775, 357, 355, and 221 mAh g−1, respectively. The first cycle was an irreversible capacity, which was caused by the formation of a solid electrolyte interface (SEI) and the decomposition of the electrolyte. Furthermore, the PAC-KOH electrodes delivered the highest initial capacities compared to the other products. This was mainly due to the effect of the surface area. As mentioned previously, the PAC-KOH possessed the largest surface area. The large surface area can provide more sites for SEI formation, leading to the high initial capacity in this sample [48]. The formation of the SEI layer in all samples was confirmed by the two plateaus at ~1.0 and ~1.5 V [49]. Moreover, the additional plateau at below 0.2 V was also observed in the first discharge curve of all samples. This indicated the reaction between carbon and lithium-ion [50], as shown in Equation (20) [1]:
LixC6xLi+ + xe + C6
Moreover, the peak below 1.75 V includes two overlapped processes of adsorption and insertion, which have important lithium storage forms in porous carbons [47]. After the 1st cycle, all plateaus were not observed in the discharge/charge profile of all samples. This suggested the SEI formation mainly occurred in the 1st cycle.
Figure 4f shows the cycling stability of all electrodes at a current density of 100 mA g−1. It can obviously be seen that the initial discharge capacities of all samples were higher than the later cycles. This was predominantly due to the formation of SEI, as discussed previously. For PAC-KOH and PAC-ZnCl2 electrodes, the capacity of both electrodes tended to continuously drop in the initial stage and then were fluctuated at higher cycle numbers. This fluctuation of cycle performance was ascribed to the amorphous nature of carbon [51]. Meanwhile, PAC-FeCl3 and PAC-Mg electrodes showed the reduction of capacity in the initial stage and then the capacity remained stable in the consequent cycles. This suggested that the PAC-FeCl3 and PAC-Mg electrodes exhibited more stability in the long-term cycling test. The stability of both electrodes was improved from the increased existence of graphite in both samples, which possessed properties of structural stability and reversibility in the Li+ insertion process [52].
At the 150th cycle, the non-activated PC, PAC-KOH, PAC-ZnCl2, PAC-FeCl3, and PAC-Mg electrodes have the specific capacities of 189, 383, 370, 320, and 252 mAh g−1, respectively. It can be seen that the capacities of all samples were related to their pore volume values. Namely, the higher the pore volume, the higher the capacity. These results suggested that the specific capacities of the non-activated PC sample were improved after activation by the activating agents. This improvement was caused by the increased number of pores. All PAC samples exhibited microporous, mesoporous, and macroporous structures which can not only provide more active sites for Li+ adsorption and storage but also can allow better contact between materials and electrolyte to shorten the distance of Li+ ion transport. These facilitated fast Li+ ion diffusion and electrolyte transport, and thereby, the capacity of all activated samples was improved [25,26]. Furthermore, the micropore and mesopore can increase surface areas to store more Li+, while the interconnected macropores can function as electrolyte reservoirs, which can greatly reduce the Li+ diffusion [53,54,55]. Interestingly, the PAC-KOH sample exhibited a higher capacity than that of the non-activated PC and other PAC samples. The highest capacity in this sample was mainly due to its large surface area and high pore volume. The larger surface area and higher pore volume of this sample can provide the local uptake of Li+ and Li+ adsorption. This, in turn, resulted in an improvement of capacity in this sample. When considering the surface area, PAC-FeCl3 delivered a half-lower specific surface area than that of the PAC-ZnCl2. Interestingly, the specific capacity of PAC-FeCl3 was almost the same. This phenomenon was caused by the existence of graphite in PAC-FeCl3. The increase of graphite content can increase the intercalation host of lithium-ion, which Li-ion intercalation described in the Equation (20) [1]. With increased intercalation hosts, more Li+ ions can be stored in PAC-FeCl3 samples. Therefore, the capacity of PAC-FeCl3 was improved.
The cycle performance of the materials in this work was further compared to graphite and other carbonaceous-based materials, as listed in Table 2. It was found that the new products synthesized in this work exhibited a better cycle performance compared to the conventional graphite (372 mAh g−1) [56], other carbonaceous-based materials, and biomass/biowaste-derived activated carbons. Moreover, the preparation of products in this work was facile, cost effective, and environmentally friendly. Therefore, this suggested that the new materials in this work could be potentially used as anodes in LIBs.

4. Conclusions

The porous materials (PAC) were successfully prepared through the activation process using various types of activating agents. The raw material in this work was paddy, which is low cost and environmentally friendly. Paddy can be easily prepared to provide popped rice by using the popping approach. This approach is convenient, safe, low cost, and time saving. The expanded structure of popped rice improved the surface area of paddy. This larger surface area of popped rice could provide more active sites for activating agents and also increase the activation rate. This, in turn, resulted in the formation of PAC products with a higher porosity. The phase characteristics of the PAC products can be described as an amorphous or nanocrystalline graphitic phase. Moreover, the porous structures were formed after using the activating agents, which was confirmed by an increase in the surface area and pore volume of the activated materials. This, in turn, resulted in an enhancement of electrochemical performances. Some of the activated materials delivered a higher specific capacity than the conventional graphite, especially PAC-KOH, which provided the highest electrochemical performance among all five samples. This confirmed that the KOH activating agent possessed high ability and would be useful for the activation of other carbonaceous materials. This work demonstrated that porous materials with good electrochemical performance can be synthesized using a low cost and convenient process. Therefore, the new anode materials produced in this work have the potential to be used as anode materials in LIBs.

Author Contributions

Conceptualization, R.B. and T.S.; data curation, O.N. and C.Y.; formal analysis, R.B., W.Y. and. T.S.; funding acquisition, T.S.; investigation, R.B. and T.A.; methodology, R.B. and C.Y.; project administration, T.A. and T.S.; resources, R.B.; supervision, O.N. and T.S.; validation, T.A., O.N. and T.S.; visualization, R.B.; writing—original draft preparation, R.B.; writing—review and editing, O.N., W.Y. and T.S. All authors have read and agreed to the published version of the manuscript.

Funding

This research received no external funding.

Institutional Review Board Statement

Not applicable.

Informed Consent Statement

Not applicable.

Acknowledgments

The authors would like to thank the Renewable Energy Laboratory Research Group, and the Department of Chemistry, Faculty of Science, Chiang Mai University, for facility supports. This work was financially supported by post-doctoral fellowships, Chiang Mai University, and financial funding by the Center of Excellence for Innovation in Chemistry (PERCH-CIC) and Material Science Research Center (MsRC). This work also received financial support from TSRI, and Fundamental Fund 2022, Chiang Mai University.

Conflicts of Interest

The authors declare no conflict of interest.

References

  1. Roberts, A.D.; Li, X.; Zhang, H. Porous Carbon Spheres and Monoliths: Morphology Control, Pore Size Tuning and Their Applications as Li-Ion Battery Anode Materials. Chem. Soc. Rev. 2014, 43, 4341–4356. [Google Scholar] [CrossRef] [PubMed]
  2. Chowdhury, R.; Zhao, Y.; Xia, Y.; Ouyang, M.; Brandon, N.; Banerjee, A. Revisiting the Promise of Bi-Layer Graded Cathodes for Improved Li-Ion Battery Performance. Sustain. Energy Fuels 2021, 5, 5193–5204. [Google Scholar] [CrossRef]
  3. Ding, Y.; Cano, Z.P.; Yu, A.; Lu, J.; Chen, Z. Automotive Li-Ion Batteries: Current Status and Future Perspectives. Electrochem. Energy Rev. 2019, 2, 1–28. [Google Scholar] [CrossRef]
  4. Namsar, O.; Autthawong, T.; Laokawee, V.; Boonprachai, R.; Haruta, M.; Kurata, H.; Yu, A.; Chairuangsri, T.; Sarakonsri, T. Improved Electrochemical Performance of Anode Materials for High Energy Density Lithium-Ion Batteries through Sn(SnO2)–SiO2/Graphene-Based Nanocomposites Prepared by a Facile and Low-Cost Approach. Sustain. Energy Fuels 2020, 4, 4625–4636. [Google Scholar] [CrossRef]
  5. Chen, L.-F.; Ma, S.-X.; Lu, S.; Feng, Y.; Zhang, J.; Xin, S.; Yu, S.-H. Biotemplated Synthesis of Three-Dimensional Porous MnO/C-N Nanocomposites from Renewable Rapeseed Pollen: An Anode Material for Lithium-Ion Batteries. Nano Res. 2017, 10, 1–11. [Google Scholar] [CrossRef]
  6. Asenbauer, J.; Eisenmann, T.; Kuenzel, M.; Kazzazi, A.; Chen, Z.; Bresser, D. The Success Story of Graphite as a Lithium-Ion Anode Material—Fundamentals, Remaining Challenges, and Recent Developments Including Silicon (Oxide) Composites. Sustain. Energy Fuels 2020, 4, 5387–5416. [Google Scholar] [CrossRef]
  7. Xu, K.; Li, Y.; Xiong, J.; Ou, X.; Su, W.; Zhong, G.; Yang, C. Activated Amorphous Carbon with High-Porosity Derived From Camellia Pollen Grains as Anode Materials for Lithium/Sodium Ion Batteries. Front. Chem. 2018, 6, 366. [Google Scholar] [CrossRef]
  8. Kim, T.; Jo, C.; Lim, W.-G.; Lee, J.; Lee, J.; Lee, K.-H. Facile Conversion of Activated Carbon to Battery Anode Material Using Microwave Graphitization. Carbon 2016, 104, 106–111. [Google Scholar] [CrossRef]
  9. Lei, H.; Wang, Y.; Huo, J. Porous Graphitic Carbon Materials Prepared from Cornstarch with the Assistance of Microwave Irradiation. Microporous Mesoporous Mater. 2015, 210, 39–45. [Google Scholar] [CrossRef]
  10. Thambiliyagodage, C.J.; Ulrich, S.; Araujo, P.T.; Bakker, M.G. Catalytic Graphitization in Nanocast Carbon Monoliths by Iron, Cobalt and Nickel Nanoparticles. Carbon 2018, 134, 452–463. [Google Scholar] [CrossRef]
  11. Zhao, L.; Bennett, J.C.; Obrovac, M.N. Hexagonal Platelet Graphite and Its Application in Li-Ion Batteries. Carbon 2018, 134, 507–518. [Google Scholar] [CrossRef]
  12. Yu, K.; Wang, Y.; Wang, X.; Liu, W.; Liang, J.; Liang, C. Preparation of Porous Carbon Anode Materials for Lithium-Ion Battery from Rice Husk. Mater. Lett. 2019, 253, 405–408. [Google Scholar] [CrossRef]
  13. Li, Y.; Wang, L.; Gao, B.; Li, X.; Cai, Q.; Li, Q.; Peng, X.; Huo, K.; Chu, P.K. Hierarchical Porous Carbon Materials Derived from Self-Template Bamboo Leaves for Lithium–Sulfur Batteries. Electrochim. Acta 2017, 229, 352–360. [Google Scholar] [CrossRef]
  14. Tang, J.; Etacheri, V.; Pol, V.G. From Allergens to Battery Anodes: Nature-Inspired, Pollen Derived Carbon Architectures for Room- and Elevated- Temperature Li-Ion Storage. Sci. Rep. 2016, 6, 20290. [Google Scholar] [CrossRef] [PubMed]
  15. Li, Y.; Hu, Y.-S.; Titirici, M.-M.; Chen, L.; Huang, X. Hard Carbon Microtubes Made from Renewable Cotton as High-Performance Anode Material for Sodium-Ion Batteries. Adv. Energy Mater. 2016, 6, 1600659. [Google Scholar] [CrossRef]
  16. Huang, Y.-F.; Chiueh, P.-T.; Kuan, W.-H.; Lo, S.-L. Microwave Pyrolysis of Lignocellulosic Biomass: Heating Performance and Reaction Kinetics. Energy 2016, 100, 137–144. [Google Scholar] [CrossRef]
  17. Wang, R.; Lou, M.; Zhang, J.; Sun, Z.; Li, Z.; Wen, P. ZIF-8@ZIF-67-Derived Co Embedded into Nitrogen-Doped Carbon Nanotube Hollow Porous Carbon Supported Pt as an Efficient Electrocatalyst for Methanol Oxidation. Nanomaterials 2021, 11, 2491. [Google Scholar] [CrossRef]
  18. Liu, S.; Kang, L.; Zhang, J.; Jun, S.C.; Yamauchi, Y. Carbonaceous Anode Materials for Non-aqueous Sodium- and Potassium-Ion Hybrid Capacitors. ACS Energy Lett. 2021, 6, 4127–4154. [Google Scholar] [CrossRef]
  19. Liu, S.; Kang, L.; Zhang, J.; Jung, E.; Lee, S.; Jun, S.C. Structural Engineering and Surface Modification of MOF-Derived Cobalt-Based Hybrid Nanosheets for Flexible Solid-State Supercapacitors. Energy Storage Mater. 2020, 32, 167–177. [Google Scholar] [CrossRef]
  20. Reis, G.S.D.; Larsson, S.H.; de Oliveira, H.P.; Thyrel, M.; Claudio Lima, E. Sustainable Biomass Activated Carbons as Electrodes for Battery and Supercapacitors—A Mini-Review. Nanomaterials 2020, 10, 1398. [Google Scholar] [CrossRef]
  21. Fromm, O.; Heckmann, A.; Rodehorst, U.; Frerichs, J.; Becker, D.; Winter, M.; Placke, T. Carbons from Biomass Precursors as Anode Materials for Lithium Ion Batteries: New Insights into Carbonization and Graphitization Behavior and into Their Correlation to Electrochemical Performance. Carbon 2017, 128, 147–163. [Google Scholar] [CrossRef]
  22. Kumar, U.; Wu, J.; Sharma, N.; Sahajwalla, V. Biomass Derived High Areal and Specific Capacity Hard Carbon Anodes for Sodium-Ion Batteries. Energy Fuels 2021, 35, 1820–1830. [Google Scholar] [CrossRef]
  23. Zhang, S.; Liu, Y.; Zheng, J.; Mu, Y.; Jiang, H.; Yan, H.; Wang, Y.; Zhang, Y.; Meng, C. Rice-like and Rose-like Zinc Silicates Anchored on Amorphous Carbon Derived from Natural Reed Leaves for High-Performance Supercapacitors. Dalt. Trans. 2021, 50, 9438–9449. [Google Scholar] [CrossRef] [PubMed]
  24. Zhong, Y.; Xia, X.; Deng, S.; Zhan, J.; Fang, R.; Xia, Y.; Wang, X.; Zhang, Q.; Tu, J. Popcorn Inspired Porous Macrocellular Carbon: Rapid Puffing Fabrication from Rice and Its Applications in Lithium–Sulfur Batteries. Adv. Energy Mater. 2018, 8, 1701110. [Google Scholar] [CrossRef]
  25. Niu, J.; Shao, R.; Liang, J.; Dou, M.; Li, Z.; Huang, Y.; Wang, F. Biomass-Derived Mesopore-Dominant Porous Carbons with Large Specific Surface Area and High Defect Density as High Performance Electrode Materials for Li-Ion Batteries and Supercapacitors. Nano Energy 2017, 36, 322–330. [Google Scholar] [CrossRef]
  26. Yu, C.; Chen, M.; Li, X.; Zhao, C.; He, L.; Qiu, J. Hierarchically Porous Carbon Architectures Embedded with Hollow Nanocapsules for High-Performance Lithium Storage. J. Mater. Chem. A 2015, 3, 5054–5059. [Google Scholar] [CrossRef]
  27. Cesano, F.; Cravanzola, S.; Brunella, V.; Scarano, D. Porous Carbon Spheres from Poly(4-Ethylstyrene-Co-Divinylbenzene: Role of ZnCl2 and KOH Agents in Affecting Porosity, Surface Area and Mechanical Properties. Microporous Mesoporous Mater. 2019, 288, 109605. [Google Scholar] [CrossRef]
  28. Ao, W.; Fu, J.; Mao, X.; Kang, Q.; Ran, C.; Liu, Y.; Zhang, H.; Gao, Z.; Li, J.; Liu, G.; et al. Microwave Assisted Preparation of Activated Carbon from Biomass: A Review. Renew. Sustain. Energy Rev. 2018, 92, 958–979. [Google Scholar] [CrossRef]
  29. Theydan, S.K.; Ahmed, M.J. Optimization of Preparation Conditions for Activated Carbons from Date Stones Using Response Surface Methodology. Powder Technol. 2012, 224, 101–108. [Google Scholar] [CrossRef]
  30. Hou, J.; Jiang, K.; Tahir, M.; Wu, X.; Idrees, F.; Shen, M.; Cao, C. Tunable Porous Structure of Carbon Nanosheets Derived from Puffed Rice for High Energy Density Supercapacitors. J. Power Sources 2017, 371, 148–155. [Google Scholar] [CrossRef]
  31. Xu, Z.; Zhou, Y.; Sun, Z.; Zhang, D.; Huang, Y.; Gu, S.; Chen, W. Understanding Reactions and Pore-Forming Mechanisms between Waste Cotton Woven and FeCl3 during the Synthesis of Magnetic Activated Carbon. Chemosphere 2020, 241, 125120. [Google Scholar] [CrossRef]
  32. Yan, Q.; Li, J.; Zhang, X.; Hassan, E.B.; Wang, C.; Zhang, J.; Cai, Z. Catalytic Graphitization of Kraft Lignin to Graphene-Based Structures with Four Different Transitional Metals. J. Nanoparticle Res. 2018, 20, 223. [Google Scholar] [CrossRef]
  33. Xia, S.; Cai, N.; Wu, J.; Xiao, H.; Hu, J.; Chen, X.; Chen, Y.; Yang, H.; Wang, X.; Chen, H. Synthesis and Formation Mechanism of Biomass-Based Mesoporous Graphitic Carbon. Fuel Process. Technol. 2020, 209, 106543. [Google Scholar] [CrossRef]
  34. Wang, Y.; Serrano, S.; Santiago-Avilés, J.J. Raman Characterization of Carbon Nanofibers Prepared Using Electrospinning. Synth. Met. 2003, 138, 423–427. [Google Scholar] [CrossRef]
  35. Mori, F.; Kubouchi, M.; Arao, Y. Effect of Graphite Structures on the Productivity and Quality of Few-Layer Graphene in Liquid-Phase Exfoliation. J. Mater. Sci. 2018, 53, 12807–12815. [Google Scholar] [CrossRef]
  36. Tai, Z.; Zhang, Q.; Liu, Y.; Liu, H.; Dou, S. Activated Carbon from the Graphite with Increased Rate Capability for the Potassium Ion Battery. Carbon 2017, 123, 54–61. [Google Scholar] [CrossRef] [Green Version]
  37. Tallant, D.; Friedmann, T.; Missert, N.; Siegal, M.; Sullivan, J. Raman Spectroscopy of Amorphous Carbon. MRS Proc. 1998, 498, 37–48. [Google Scholar] [CrossRef] [Green Version]
  38. Wang, H.; Wu, Y.; Choong, C.K.S.; Zhang, J.; Teo, K.L.; Ni, Z.; Shen, Z. Disorder Induced Bands in First Order Raman Spectra of Carbon Nanowalls. In Proceedings of the Sixth IEEE Conference on Nanotechnology, Cincinnati, OH, USA, 17–20 June 2006; Volume 1, pp. 219–222. [Google Scholar]
  39. Sing, K.S.W. Reporting Physisorption Data for Gas/solid Systems with Special Reference to the Determination of Surface Area and Porosity (Recommendations 1984). Pure Appl. Chem. 1985, 57, 603–619. [Google Scholar] [CrossRef]
  40. Sun, Y.; Tang, J.; Zhang, K.; Yu, X.; Yuan, J.; Zhu, D.-M.; Ozawa, K.; Qin, L.-C. Effect of Porous Structural Properties on Lithium-Ion and Sodium-Ion Storage: Illustrated by the Example of a Micro-Mesoporous Graphene1−x(MoS2)x Anode. RSC Adv. 2021, 11, 34152–34159. [Google Scholar] [CrossRef]
  41. Lemoisson, F.; Froyen, L. 12—Understanding and Improving Powder Metallurgical Processes. In Woodhead Publishing Series in Metals and Surface Engineering; Woodhead Publishing: Cambridge, UK, 2005; pp. 471–502. [Google Scholar]
  42. Wang, H.; Gao, Q.; Hu, J. High Hydrogen Storage Capacity of Porous Carbons Prepared by Using Activated Carbon. J. Am. Chem. Soc. 2009, 131, 7016–7022. [Google Scholar] [CrossRef]
  43. Ma, Y. Comparison of Activated Carbons Prepared from Wheat Straw via ZnCl2 and KOH Activation. Waste Biomass Valorization 2017, 8, 549–559. [Google Scholar] [CrossRef]
  44. Bedia, J.; Peñas-Garzón, M.; Gómez-Avilés, A.; Rodriguez, J.; Belver, C. Review on Activated Carbons by Chemical Activation with FeCl3. C J. Carbon Res. 2020, 6, 21. [Google Scholar] [CrossRef] [Green Version]
  45. Liu, K.; Ostadhassan, M. The Impact of Pore Size Distribution Data Presentation Format on Pore Structure Interpretation of Shales. Adv. Geo-Energy Res. 2019, 3, 187–197. [Google Scholar] [CrossRef]
  46. Park, J.; Lee, J.; Kim, S.; Hwang, J. Graphene-Based Two-Dimensional Mesoporous Materials: Synthesis and Electrochemical Energy Storage Applications. Materials 2021, 14, 2597. [Google Scholar] [CrossRef] [PubMed]
  47. Yang, G.; Li, X.; Guan, Z.; Tong, Y.; Xu, B.; Wang, X.; Wang, Z.; Chen, L. Insights into Lithium and Sodium Storage in Porous Carbon. Nano Lett. 2020, 20, 3836–3843. [Google Scholar] [CrossRef]
  48. Joho, F.; Rykart, B.; Blome, A.; Novák, P.; Wilhelm, H.; Spahr, M.E. Relation between Surface Properties, Pore Structure and First-Cycle Charge Loss of Graphite as Negative Electrode in Lithium-Ion Batteries. J. Power Sources 2001, 97–98, 78–82. [Google Scholar] [CrossRef]
  49. Yu, K.; Zhang, H.; Qi, H.; Liang, J.; Liang, C. High Performance of Porous Silicon/Carbon/RGO Network Derived from Rice Husks as Anodes for Lithium-Ion Batteries. New J. Chem. 2018, 42, 19811–19817. [Google Scholar] [CrossRef]
  50. Gan, L.; Guo, H.; Wang, Z.; Li, X.; Peng, W.; Wang, J.; Huang, S.; Su, M. A Facile Synthesis of Graphite/Silicon/Graphene Spherical Composite Anode for Lithium-Ion Batteries. Electrochim. Acta 2013, 104, 117–123. [Google Scholar] [CrossRef] [Green Version]
  51. Li, Y.; Mu, L.; Hu, Y.-S.; Li, H.; Chen, L.; Huang, X. Pitch-Derived Amorphous Carbon as High Performance Anode for Sodium-Ion Batteries. Energy Storage Mater. 2016, 2, 139–145. [Google Scholar] [CrossRef]
  52. Natarajan, S.; Aravindan, V. An Urgent Call to Spent LIB Recycling: Whys and Wherefores for Graphite Recovery. Adv. Energy Mater. 2020, 10, 2002238. [Google Scholar] [CrossRef]
  53. Velez, V.; Ramos-Sánchez, G.; Lopez, B.; Lartundo-Rojas, L.; González, I.; Sierra, L. Synthesis of Novel Hard Mesoporous Carbons and Their Applications as Anodes for Li and Na Ion Batteries. Carbon 2019, 147, 214–226. [Google Scholar] [CrossRef]
  54. Um, J.H.; Choi, M.; Park, H.; Cho, Y.-H.; Dunand, D.C.; Choe, H.; Sung, Y.-E. 3D Macroporous Electrode and High-Performance in Lithium-Ion Batteries Using SnO2 Coated on Cu Foam. Sci. Rep. 2016, 6, 18626. [Google Scholar] [CrossRef] [PubMed]
  55. Ho, C.-K.; Li, C.-Y.V.; Deng, Z.; Chan, K.-Y.; Yung, H.; Yang, C. Hierarchical Macropore-Mesoporous Shell Carbon Dispersed with Li4Ti5O12 for Excellent High Rate Sub-Freezing Li-Ion Battery Performance. Carbon N. Y. 2019, 145, 614–621. [Google Scholar] [CrossRef]
  56. Chen, Z.; Cao, Y.; Qian, J.; Ai, X.; Yang, H. Antimony-Coated SiC Nanoparticles as Stable and High-Capacity Anode Materials for Li-Ion Batteries. J. Phys. Chem. C 2010, 114, 15196–15201. [Google Scholar] [CrossRef]
  57. Kim, J.; Nithya Jeghan, S.M.; Lee, G. Superior Fast-Charging Capability of Graphite Anode via Facile Surface Treatment for Lithium-Ion Batteries. Microporous Mesoporous Mater. 2020, 305, 110325. [Google Scholar] [CrossRef]
  58. Divya, M.L.; Natarajan, S.; Lee, Y.-S.; Aravindan, V. Achieving High-Energy Dual Carbon Li-Ion Capacitors with Unique Low- and High-Temperature Performance from Spent Li-Ion Batteries. J. Mater. Chem. A 2020, 8, 4950–4959. [Google Scholar] [CrossRef]
  59. Shi, J.; Lin, N.; Liu, D.; Wang, Y.; Lin, H. Preparation of C/SnO2 Composite with Rice Husk-Based Porous Carbon Carrier Loading Ultrasmall SnO2 Nanoparticles for Anode in Lithium-Ion Batteries. J. Electroanal. Chem. 2020, 857, 113634. [Google Scholar] [CrossRef]
  60. Xiao, Y.; Cao, M.; Ren, L.; Hu, C. Hierarchically Porous Germanium-Modified Carbon Materials with Enhanced Lithium Storage Performance. Nanoscale 2012, 4, 7469–7474. [Google Scholar] [CrossRef]
  61. Zheng, X.; Jiang, K.; Zhang, L.; Wang, C. N-Doped 3D Porous Carbon Material Derived from Hierarchical Porous IRMOF-3 Using Citric Acid Modulator: Fabrication and Application in LIBs as the Anode Materials. Dalt. Trans. 2020, 49, 9369–9376. [Google Scholar] [CrossRef]
  62. Tao, L.; Huang, Y.; Yang, X.; Zheng, Y.; Liu, C.; Di, M.; Zheng, Z. Flexible Anode Materials for Lithium-Ion Batteries Derived from Waste Biomass-Based Carbon Nanofibers: I. Effect of Carbonization Temperature. RSC Adv. 2018, 8, 7102–7109. [Google Scholar] [CrossRef] [Green Version]
  63. Zheng, P.; Liu, T.; Zhang, J.; Zhang, L.; Liu, Y.; Huang, J.; Guo, S. Sweet Potato-Derived Carbon Nanoparticles as Anode for Lithium Ion Battery. RSC Adv. 2015, 5, 40737–40741. [Google Scholar] [CrossRef]
  64. Yokokura, T.J.; Rodriguez, J.R.; Pol, V.G. Waste Biomass-Derived Carbon Anode for Enhanced Lithium Storage. ACS Omega 2020, 5, 19715–19720. [Google Scholar] [CrossRef] [PubMed]
  65. Kim, K.; Adams, R.A.; Kim, P.J.; Arora, A.; Martinez, E.; Youngblood, J.P.; Pol, V.G. Li-Ion Storage in an Amorphous, Solid, Spheroidal Carbon Anode Produced by Dry-Autoclaving of Coffee Oil. Carbon N. Y. 2018, 133, 62–68. [Google Scholar] [CrossRef]
  66. Zhang, M.; Gao, B.; Li, Y.; Zhang, X.; Hardin, I.R. Graphene-Coated Pyrogenic Carbon as an Anode Material for Lithium Battery. Chem. Eng. J. 2013, 229, 399–403. [Google Scholar] [CrossRef]
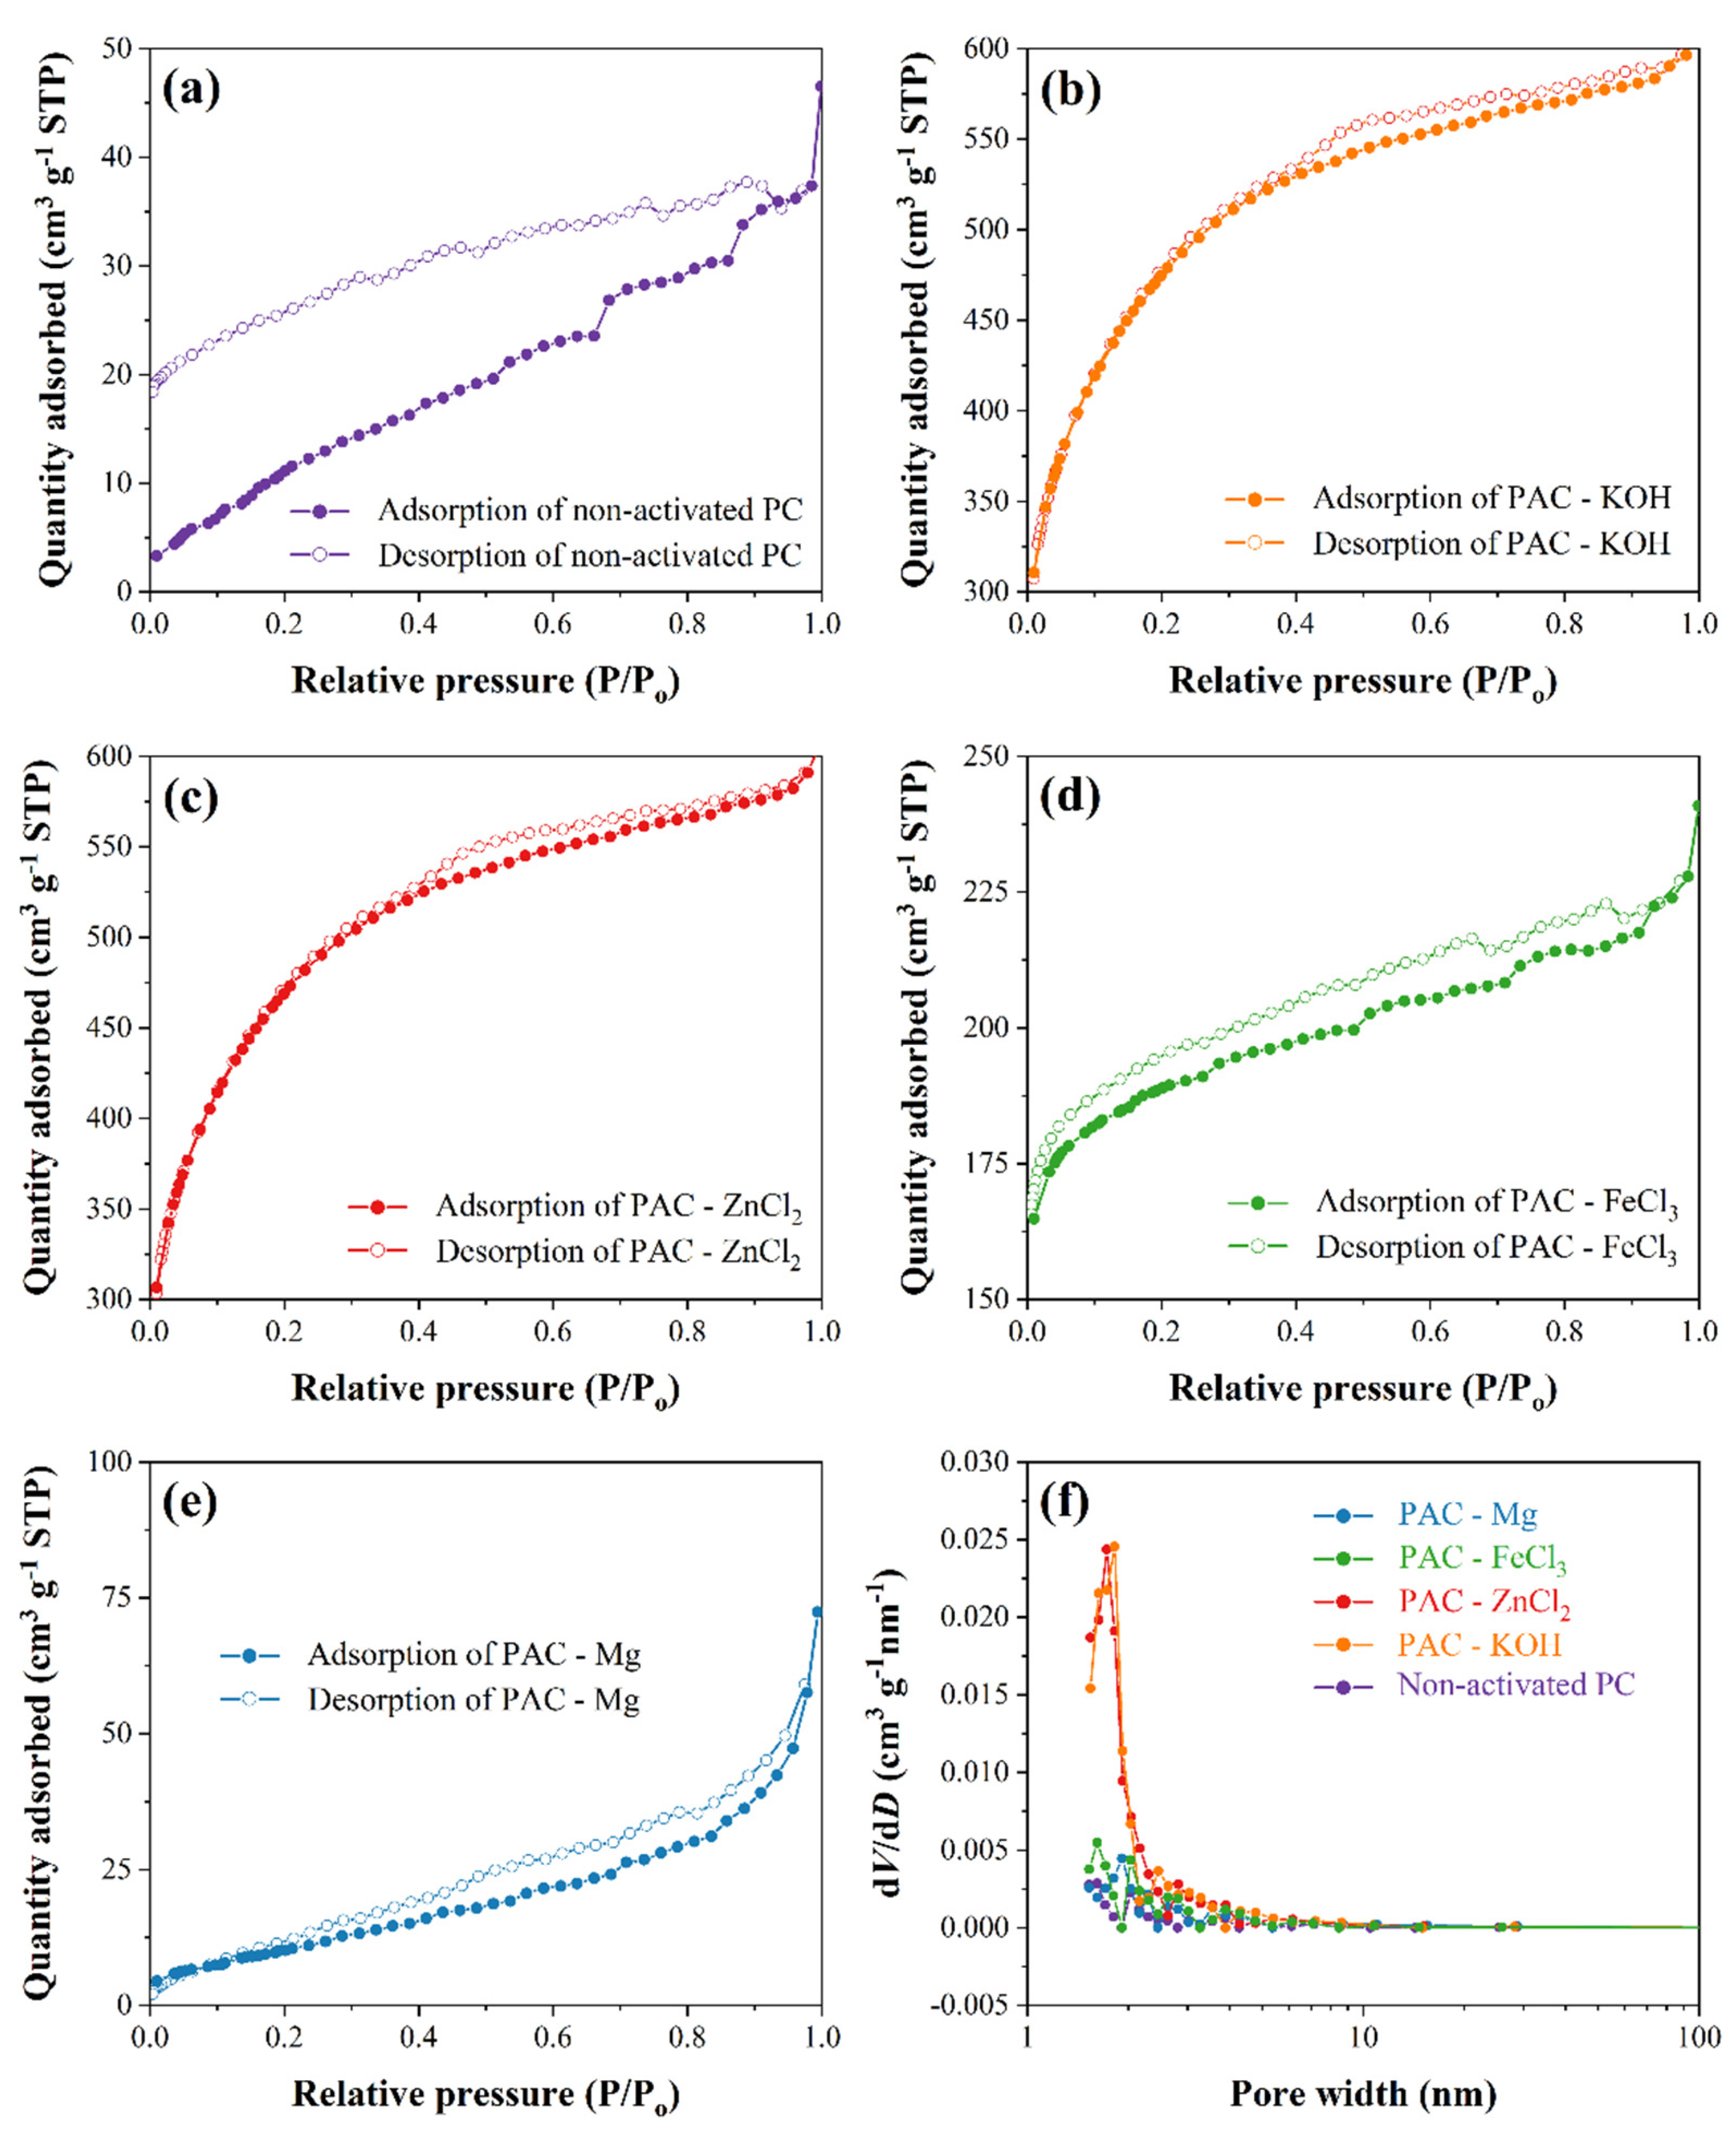
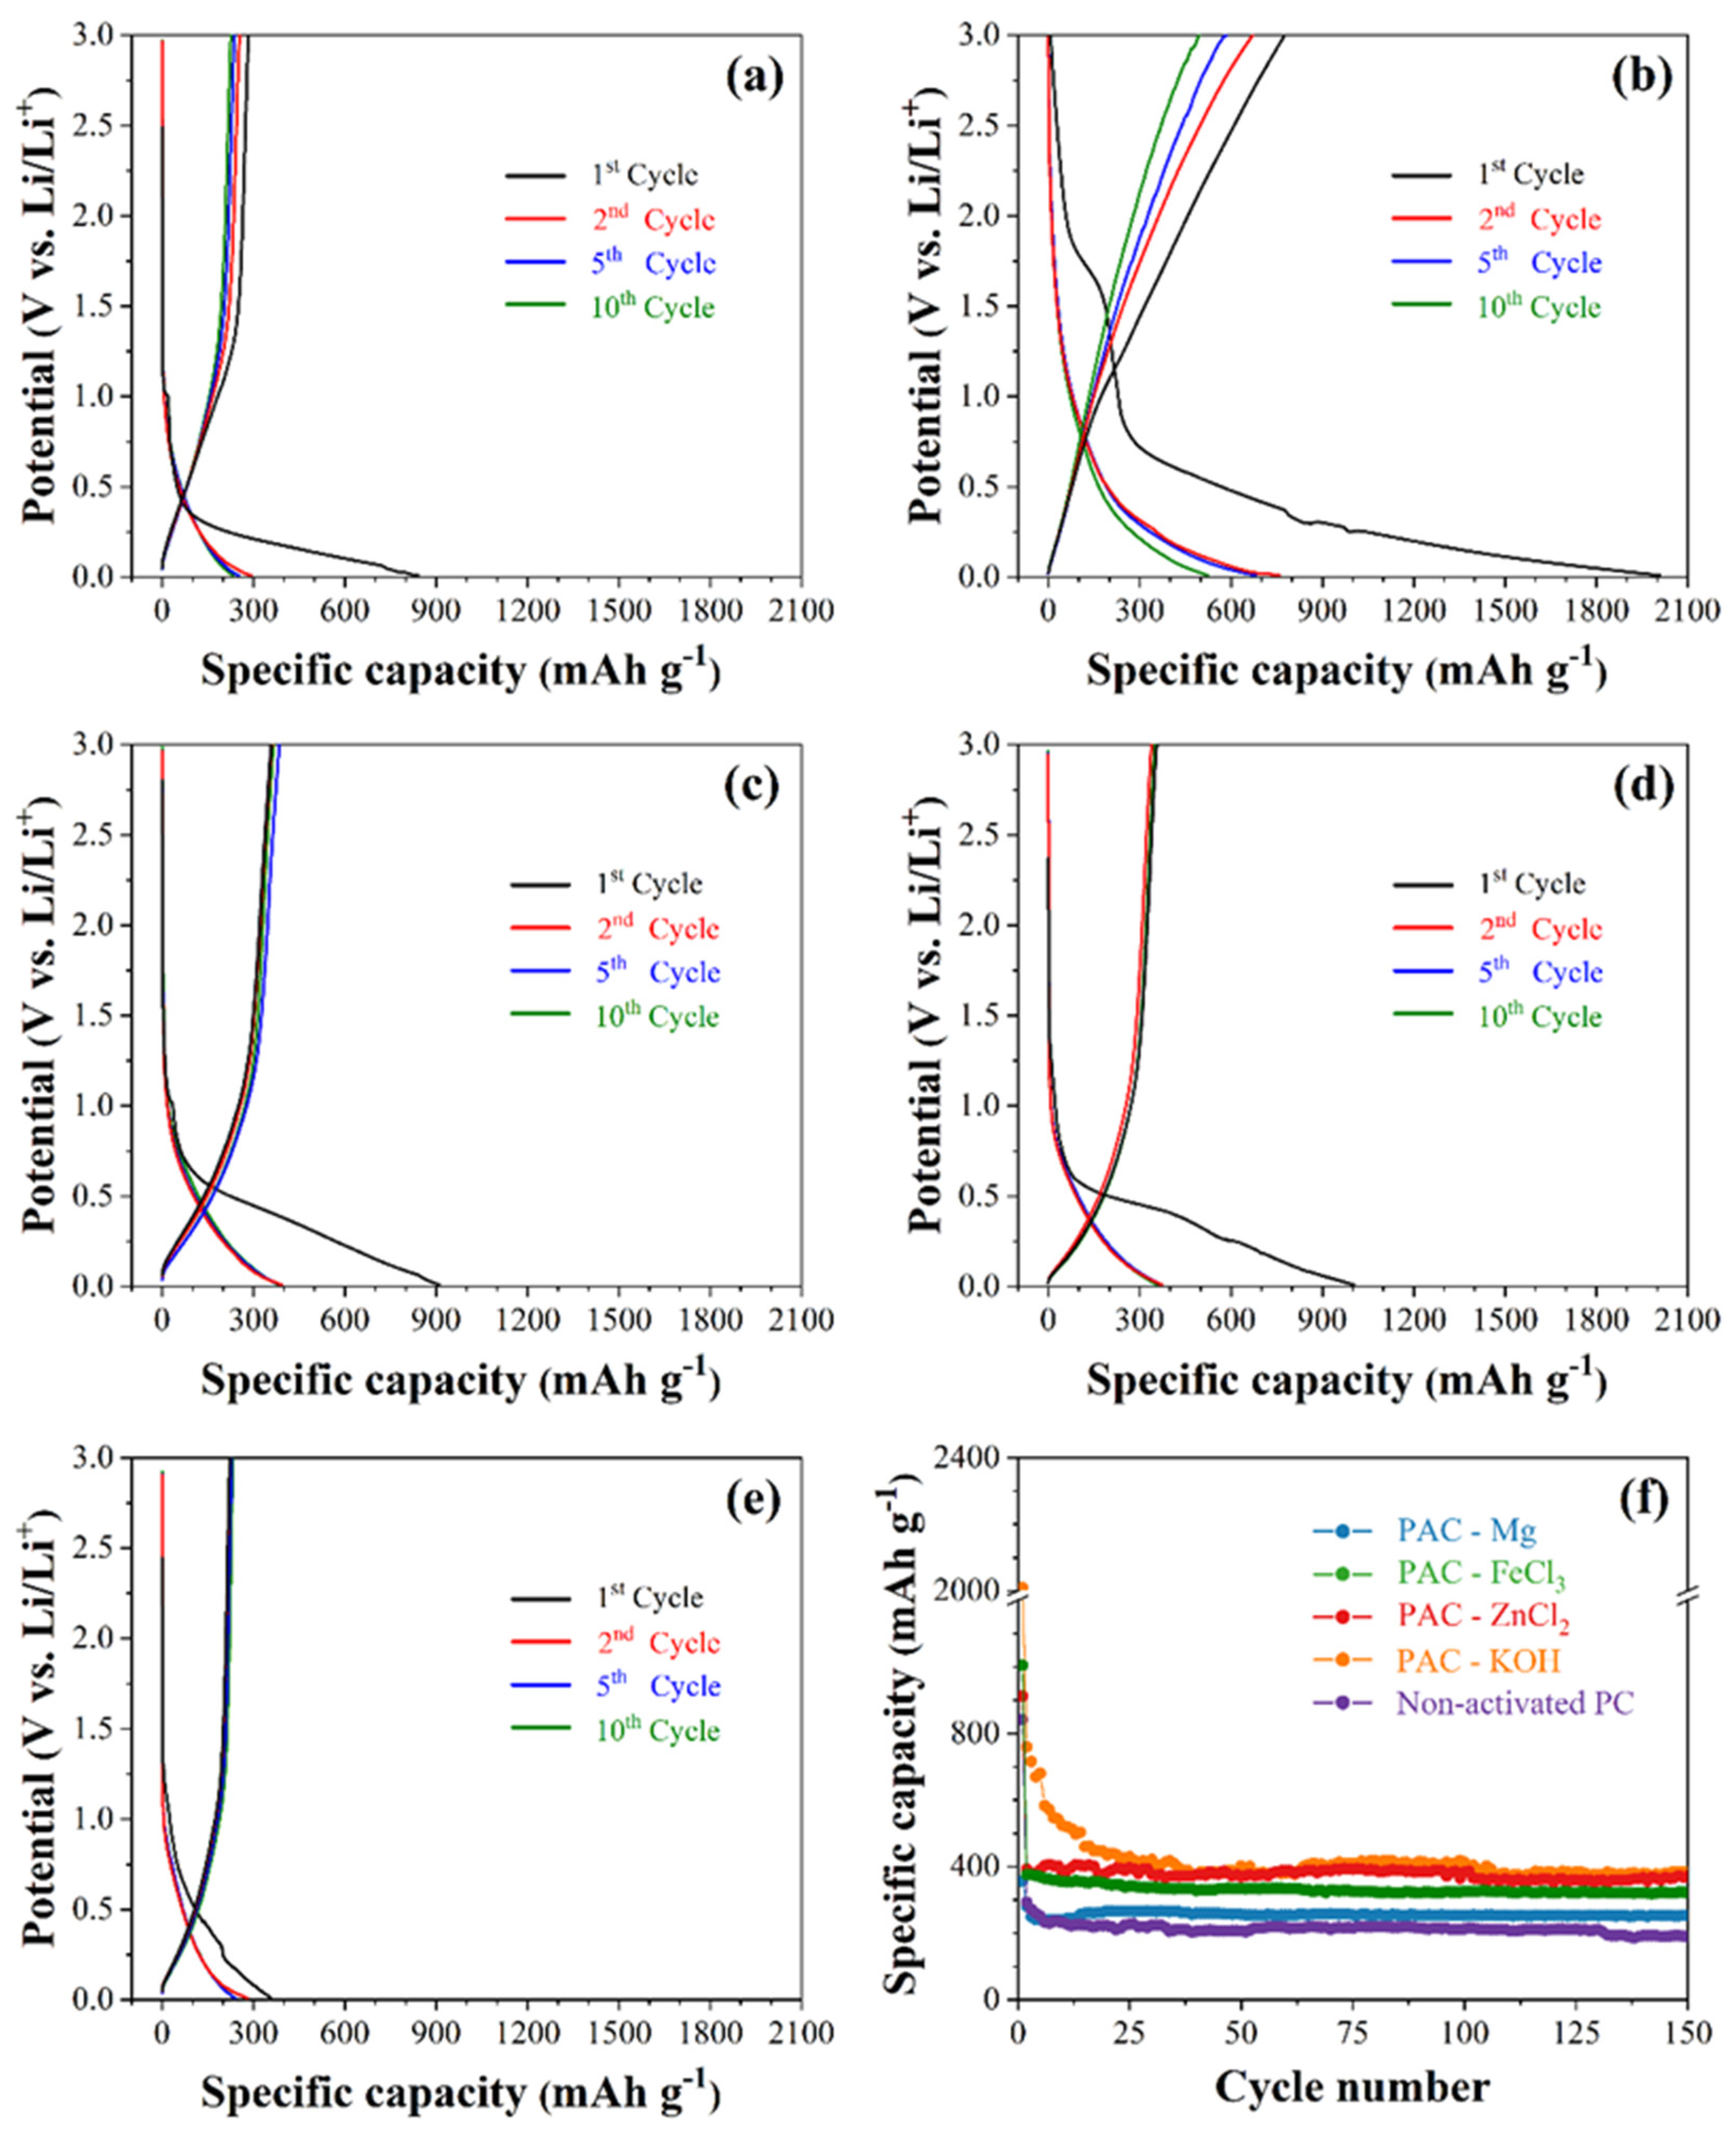
Figure 1. (a) XRD patterns and (b) Raman spectra of non-activated PC and PAC samples with different activating agents.
Crystals 12 00223 g001
Figure 2. SEM images of (a,b) non-activated PC and (cf) PAC samples with different activating agents of (c) KOH, (d) ZnCl2, (e) FeCl3, and (f) Mg.
Crystals 12 00223 g002
Figure 3. N2 adsorption–desorption isotherm of (a) non-activated PC and PAC electrodes using different activating agents of (b) KOH, (c) ZnCl2, (d) FeCl3, and (e) Mg. (f) Pore size distribution of all samples calculated with the BJH model.
Crystals 12 00223 g003
Figure 4. Electrochemical measurements of all prepared electrodes as anode materials for LIBs: discharge/charge curves of (a) non-activated PC and PAC electrodes using different activating agents of (b) KOH, (c) ZnCl2, (d) FeCl3, and (e) Mg; (f) cycle performance of all samples at 100 mA g−1.
Crystals 12 00223 g004
Table 1. Surface area and pore structure parameters, and capacity of non-activated PC and activated PAC samples.
MaterialsSurface and Pore ParametersDischarge Capacity (mAh g−1)
Surface Area
(m2 g−1)
Pore Volume
(cm3 g−1)
Average Pore
(nm)
1st Cycle2nd Cycle150th Cycle
Non-activated PC54.560.07202.639842293189
PAC-KOH1695.580.94421.1162008759383
PAC-ZnCl21677.660.93641.114911392370
PAC-FeCl3732.620.37251.0171004373320
PAC-Mg46.340.11194.831356280252
Table 2. Comparison of cycle performance of the PAC products in this work, graphite, other carbonaceous-based materials, and other biomass/biowaste-derived activated carbons.
MaterialsCapacity
(mAh g−1)
Cycle NumberCurrent Density
(mA g−1)
Ref.
Non-activated PC189150100This work
PAC-KOH383150100This work
Pristine graphite~29050100[57]
Recovered graphite~280200100[58]
Porous carbon~33050100[59]
Pure carbon248.93074.4 (0.2C)[60]
N-doped 3D porous carbon (at 1000 °C)224100200[61]
Carbon nanofibers
(at 1000 °C)
239.6200100[62]
Carbon nanoparticles320200100[63]
Waste avocado seeds-derived carbon315100100[64]
Spheroidal carbon342100100[65]
Graphene-coated pyrogenic carbon2885050[66]
Publisher’s Note: MDPI stays neutral with regard to jurisdictional claims in published maps and institutional affiliations.

