
Varying Synthesis Conditions and Comprehensive Characterization of Fluorine-Doped Hydroxyapatite Nanocrystals in a Simulated Body Fluid

 and
and
Abstract
:
1. Introduction
2. Materials and Methods
2.1. Sample Preparation
2.1.1. Preparation of Simulation Body Fluid
2.1.2. Synthesis of Fluorinated HAp
2.1.2.1. Synthesis of General Calcium Hydroxyphosphate
2.1.2.2. Synthesis of Calcium Hydroxyl Phosphate with Changing pH
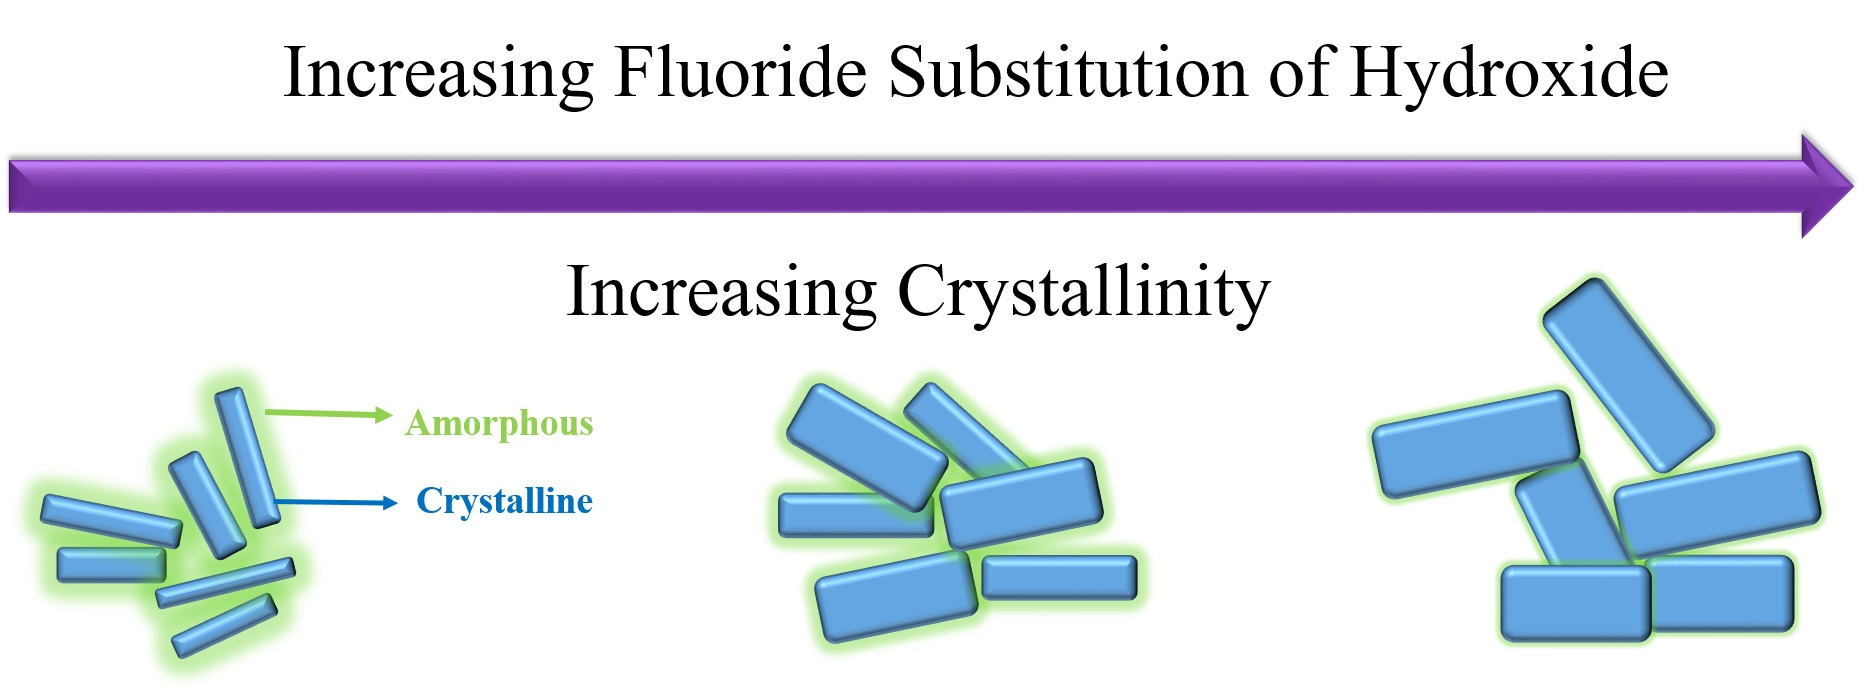
2.1.2.3. Synthesis of Calcium Hydroxyphosphate Substituted with Fluoride Ion
2.1.2.4. Synthesis of Hydroxy Calcium Phosphate Soaked in Fluoride Ion Solution
2.2. Instrumental Characterization: XRD, HRTEM and Solid-State NMR
3. Results and Discussion
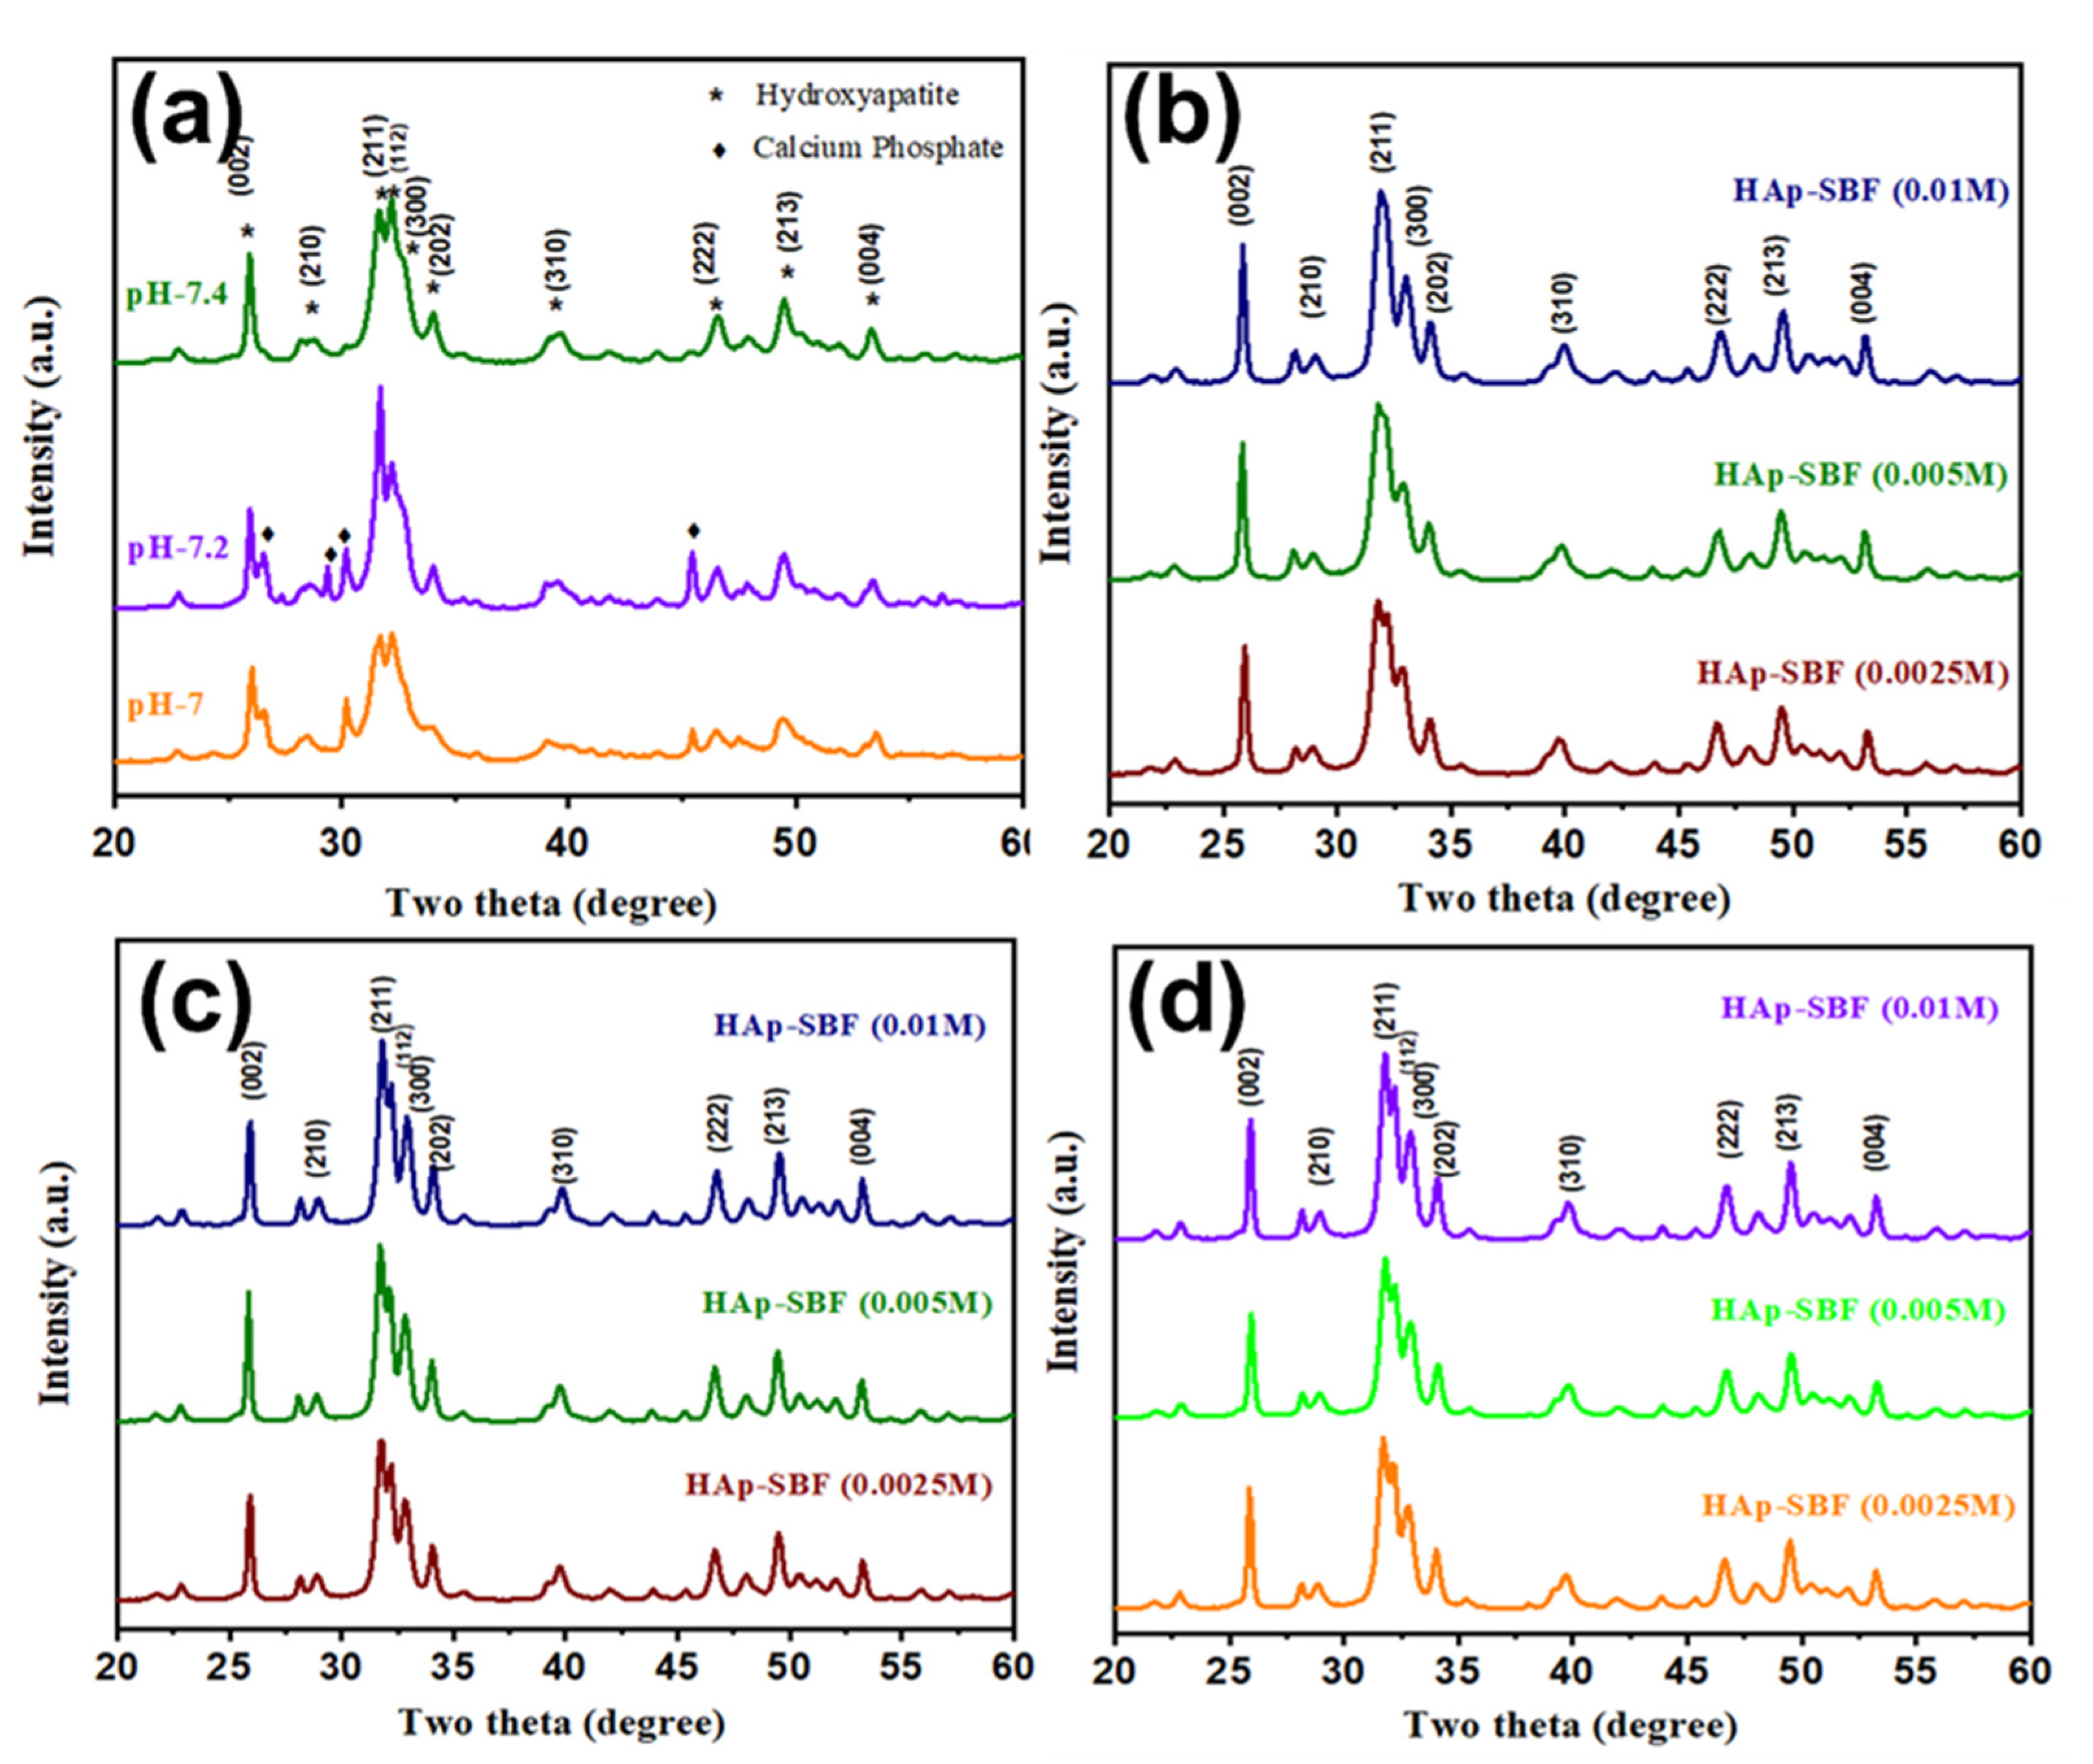
3.1. XRD
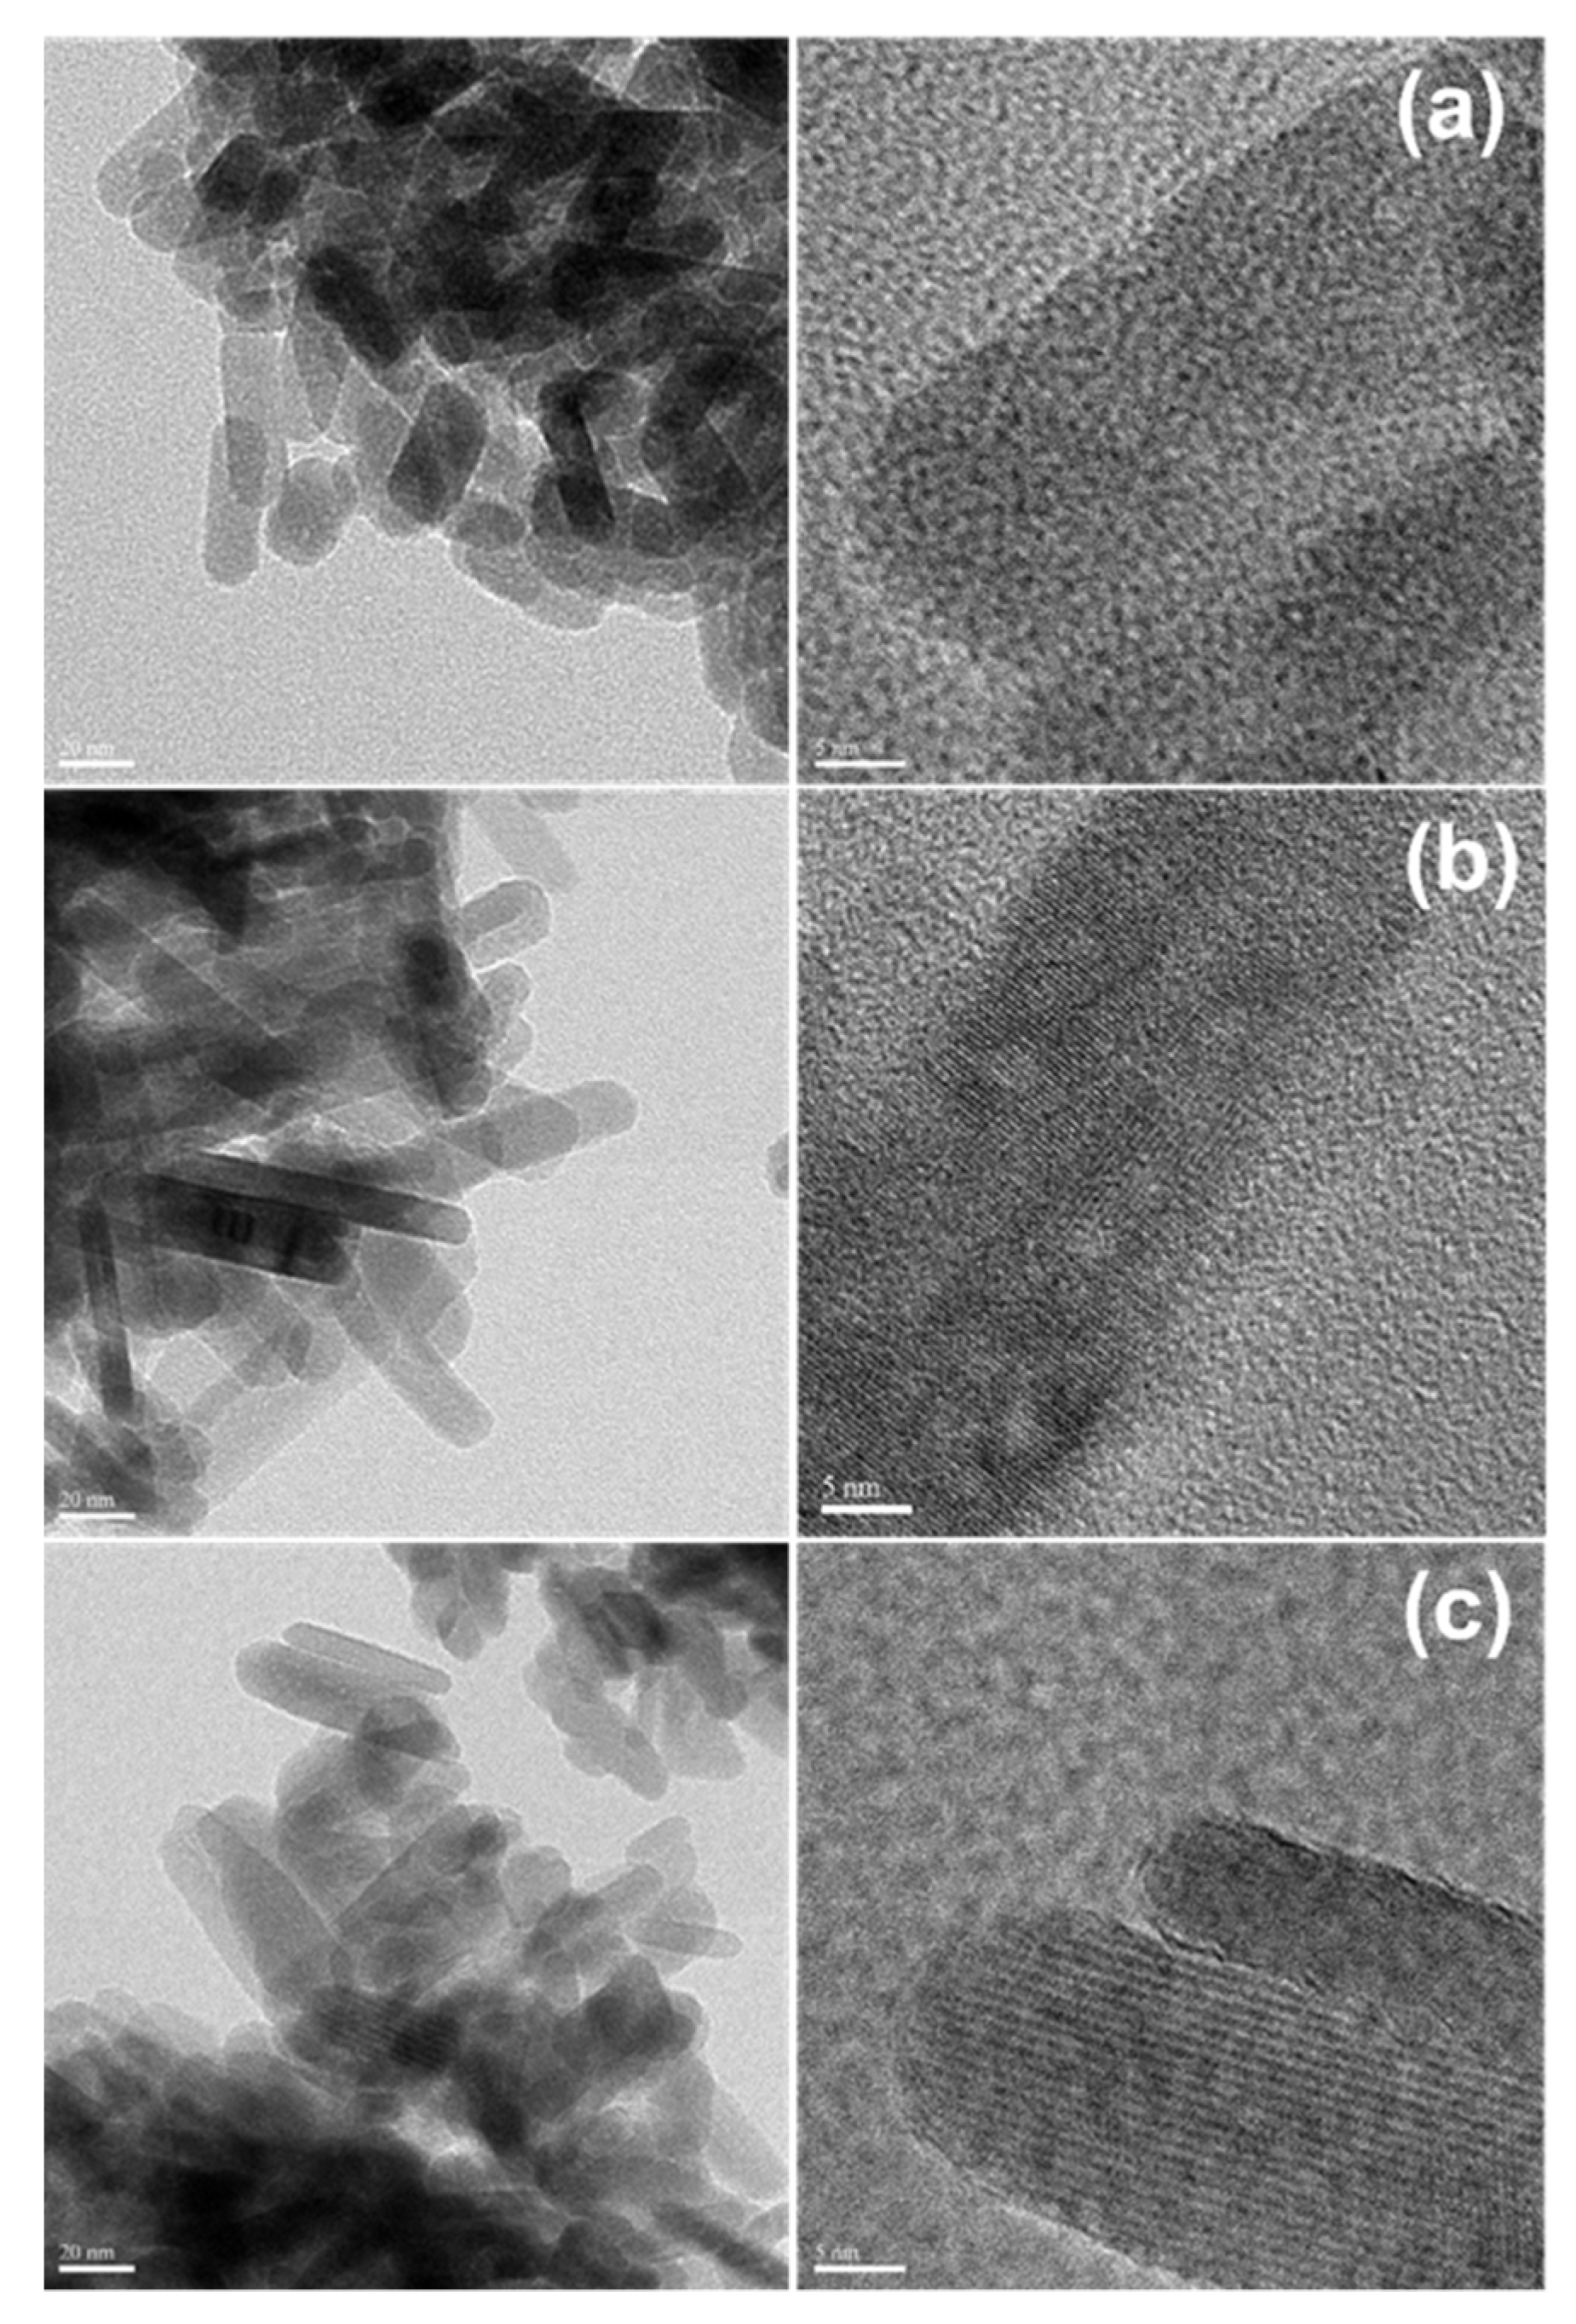
3.2. HRTEM
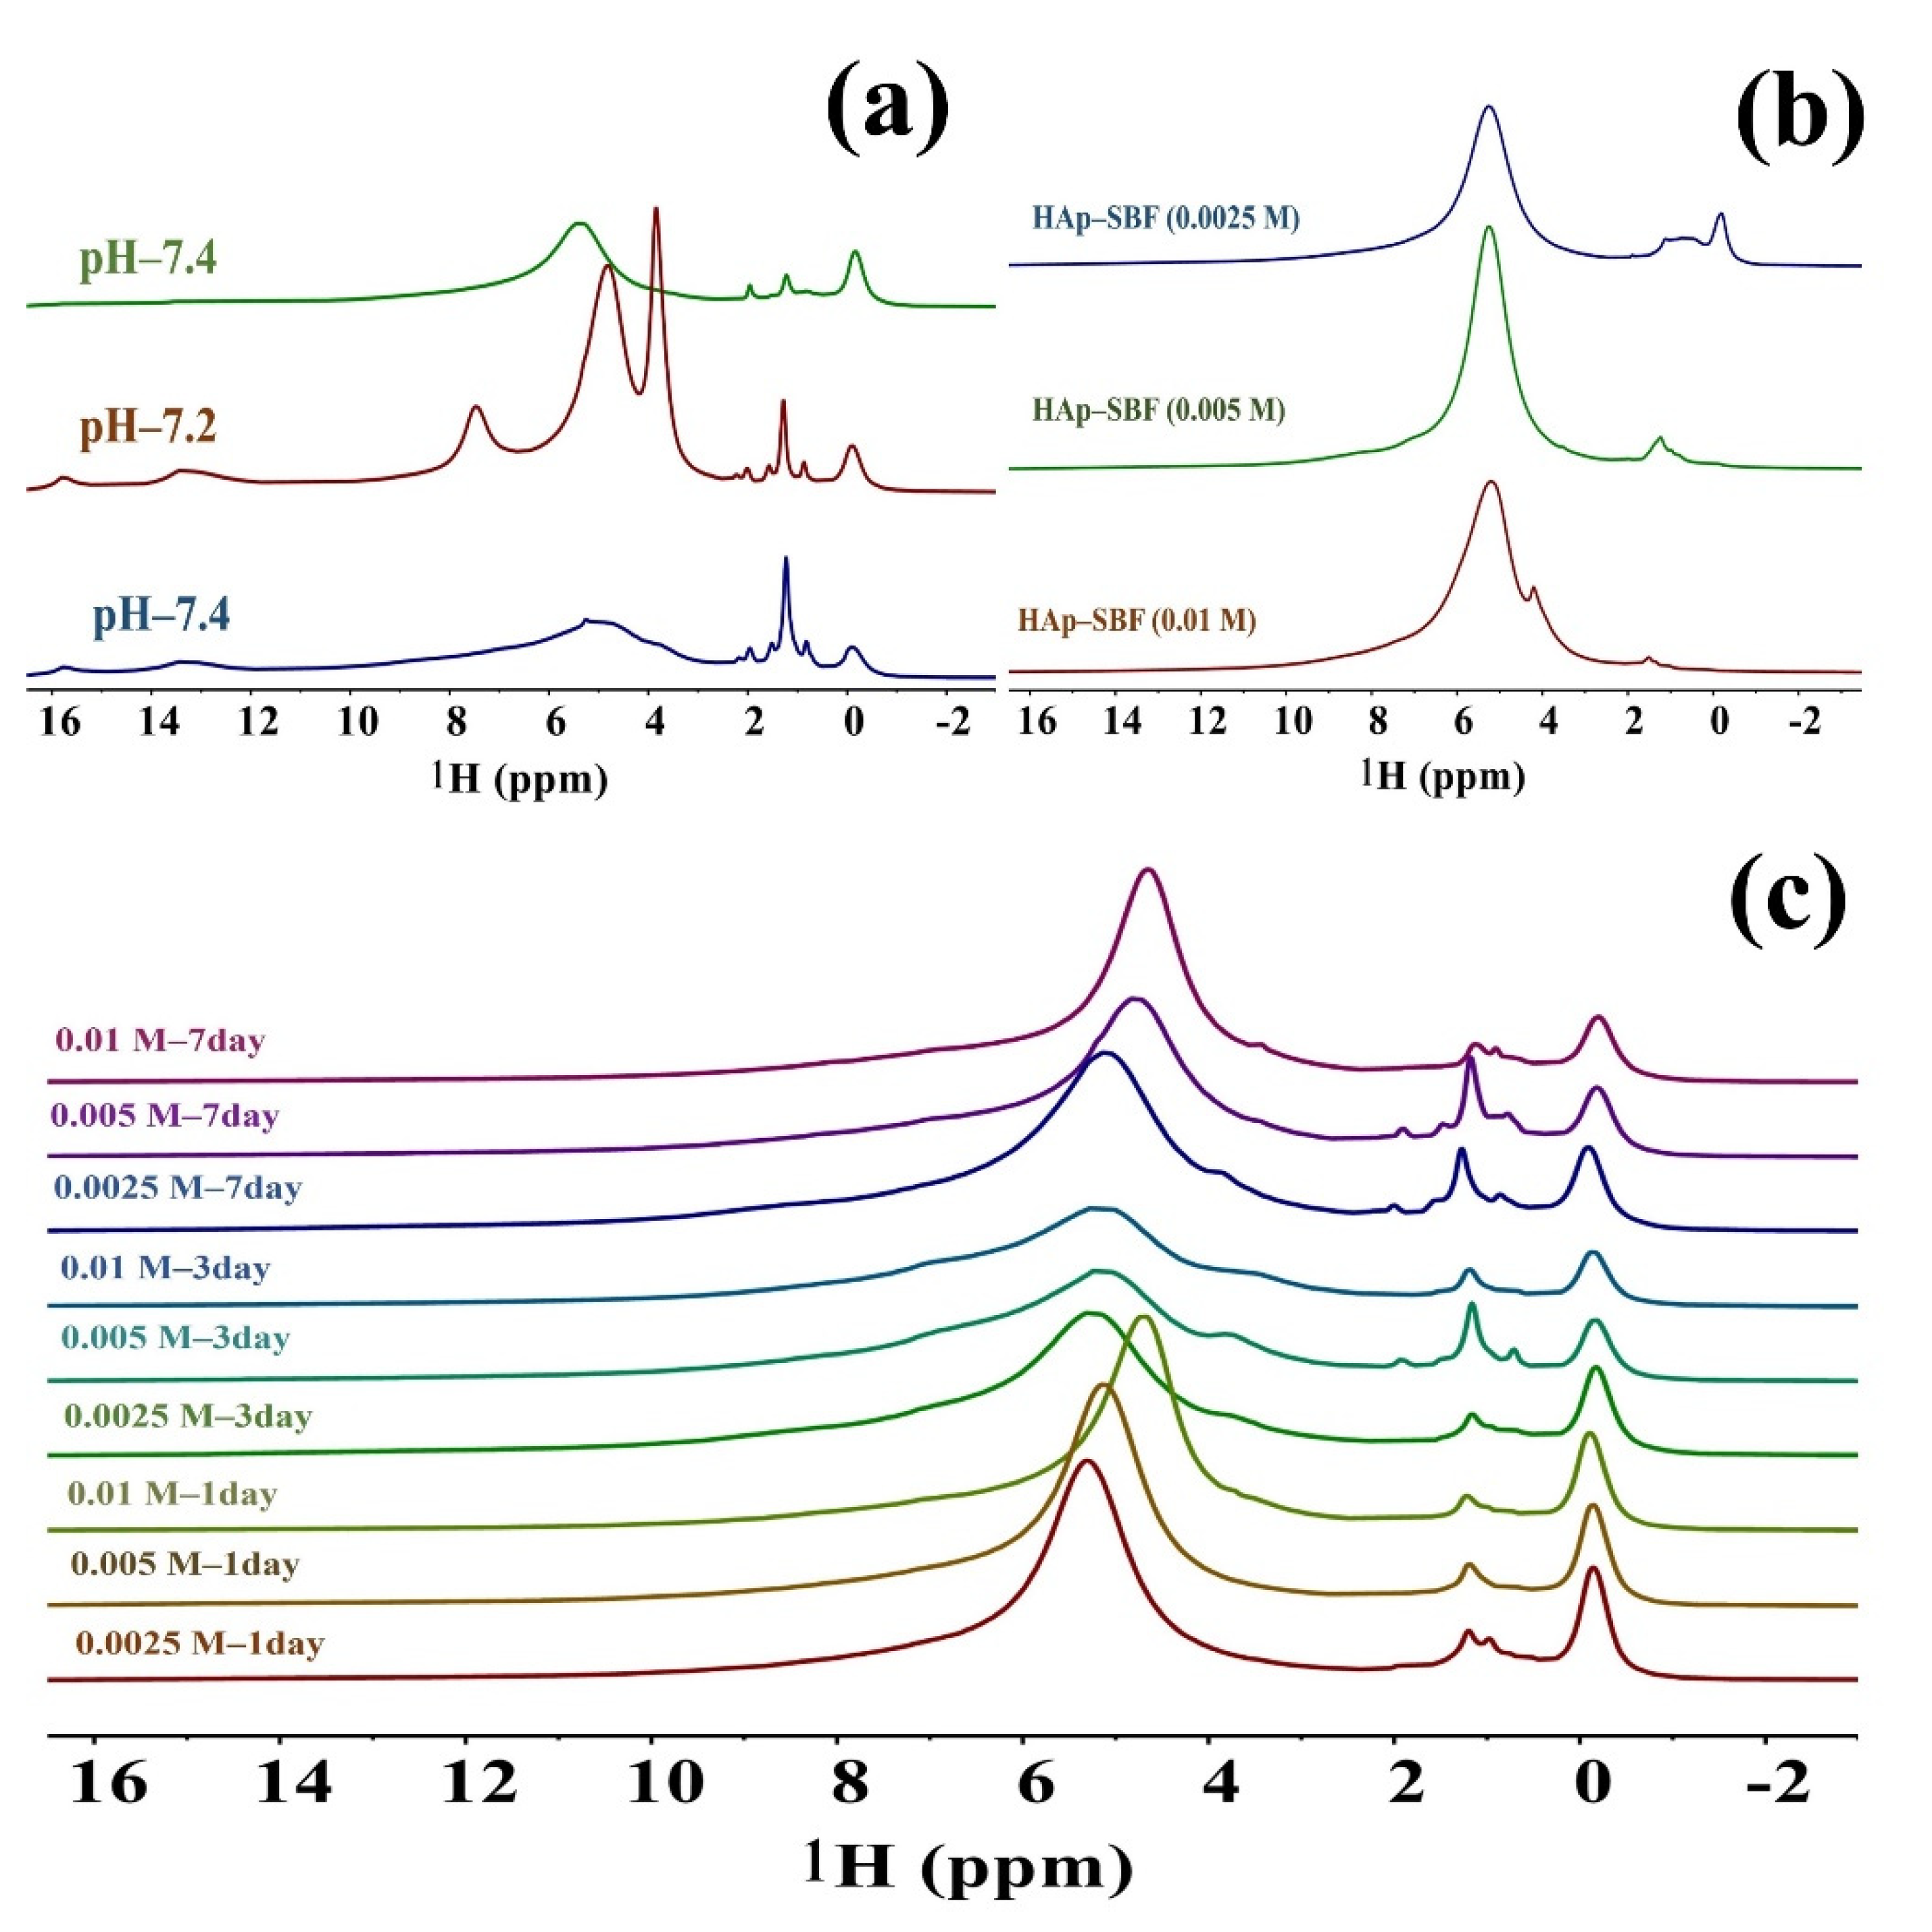
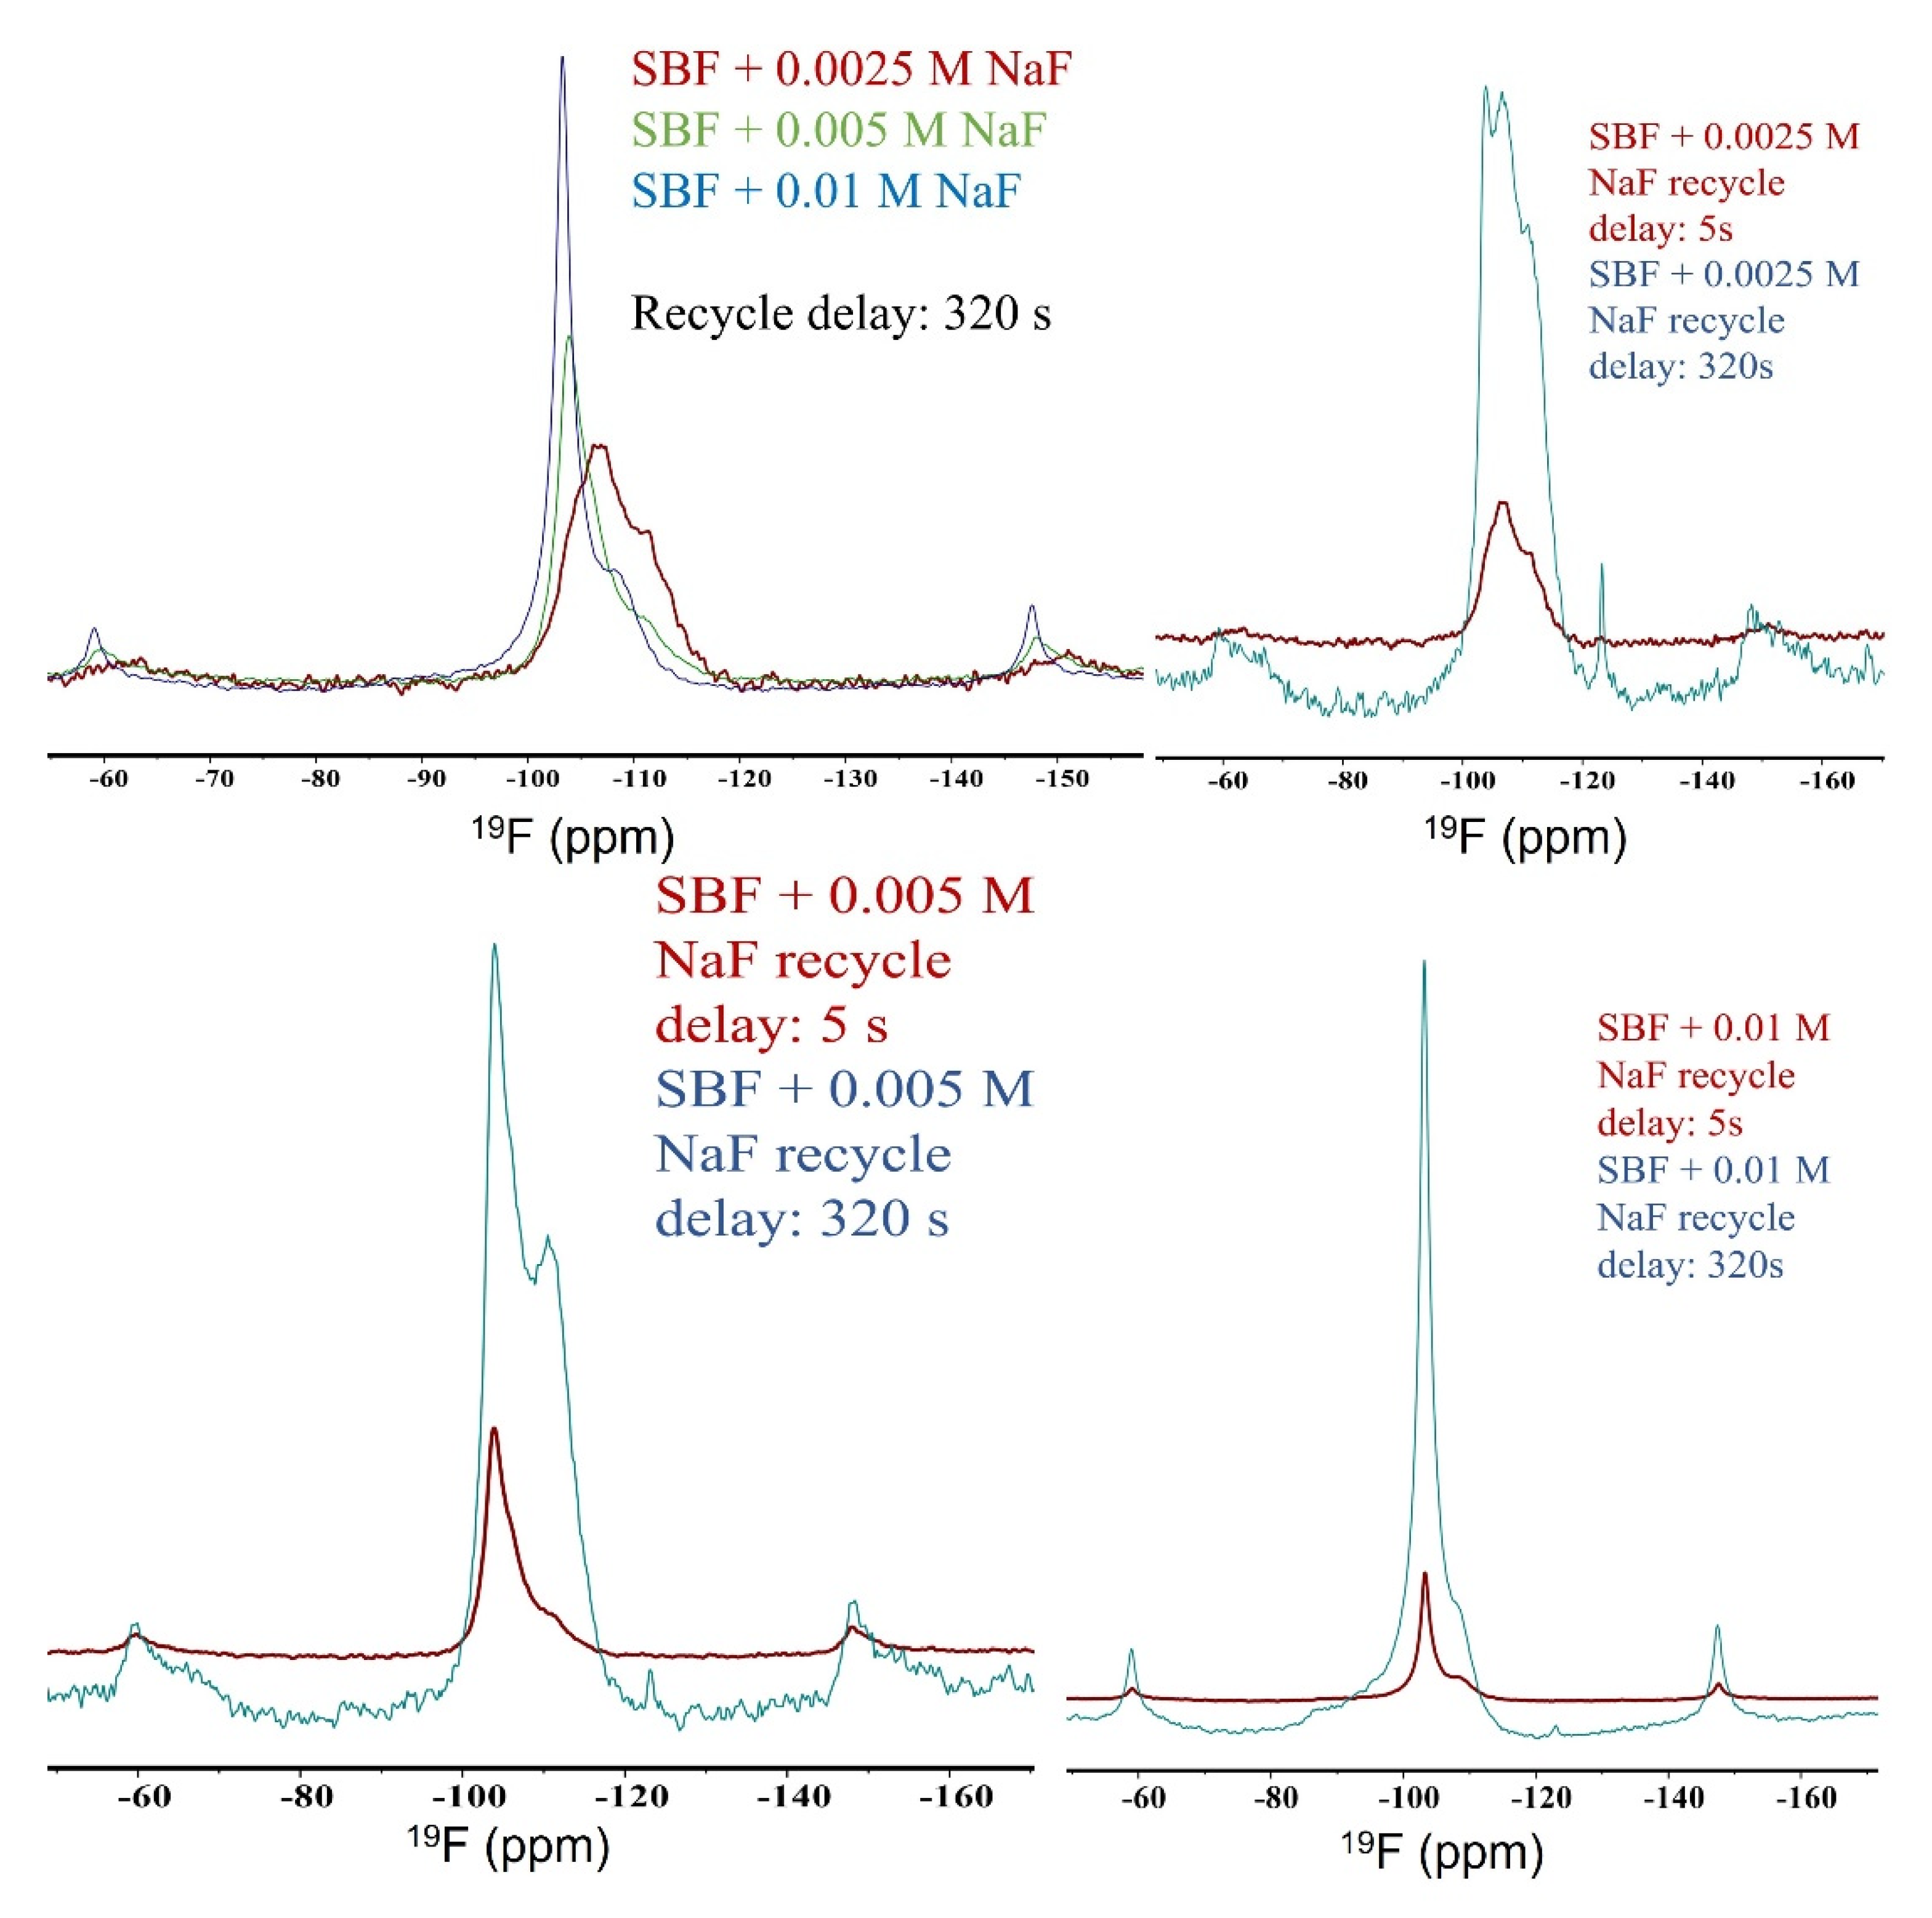
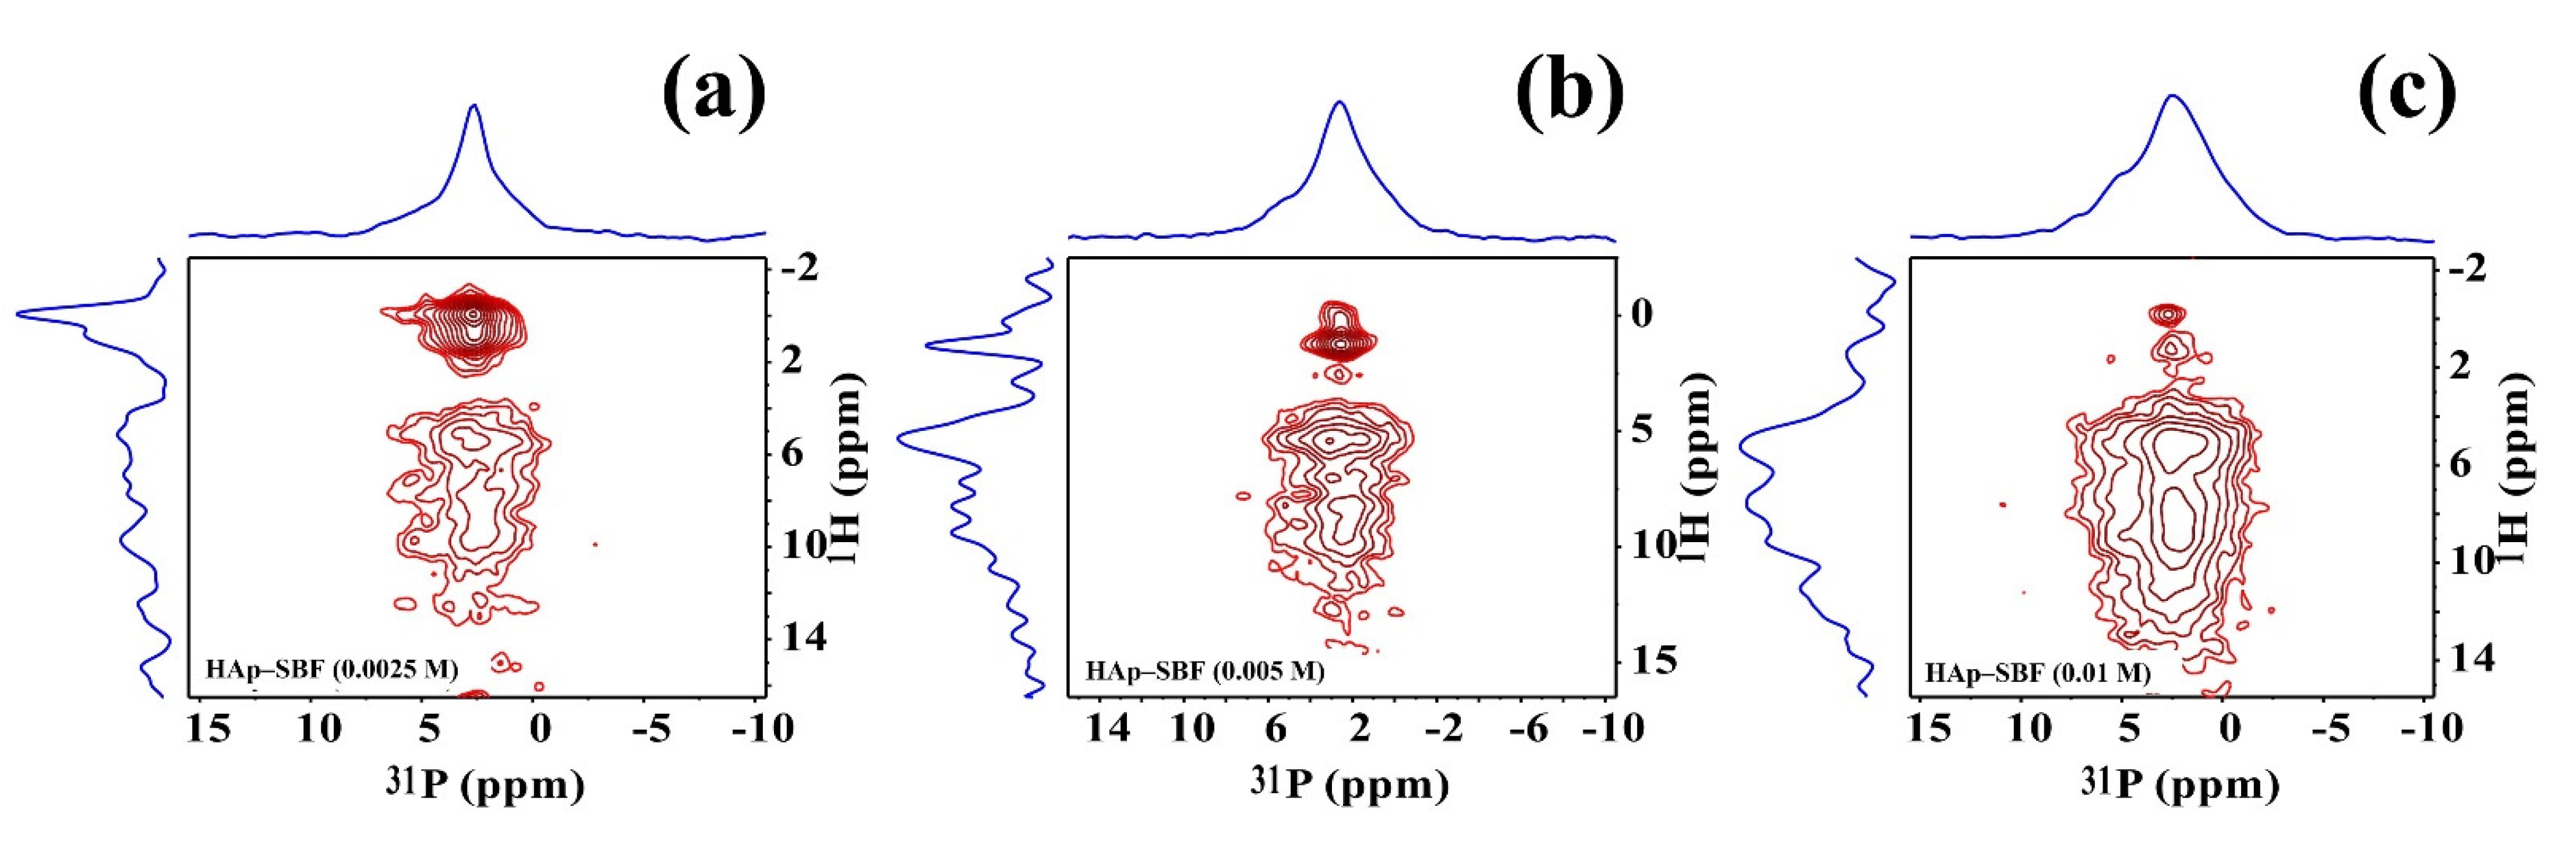
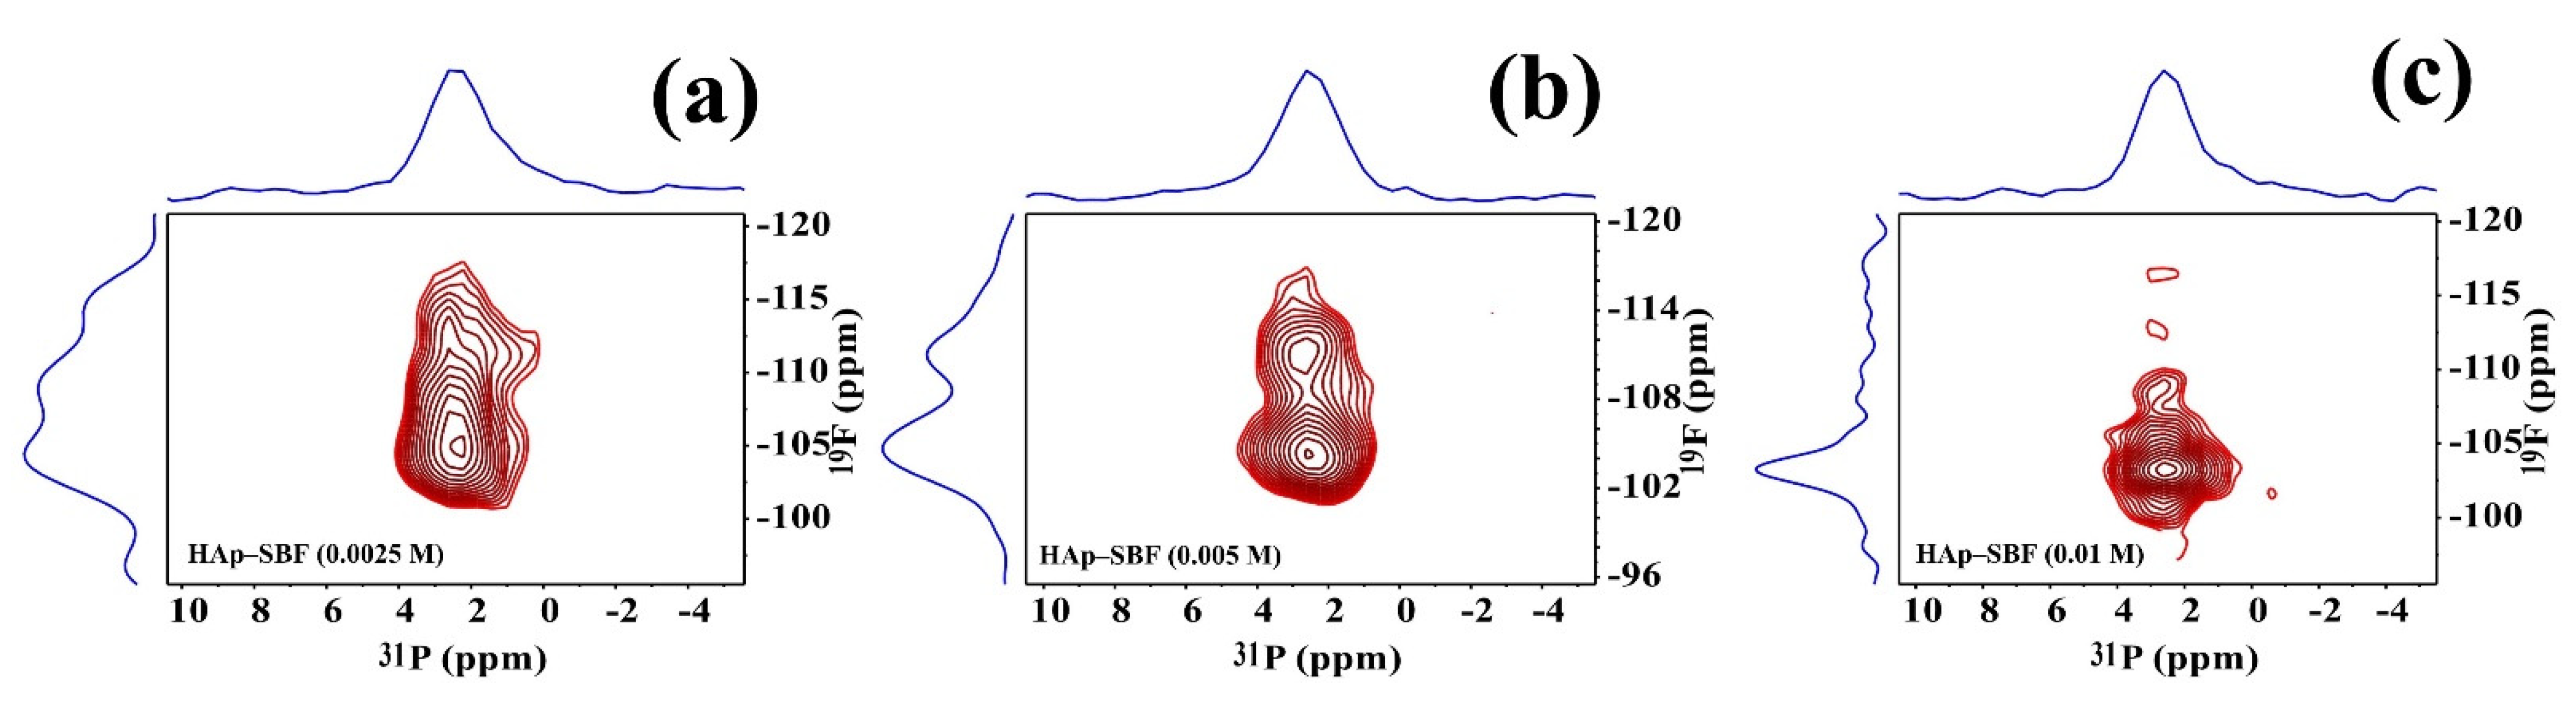
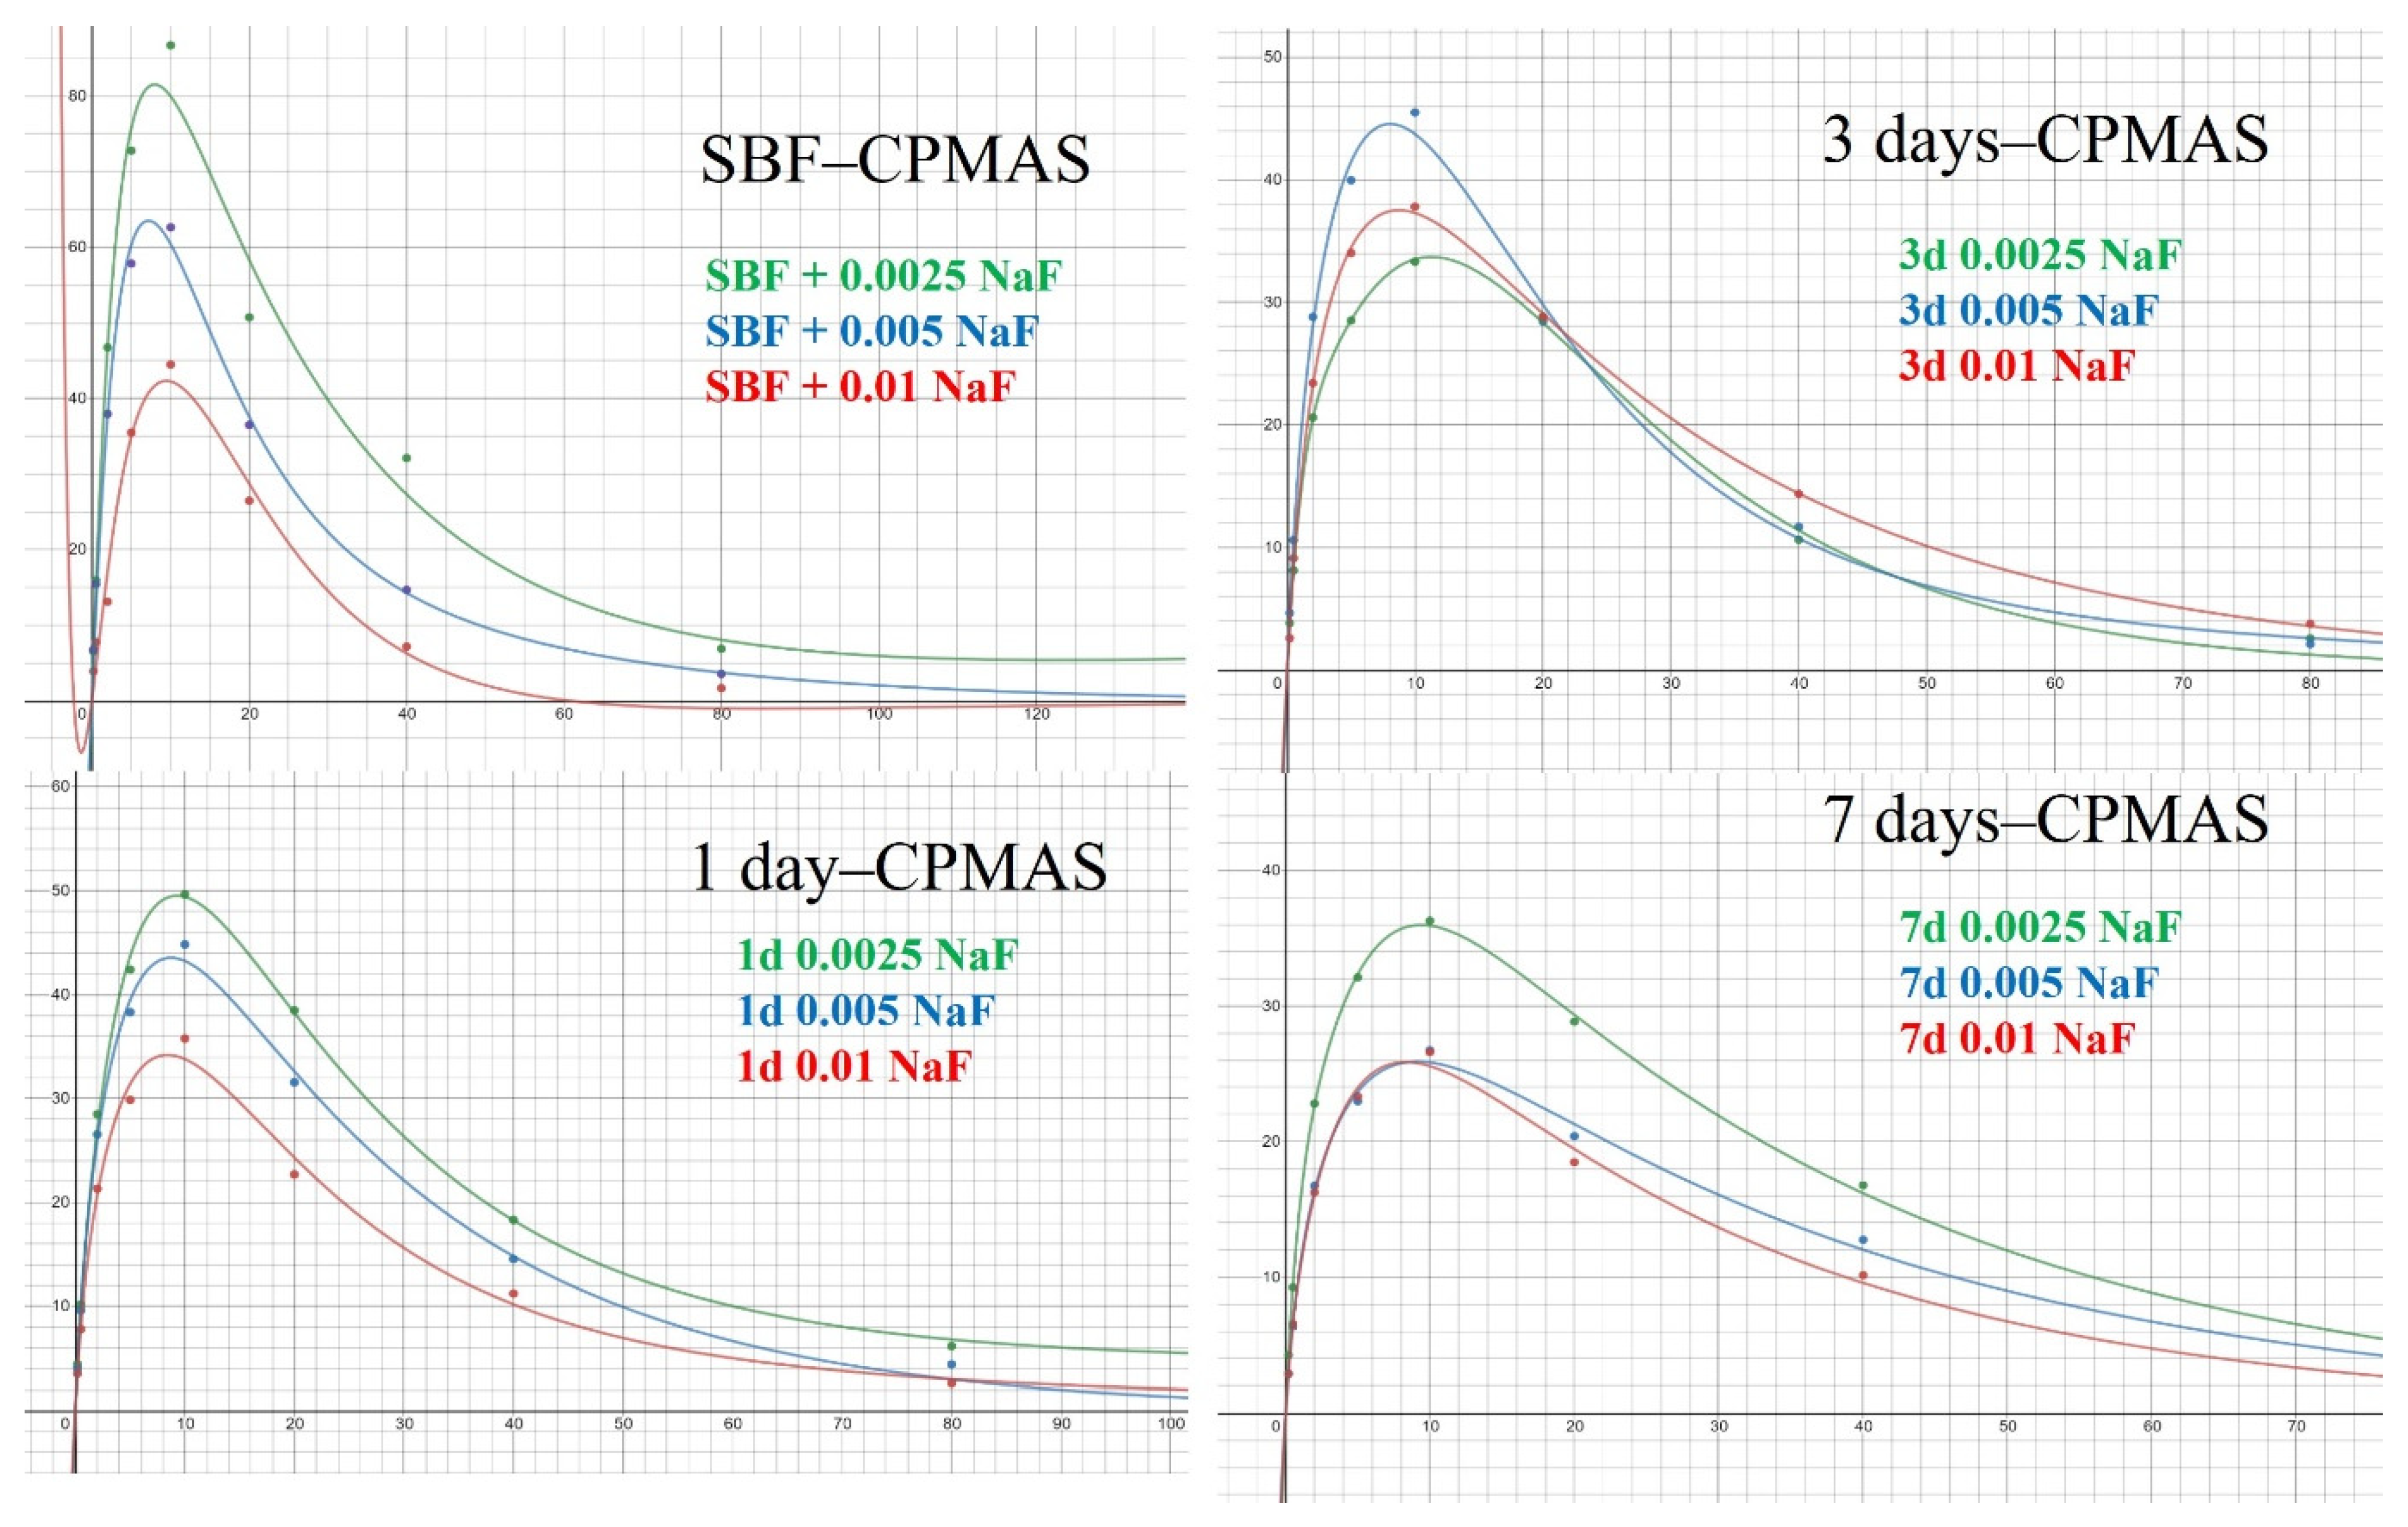
3.3. Solid-State NMR
4. Conclusions
Supplementary Materials
Author Contributions
Funding
Institutional Review Board Statement
Informed Consent Statement
Data Availability Statement
Acknowledgments
Conflicts of Interest
References
- Bonnucci, E.; Motta, P.M. Ultrastructure of Skeletal Tissues. Bone and Cartilage in Health and Disease; Kluwer Academic Publishers: Boston, MA, USA, 1990. [Google Scholar]
- Cowin, S.C. Bone Mechanics Handbook; CRC Press: Boca Raton, FL, USA, 2001. [Google Scholar]
- Currey, J.D. Bones: Structure and Mechanics; Princeton University Press: Princeton, NJ, USA, 2002. [Google Scholar]
- Burr, D.B.; Allen, M.R. Basic and Applied Bone Biology; Elsevier: Amsterdam, The Netherlands, 2014. [Google Scholar]
- Brookes, M.; Revell, W.J. Blood Supply of Bone: Scientific Aspects; Springer: London, UK, 1998. [Google Scholar]
- U.S. Department of Health and Human Services. Bone Health and Osteoporosis: A Report of the Surgeon General; U.S. Department of Health and Human Services: Washington, DC, USA, 2004. [Google Scholar]
- Leeming, D.J.; Henriksen, K.; Byrjalsen, I.; Qvist, P.; Madsen, S.H.; Garnero, P.; Karsdal, M.A. Is bone quality associated with collagen age? Osteoporos. Int. 2009, 20, 1461–1470. [Google Scholar] [CrossRef] [PubMed]
- Weiner, S.; Wagner, H.D. The material bone: Structure mechanical function relations. Annu. Rev. Mater. Sci. 1998, 28, 271–298. [Google Scholar] [CrossRef]
- Chen, P.Y.; McKittrick, J.; Meyers, M.A. Biological materials: Functional adaptations and bioinspired designs. Progr. Mater. Sci. 2012, 57, 1492–1704. [Google Scholar] [CrossRef]
- McKay, W.F.; Peckham, S.M.; Badura, J.M. A comprehensive clinical review of recombinant human bone morphogenetic protein-2 (INFUSE (R) Bone Graft). Int. Orthop. 2007, 31, 729–734. [Google Scholar] [CrossRef] [Green Version]
- Beck, K.; Brodsky, B. Supercoiled protein motifs: The collagen triple- helix and the alpha-helical coiled coil. J. Struct. Biol. 1998, 122, 17–29. [Google Scholar] [CrossRef] [PubMed]
- Sherman, V.R.; Yang, W.; Meyers, M. The materials science of collagen. J. Mech. Behav. Biomed. Mater. 2015, 52, 22–50. [Google Scholar] [CrossRef] [PubMed]
- Yang, W.; Sherman, V.R.; Gludovatz, B.; Schaible, E.; Stewart, P.; Ritchie, R.O.; Meyers, M.A. On the tear resistance of skin. Nat. Commun. 2015, 6, 1–10. [Google Scholar] [CrossRef] [Green Version]
- Mehdi, S.S.; Khorasani, M.T.; Dinpanah-Khoshdargi, E.; Jamshidi, A. Synthesis methods for nanosized hydroxyapatite with diverse structures. Acta Biomater. 2013, 98, 7591–7621. [Google Scholar]
- Loyt, D.A.; Shea, K.J. Bridged polysilsesquioxanes. Highly porous hybrid organic-inorganic materials. Chem. Rev. 1995, 95, 1431–1442. [Google Scholar]
- Plass, R.; Pelet, S.; Krueger, J.; Grätzel, M.; Bach, U. Quantum dot sensitization of organic—Inorganic hybrid solar cells. J. Phys. Chem. B 2002, 106, 7578–7580. [Google Scholar] [CrossRef]
- Wang, S.; Kang, Y.; Wang, L.; Zhang, H.; Wang, Y.; Wang, Y. Organic/inorganic hybrid sensors: A review. Sens. Actuators B Chem. 2013, 182, 467–481. [Google Scholar] [CrossRef]
- Draxl, C.; Nabok, D.; Hannewald, K. Organic/inorganic hybrid materials: Challenges for ab initio methodology. Acc. Chem. Res. 2014, 47, 3225–3232. [Google Scholar] [CrossRef] [PubMed]
- Vallet-Regí, M.; Colilla, M.; González, B. Medical applications of organic—Inorganic hybrid materials within the field of silica-based bioceramics. Chem. Soc. Rev. 2011, 40, 596–607. [Google Scholar] [CrossRef]
- Chen, W.; Shi, L.; Zhou, H.; Zhu, J.; Wang, Z.; Mao, X.; Chi, M.; Sun, L.; Yuan, S. Water-based organic–inorganic hybrid coating for a high-performance separator. ACS Sustain. Chem. Eng. 2016, 4, 3794–3802. [Google Scholar] [CrossRef]
- Kaushik, A.; Kumar, R.; Arya, S.K.; Nair, M.; Malhotra, B.D.; Bhansali, S. Organic−inorganic hybrid nanocomposite-based gas sensors for environmental monitoring. Chem. Rev. 2015, 115, 4571–4606. [Google Scholar] [CrossRef] [PubMed]
- Bonucci, E. Biological Calcification: Normal and Pathological Processes in the Early Stage; Springer: Berlin/Heidelberg, Germany, 2007. [Google Scholar]
- George, A.; Veis, A. Phosphorylated proteins and control over apatite nucleation, crystal growth, and inhibition. Chem. Rev. 2008, 108, 4670–4693. [Google Scholar] [CrossRef] [Green Version]
- Tomoaia, G.; Pasca, R.D. On the collagen mineralization. A Review. Clujul Med. 2015, 88, 15–23. [Google Scholar] [CrossRef] [Green Version]
- Nudelman, F.; Pieterse, K.; George, A.; Bomans, P.H.; Friedrich, H.; Brylka, L.J.; Hilbers, P.A.; de With, G.; Sommerdijk, N.A. The role of collagen in bone apatite formation in the presence of hydroxyapatite nucleation inhibitors. Nat. Mater. 2010, 9, 1004–1009. [Google Scholar] [CrossRef] [Green Version]
- Habraken, W.J.; Tao, J.; Brylka, L.J.; Friedrich, H.; Bertinetti, L.; Schenk, A.S.; Verch, A.; Dmitrovic, V.; Bomans, P.H.; Frederik, P.M.; et al. Ion-association complexes unite classical and non-classical theories for the biomimetic nucleation of calcium phosphate. Nat. Commun. 2013, 4, 1–12. [Google Scholar] [CrossRef] [Green Version]
- Tintut, Y.; Demer, L.L. Effects of bioactive lipids and lipoproteins on bone. Trends Endocrinol. Metab. 2014, 25, 53–59. [Google Scholar] [CrossRef] [PubMed] [Green Version]
- Torres, A.M.; Matheny, J.B.; Keaveny, T.M.; Taylor, D.; Rimnac, C.M.; Hernandez, C.J. Material heterogeneity in cancellous bone promotes deformation recovery after mechanical failure. Proc. Natl. Acad. Sci. USA 2016, 113, 2892–2897. [Google Scholar] [CrossRef] [PubMed] [Green Version]
- Kokubo, T.; Kushitani, H.; Sakka, S.; Kitsugi, T.; Yamamuro, T. Solutions able to reproduce in vivo surface-structure changes in bioactive glass-ceramic A-W3. J. Biomed. Mater. Res. 1990, 24, 721–734. [Google Scholar] [CrossRef]
- Kokubo, T. Bioactive glass ceramics: Properties and applications. Biomaterials 1991, 12, 155–163. [Google Scholar] [CrossRef]
- Kokubo, T.; Takadama, H. How useful is SBF in predicting in vivo bone bioactivity? Biomaterials 2006, 27, 2907–2915. [Google Scholar] [CrossRef] [PubMed]
- Kobayashi, T.; Ono, S.; Hirakura, S.; Oaki, Y.; Imai, H. Morphological variation of hydroxyapatite grown in aqueous solution based on simulated body fluid. CrystEngComm 2012, 14, 1143–1149. [Google Scholar] [CrossRef]
- Kokubo, T.; Yamaguchi, S. Novel bioactive materials developed by simulated body fluid evaluation: Surface-modified Ti metal and its alloys. Acta Biomater. 2016, 44, 16–30. [Google Scholar] [CrossRef]
- Wang, L.; Nancollas, G.H. Calcium orthophosphates: Crystallization and dissolution. Chem. Rev. 2008, 108, 4628–4669. [Google Scholar] [CrossRef] [PubMed] [Green Version]
- Gregory, T.M.; Moreno, E.C.; Brown, W.E. Preparation and Solubility of Hydroxyapatite. J. Res. Nat. Bur. Stand. 1968, 74, 773–782. [Google Scholar]
- DeRooij, J.F.; Heughebaert, J.C.; Nancollas, G.H. A pH study of calcium phosphate seeded precipitation. J. Colloid Interface Sci. 1984, 100, 350. [Google Scholar] [CrossRef]
- Chen, Z.-F.; Darvell, B.W.; Leung, V.W.-H. Hydroxyapatite solubility in simple inorganic Solutions. Arch. Oral Biol. 2004, 49, 359–367. [Google Scholar] [CrossRef]
- Kaflak, A.; Chmielewski, D.; Kolodziejski, W. Solid-state NMR study of discrete environments of bone mineral nanoparticles using phosphorus-31 relaxation. J. Appl. Biomed. 2016, 14, 321–330. [Google Scholar] [CrossRef]
- Gelli, R.; Ridi, F.; Baglioni, P. The importance of being amorphous: Calcium and magnesium phosphates in the human body. Adv. Colloid Interface Sci. 2019, 269, 219–235. [Google Scholar] [CrossRef] [PubMed]
- Edén, M. Structure and formation of amorphous calcium phosphate and its role as surface layer of nanocrystalline apatite: Implications for bone mineralization. Materialia 2021, 17, 101107–101151. [Google Scholar] [CrossRef]
- Von Euw, S.; Wang, Y.; Laurent, G.; Drouet, C.; Babonneau, F.; Nassif, N. Bone mineral: New insights into its chemical composition. Sci. Rep. 2019, 9, 8456–8466. [Google Scholar] [CrossRef] [PubMed] [Green Version]
- Arcos, D.; Vallet-Regí, M. Substituted hydroxyapatite coatings of bone implants. J. Mater. Chem. B 2020, 8, 1781–1800. [Google Scholar] [CrossRef]
- Osman, M.B.; Diallo-Garcia, S.; Herledan, V.; Dalil Brouri, D.; Yoshioka, T.; Kubo, J.; Millo, Y.; Costentin, G. Discrimination of surface and bulk structure of crystalline hydroxyapatite nanoparticles by NMR. J. Phys. Chem. C 2015, 119, 23008–23020. [Google Scholar] [CrossRef]
- Wang, Y.; Von Euw, S.; Fernandes, F.M.; Cassaignon, S.; Selmane, M.; Laurent, G.; Pehau-Arnaudet, G.; Coelho, C.; Bonhomme-Coury, L.; Giraud-Guille, M.M.; et al. Water-mediated structuring of bone apatite. Nat. Mater. 2013, 12, 1144–1153. [Google Scholar] [CrossRef] [Green Version]
- Klimavicius, V.; Kareiva, A.; Balevicius, V. Solid-state NMR study of hydroxyapatite containing amorphous phosphate phase and nanostructured hydroxyapatite: Cut-off averaging of CP-MAS kinetics and size profiles of spin clusters. J. Phys. Chem. C 2014, 118, 28914–28921. [Google Scholar] [CrossRef]
- Coppel, Y.; Prigent, Y.; Grégoire, G. Characterization of hydrogenated dentin components by advanced 1 H solid-state NMR experiments. Acta Biomater. 2021, 120, 156–166. [Google Scholar] [CrossRef]
- Kristinaitytė, K.; Dagys, L.; Kausteklis, J.; Klimavicius, V.; Doroshenko, I.; Pogorelov, V.; Valevičienė, N.R.; Balevicius, V. NMR and FTIR studies of clustering of water molecules: From low-temperature matrices to nano-structured materials used in innovative medicine. J. Mol. Liq. 2017, 235, 1–6. [Google Scholar] [CrossRef]
- Mathew, R.; Turdean-Ionescu, C.; Yu, Y.; Stevensson, B.; Izquierdo-Barba, I.; García, A.; Arcos, D.; Vallet-Regí, M.; Edeń, M. Proton environments in biomimetic calcium phosphates formed from mesoporous bioactive CaO–SiO2–P2O5 glasses in vitro: Insights from solid-state NMR. J. Phys. Chem. C 2017, 121, 13223–13238. [Google Scholar] [CrossRef] [Green Version]
- Kaflak, A.; Moskalewski, S.; Kolodziejskia, W. The solid-state proton NMR study of bone using a dipolar filter: Apatite hydroxyl content versus animal age. RSC Adv. 2019, 9, 16909–16919. [Google Scholar] [CrossRef] [Green Version]
- Shah, P.; Westwell, A.D. The role of fluorine in medicinal chemistry. J. Enzym. Inhib. Med. Chem. 2007, 22, 527–540. [Google Scholar] [CrossRef] [PubMed] [Green Version]
- Dalvi, V.H.; Rossky, P.J. Molecular origins of fluorocarbon hydrophobicity. Proc. Natl. Acad. Sci. USA 2010, 107, 13603–13607. [Google Scholar] [CrossRef] [PubMed] [Green Version]
- Mecinovic, J.; Snyder, P.W.; Mirica, K.A.; Bai, S.; Mack, E.T.; Kwant, R.L.; Moustakas, D.T.; Héroux, A.; Whitesides, G.M. Fluoroalkyl and alkyl chains have similar hydrophobicities in binding to the “hydrophobic wall” of carbonic anhydrase. J. Am. Chem. Soc. 2011, 133, 14017–14026. [Google Scholar] [CrossRef] [PubMed] [Green Version]
- Robalo, J.R.; Huhmann, S.; Koksch, B.; Verde, A.V. The multiple origins of the hydrophobicity of fluorinated apolar amino acids. Chem 2017, 3, 881–897. [Google Scholar] [CrossRef] [Green Version]
- Wu, C.H.; Ramamoorthy, A.; Gierasch, L.M. Simultaneous charac-terization of the amide 1H chemical shift, 1H–15N dipolar, and 15N chemical shift interaction tensors in a peptide bond by three-dimensional solid-state NMR spectroscopy. J. Am. Chem. Soc. 1995, 117, 6148–6614. [Google Scholar] [CrossRef]
- Elvis, O.; López, E.O.; Mello, A.; Farina, M.; Rossi, A.M.; Rossi, A.L. Nanoscale analysis of calcium phosphate films obtained by RF magnetron sputtering during the initial stages of deposition. Surf. Coat. Technol. 2015, 279, 16–24. [Google Scholar]
- Mondal, S.; Dorozhkin, S.V.; Pal, U. Recent progress on fabrication and drug delivery applications of nanostructured hydroxyapatite. Wiley Interdiscip. Rev. Nanomed. Nanobiotechnol. 2018, 10, e1504. [Google Scholar] [CrossRef]
- Zhang, S. Hydroxyapatite Coatings for Biomedical Applications; CRC Press: Boca Raton, FL, USA, 2013. [Google Scholar]
- Mucalo, M. Hydroxyapatite (HAp) for Biomedical Applications; Elsevier: Amsterdam, The Netherlands, 2015. [Google Scholar]


Publisher’s Note: MDPI stays neutral with regard to jurisdictional claims in published maps and institutional affiliations. |
© 2022 by the authors. Licensee MDPI, Basel, Switzerland. This article is an open access article distributed under the terms and conditions of the Creative Commons Attribution (CC BY) license (https://creativecommons.org/licenses/by/4.0/).
Share and Cite
Thakur, D.; Yeh, S.-C.; Cheng, R.-H.; Loke, S.-S.; Wei, H.-H.; Cheng, P.-Y.; Lai, Y.-C.; Chen, H.-Y.; Huang, Y.-R.; Ding, S.-W. Varying Synthesis Conditions and Comprehensive Characterization of Fluorine-Doped Hydroxyapatite Nanocrystals in a Simulated Body Fluid. Crystals 2022, 12, 139. https://doi.org/10.3390/cryst12020139
Thakur D, Yeh S-C, Cheng R-H, Loke S-S, Wei H-H, Cheng P-Y, Lai Y-C, Chen H-Y, Huang Y-R, Ding S-W. Varying Synthesis Conditions and Comprehensive Characterization of Fluorine-Doped Hydroxyapatite Nanocrystals in a Simulated Body Fluid. Crystals. 2022; 12(2):139. https://doi.org/10.3390/cryst12020139
Chicago/Turabian StyleThakur, Dinbandhu, Sheng-Chi Yeh, Ren-Hao Cheng, Song-Seng Loke, Hung-Hsiang Wei, Po-Yu Cheng, Yi-Chun Lai, Hsuan-Ying Chen, Yu-Ren Huang, and Shang-Wu Ding. 2022. "Varying Synthesis Conditions and Comprehensive Characterization of Fluorine-Doped Hydroxyapatite Nanocrystals in a Simulated Body Fluid" Crystals 12, no. 2: 139. https://doi.org/10.3390/cryst12020139