Article

Synergistic Effect of the KBrO3 Electron Acceptor on the Photocatalytic Performance of the Nb-TiO2 Nanocomposite for Polluted Phenol Red Wastewater Treatment

by
Najla Khaled Almulhem
1,
Chawki Awada
1,*,
Nisrin Mohammed Alnaim
1,
Nada Al Taisan
1,
Adil Ahmed Alshoaibi
1 and
Nagih M. Shaalan
1,2,*
1
Department of Physics, College of Science, King Faisal University, P.O. Box 400, Al-Ahsa 31982, Saudi Arabia
2
Physics Department, Faculty of Science, Assiut University, Assiut 71516, Egypt
*
Authors to whom correspondence should be addressed.
Crystals 2022, 12(12), 1758; https://doi.org/10.3390/cryst12121758
Submission received: 31 October 2022 / Revised: 29 November 2022 / Accepted: 1 December 2022 / Published: 4 December 2022
(This article belongs to the Special Issue Advances in Composite Electrodes Materials)

Abstract

:
In this work, the effect of KBrO3 on the photodegradation mechanism of Nb-TiO2 nanocomposites was analyzed. The photocatalytic activities of Nb-TiO2 were evaluated by using a high concentration of phenol red (PR). Nb-TiO2 nanocomposites were fabricated by a simple sol–gel route with new experimental conditions. HRTEM and EDX were used to study the structural properties of the Nb-TiO2 nanocomposites. KBrO3 decreased the degradation time of 20 mg·L−1 of phenol red to 110 min, shorter than that in our previous work without KBrO3. In addition, the results showed that the addition of KBrO3 led to a significant degradation process, which reached an efficiency of 95%. The fast decomposition of the PR pollutants was due to the charge transfer between the KBrO3 and Nb-TiO2 nanocomposites in the wastewater treatment.

1. Introduction

Growing demand for clean water is a serious concern worldwide, especially in desert areas such as Saudi Arabia, where the sources of clean water are limited. Climate change and increasing population are the primary reasons for this problem. To address the issue, governments are providing more research funding to develop innovative solutions for the purification of water polluted with contaminants, such as inorganic dyes. One of these solutions is to use an advanced oxidation process based on semiconductor photocatalysts.
Due to its important optical and electronic properties, TiO2 is still one of the best candidates to be used in a variety of applications such as solar cell transport layers, hydrogen production, pollution removal, and CO2 reduction [1,2,3,4,5]. Using pure TiO2 without any modification has shown a variety of challenges during its application such its higher recombination rate and wide band gap. Different studies have reported the modification of TiO2 semiconductors by doping with metal/transition metal [6,7,8,9,10,11,12,13]. For example, in our previous work, Nb/TiO2 nanocomposites were successfully fabricated and showed a higher photocatalytic activity and a significant shift of the band gap toward the visible wavelength range.
Tuning and engineering the band gap have shown significant effects in increasing the photocatalytic activities of TiO2 nanocrystals; however, there still remains a need to further increase the photocatalytic activities of the metal/metal transition/TiO2 nanocrystals using other strategies. One of these strategies is to use the donors/acceptors of electrons during the reaction [14,15]. KBrO3 was used with metal-supported TiO2 and showed a significant increase in the synergistic photocatalytic degradation of pyridine [16]. KBr and KI were used at various concentrations and pH values on the photocatalytic degradation of dye W-7G using nanoscaled TiO2 [17]. TiO2/UV/H2O2, TiO2/UV/KBrO3, and TiO2/UV/(NH4)2S2O8 were used to remove anthraquinone dye Reactive Blue 19 (RB 19) by heterogeneous advanced oxidation processes under different conditions [18]. Although there has been some research work on the effect of acceptors such as KBrO3 on metal/TiO2 nanocomposites, no work has been reported elsewhere on the effect of acceptors on the new photocatalysts Nb/TiO2 nanocomposites reported recently in our work.
In this work, the structural properties of Nb-TiO2 were investigated using HRTEM and EDX mapping. Two concentrations of KBrO3 were added to the nanocomposites, a comparison was carried out between that with and without KBrO3. The degradation efficiency, concentration decay, and degraded quantity of 20 mg·L−1 PR with 5.0 mg of the photocatalysts were analyzed under UV–Vis irradiation light.

2. Materials and Methods

2.1. Materials Preparation

TiO2 nanoparticles were obtained from Skyspring Nanomaterials (product ID: 7930DL, Houston, TX, USA) with an average size of 5 nm. Niobium (V) ethoxide was obtained from Sigma-Aldrich (CAS number 3236-82-6), Schnelldorf, Germany. KBrO3, ACS, 99% min, was purchased from Alfa Aesar (CAS number 40013), Kandel, Germany. We added niobium ethoxide in a suspension of TiO2 nanopowders with a 2% weight ratio of Nb/TiO2; then, we stirred the solution at 350 °C for 30 min. After stirring, we put the obtained gel in a vacuum chamber for dehydration and crystallization for 48 h. Finally, the powders were ground with a mortar to obtain fine powders of Nb(x)/TiO2. For the photocatalysis experiment, 1 mg and 5 mg of KBrO3 were added to two solutions containing 5 mg of the photocatalysts (Nb-TiO2), denoted by 20% and 100%, respectively. In this work, we used four samples: pure TiO2, Nb-TiO2, Nb-TiO2 with 20 wt.%KBrO3, and Nb-TiO2 with 100 wt.% KBrO3. The method is described in detail in our previous work [19].

2.2. Experimental Methods

For the high transmission electronic microscopy (HRTEM) and EDX measurements, the nanoparticles were sonicated for 10 min; then, 5 µL of the suspension was deposited on a carbon-coated copper grid. HRTEM and EDX measurements were performed using the instrument (JEOL, JEM-2100F, Tokyo, Japan) operated with 200 kV.
For the photocatalysis measurement, a solution of 20 mg·L−1 PR was mixed with 5.0 mg of photocatalyst in 50 mL of PR solution. UV–Vis absorbance spectra (Hitachi UV-1800, Reinach, Suisse) spectrophotometers with scanning rates of 5.0 nm/s were used to record the UV–Vis absorbance spectra of phenol red. A 400 W iron-doped metal halide UV bulb in the spectral region 315–400 nm (UV 400 HL230 Fe Clear-A, UV Light Technology Limited, Birmingham, UK) was used for the photodegradation with an intensity of 100 mW/cm2. The photodegradation of phenol red was conducted by measuring the variation in the absorbance intensity located at 450 nm.

2.3. Photodegradation of Phenol Red

The photocatalysis was carried out based on the absorbance measured within the wavelength range (350–550 nm) The phenol red concentration was 20 mg·L−1. In addition to a blank experiment, we carried out an experiment on the phenol red with KBrO3, which confirmed the negligible effect of KBrO3 on the photolysis of PR when exposed to the UV–Vis light. Figure 1 exhibits the absorbance spectra of the effects of the adsorption and photocatalysis on dye degradation. The absorbance spectrum was firstly measured for the pure dye; then, 5 mg of the nanocomposite was placed in a beaker containing 50 mL dye, which was kept for two hours in the dark before starting the photocatalysis effect, see Figure 1. The adsorption (red curve with irradiation time = 0 min) in the dark could be ignored compared to the photocatalysis degradation. After exposing the mixture to the UV–Vis irradiation for 15 min, a large amount of dye was degraded. The degradation amount of the dye was dependent on the nanocomposite type, where the Nb-TiO2 had faster degradation than the pure TiO2. In addition, the Nb-TiO2 with KBrO3 had faster degradation activity than the others. After 15 min of irradiation, the absorbance spectra at the maximum wavelength decreased from 0.15 to 0.10, 0.08, 0.06, and 0.048 for pure TiO2, Nb-TiO2, Nb-TiO2-20%KBrO3, and Nb-TiO2-100%KBrO3, respectively. The results exhibited simultaneously the effect of Nb and KBrO3 on the photocatalysis activity of the nanocomposites.
The absorbance curves of the pure TiO2 and the Nb-TiO2/KBrO3 nanocomposites were used for the calculation of the PR degradation efficiency. Figure 2 shows the PR degradation efficiency with a concentration of 20 mg·L−1 on 5.0 mg of pure TiO2 and its nanocomposites as a function of the irradiation time. The photodegradation efficiency was estimated based on the following relationship:
η % = C 0 C t C 0 × 100
where C 0 and C t   are the initial and instantaneous concentration of the dye at irradiation time, t, respectively. For pure TiO2 and Nb-TiO2, the efficiency gradually increased with time reaching 31 and 44%, respectively, in the first 15 min. However, for the Nb-TiO2/KBrO3 samples, the efficiency showed higher values by reaching 60 and 70% for 20%KBrO3 and 100%KBrO3, respectively. The photodegradation efficiency of the pure TiO2 and Nb-TiO2 gradually increased, reaching 64 and 86% after an irradiation time of 110 min. The photodegradation efficiency of Nb-TiO2/KBrO3 slowly increased, reaching 92 and 95% after an irradiation time of 110 min.
The maximum of the absorbance spectra was proportional to the dye concentration, where a calibration curve can be carried out. The dye concentration was extracted from the absorbance curve as a function of the irradiation time in terms of mg/L. This curve exhibits the concentration of the phenol red remaining in the solution at each time interval, as shown in Figure 3. For pure and Nb-TiO2, the concentration decreased from 20 mg/L to 13.7 and 11.2 mg/L, respectively, after 15 min of irradiation. The concentration reached 7.0 and 2.6 mg/L after 110 min of irradiation. A significant improvement occurred for the sample mixed with KBrO3 at 20%wt and 100%wt compared to the Nb-TiO2. The dye concentration decreased to 1.6 and 0.8 mg/L, respectively.

3. Results and Discussion

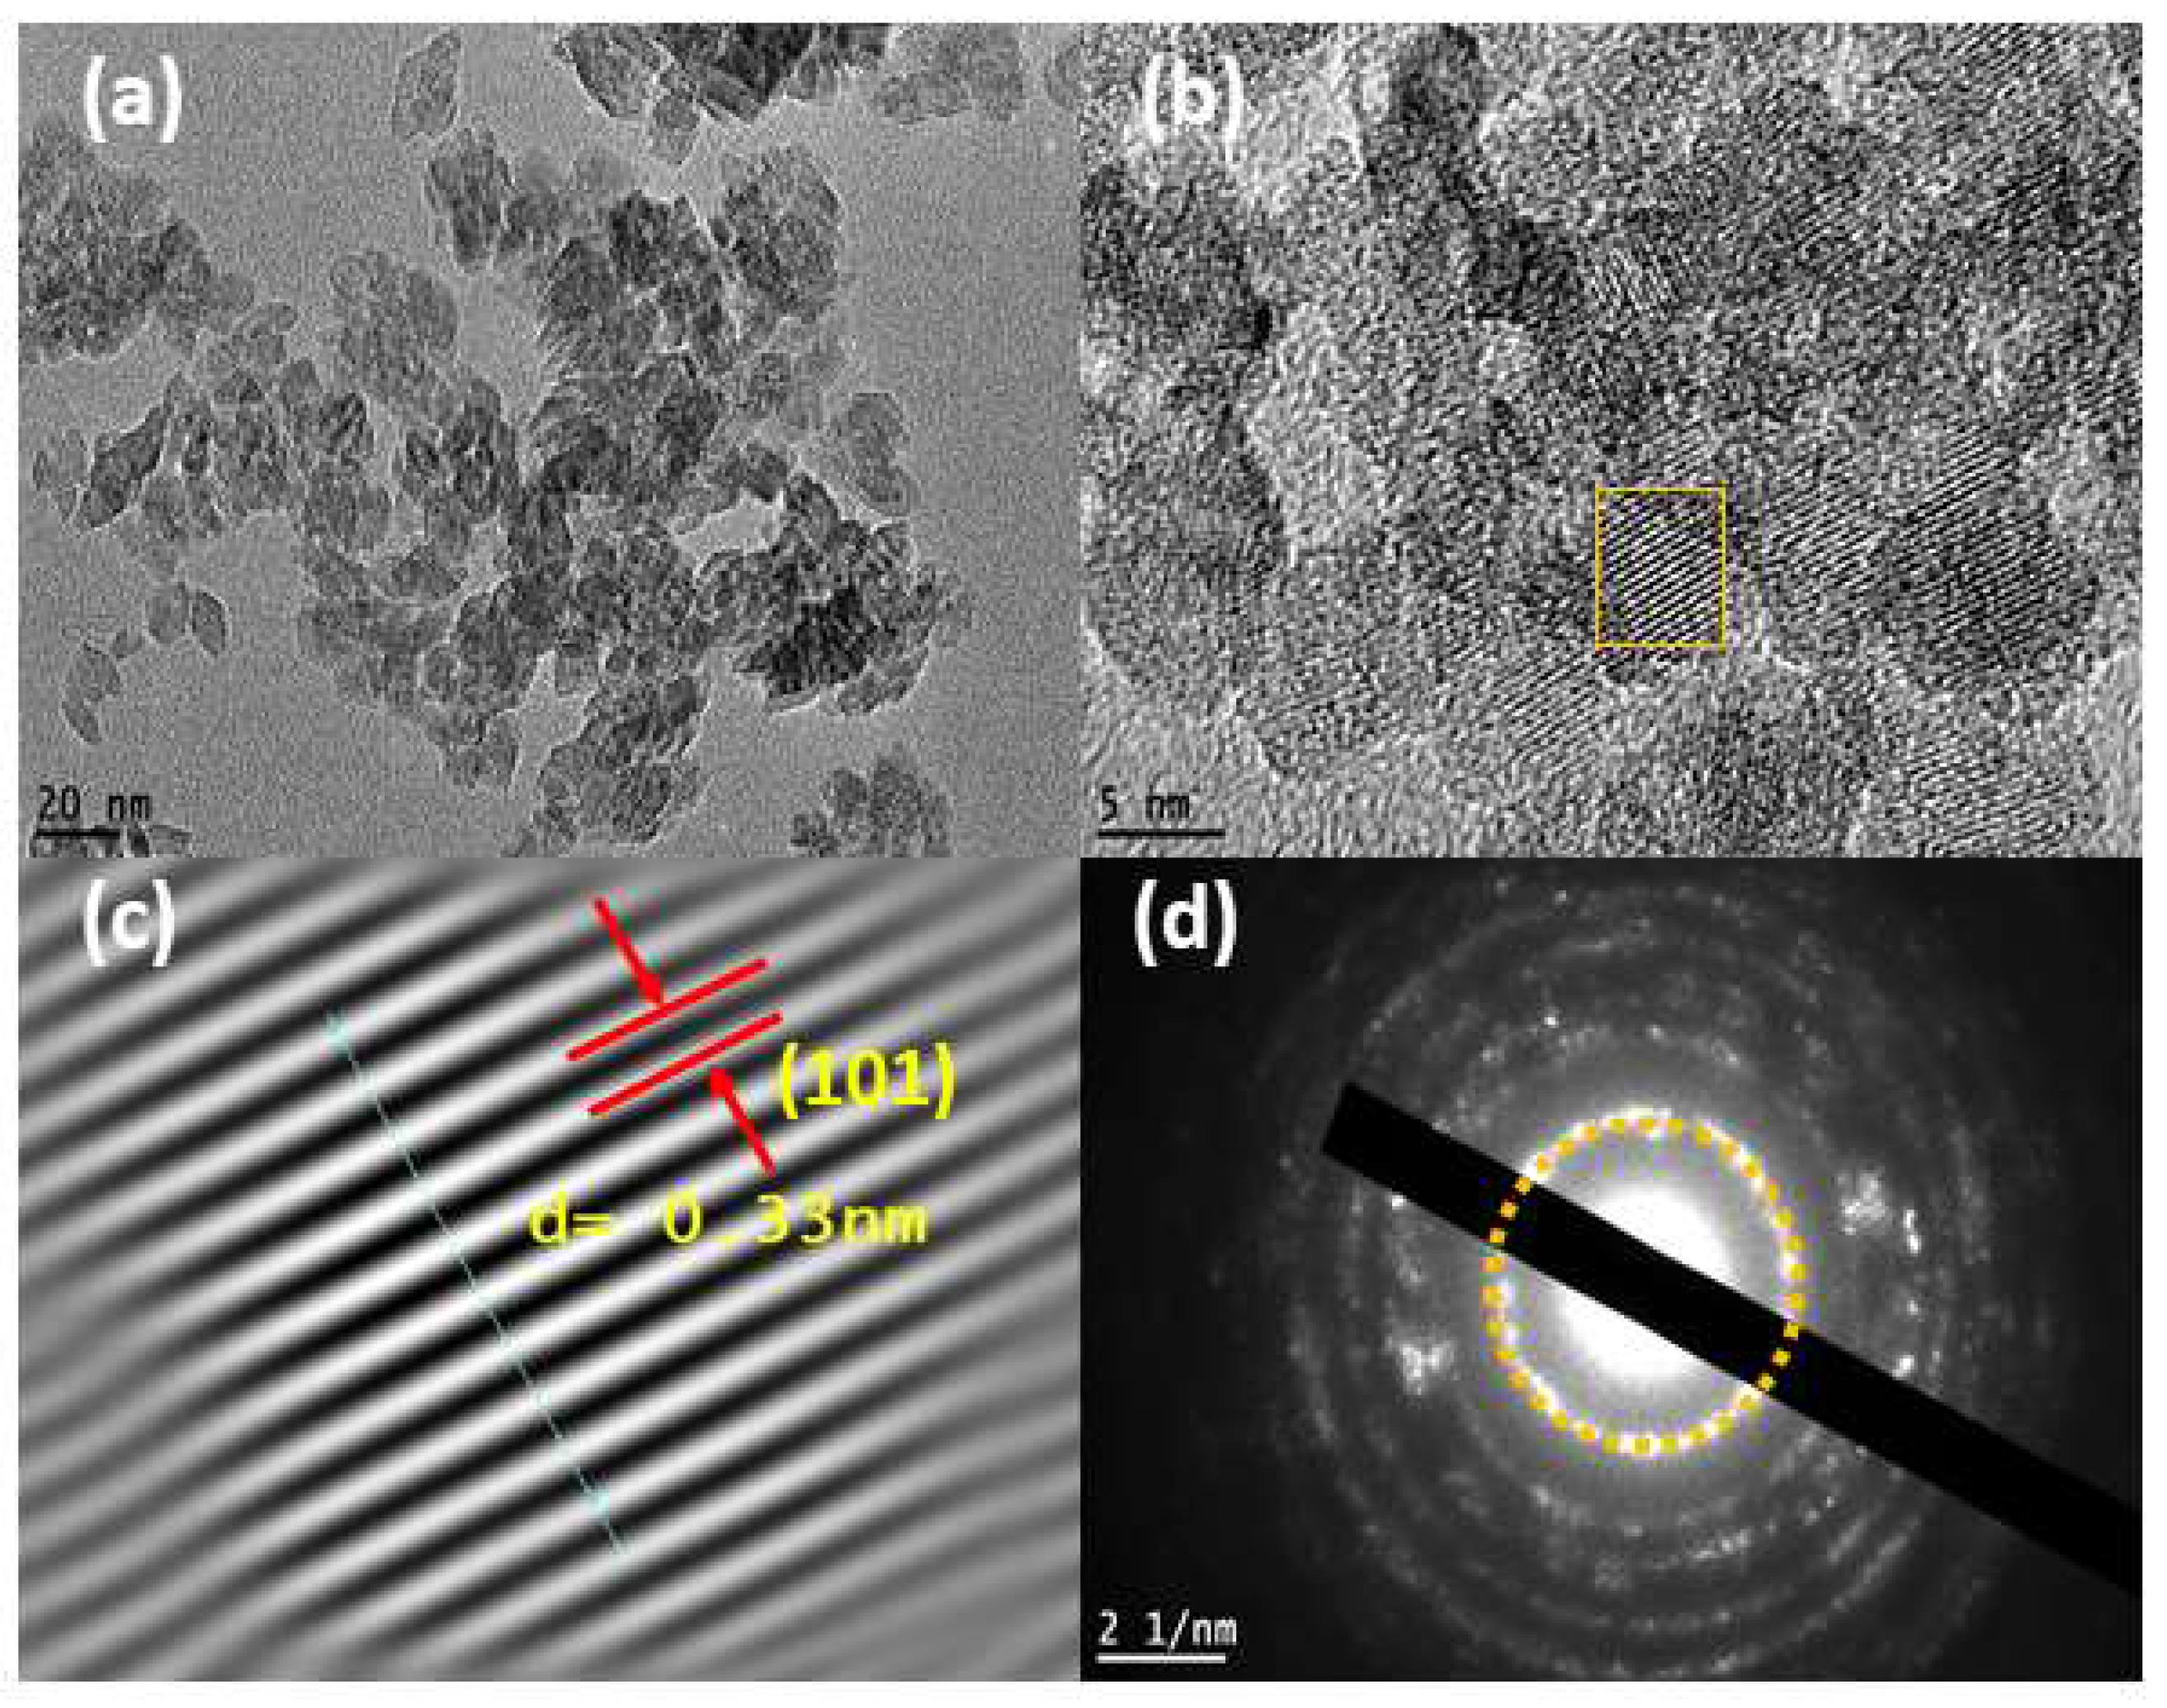
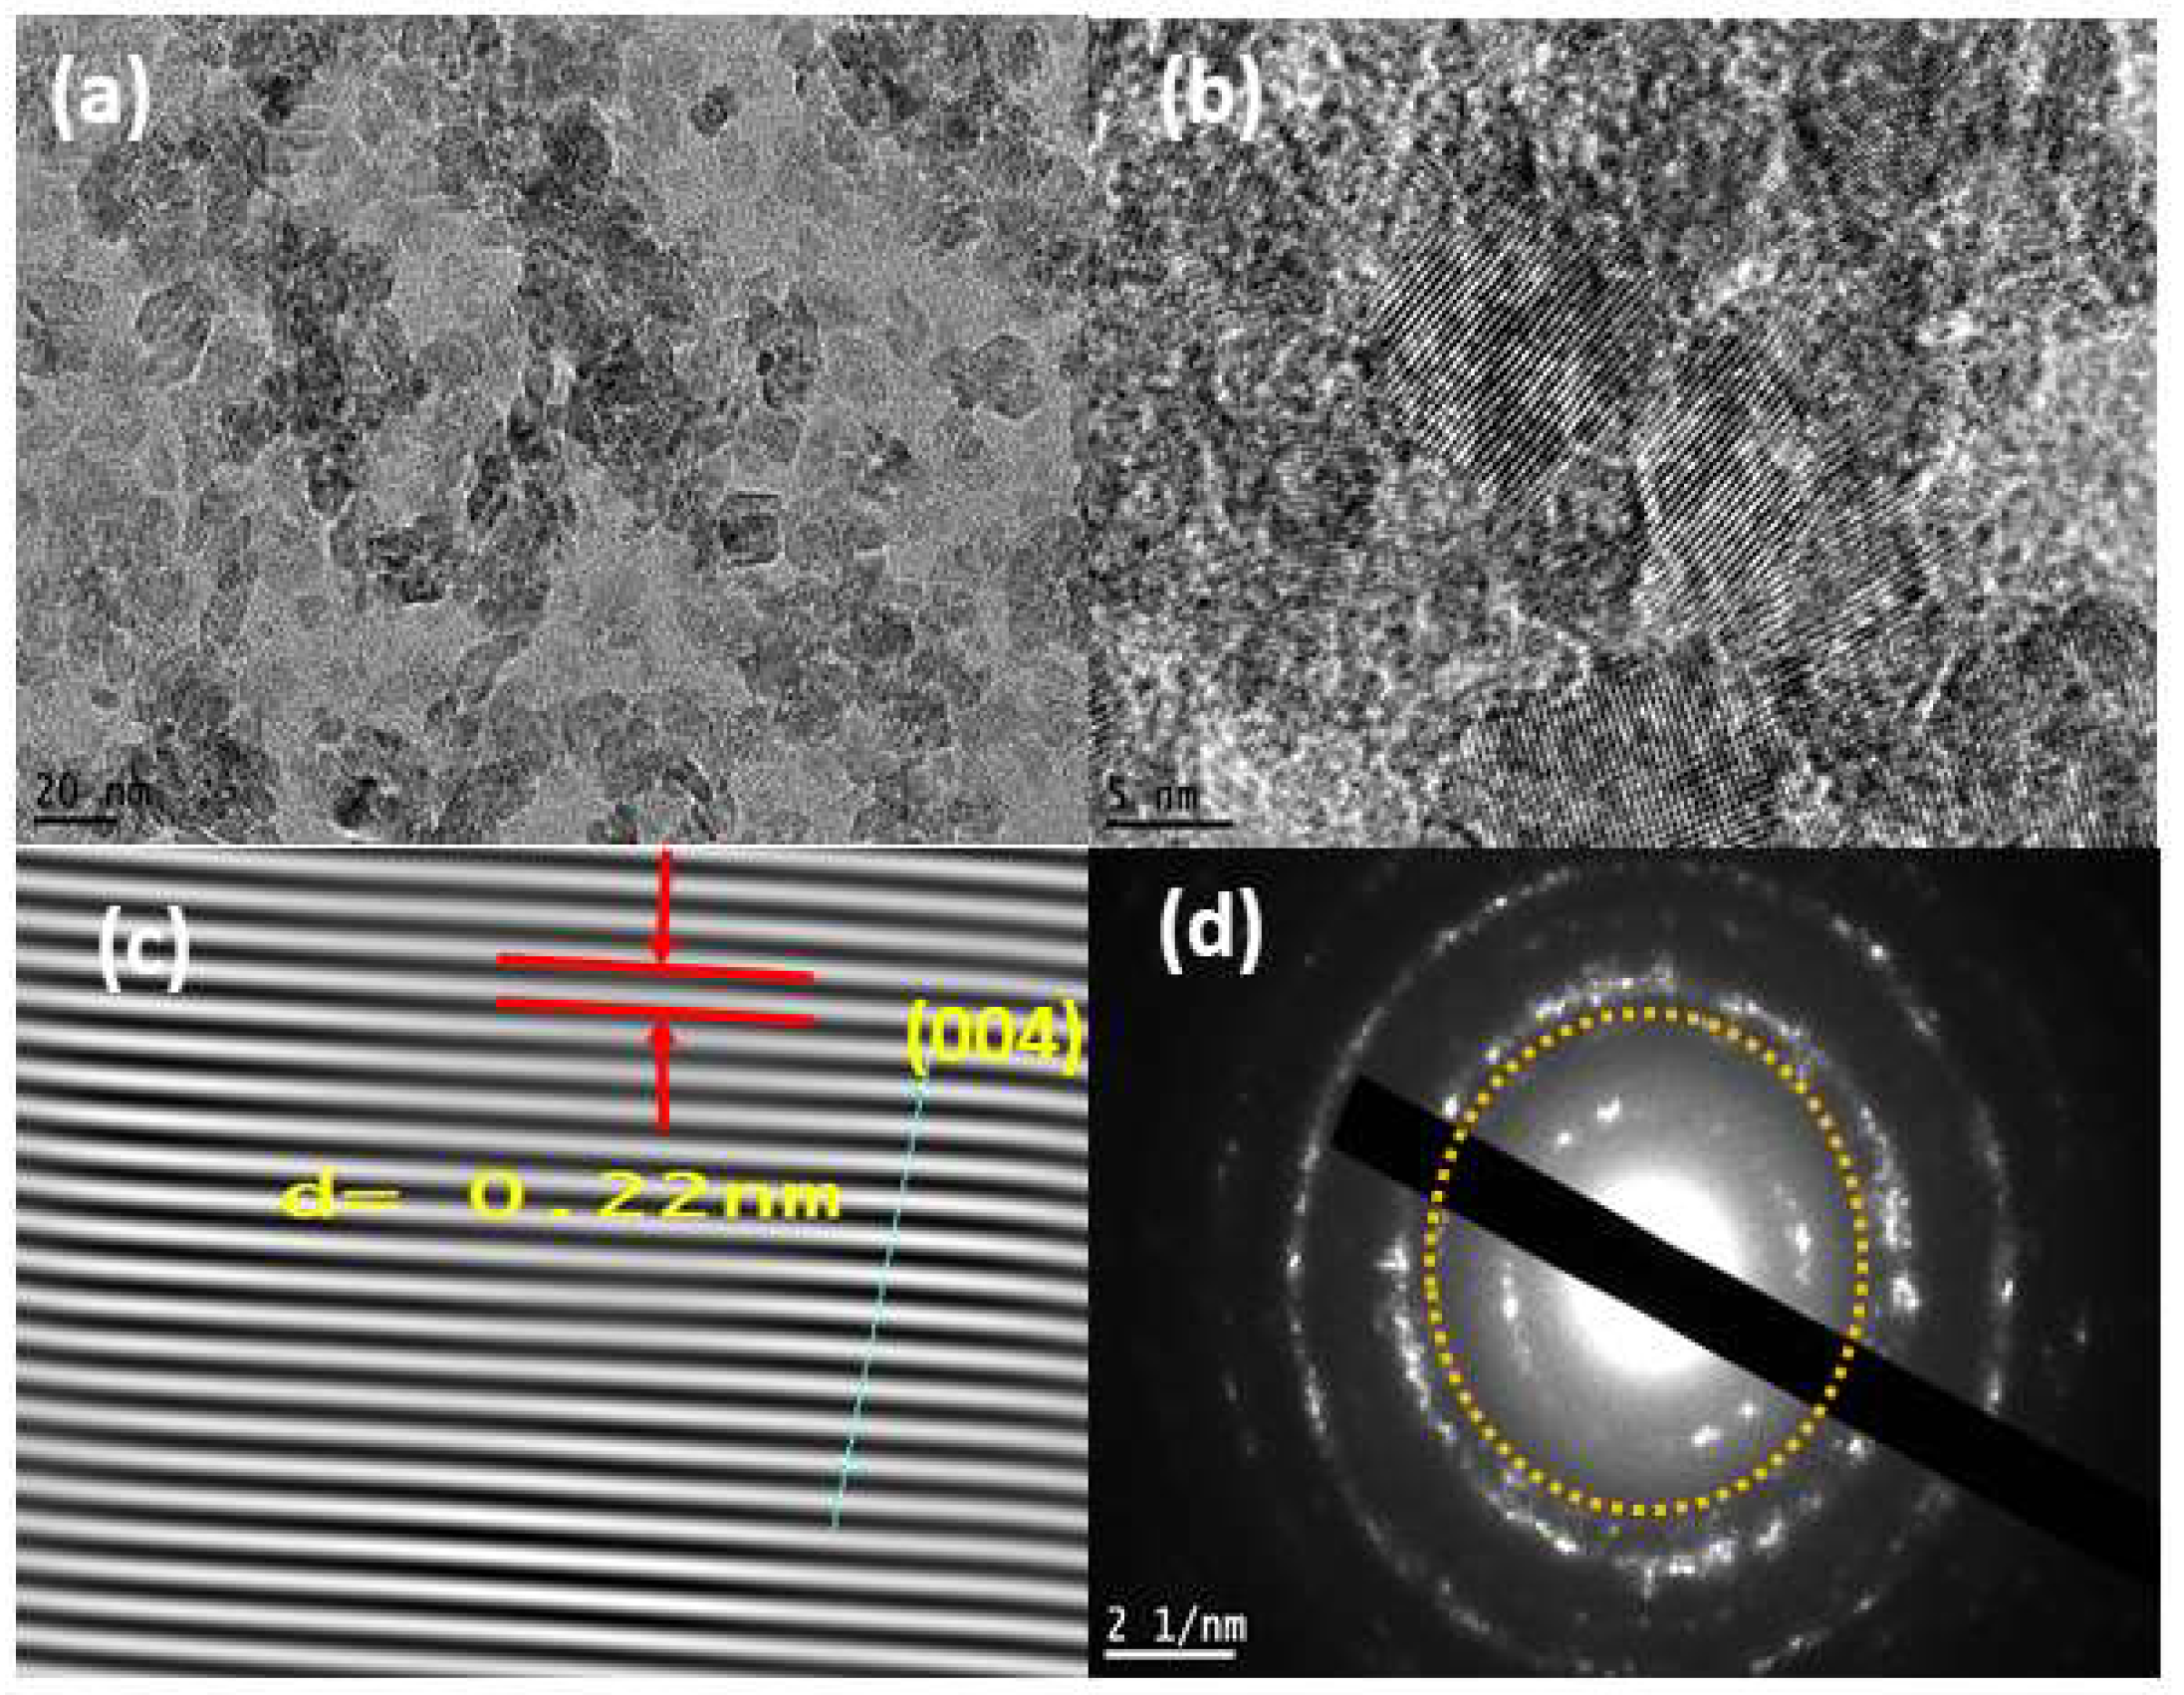
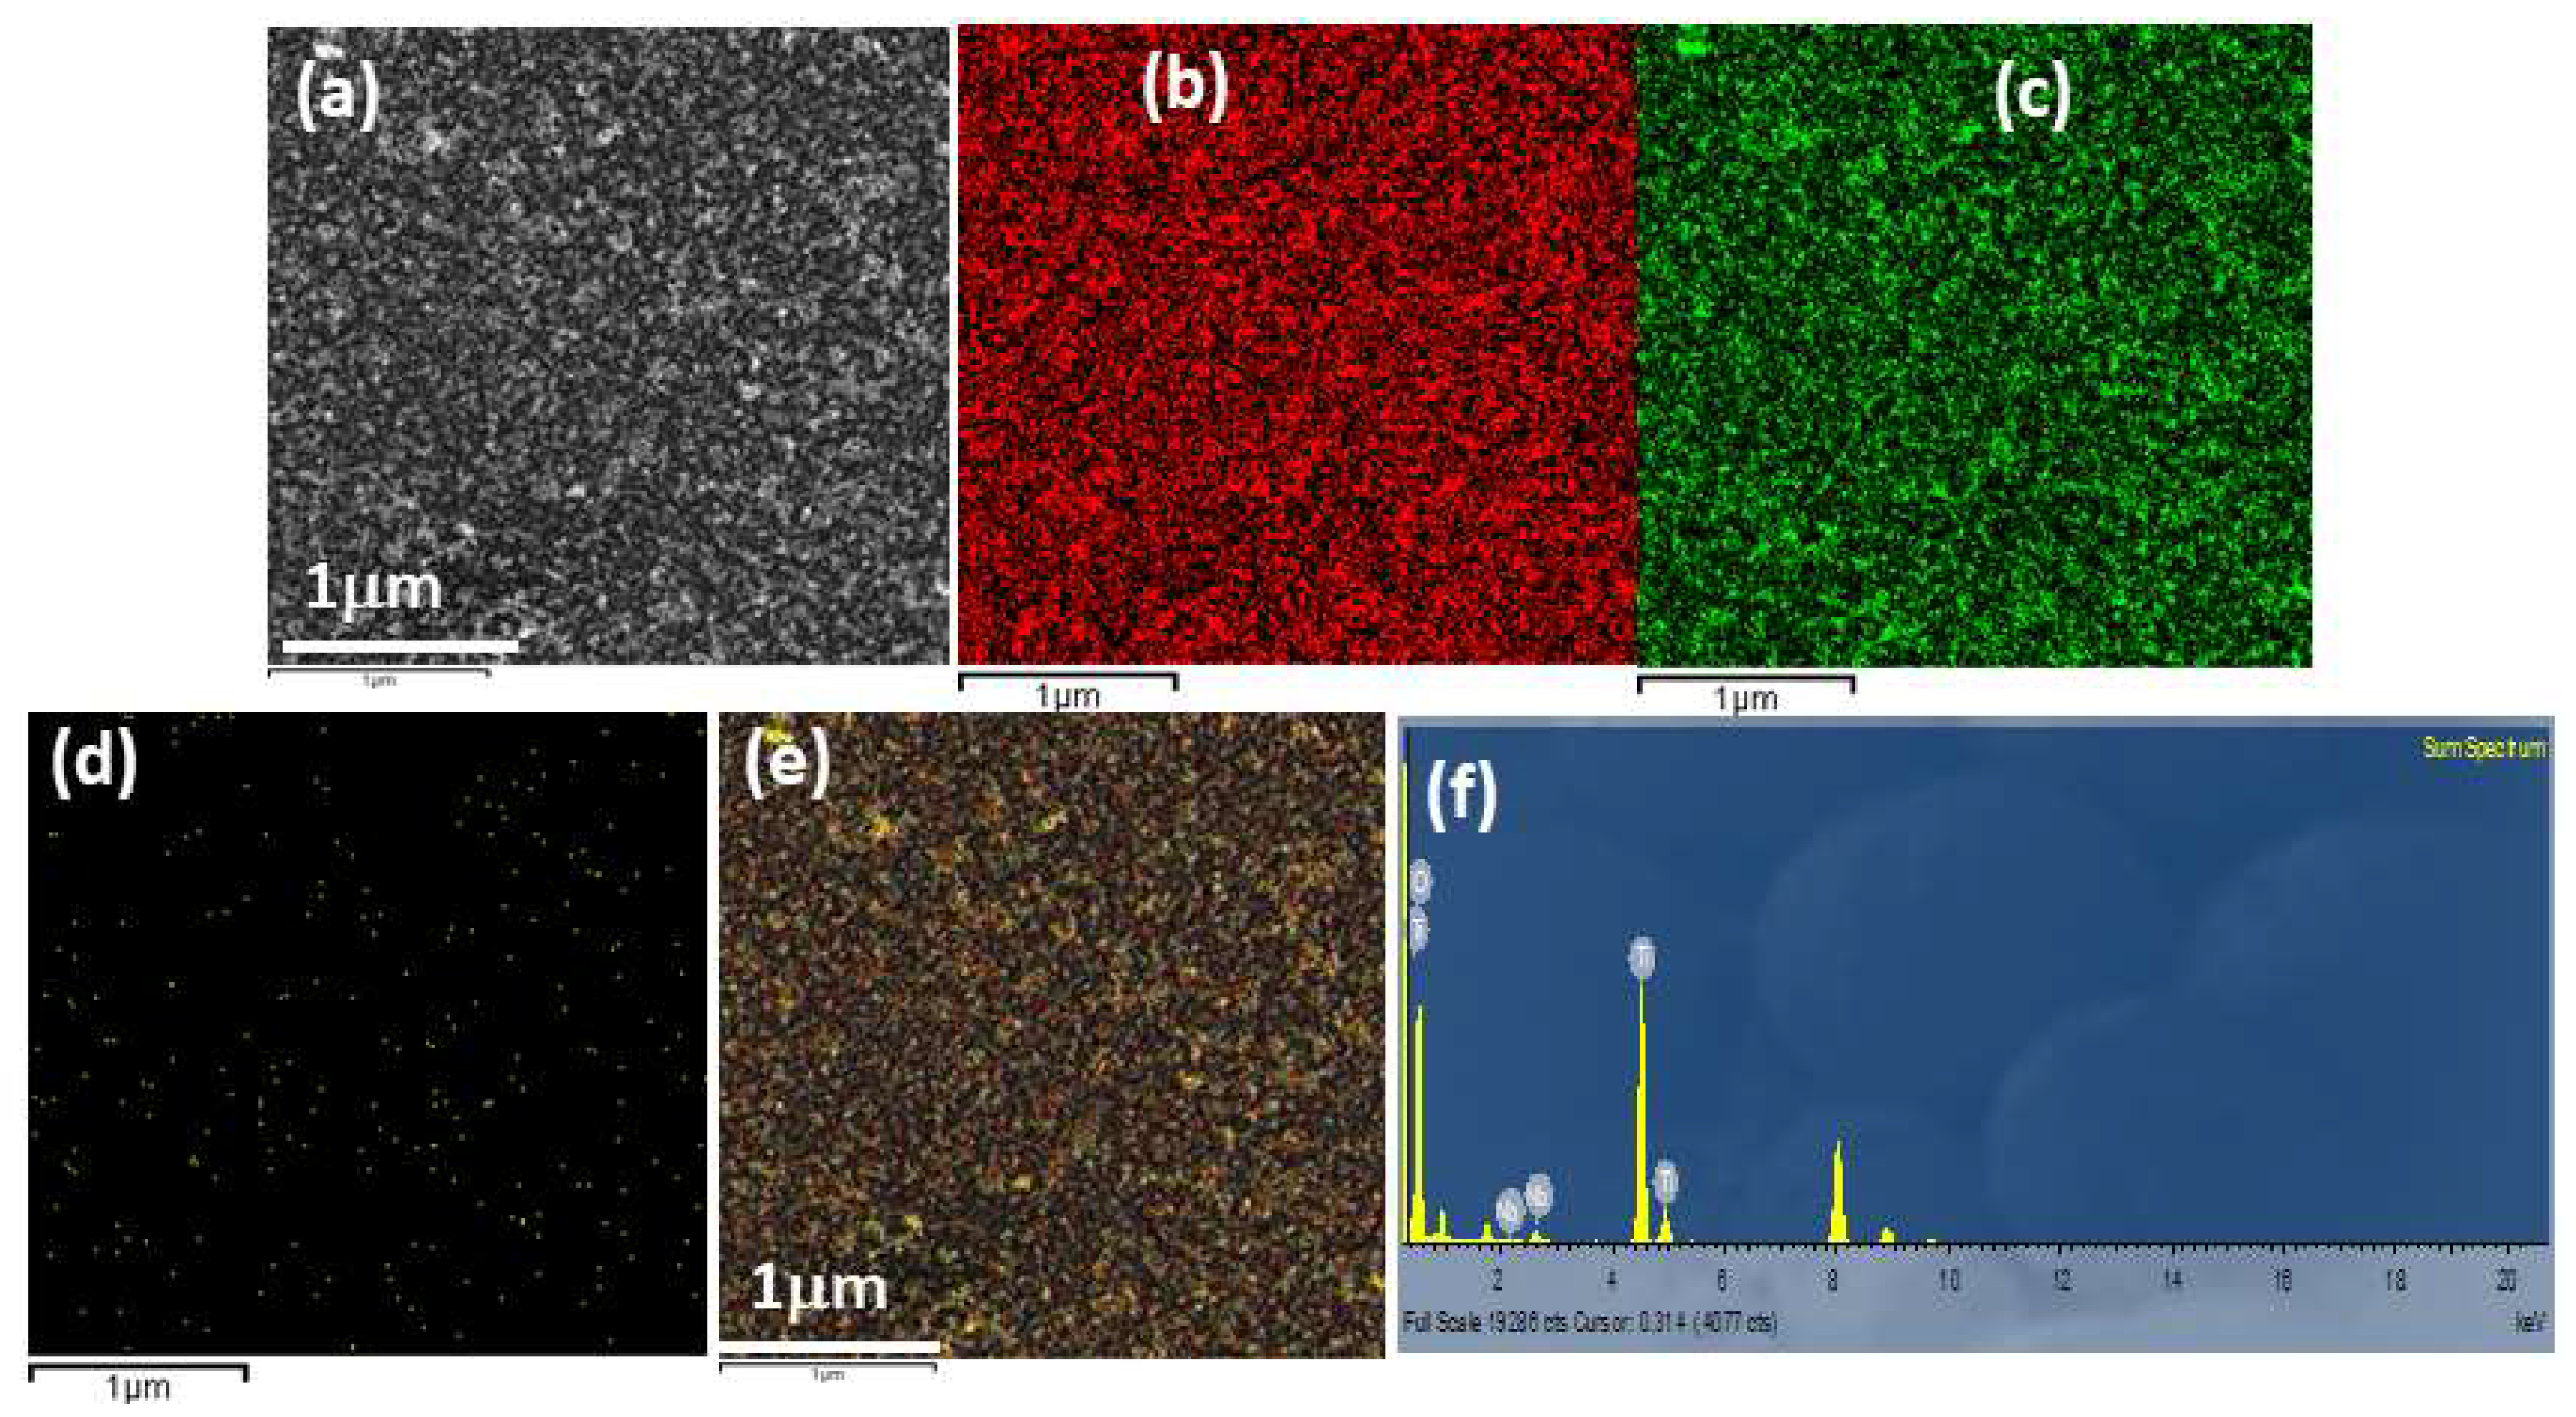
3.1. Structure Analysis of the Nb-TiO2 Nanocomposites

In order to identify the phase and the structure of the pure TiO2 and Nb-TiO2 nanoparticles, we measured the XRD patterns, as shown in Figure 4. Different diffraction peaks appeared, located at 2θ angles 25.3, 37.9, 48.05, 53.9, 55.06, 62.4, 68.76, 70.3, and 75.06 that corresponded to the crystal planes of anatase phase TiO2 ((101), (004), (200), (105), (211), (204), (116), (220), and (215), see JCPDS card no. 21–1272. We also observed a very weak peak located at 55.96 in Nb-TiO2 that corresponded to the crystal plane of niobium oxide (102), see JCPDS card No. 30–0873 [20].
Very small nanoparticles of TiO2 with an average size of 5 nm were shown in the TEM images (see Figure 5a,b). The nanoparticles with different crystal orientations were observed in the HRTEM images, see Figure 5b. The interplane distance of the (101) plane was 0.33 nm, see Figure 5c. Figure 5d shows the selected area electron diffraction (SAED) pattern corresponding to the rings and the (101), (004), (200), (211), and (204) planes. The first ring marked by a yellow circle corresponded to the (101) plane. Figure 6a–e shows the elemental mapping and energy dispersive spectra of the 5 nm pure TiO2 nanocomposites. The presence of the Ti and O in the 5 nm TiO2 nanoparticles is clearly seen. The atomic percentage for O and Ti was 69.88 and 30.12, respectively.
Very small nanoparticles of Nb-TiO2 with an average size of 5 nm were shown in the TEM images (see Figure 7a,b). The difference from the pure was the dispersion of the nanoparticles. Nanoparticles with different crystal orientations were observed in the HRTEM images, see Figure 7b. The interplane distance of the (004) plane was 0.22 nm, see Figure 7c. Figure 7d shows the selected area electron diffraction (SAED) pattern corresponding to the rings and the (101), (004), (200), (211), and (204) planes. The first ring marked by a yellow circle corresponded to the (101) plane. The first ring marked by a yellow circle corresponded to the (004) plane. Figure 8a–e shows the elemental mapping and energy dispersive spectra of the 5 nm Nb/TiO2 nanocomposites. The presence of the Ti, O, and Nb in the 5 nm Nb/TiO2 nanocomposites is clearly seen. The atomic percentage for O, Ti, and Nb was 73.97, 25.94, and 0.09, respectively.

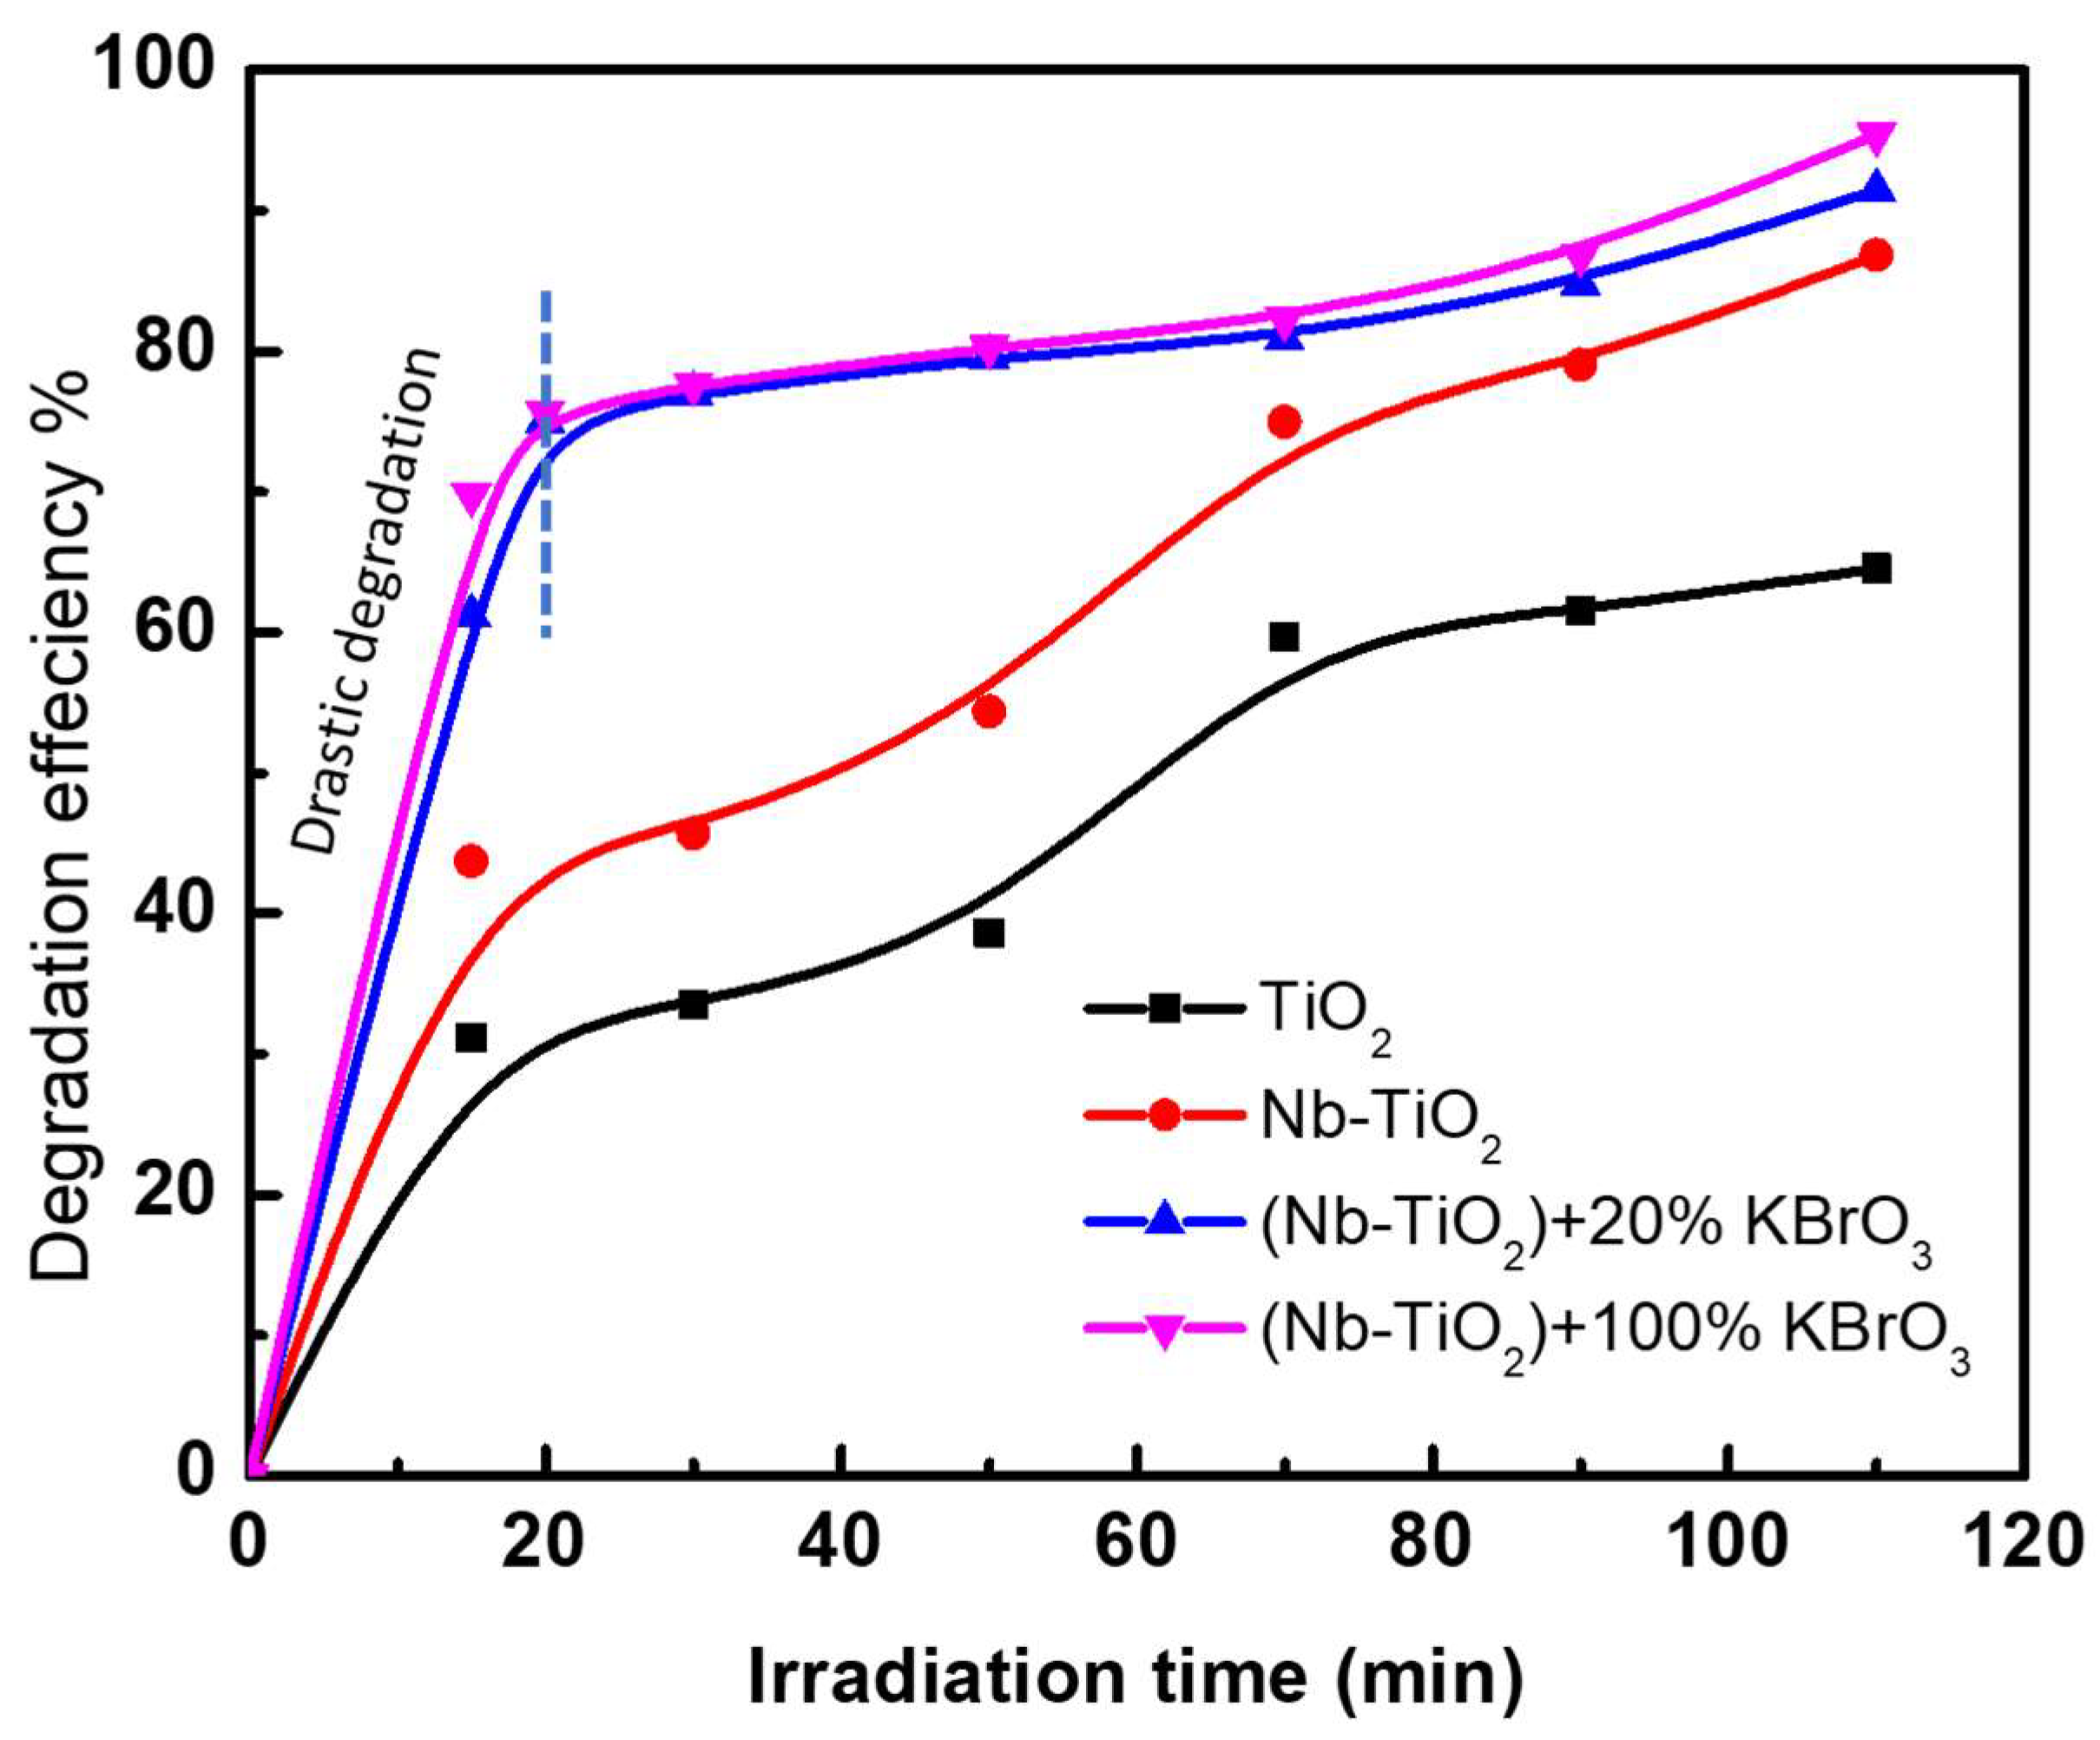
3.2. Photocatalysis Mechanism: Effect of the Nb and KBrO3 Acceptors

The above results can be explained in terms of the photocatalytic mechanism for the phenol red degradation on the Nb-TiO2 nanocomposite compared to the TiO2 only and the high performance of the KBrO3. In general, the photocatalytic phenomenon toward phenol red degradation was defined in the literature based on the advanced oxidation process [21,22]. The dye photolysis in the water begins when the nanocomposite is optically excited, forming an electron–hole pair ( e h + ) , as in Equation (2).
T i O 2 + h ν T i O 2   ( e + h + )
Due to the oxidizing potential of the h + , a direct oxidation of the dye may occur, as in Equation (3).
h + + d y e d y e . + o x i d a t i o n   o f   t h e   d y e
The hydroxyl radical (OH), which is also responsible for photolysis, is formed either by the decomposition of H2O or by the reaction of OH with the holes.
h + + H 2 O H + + ˙ O H
h + + O H ˙ O H
Moreover, the conduction band electrons can react with oxygen molecules, forming peroxide anions, which also produce ˙ O H radicals.
e + O 2 ˙ O 2
O 2 + d y e d y e O O ˙
The O H radical was found to be the main cause of mineralizing the organic dye, as indicated in Equation (9). It is well known that the ˙ O H radical is a strong oxidizer with a potential of 2.8 eV.
O H + d y e   P h o t o d e g r a d a t i o n   o f   t h e   d y e
The data reported in the current study indicated that the Nb-TiO2 was more reactive toward the degradation of phenol red than the pure TiO2. This result may be due to the low recombination of the exciting carriers, where the existence of Nb may pick up the excited electrons from the TiO2 conduction band. In addition, the existence of the electron acceptor KBrO3 highly improved the photocatalysis activity of this nanocomposite.
In photocatalytic reactions, the most important factor for obtaining high efficiency is the reduction in the e–h recombination. It is said that the main factor wasting energy is the electron–hole recombination, which leads to a lower yield. High efficiency and quantitative yield can be realized by the addition of an electron acceptor to the nanocomposites, such as the KBrO3 acceptor [16,23]. Some publications have reported that the addition of this electron acceptor improved the efficiency of photolysis. This occurred in our study, where KBrO3 prevented the recombination of the e–h due to the acceptance of the conduction electrons of the oxide; thus, it led to an increase in the concentration of O H , which led to a rapid degradation of the dye. As shown in Figure 2, the addition of the KBrO3 increased the photocatalytic degradation to 95% at an irradiation time of 110 min.
These speculations were confirmed by measuring the photocurrent for these four samples at a bias of 0.2 V, as shown in Figure 9. The photocurrent was measured when the samples were irradiated for 60 s. The recorded values of the photocurrent during this interval were 0.65, 1.27, 5.03, and 6.02 µA for TiO2, Nb-TiO2, (Nb-TiO2)/20%KBrO3, and (Nb-TiO2)/100%KBrO3, respectively. The high photocurrent values exhibited the significant effect of the KBrO3, which helped to extract and collect more electrons during the excitation of Nb-TiO2, confirming that KBrO3 is a suitable candidate as an electron acceptor to enhance the photocatalysis properties of this nanocomposite. In Figure 9c,d, we observed that the current continued increasing even after the irradiation was stopped. The existence of the KBrO3 increased the reaction in Equations (4)–(7). We also observed that the recovery time was slower with the presence of KBrO3, which was due to the slower recombination rate of the electron–hole.
The data measured for the photodegradation revealed the strong effect of adding Nb to TiO2 and the significant effect of the KBrO3 as an electron acceptor in the solution. This can be expressed by calculating the instantaneous quantity ( q t ) of the degraded dye, as follows:
Q t = ( C 0 C t ) m V
where m is the adsorbent mass in g, and V is the solution volume in L. The quantity of degraded phenol red increased with the increase in the irradiation time, as shown in Figure 10. This figure indicates the ability of the fast degradation of phenol red on the surface of the oxide. The degradation quantity of the dye reached 191 mg for 1 g of the absorbent after 110 min for the Nb-doped oxide assisted with KBrO3. However, the degradation quantity of the same dye on the pure TiO2 was 128 mg for the same time. The results exhibited the superiority of the Nb-doped TiO2 assisted with KBrO3 to degrade a large quantity of the dye within a short time compared to the TiO2.

4. Conclusions

A comparison study between the photodegradation efficiency of pure TiO2, Nb-TiO2, and KBrO3/Nb-TiO2 was successfully performed. The fabricated nanocomposites showed a good degradation of the phenol red with a high concentration of 20 mg/L. The degradation efficiency was increased from 60% for pure TiO2 and 80% for Nb-TiO2 to 95% for KBrO3/Nb-TiO2. In addition, the nanocomposite with KBrO3 showed a higher adsorption capacity compared to the TiO2; the degradation quantity of the dye reached 191 mg for 1 g for the Nb-doped oxide assisted with KBrO3. However, the degradation quantity of the same dye with the pure TiO2 was 128 mg for the same time. Finally, the de-colorization of the wastewater containing phenol red in this work confirmed an important interfacial charge between the KBrO3 and the Nb/TiO2 nanocomposites.

Author Contributions

Conceptualization, C.A. and N.M.S.; Data curation, N.K.A., C.A., N.A.T. and N.M.S.; Formal analysis, C.A., N.M.A. and N.M.S.; Funding acquisition, N.K.A.; Investigation, C.A. and N.M.S.; Methodology, C.A. and N.M.S.; Supervision, C.A. and N.M.S.; Validation, C.A and N.M.S.; Visualization, C.A., A.A.A. and N.M.S.; Writing—original draft, C.A. and N.M.S.; Writing—review and editing, N.K.A., C.A., N.M.A., N.A.T., A.A.A. and N.M.S. All authors have read and agreed to the published version of the manuscript.

Funding

This work was supported by the Deanship of Scientific Research, Vice Presidency for Graduate Studies and Scientific Research, King Faisal University, Saudi Arabia [Project No. GRANT 1031].

Conflicts of Interest

The authors declare no conflict of interest.

References

  1. Xiao, M.; Luo, B.; Lyu, M.; Wang, S.; Wang, L. Photocatalysis: Single-Crystalline Nanomesh Tantalum Nitride Photocatalyst with Improved Hydrogen-Evolving Performance (Adv. Energy Mater. 1/2018). Adv. Energy Mater. 2018, 8, 1770138. [Google Scholar] [CrossRef] [Green Version]
  2. Zhang, L.; Zhao, Z.-J.; Wang, T.; Gong, J. Nano-designed semiconductors for electro- and photoelectro-catalytic conversion of carbon dioxide. Chem. Soc. Rev. 2018, 47, 5423–5443. [Google Scholar] [CrossRef]
  3. Yoon, J.W.; Kim, J.-H.; Jo, Y.-M.; Lee, J.-H. Heterojunction between bimetallic metal-organic framework and TiO2: Band-structure engineering for effective photoelectrochemical water splitting. Nano Res. 2022, 15, 8502–8509. [Google Scholar] [CrossRef]
  4. Chatterjee, D.; Dasgupta, S. Visible light induced photocatalytic degradation of organic pollutants. J. Photochem. Photobiol. C Photochem. Rev. 2005, 6, 186–205. [Google Scholar] [CrossRef]
  5. Peerakiatkhajohn, P.; Butburee, T.; Sul, J.-H.; Thaweesak, S.; Yun, J.-H. Efficient and Rapid Photocatalytic Degradation of Methyl Orange Dye Using Al/ZnO Nanoparticles. Nanomaterials 2021, 11, 1059. [Google Scholar] [CrossRef]
  6. Pozan, G.S.; Isleyen, M.; Gokcen, S. Transition metal coated TiO2 nanoparticles: Synthesis, characterization and their photocatalytic activity. Appl. Catal. B Environ. 2013, 140–141, 537–545. [Google Scholar] [CrossRef]
  7. Tayade, R.J.; Natarajan, T.S.; Bajaj, H.C. Photocatalytic Degradation of Methylene Blue Dye Using Ultraviolet Light Emitting Diodes. Ind. Eng. Chem. Res. 2009, 48, 10262–10267. [Google Scholar] [CrossRef]
  8. Mathew, S.; Ganguly, P.; Rhatigan, S.; Kumaravel, V.; Byrne, C.; Hinder, S.J.; Bartlett, J.; Nolan, M.; Pillai, S.C. Cu-Doped TiO2: Visible light assisted photocatalytic antimicrobial activity. Appl. Sci. 2018, 8, 2067. [Google Scholar] [CrossRef] [Green Version]
  9. Verbruggen, S.W.; Keulemans, M.; Filippousi, M.; Flahaut, D.; Van Tendeloo, G.; Lacombe, S.; Martens, J.A.; Lenaerts, S. Plasmonic gold–silver alloy on TiO2 photocatalysts with tunable visible light activity. Appl. Catal. B Environ. 2014, 156–157, 116–121. [Google Scholar] [CrossRef]
  10. Yang, X.; Min, Y.; Li, S.; Wang, D.; Mei, Z.; Liang, J.; Pan, F. Conductive Nb-doped TiO2 thin films with whole visible absorption to degrade pollutants. Catal. Sci. Technol. 2018, 8, 1357–1365. [Google Scholar] [CrossRef]
  11. Ahmed, F.; Kanoun, M.B.; Awada, C.; Jonin, C.; Brevet, P.-F. An Experimental and Theoretical Study on the Effect of Silver Nanoparticles Concentration on the Structural, Morphological, Optical, and Electronic Properties of TiO2 Nanocrystals. Crystals 2021, 11, 1488. [Google Scholar] [CrossRef]
  12. Al Suliman, N.; Awada, C.; Alshoaibi, A.; Shaalan, N.M. Simple Preparation of Ceramic-Like Materials Based on 1D-Agx (x = 0, 5, 10, 20, 40 mM)/TiO2 Nanostructures and Their Photocatalysis Performance. Crystals 2020, 10, 1024. [Google Scholar] [CrossRef]
  13. Awada, C.; Hajlaoui, T.; Al Suliman, N.; Dab, C. Heterogeneous Nanoplasmonic Amplifiers for Photocatalysis’s Application: A Theoretical Study. Catalysts 2022, 12, 771. [Google Scholar] [CrossRef]
  14. Humayun, M.; Raziq, F.; Khan, A.; Luo, W. Modification strategies of TiO2 for potential applications in photocatalysis: A critical review. Green Chem. Lett. Rev. 2018, 11, 86–102. [Google Scholar] [CrossRef] [Green Version]
  15. Zhang, X.; Song, L.; Zeng, X.; Li, M. Effects of Electron Donors on the TiO2 Photocatalytic Reduction of Heavy Metal Ions under Visible Light. Energy Procedia 2012, 17, 422–428. [Google Scholar] [CrossRef] [Green Version]
  16. Tian, F.; Zhu, R.; Ouyang, F. Synergistic photocatalytic degradation of pyridine using precious metal supported TiO2 with KBrO3. J. Environ. Sci. 2013, 25, 2299–2305. [Google Scholar] [CrossRef]
  17. Zou, C.; Geng, Q.-J.; Zhu, J.-T.; Jing, C.; Zhong, W.; Hou, Z.-S. Effects of KBr and KI on Photocatalytic Degradation of Dye W-7G with Nano-TiO2 as Catalyst. Int. J. Photoenergy 2021, 2021, 6610093. [Google Scholar] [CrossRef]
  18. Vučić, M.D.R.; Mitrović, J.Z.; Kostić, M.M.; Velinov, N.D.; Najdanović, S.M.; Bojić, D.V.; Bojić, A.L. Heterogeneous photocatalytic degradation of anthraquinone dye Reactive Blue 19: Optimization, comparison between processes and identification of intermediate products. Water SA 2020, 46, 291–299. [Google Scholar] [CrossRef]
  19. Almulhem, N.; Awada, C.; Shaalan, N.M. Photocatalytic Degradation of Phenol Red in Water on Nb(x)/TiO2 Nanocomposites. Crystals 2022, 12, 911. [Google Scholar] [CrossRef]
  20. Liu, J.; Xue, D.; Li, K. Single-crystalline nanoporous Nb2O5 nanotubes. Nanoscale Res. Lett. 2011, 6, 138. [Google Scholar] [CrossRef]
  21. Asiri, A.M.; Al-Amoudi, M.S.; Al-Talhi, T.A.; Al-Talhi, A.D. Photodegradation of Rhodamine 6G and phenol red by nanosized TiO2 under solar irradiation. J. Saudi Chem. Soc. 2011, 15, 121–128. [Google Scholar] [CrossRef] [Green Version]
  22. Daneshvar, N.; Salari, D.; Khataee, A.R. Photocatalytic degradation of azo dye acid red 14 in water on ZnO as an alternative catalyst to TiO2. J. Photochem. Photobiol. A Chem. 2004, 162, 317–322. [Google Scholar] [CrossRef]
  23. Rajamanickam, D.; Shanthi, M. Photocatalytic degradation of an organic pollutant by zinc oxide–solar process. Arab. J. Chem. 2016, 9, S1858–S1868. [Google Scholar] [CrossRef]
Figure 1. Absorbance spectra by the exposure time for pure TiO2, Nb-TiO2, Nb-TiO2/20%KBrO3, and Nb-TiO2/100%KBrO3.
Crystals 12 01758 g001
Figure 2. The photocatalytic efficiency of pure TiO2, Nb-TiO2, Nb-TiO2/20%KBrO3, and Nb-TiO2/100%KBrO3.
Crystals 12 01758 g002
Figure 3. The reduction in the concentration of phenol red dye in the wastewater with irradiation time for pure TiO2, Nb-TiO2, Nb-TiO2/20%KBrO3, and Nb-TiO2/100%KBrO3. Note: the dye concentration was 0.9 mg/L after 110 min for Nb-TiO2/100%KBrO3.
Crystals 12 01758 g003
Figure 4. XRD patterns of the TiO2 and Nb-TiO2 samples. * represents the peak located at 55.96 in Nb-TiO2 that corresponded to the crystal plane of niobium oxide (102).
Crystals 12 01758 g004
Figure 5. (a,b) TEM images, (c) HRTEM image, and (d) SAED pattern of the 5 nm TiO2 nanoparticles.
Crystals 12 01758 g005
Figure 6. (a) TEM image: (b) dispersity of O, (c) dispersity of Ti, (d) elemental mapping of Ti and O, and (e) EDX analysis of 5 nm TiO2 nanocomposites. The atomic percentage for O and Ti was 69.88 and 30.12, respectively.
Crystals 12 01758 g006
Figure 7. (a,b) TEM images, (c) HRTEM image, and (d) SAED pattern of the 5 nm Nb/TiO2 nanoparticles.
Crystals 12 01758 g007
Figure 8. (a, b) TEM images, (c) HRTEM image, and (d) SAED pattern of the 5 nm Nb/TiO2 nanoparticles, (e) elemental mapping of Ti, O, and Nb and (f) EDX analysis of 5 nm TiO2 nanocomposites. The atomic percentage for O, Ti, and Nb is 73.97, 25.94, and 0.09, respectively.
Crystals 12 01758 g008
Figure 9. The photocurrent obtained at a bias voltage of 0.2 V for pure TiO2, Nb-TiO2, Nb-TiO2/20%KBrO3, and Nb-TiO2/100%KBrO3.
Crystals 12 01758 g009
Figure 10. Effect of the degradation quantity of the phenol red concentration as a function of the irradiation time for the pure TiO2, Nb-TiO2, Nb-TiO2/20%KBrO3, and Nb-TiO2/100%KBrO3.
Crystals 12 01758 g010
Publisher’s Note: MDPI stays neutral with regard to jurisdictional claims in published maps and institutional affiliations.

