1. Introduction
Most drug candidates cannot reach the final step of the drug pipeline in the pharmaceutical industry due to major drawbacks in their pharmacological properties, such as solubility or stability. However, some alternatives are increasingly being explored to overcome these problems. In the last decade, crystal engineering has encouraged the development of pharmaceutical multicomponent materials as a powerful tool to modulate the physicochemical properties of active pharmaceutical ingredients (APIs) [
1,
2,
3]. Thus, multicomponent pharmaceutical systems can be defined as solid crystalline materials in which an API and another molecule or molecular ion, chosen from the generally recognized as safe (GRAS) list, are tied by non-covalent interactions. In this context, new crystalline solids are formed, which present different physicochemical properties compared with the reference API, but leave the pharmacological activity intact [
4,
5].
Metformin (MTF), chemically named dimethylbiguanide, commercialized as MTF–HCl salt in 1995 [
6], is the most prescribed oral antihyperglycemic agent for the treatment of type 2 diabetes [
7,
8]. However, the strong basic nature of MTF (pKa = 12.4) induces high reactivity and low stability at physiological pH [
9]. This issue offers excellent opportunities in the study of MTF-based multicomponent materials [
10,
11,
12,
13]. In this work, we synthesize and characterize a novel salt of MTF with citric acid (CIT) (
Figure 1), a GRAS molecule commonly used as a coformer in multicomponent crystallization studies [
14,
15,
16,
17,
18], already used as an excipient for drug formulation and also as flavoring [
19].
Mechanochemical synthesis by Liquid Assisted Grinding (LAG) was used to obtain the pure salt in the solid state. Further characterization was carried out through Powder X-ray Diffraction (PXRD), Fourier Transform Infrared spectroscopy (FT-IR), Differential Scanning Calorimetry analysis (DSC), Thermogravimetric Analysis (TGA), and Single Crystal X-ray Diffraction (SCXRD). Stability was evaluated in accelerated aging conditions, while solubility in water was assessed by qualitative methods. Finally, an in-depth study of the crystalline structure was performed to explain the modulation of the properties observed when compared with the reference API.
2. Materials and Methods
All chemicals used in this investigation were commercially available from Sigma-Aldrich and used as received without any prior purification or treatment. MTF had a purity higher than 98% and CIT higher than 99.5%. HPLC grade solvents were used, also supplied by Sigma-Aldrich.
2.1. Liquid-Assisted Grinding (LAG)
LAG experiments were performed by using different molar ratios with the total weight of both components in the range of 150 mg and 50 µL of Methanol (Met). Stoichiometric mixtures of MTF with CIT were gently ground for 30 min at 25 Hz in a Retsch MM400 ball mill and using steel jars with two 5 mm diameter steel balls.
2.2. Single Crystals Preparation
Powders obtained from mechanochemical synthesis were dissolved in methanol to obtain saturated solutions, which were then filtered and allowed to evaporate. After 2 days of slow solvent evaporation at room temperature, single crystals suitable for X-ray diffraction appeared. These crystals were isolated and instantly immersed in perfluoropolyether as protecting oil for manipulation and mounting.
2.3. Stability Experiments
Suspensions were made with ca. 100 mg of the powders obtained by LAG and 0.5–1 mL MilliQ water. They underwent magnetic stirring at ambient conditions for 24 h without drying completely. Aliquots of the suspension were dried, grounded, and analyzed by PXRD to determine whether the salt was dissociated into its components or remained stable in the multicomponent form.
In order to study the influence of temperature and humidity on the stability of the new molecular salt, this material was left in a temperature/humidity-controlled chamber with a temperature of 40 °C and 75% relative humidity for two months, taking small sample aliquots during this time to be analyzed by PXRD in order to evaluate the stability of the crystalline phase.
2.4. Solubility Tests
To qualitatively evaluate the solubility of MTF–CIT and MTF in water and in PBS buffers at pH 6.8 and pH 3, 10 mg of every single material (MTF–CIT and MTF) was placed in different vials, and the MilliQ water and the respective PBS buffer were added to each one in aliquots of 10 microliters, at 22 °C in a thermostatic water bath, by stepwise procedure. Sonication was used to homogenize and stimulate dissolution after each solvent addition. Complete dissolution was determined based on visual observation under an optical microscope at the laboratory temperature, set to 22 ± 2 °C, controlled by a temperature and humidity recorder device which assures the keeping of the laboratory temperature in the range 22 ± 2 °C and then assuring the thermal equilibrium of the samples.
2.5. Powder X-ray Diffraction
PXRD patterns were collected on a Bruker D8 Advance Series II Vario diffractometer for the identification of new crystalline phases using Cu-K
α1 radiation (λ = 1.5406 Å) at 40 kV and 40 mA. Diffraction patterns were measured over 2θ range of 5–50 degrees, using a continuous step size of 0.015 degrees and a total acquisition time of 1 h. The software used for data analysis was Diffrac.EVA and Diffrac.TOPAS [
20] (Bruker AXS).
2.6. Thermal Analysis
For the DSC/TGA experiments, about 30 mg of MTF–CIT crystalline phase was studied using a Mettler Toledo TGA/DSC 3+ Star analyzer. Samples were heated at 10 °C/min in the temperature range 25–900 °C under a nitrogen atmosphere at 100 mL/min flow in aluminum capsules.
2.7. Fourier Transform Infrared Spectroscopy
Fourier transform infrared spectra (FT-IR) were recorded with an Invenio R FTIR spectrometer (Bruker) and an attenuated total reflectance (ATR) accessory with a diamond crystal. FT-IR spectra were recorded within the wavenumber range from 4000 cm−1 to 400 cm−1 at 2 cm−1 resolution.
2.8. Single-Crystal X-ray Diffraction (SCXRD)
The measured crystal was prepared under inert conditions and immersed in perfluoropolyether as the protecting oil for manipulation. A suitable crystal was mounted on MiTeGen Micromounts™ (95 Brown Rd, Ithaca, NY, USA), and this sample was used for data collection. Data were collected with a Bruker D8 Venture diffractometer and processed with the APEX3 suite [
21]. The structure was solved by the intrinsic phasing method [
22], which revealed the position of all non-hydrogen atoms. These atoms were refined on F
2 by a full-matrix least-squares procedure using anisotropic displacement parameters [
23]. All hydrogen atoms were located by difference Fourier maps and included as fixed contributions riding on attached atoms with isotropic thermal displacement parameters 1.2 times those of the respective atom. Geometric calculations and molecular graphics were performed with Mercury [
24] and Olex2 [
25]. Additional crystal data are shown in
Table 1. The MTF–CIT crystallographic information file was deposited in the CSD database with the deposition number 2215418.
3. Results and Discussion
3.1. Liquid-Assisted Grinding Experiments
For the system under investigation, three different stoichiometries (1:1, 2:1, 1:2) were screened. The powder materials obtained from LAG experiments were collected and analyzed by PXRD and DSC/TGA to determine the formation of new crystalline phases. The new molecular salt obtained for the (1:1) stoichiometry exhibited a distinct PXRD pattern (
Figure 2) and melting point compared to the starting materials, and its structure was elucidated from Single Crystal X-ray Diffraction data, whereas for the (1:2 and 2:1) stoichiometries, physical mixtures were obtained.
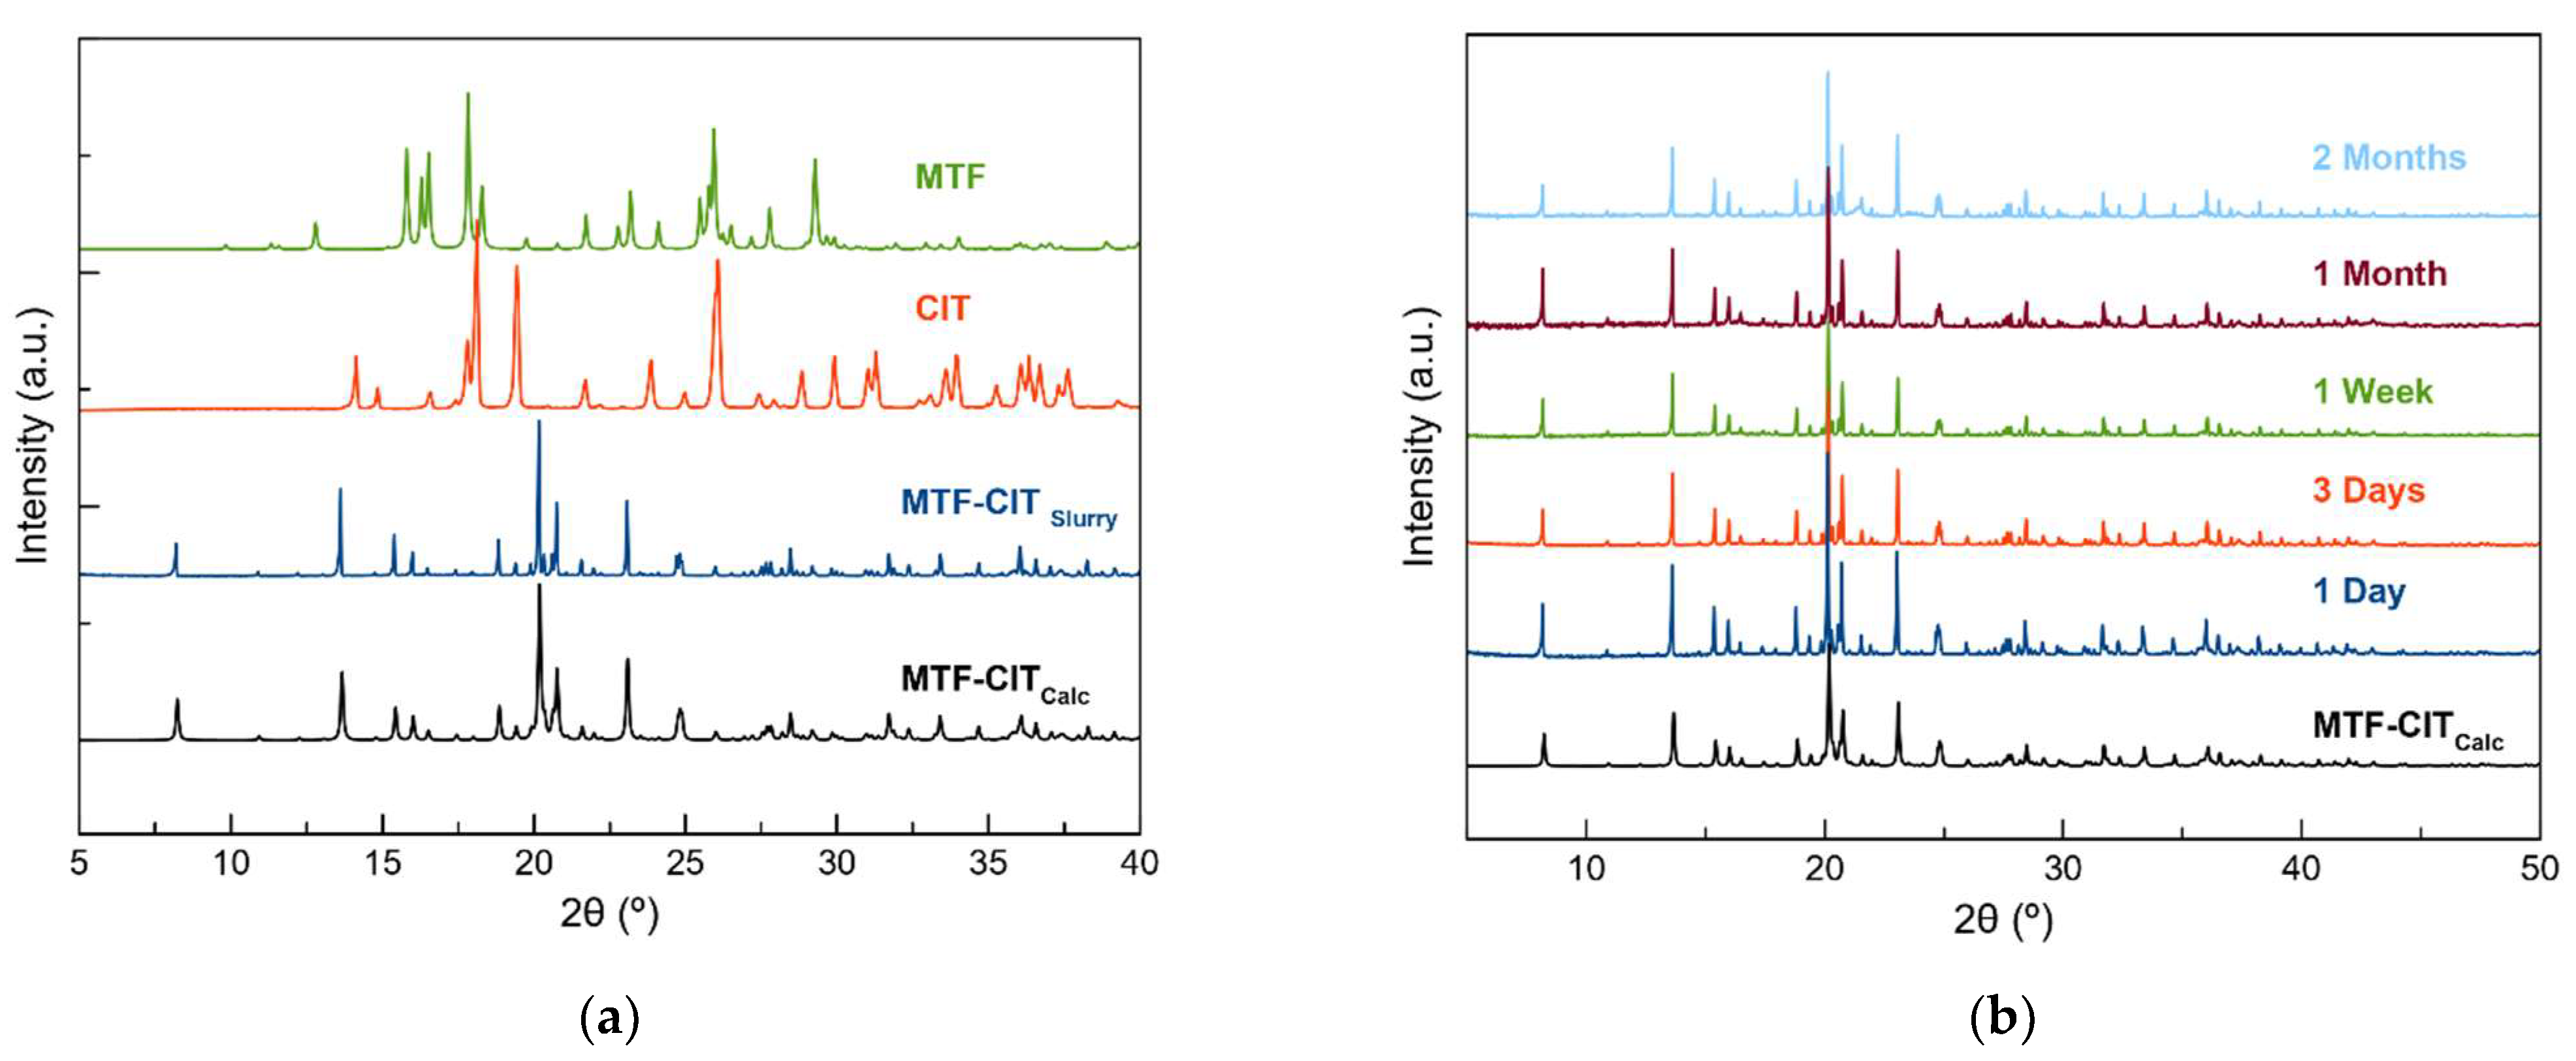
3.2. Powder X-ray Diffraction
Powder X-ray diffraction patterns are a unique fingerprint of the measured crystalline materials. From
Figure 2, it can be concluded that the powder pattern obtained for the new molecular salt (MTF–CIT) is entirely different from the raw starting materials, thus ensuring the appearance of the new crystalline phase. This fact was subsequently confirmed through structure resolution from SCXRD data. Furthermore, the comparison of the simulated PXRD data from the solved single crystal structure with the experimental patterns obtained from MTF–CIT corroborates the appearance of the new molecular salt and its purity. The absence of characteristic peaks of the starting materials in the diffraction pattern obtained for the new crystalline form synthesized with a 1:1 molar ratio confirms that the new molecular salt should have a 1:1 stoichiometry, which was further confirmed from the solved single crystal structure.
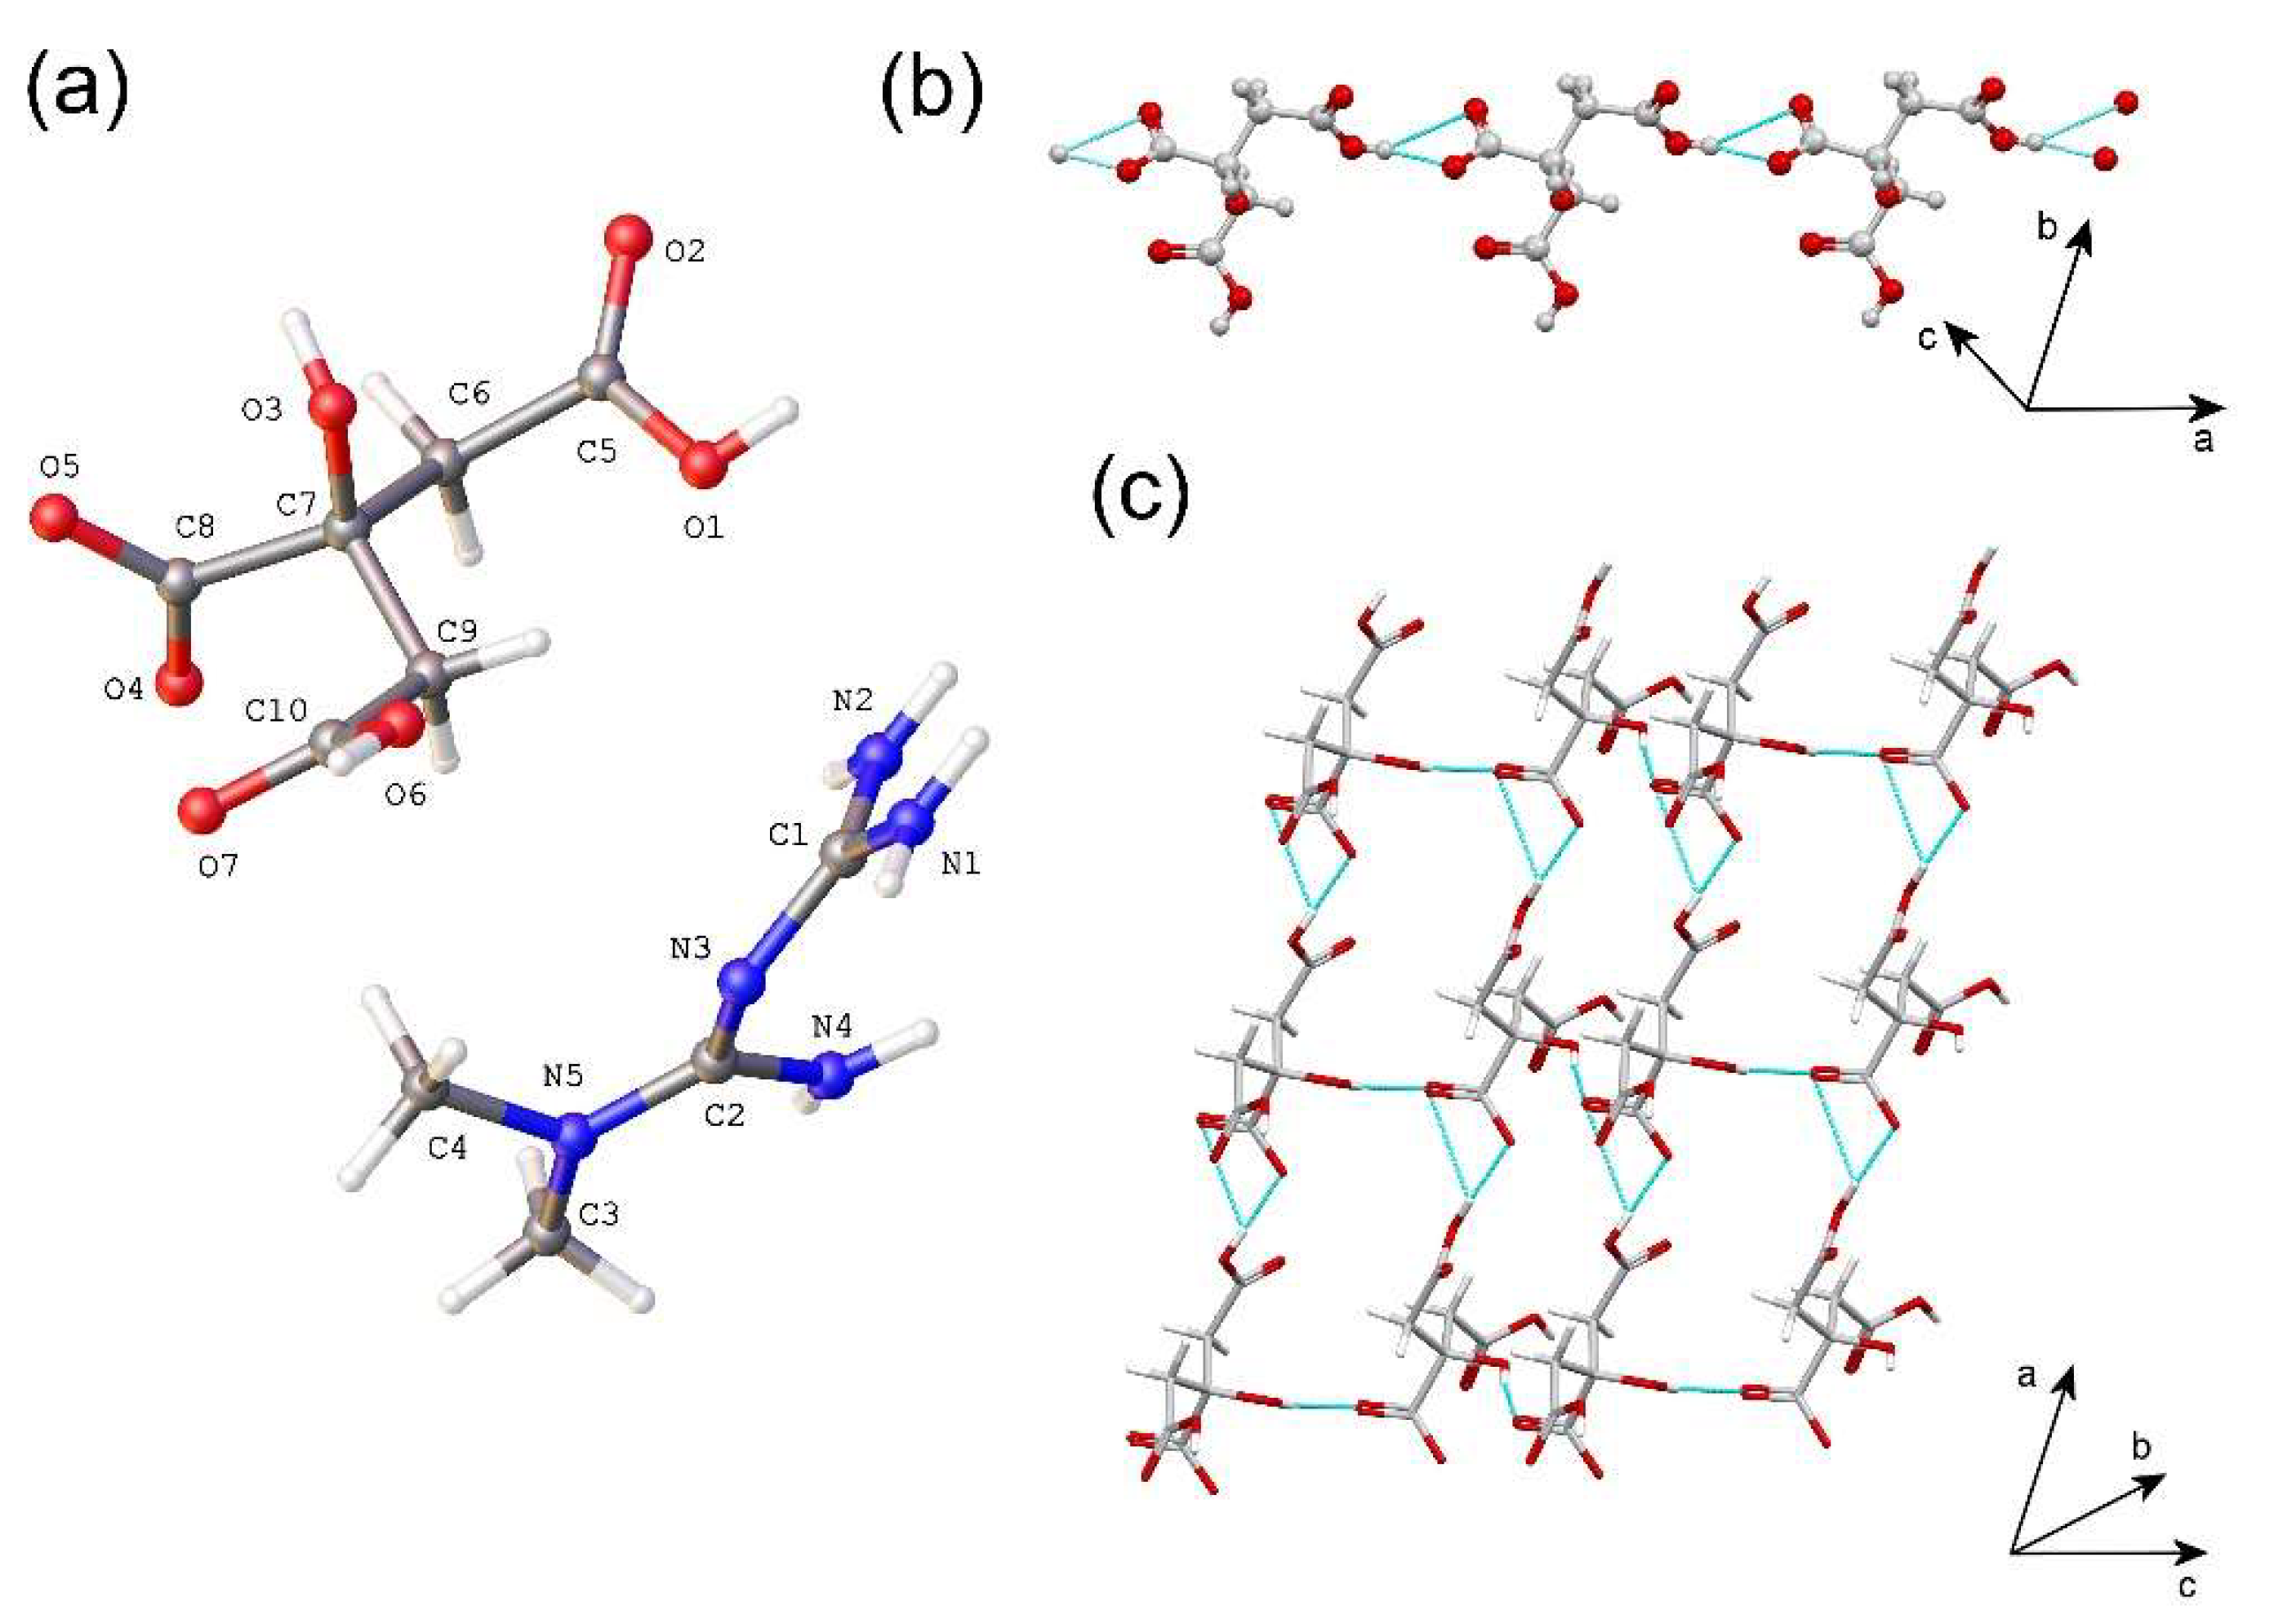
3.3. Structural Analysis MTF–CIT Salt
The MTF–CIT salt crystallizes in the monoclinic P2
1/c space group with z′ = 1. The asymmetric unit comprises one monoprotonated metformin cation (MTF
+) and one dihydrogen citrate anion (CIT
-) (
Figure 3a). The intermolecular interactions in MTF–CIT are shown in
Table 2. H-bonding interactions involving carboxylic and carboxylate groups (O1-H1···O5, graph set
(7)) connect CIT
- anions to build a chain along the
a axis (
Figure 3b). Further sheets extend parallel the ab plane by the assembly of adjacent chains through H-bond, involving hydroxyl and carboxylate groups (O3-H3···O4, graph set
(5)) (
Figure 3c).
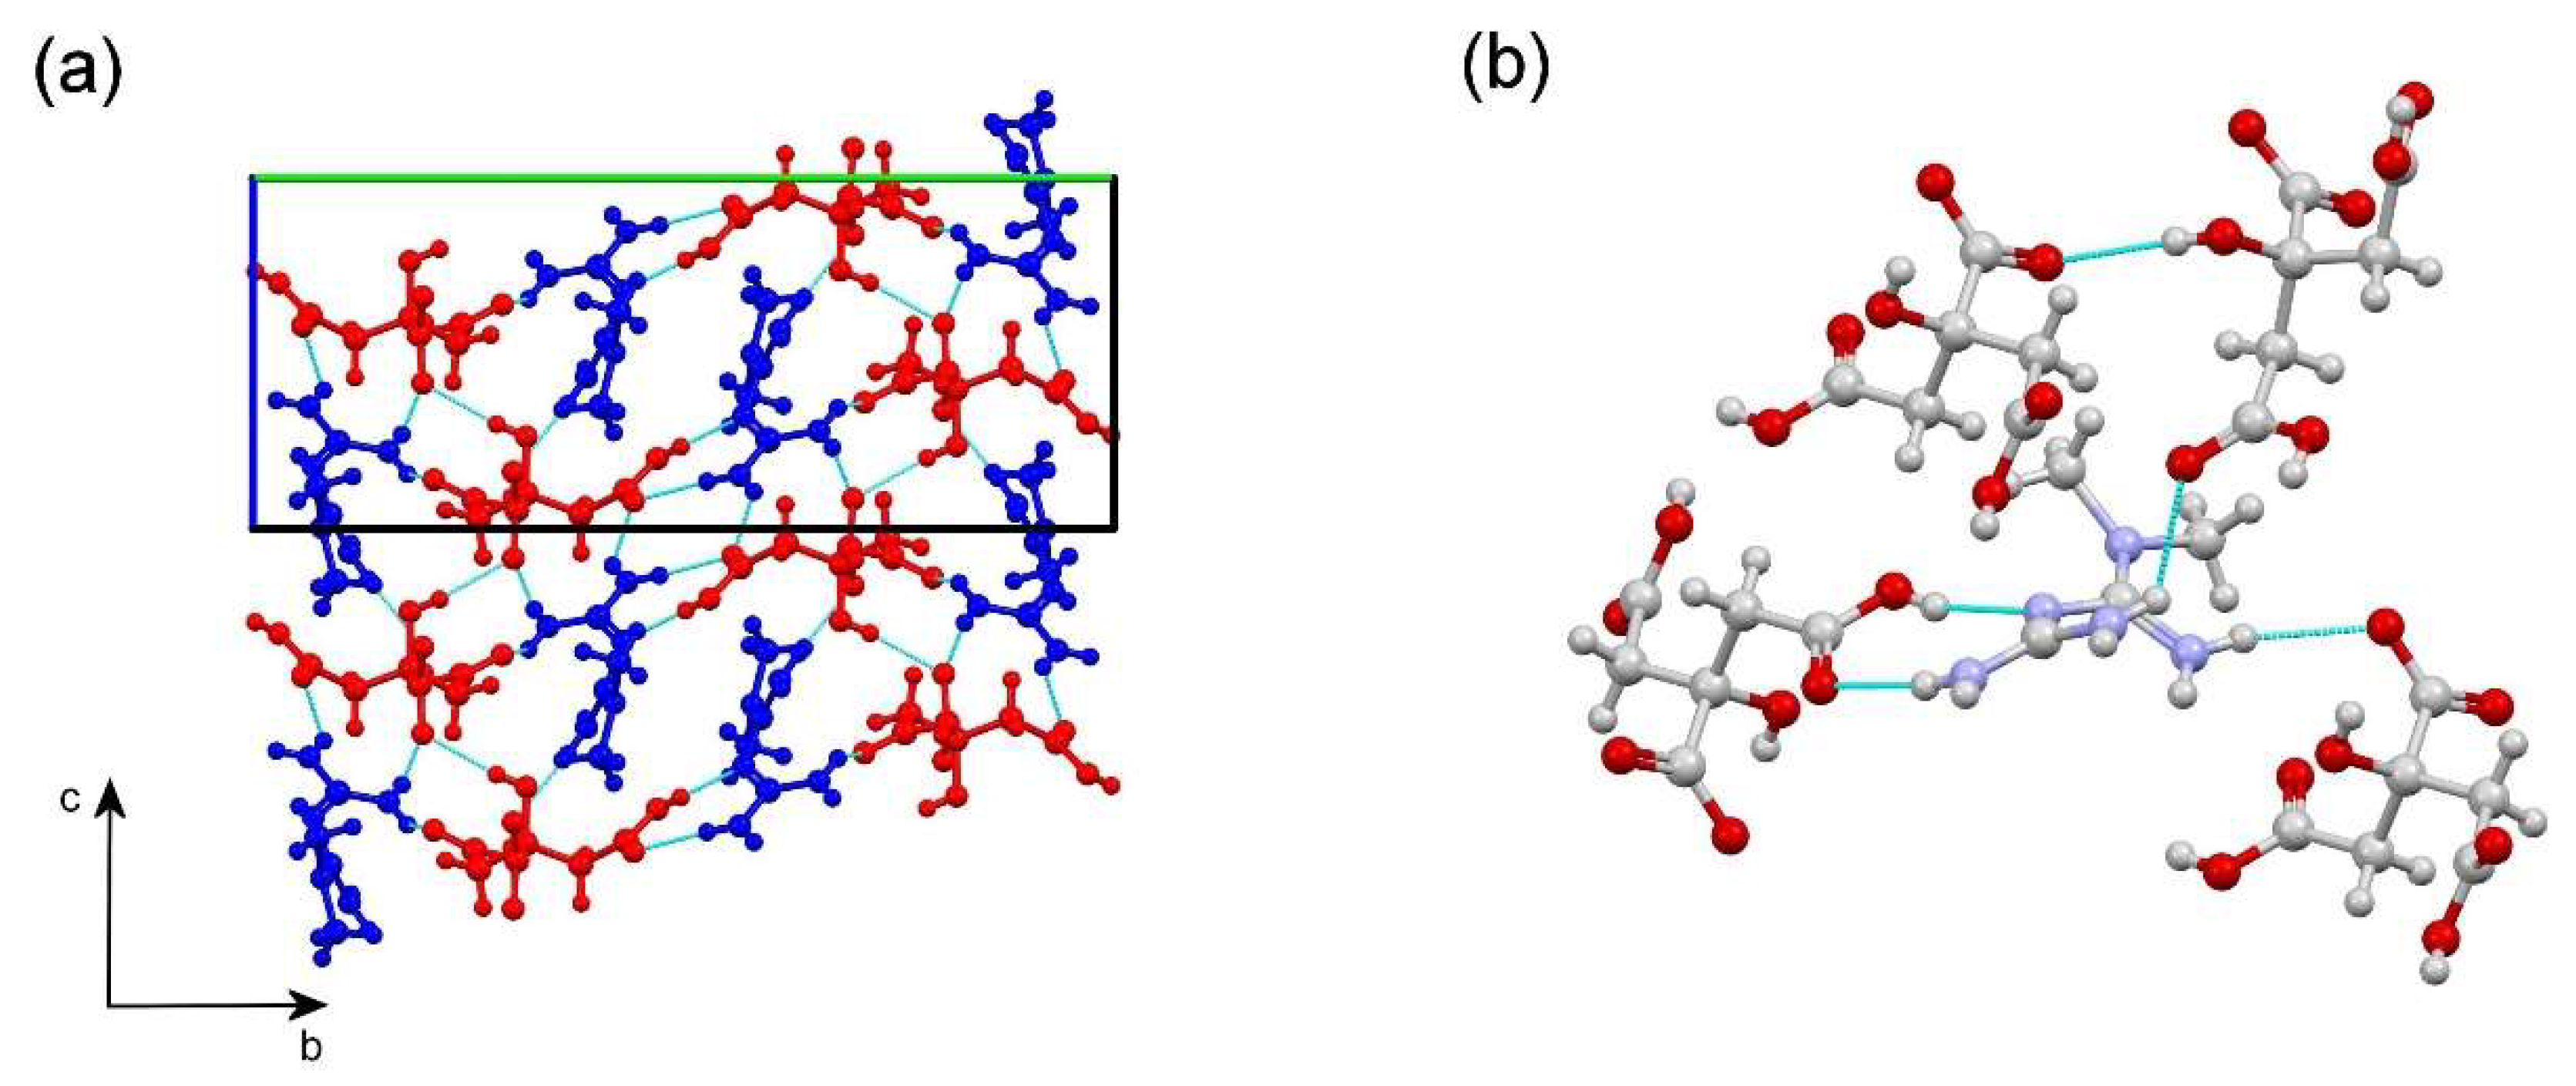
MTF
+ cations are located between sheets and participate in their cohesion involving carboxylic···amidine and amine···carboxylate synthons, generating a 3D H-bond network (
Figure 4a). Each MTF
+ cation interacts with four CIT
- anions (
Figure 4b). This arrangement can explain the enhancement of stability [
26,
27] of metformin provided by the formation of the molecular salt, as will be discussed in the following sections.
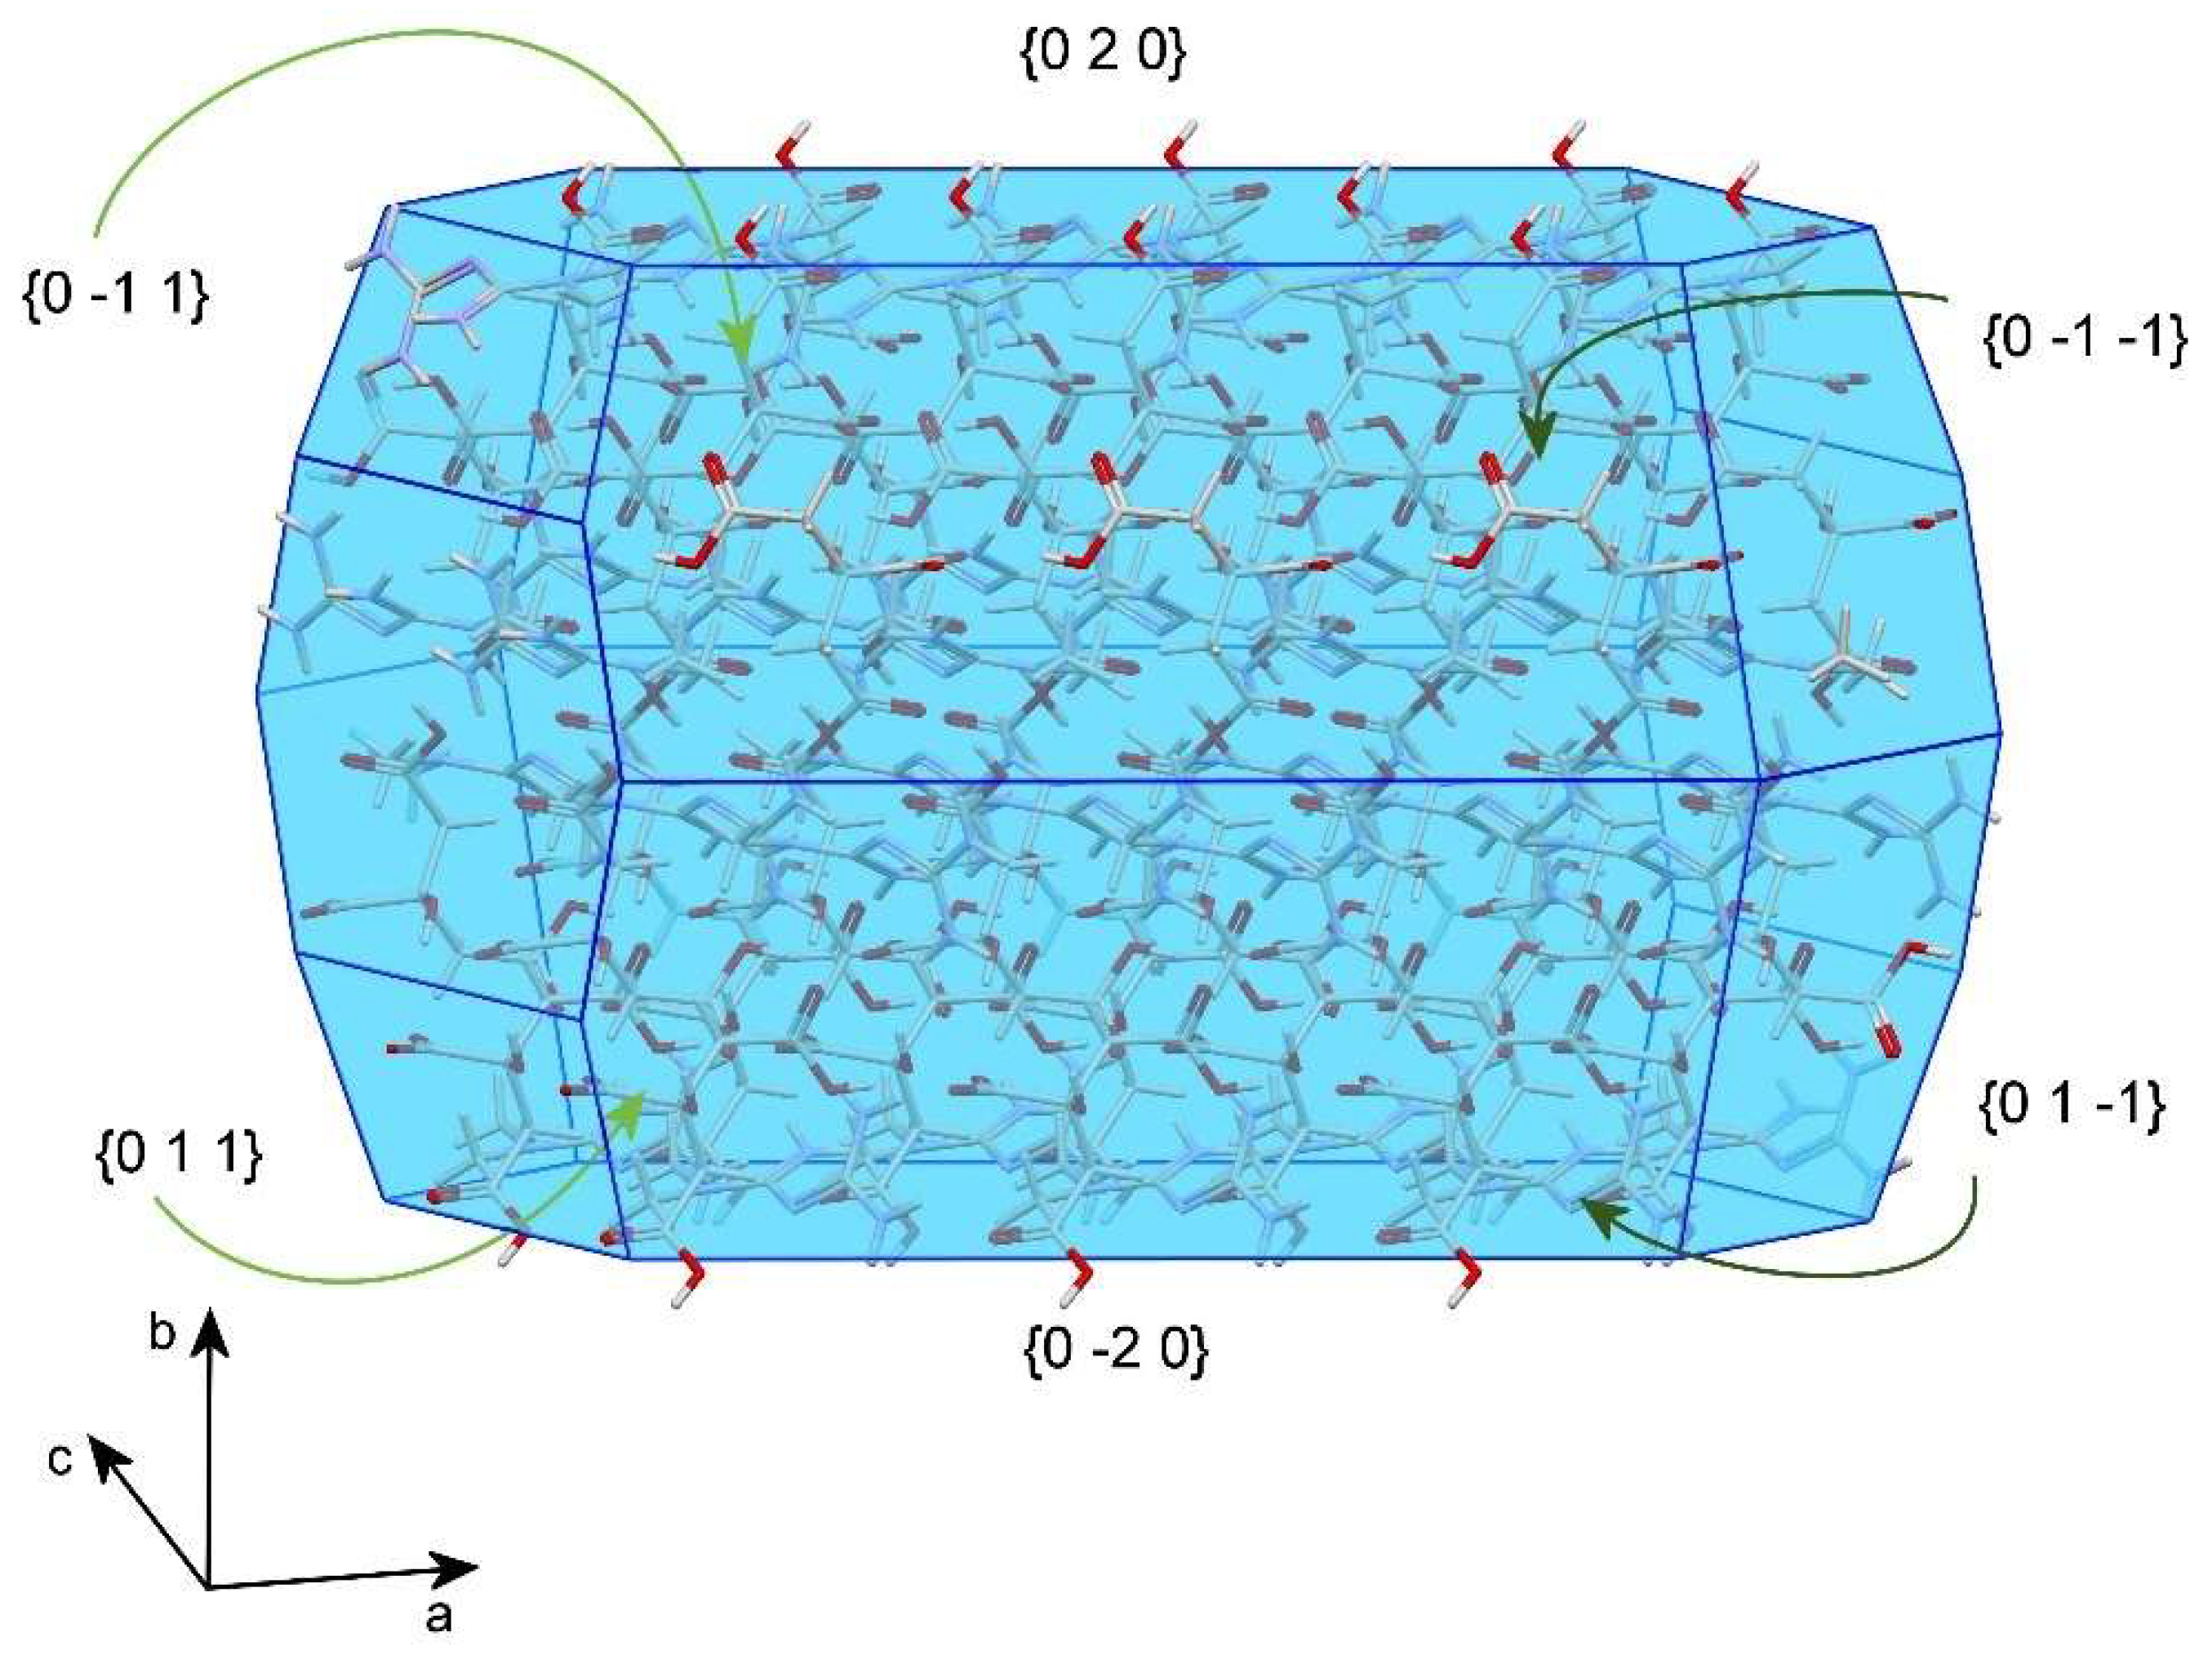
Crystal morphology of the MTF–CIT salt was computed using the Bravais–Friedel–Donnay–Harker (BFDH) method implemented in Mercury [
24]. The facets with the largest surfaces in the calculated morphology, {0 2 0} and {0 −2 0} (33%), contain citrate carboxylic and metformin amine groups; meanwhile, the facets {0 −1 −1}, {0 1 −1}, {0 −1 1} and {0 1 1} (30%) contain citrate carboxylic groups, pointing out the surface (
Figure 5). The distribution and extent of the observed polar groups could explain the better solubility performance of the molecular salt in comparison with the parent metformin drug [
28,
29]. As a comparison with the Bravais–Friedel–Donnay–Harker model,
Figure S1, it is shown a picture of the crystal morphology obtained in the experiments and an indexation of one of these crystals. The slightly different morphology is commonly related to kinetic effects in the crystal growth.
3.4. FT–IR Spectroscopy
Figure 6 shows the FT–IR spectra for the new molecular salt and for the two initial reactants. FT–IR is an instrumental technique that provides a fingerprint sign of each compound and valuable information about the non-covalent interactions between acceptor and donor groups. Batochromic peak shifts can be clearly found in the bands of one of the functional groups involved in the hydrogen bonds: the carboxylic groups in citric acid. The shifts in the stretching vibration of -C=O groups in citric acid occur from 1694 cm
−1 to 1635 cm
−1 for the obtained molecular salt, as well as with the carboxylic band of citric acid in the region of 3490 cm
−1. The -N-H vibrations shifts from 3411 to 3392 cm
−1. These shifts typically evidence a hydrogen bonding interaction between the -C=O group of citric acid molecules and the -N-H groups of metformin [
30,
31], as was further demonstrated from SCXRD structure resolution.
3.5. Stability Studies
The slurries of MTF–CIT in water were stable after 24 h of stirring. In order to confirm the stability of the solid phases, a PXRD analysis was performed after 24 h of stirring to confirm the presence of the original material. As can be seen in
Figure 7a, MTF–CIT remained stable after 24 h of stirring in water, as can be depicted by comparing the pattern obtained from the slurry with the calculated one from SCXRD, confirming the stability of the new molecular salt in water. Furthermore, the MTF–CIT was subjected to aging conditions at a temperature of 40 °C and 75% relative humidity for two months, sampling at different times and confirming by PXRD the stability of the crystalline phase, as shown in
Figure 7b. Nevertheless, the metformin base showed a high instability in aging conditions, namely 40 °C and 75% relative humidity, as can be seen in
Figure S2, where in a short time, the solid deliquesces.
3.6. Solubility Test
The abovementioned test was performed three times for each material and solvent, obtaining a mean solubility value in MilliQ water of 182(4) mg/mL for MTF–CIT, 102(6) mg/mL for MTF, in PBS buffer at pH 6.8, 197(5) mg/mL for MTF–CIT and 109(4) for MTF and in PBS buffer at pH 3, 214(6) for MTF–CIT and 91(2) for MTF. These values can be compared with the commercial form, metformin hydrochloride (MTF·HCl), whose reported solubility in water is about 340 mg/mL [
32]. All the remaining solids after saturation were analyzed by PXRD, and the phase stability was confirmed in all the cases.
The obtained solubility for MTF–CIT is about two-fold the MTF solubility, demonstrating the increased solubility of the novel material with respect to the former.
The exposure of polar groups on the facets with the largest surfaces in the calculated morphology, as previously explained in
Section 3.3 (
Figure 5), could explain the enhancement in the solubility [
28,
29] of about two-fold with respect to the parent form MTF.
The solubility enhancement has been observed in three different solutions, MilliQ water, and PBS buffer at pH 6.8 and pH 3, obtaining a solubility increase of about two-fold or bigger in all three cases, as shown in
Table 3.
It can also be observed in this table the variation of the initial pH of the solutions before and after the solute was dissolved, showing different situations depending on the initial value and the compound evaluated.
3.7. Thermal Analysis
DSC experiments were performed to evaluate the stability of the new molecular salt, as well as to determine the melting point of the new crystalline phase.
Figure 8 shows the DSC/TG of MTF–CIT and indicates a comparison of its melting point with the one of metformin (vertical dotted line). The MTF–CIT melting point is drawn as a clear endothermic peak with onset at 145.5 °C followed by a peak at around 190 °C corresponding to the thermal decomposition, as can be seen in the TG trace with an important loss of mass (
Figure S3).
The increased melting point can be considered an indicator of the thermal stability of the new crystalline material [
33], which is generally related to a decrease in solubility [
34,
35]. This is not the case in this new salt, which shows a solubility of about two-fold compared to MTF, in the same order of magnitude as metformin hydrochloride solubility.
4. Conclusions
In this investigation, a new molecular salt of metformin with citric acid (MTF–CIT) was obtained through solid-state synthesis using the liquid-assisted grinding method. The physicochemical characterization of the new crystalline form has been performed by using PXRD, DSC/TGA, FT-IR, and SCXRD. Moreover, stability and solubility were tested. The crystal structure was deeply analyzed to correlate the changes in stability and solubility with the crystallographic structure. The intermolecular interactions and computed crystal morphology suggest a steric protection effect of the metformin ion that leads to an enhancement of stability of metformin of several orders of magnitude compared with MTF, as well as increased solubility, making this new multicomponent salt a promising pharmaceutical solid concerning the future administration of metformin drug.
Supplementary Materials
The following supporting information can be downloaded at:
https://www.mdpi.com/article/10.3390/cryst12121748/s1, Figure S1. Crystal morphology obtained in the evaporation experiments (left) and indexation of one of these crystals (right). Figure S2. MTF base solid sample after less than 1 h exposition to 40 °C and 75% relative humidity. Figure S3. Complete DSC/TGA of MTF–CIT salt from 25 to 900 °C.
Author Contributions
Conceptualization and methodology, C.V.-E.; formal analysis and investigation, C.A.-P., F.J.A.-M. and A.D.-M.; writing–original draft preparation, C.A.-P., F.J.A.-M. and A.D.-M.; writing–review and editing, C.V.-E. and D.C.-L.; funding acquisition, D.C.-L. and A.D.-M.; supervision, C.V.-E. All authors have read and agreed to the published version of the manuscript.
Funding
This research was funded by Project PGC2018-102047-B-I00 (MCIU/AEI/FEDER, UE) and Project B-FQM-478-UGR20 (FEDER-Universidad de Granada, Spain).
Data Availability Statement
The Crystallographic Information File with the structural data of the new phase can be obtained from the CCDC, and submitted with the reference 2215418.
Acknowledgments
F.J.A.-M. wants to acknowledge an FPI grant (Ref. PRE2019-088832). C.V.-E. acknowledges Project PTA2020-019483-I funded by the Spanish Agencia Estatal de Investigación of the Ministerio de Ciencia e Innovación.
Conflicts of Interest
The authors declare no conflict of interest.
References
- Berry, D.J.; Steed, J.W. Pharmaceutical Cocrystals, Salts and Multicomponent Systems; Intermolecular Interactions and Property Based Design. Adv. Drug Deliv. Rev. 2017, 117, 3–24. [Google Scholar] [CrossRef] [PubMed] [Green Version]
- Kavanagh, O.N.; Croker, D.M.; Walker, G.M.; Zaworotko, M.J. Pharmaceutical Cocrystals: From Serendipity to Design to Application. Drug Discov. Today 2019, 24, 796–804. [Google Scholar] [CrossRef] [PubMed] [Green Version]
- Bolla, G.; Sarma, B.; Nangia, A.K. Crystal Engineering of Pharmaceutical Cocrystals in the Discovery and Development of Improved Drugs. Chem. Rev. 2022, 122, 11514–11603. [Google Scholar] [CrossRef] [PubMed]
- Duggirala, N.K.; Perry, M.L.; Almarsson, Ö.; Zaworotko, M.J. Pharmaceutical Cocrystals: Along the Path to Improved Medicines. Chem. Commun. 2015, 52, 640–655. [Google Scholar] [CrossRef]
- Bolla, G.; Nangia, A. Pharmaceutical Cocrystals: Walking the Talk. Chem. Commun. 2016, 52, 8342–8360. [Google Scholar] [CrossRef]
- Bailey, C.J. Metformin: Historical Overview. Diabetologia 2017, 60, 1566–1576. [Google Scholar] [CrossRef] [Green Version]
- Kirpichnikov, D.; McFarlane, S.I.; Sowers, J.R. Metformin: An Update. Ann. Intern. Med. 2002, 137, 25–33. [Google Scholar] [CrossRef]
- DeFronzo, R.A. Pharmacologic Therapy for Type 2 Diabetes Mellitus. Ann. Intern. Med. 1999, 131, 281–303. [Google Scholar] [CrossRef]
- Klepser, T.B.; Kelly, M.W. Metformin Hydrochloride: An Antihyperglycemic Agent. Am. J. Health-Syst. Pharm. 1997, 54, 893–903. [Google Scholar] [CrossRef]
- Cvetkovski, A.; Bertolasi, V.; Gilli, P. Pharmaceutical Cocrystals of the Biguanide Drug Metformin. In Proceedings of the 1st European Crystallography School, Pavia, Italy, 28 August–6 September 2014. [Google Scholar]
- Pérez-Fernández, R.; Fresno, N.; Goya, P.; Elguero, J.; Menéndez-Taboada, L.; García-Granda, S.; Marco, C. Structure and Thermodynamical Properties of Metformin Salicylate. Cryst. Growth Des. 2013, 13, 1780–1785. [Google Scholar] [CrossRef]
- Voltan, R.; Rimondi, E.; Melloni, E.; Gilli, P.; Bertolasi, V.; Casciano, F.; Rigolin, G.M.; Zauli, G.; Secchiero, P. Metformin Combined with Sodium Dichloroacetate Promotes B Leukemic Cell Death by Suppressing Anti-Apoptotic Protein Mcl-1. Oncotarget 2016, 7, 18965. [Google Scholar] [CrossRef] [PubMed] [Green Version]
- Chong-Canto, S.; García-Báez, E.v.; Martínez-Martínez, F.J.; Ramos-Organillo, A.A.; Padilla-Martínez, I.I. Mechanochemical Synthesis and Structure of the Tetrahydrate and Mesoporous Anhydrous Metforminium(2+)-n,N0-1,4-Phenylenedioxalamic Acid (1:2) Salt: The Role of Hydrogen Bonding and N→ π Charge Assisted Interactions. Pharmaceutics 2020, 12, 998. [Google Scholar] [CrossRef] [PubMed]
- Deng, J.H.; Lu, T.B.; Sun, C.C.; Chen, J.M. Dapagliflozin-Citric Acid Cocrystal Showing Better Solid State Properties than Dapagliflozin. Eur. J. Pharm. Sci. 2017, 104, 255–261. [Google Scholar] [CrossRef]
- Mukaida, M.; Watanabe, Y.; Sugano, K.; Terada, K. Identification and Physicochemical Characterization of Caffeine–Citric Acid Co-Crystal Polymorphs. Eur. J. Pharm. Sci. 2015, 79, 61–66. [Google Scholar] [CrossRef]
- Hasa, D.; Marosa, M.; Bučar, D.K.; Corpinot, M.K.; Amin, D.; Patel, B.; Jones, W. Mechanochemical Formation and “Disappearance” of Caffeine-Citric-Acid Cocrystal Polymorphs. Cryst. Growth Des. 2020, 20, 1119–1129. [Google Scholar] [CrossRef]
- Elbagerma, M.A.; Edwards, H.G.M.; Munshi, T.; Scowen, I.J. Identification of a New Cocrystal of Citric Acid and Paracetamol of Pharmaceutical Relevance. CrystEngComm 2011, 13, 1877–1884. [Google Scholar] [CrossRef] [Green Version]
- Lemmerer, A.; Bernstein, J. The Co-Crystal of Two GRAS Substances: (Citric Acid)·(Nicotinamide). Formation of Four Hydrogen Bonding Heterosynthons in One Co-Crystal. CrystEngComm 2010, 12, 2029–2033. [Google Scholar] [CrossRef]
- Soccol, C.R.; Vandenberghe, L.P.S.; Rodrigues, C.; Pandey, A. New Perspectives for Citric Acid Production and Application. Food Technol. Biotechnol. 2006, 44, 141–149. [Google Scholar]
- Coelho, A.A. TOPAS and TOPAS-Academic: An Optimization Program Integrating Computer Algebra and Crystallographic Objects Written in C++. J. Appl. Crystallogr. 2018, 51, 210–218. [Google Scholar] [CrossRef] [Green Version]
- Bruker APEX3, APEX3; Bruker: Billerica, MA, USA, 2019.
- Sheldrick, G.M. IUCr SHELXT–Integrated Space-Group and Crystal-Structure Determination. Acta Cryst. 2015, 71, 3–8. [Google Scholar] [CrossRef] [Green Version]
- Sheldrick, G.M. Crystal Structure Refinement with SHELXL. Acta Crystallogr. C Struct. Chem. 2015, 71, 3–8. [Google Scholar] [CrossRef] [Green Version]
- MacRae, C.F.; Sovago, I.; Cottrell, S.J.; Galek, P.T.A.; McCabe, P.; Pidcock, E.; Platings, M.; Shields, G.P.; Stevens, J.S.; Towler, M.; et al. Mercury 4.0: From Visualization to Analysis, Design and Prediction. J. Appl. Crystallogr. 2020, 53, 226–235. [Google Scholar] [CrossRef] [Green Version]
- Dolomanov, O.v.; Bourhis, L.J.; Gildea, R.J.; Howard, J.A.K.; Puschmann, H. OLEX2: A Complete Structure Solution, Refinement and Analysis Program. J. Appl. Crystallogr. 2009, 42, 339–341. [Google Scholar] [CrossRef]
- Bofill, L.; de Sande, D.; Barbas, R.; Prohens, R. A New and Highly Stable Cocrystal of Vitamin D3 for Use in Enhanced Food Supplements. Cryst. Growth Des. 2021, 21, 1418–1423. [Google Scholar] [CrossRef]
- Verdugo-Escamilla, C.; Alarcón-Payer, C.; Acebedo-Martínez, F.J.; Fernández-Penas, R.; Domínguez-Martín, A.; Choquesillo-Lazarte, D. Lidocaine Pharmaceutical Multicomponent Forms: A Story about the Role of Chloride Ions on Their Stability. Crystals 2022, 12, 798. [Google Scholar] [CrossRef]
- Suresh, K.; Nangia, A. Curcumin: Pharmaceutical Solids as a Platform to Improve Solubility and Bioavailability. CrystEngComm 2018, 20, 3277–3296. [Google Scholar] [CrossRef]
- Barbas, R.; Font-Bardia, M.; Frontera, A.; Prohens, R. Polymorphism in the 1/1 Pterostilbene/Picolinic Acid Cocrystal. Cryst. Growth Des. 2022, 22, 590–597. [Google Scholar] [CrossRef]
- Seo, J.; Hoffmann, W.; Malerz, S.; Warnke, S.; Bowers, M.T.; Pagel, K.; von Helden, G. Side-Chain Effects on the Structures of Protonated Amino Acid Dimers: A Gas-Phase Infrared Spectroscopy Study. Int. J. Mass Spectrom. 2018, 429, 115–120. [Google Scholar] [CrossRef]
- Nakamoto, K. Infrared and Raman Spectra of Inorganic and Coordination Compounds, Part B: Applications in Coordination, Organometallic, and Bioinorganic Chemistry, 6th ed.; John Wiley & Sons, Inc.: Hoboken, NJ, USA, 2009; Volume Part B. [Google Scholar]
- Sun, X.; Du, S.; Sun, Y.; Li, H.; Yu, C.P.; Guo, J.; Wang, Y.; Yu, S.; Cheng, Y.; Xue, F. Solubility Measurement and Data Correlation of Metformin Hydrochloride in Four Aqueous Binary Solvents and Three Pure Solvents from 283.15 to 323.15 K. J. Chem. Eng. Data 2021, 66, 3282–3292. [Google Scholar] [CrossRef]
- Schultheiss, N.; Newman, A. Pharmaceutical Cocrystals and Their Physicochemical Properties. Cryst. Growth Des. 2009, 9, 2950–2967. [Google Scholar] [CrossRef] [Green Version]
- Pinal, R. Effect of Molecular Symmetry on Melting Temperature and Solubility. Org. Biomol. Chem. 2004, 2, 2692–2699. [Google Scholar] [CrossRef] [PubMed]
- Batisai, E.; Ayamine, A.; Kilinkissa, O.E.Y.; Báthori, N.B. Melting Point-Solubility-Structure Correlations in Multicomponent Crystals Containing Fumaric or Adipic Acid. CrystEngComm 2014, 16, 9992–9998. [Google Scholar] [CrossRef]
| Publisher’s Note: MDPI stays neutral with regard to jurisdictional claims in published maps and institutional affiliations. |
© 2022 by the authors. Licensee MDPI, Basel, Switzerland. This article is an open access article distributed under the terms and conditions of the Creative Commons Attribution (CC BY) license (https://creativecommons.org/licenses/by/4.0/).


 ,
, 


