Article

Research on Brownian Thermal Noise Limit of a Cylindrical Ultra-Stable Cavity with Support Pads

1
National Time Service Center, Chinese Academy of Sciences, 3 East Shuyuan Road, Xi’an 710600, China
2
Key Laboratory of Time and Frequency Standards, Chinese Academy of Sciences, 3 East Shuyuan Road, Xi’an 710600, China
*
Author to whom correspondence should be addressed.
These authors contributed equally to this work.
Crystals 2022, 12(11), 1682; https://doi.org/10.3390/cryst12111682
Submission received: 20 October 2022 / Revised: 11 November 2022 / Accepted: 17 November 2022 / Published: 21 November 2022
(This article belongs to the Special Issue Crystals in Laser Systems)

Abstract

:
Brownian thermal noise (TN) of ultra-stable cavities (USCs) imposes a fundamental limitation on the frequency stability of ultra-narrow linewidth lasers. This work investigates the TN in cylindrical USCs with the four support pads in detail through theoretical estimation and simulation. To evaluate the performance of state-of-the-art ultra-narrow linewidth lasers, we derive an expression of the TN for a cylindrical spacer according to the fluctuation–dissipation theorem, which takes into account the front face area of the spacer. This estimation is more suitable for the TN of the cylindrical USC than the previous one. Meanwhile, we perform detailed studies of the influence of the four support pads on the TN in cylindrical USCs for the first time by numerical simulations. For a 400 mm long cylindrical USC with an ultra-low expansion spacer and fused silica substrates, the displacement noise contributed from the four support pads is roughly four times that of the substrates and the GaAs/AlGaAs crystalline coating. The results show that the four support pads are the primary TN contributors under some materials and geometries of USCs.

1. Introduction

Ultra-narrow linewidth lasers play a key role in several fields, such as high-precision spectroscopy [1,2], time and frequency standards [3,4,5,6,7], gravitational wave detection [8], fundamental physics tests [9,10], and transfer of optical frequencies by fiber networks [11,12]. Generally, ultra-narrow linewidth lasers are based on lasers that are stabilized to USCs using the Pound–Drever–Hall locking technique and the optical length stability of USCs determines the frequency stability of ultra-narrow linewidth lasers [1,2,13,14]. Using thermal isolation, vacuum, and mechanical isolation, the influence of pressure, temperature, and vibration on the USCs can be well suppressed [14].
Nevertheless, a fundamental issue is that TN causes microscopic length changes in the USCs. TN is composed of a variety of noise sources, such as Brownian, thermo-refractive, and thermo-elastic noise. The main TN is Brownian noise. To decrease this noise, researchers have invested in significant work [15,16,17,18,19,20,21,22,23,24,25,26,27,28]. Y. Levin [15] proposed an effective method for calculating TN, which is based on the fluctuation–dissipation theorem (FDT). To estimate the TN of a spacer, mirror substrates, and mirror coating of cylindrical USCs, Numata et al. [16] provided several equations using this method. A few strategies are being applied to reduce the TN in the USC, such as low mechanical loss of substrate and coating, low-temperature technologies, and increasing the length of USCs [18,19,24,25,26,27,28]. At present, the ultra-narrow linewidth laser with the best performance shows that the frequency stability has achieved a 10−17 order of magnitude at 1s [24,25,26], and its linewidth is about 8 mHz [24]. As a result, the spacer and the support structure contribution are non-negligible [17]. Therefore, to evaluate the performance of state-of-the-art ultra-narrow linewidth lasers using the cylindrical USC, it is important to propose a more reasonable analysis approach of the TN in cylindrical USCs with support pads.
In this work, theoretical estimation and finite element simulation (FEA) of the TN in cylindrical USCs with support pads are presented in detail. First, according to FDT, we derive the formula for estimating the TN of a cylindrical spacer. Under the same conditions, the new estimation method and FEA are compared. The two results are consistent. The new estimation formula is suitable for spacers made of various materials and with any geometric dimension. We present the analysis and interpretation of the discrepancies between the FEA and theoretical estimation. Second, the influence of the support pads on the TN of USCs is studied in detail. The results show that for a long cylindrical USC made of ultra-low expansion (ULE) spacer and fused silica (FS) substrates and GaAs/AlGaAs crystalline coating, the contribution of the support pads to the total TN cannot be ignored, and may even be the main factor. This point should be taken into consideration for the ultra-narrow linewidth laser with the design objective of the fractional frequency stability 10−17 order and realized by a long cylindrical USC.
The work is arranged as follows: The TN principle framework in the USCs is discussed in Section 2. A typical cylindrical USC design is simulated by FEA in Section 3.1, and the distribution characteristics of TN in the USC are discussed. In Section 3.2, towards a better understanding of the differences between the FEA and theoretical calculation, the spacers of TN with various conditions are investigated including the USC materials and the USC length. In Section 4, this work focuses on the influence of the support pads on the TN in USCs. Finally, we present the conclusions of this paper in Section 5.

2. TN Principle Framework

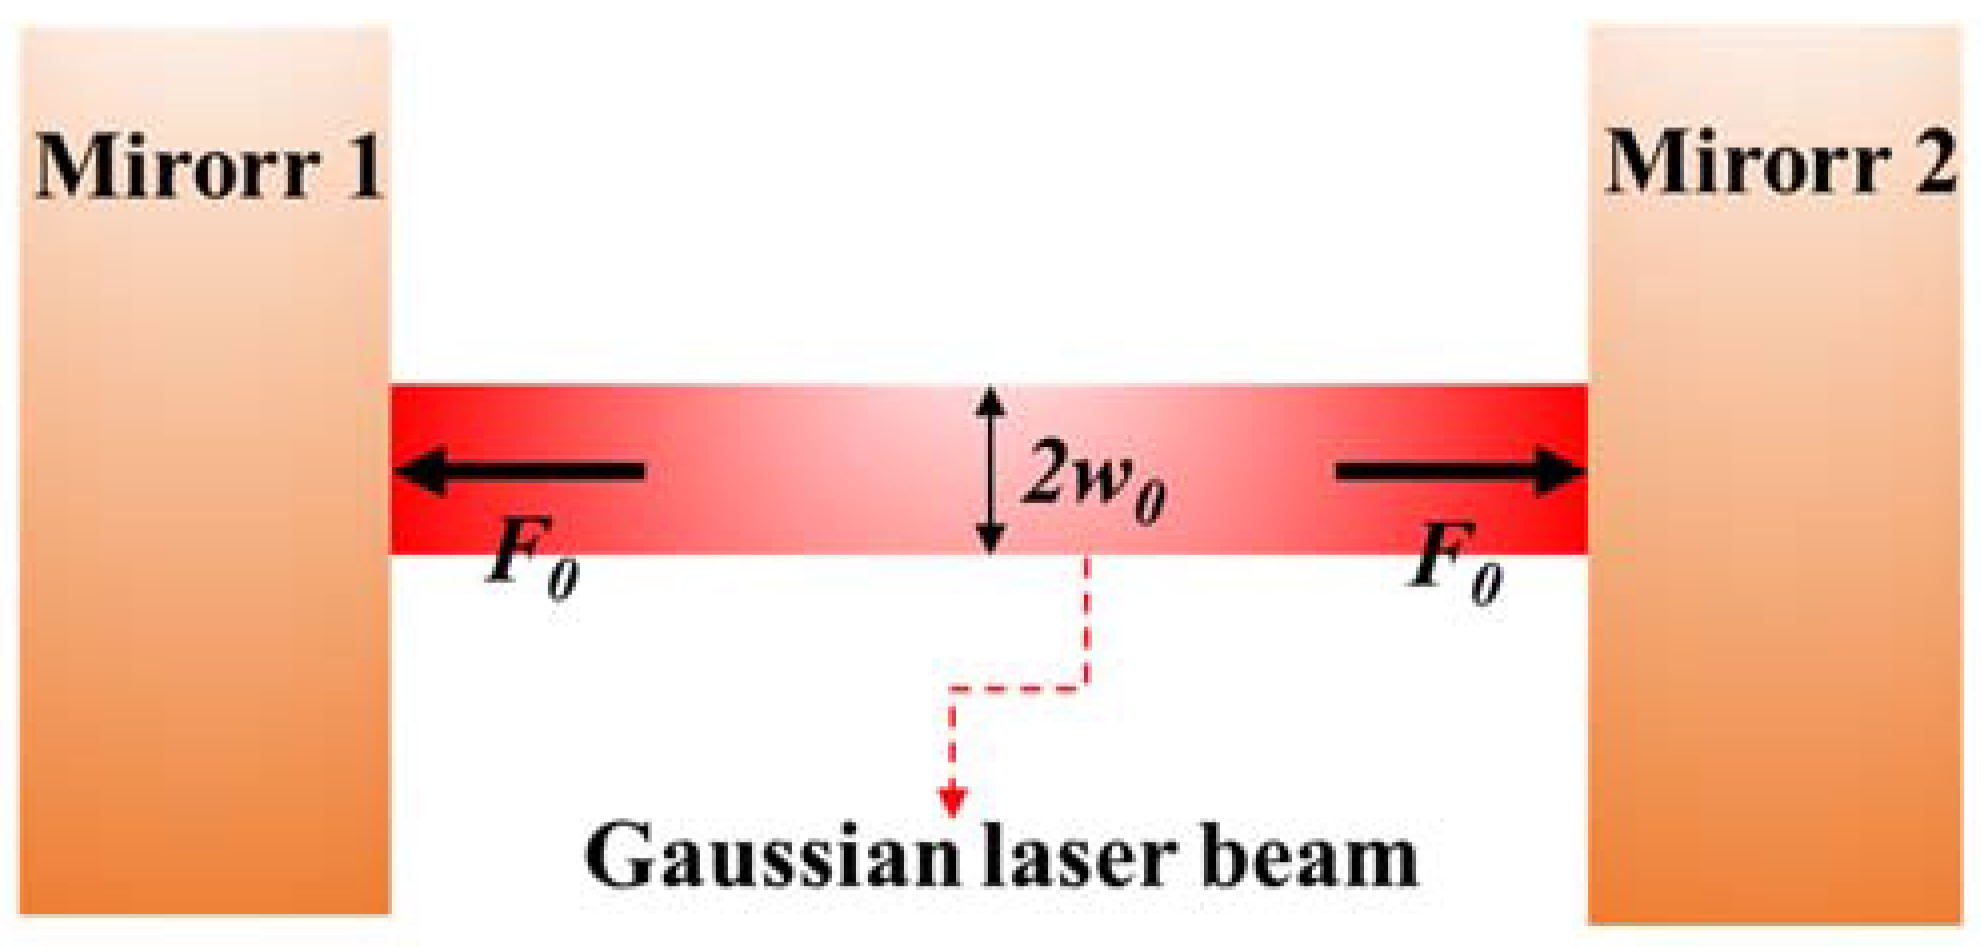
2.1. Fundamental Principle

Based on Y. Levin’s proposed direct approach [15], Numata et al. [16] investigated the influence of TN caused by Brownian motion on the USC length stability. This theory is illuminated below. The distance between two highly reflective mirrors of USCs is x. While a USC is subjected to a force with an F0 amplitude and an f0 frequency, the power spectral density (PSD) Gx(f0) of the fluctuations of USCs length along the x-axis can be written as [14,16]:
G x ( f 0 ) = 4 k B T U max ϕ π f 0 F 0 2
where kB = 1.381 × 10⁻²³ J/K and T are the Boltzmann constant and the temperature, respectively. Umax and ϕ denote the maximum elastic strain energy (ESE) and the USC loss angle, respectively.
Generally, a USC is made up of a spacer and two mirrors which consist of substrate and coating. We use Gx(f0)spacer, Gx(f0)substrate, and Gx(f0)coating to express the PSDs of length fluctuations for the spacer, substrates, and coatings, respectively. It is assumed that all TN sources are not related, the total PSD Gx(f0) can be presented as [16]:
G x ( f 0 ) = G x ( f 0 ) s p a c e r + 2 ( G x ( f 0 ) s u b s t r a t e + G x ( f 0 ) m i r r o r ) = 4 k B T π f 0 F 0 2 ( U s p a c e r ϕ s p a c e r + 2 U s u b s t r a t e ϕ s u b s t r a t e + 2 U c o a t i n g ϕ c o a t i n g )
where Usubstrate, Uspacer, and Ucoating are the ESE of the substrates, spacer, and coatings, respectively. ϕsubstrate, ϕspacer, and ϕcoating are the loss angles of the substrates, spacer, and coatings, respectively. In this work, theoretical estimations of Usubstrate and Ucoating are referred to ref. [16]. For ultra-narrow linewidth lasers, when the length of USC is L, the Allan deviation [29] σy of the fractional frequency fluctuations can be expressed as:
σ y = 2 ln ( 2 ) f 0 G x ( f 0 ) L 2

2.2. TN Principle of a Cylindrical Spacer

The cylindrical USC supported by four elastic support pads is shown in Figure 1. At the end of the cylindrical USC, there are two high-reflection mirrors, which are optically contacted on the USC. There is a diameter 2r through a hole in the light. At the outer diameter of the USC, two grooves are cut along the light direction to serve as the support surface, and the USC has a mushroom-shaped cross-section. The four supporting pads are symmetrically placed on the supporting surfaces on both sides.
An estimation of the TN of the spacer in the USC is calculated by averaging the cross-sectional area. Based on Levin’s direct approach, pressure is uniformly distributed across the front faces of the spacer. It leads to an ESE Uspacer and the PSD of length fluctuations Gx(f0)spacer can be expressed as
U s p a c e r = L F 0 2 2 E s p a c e r ( π R 2 π r 2 w c h c ) G x ( f 0 ) s p a c e r = 4 k B T π f 0 L ϕ s p a c e r 2 E s p a c e r ( π R 2 π r 2 w c h c )
where Espacer is the modulus of elasticity of the spacer. Equation (4) takes into account that the areas of the light hole and the cut parts for supporting the USC reduce the cross-sectional area of the spacer. We use the formula for the position fluctuations of a free elastic bar end for the derivation of the above formulas. When the length fluctuation of the USC is calculated, it is necessary to apply opposite forces at both ends simultaneously based on Y. Levin’s direct method.

2.3. TN Principle of the Support Pads

For modern USCs, generally, vibration-insensitive mountings are used to achieve fractional frequency stabilities below σy =10−15 [1,2,26,30,31,32]. The horizontal USCs are widely supported at the Airy points by four elastic pads [1,26,30,31]. As the loss angle of the pad materials ϕsupport is relatively high, the pads’ contribution to the TN may not be ignored [17]. It is assumed that the pads are fixed and the spacer is simplified as an elastic bar [33]; the ESE Usupport and the PSD of length fluctuations Gx(f0)support for the four support pads are provided by [17]:
U s u p p o r t = 2 L s u p G s u p p o r t r s u p 2 3 d s u p E s p a c e r R 2 U s p a c e r G x ( f 0 ) s p a c e r = 2 L s u p G s u p p o r t r s u p 2 ϕ s u p p o r t 3 d s u p E s p a c e r R 2 ϕ s p a c e r G x ( f 0 ) s p a c e r
where Gsupport is the shear modulus of the support pads. Gsupport can easily be converted by the elastic modulus Esupport and Poisson ratio σsupport of the pads Gsupport = Esupport/(2 + 2σsupport) [34]. Note that the Airy points are located at Lsup/L = 1/(2 3 ) according to ref. [33] in Equation (5).
According to Equations (1) and (2), 0.1 nJ ESE corresponds to a Gx(f0) = 0.858 × 10⁻³⁵ m2/Hz at 1 Hz and a σy = 3.44 × 10⁻¹⁷ at 1s for an all-ULE USC with 100 mm length [17,23].

3. Estimation and Simulation

The TN of the USC is proportional to ESE according to Equation (1). In this work, we use ESE to present our results for research convenience in this Section. The ESE in the spacer is simulated by the FEA software. As shown in Figure 2, the red wide line represents the laser beam, whose profile corresponds to the pressure distribution p(r) loading on the two mirrors. p(r) can be expressed as [17]:
p ( r b ) = ± 2 F 0 π w 0 2 e 2 ( r b w 0 ) 2
where a radius w0 of the Gaussian laser beam is 250 μm.
According to FDT, the position of the force F0 acting on the two USC mirrors is consistent with the laser beam. When the relationship between stress and strain of an elastic-mechanical system is linear, the amplitude of force F0 is not strictly required [23]. For the convenience of calculation and simulation, a force F0 of 1 N is used in this work.
The important parameters are presented in Table 1 and Table 2 for the estimation and simulation. In this work, the materials of the USCs include room-temperature materials (T = 300 K) and low-temperature materials (T = 4 K). For the USC, to reduce the influence of temperature change on its length, it needs to be placed in the temperature environment of its zero coefficient of thermal expansion (CTE). Generally, the difference between low-temperature materials and room-temperature materials is mainly determined by the temperature of zero CTE. When the zero CTE point of the material is at room temperature, it is a room-temperature material. The same is true for a low-temperature material.

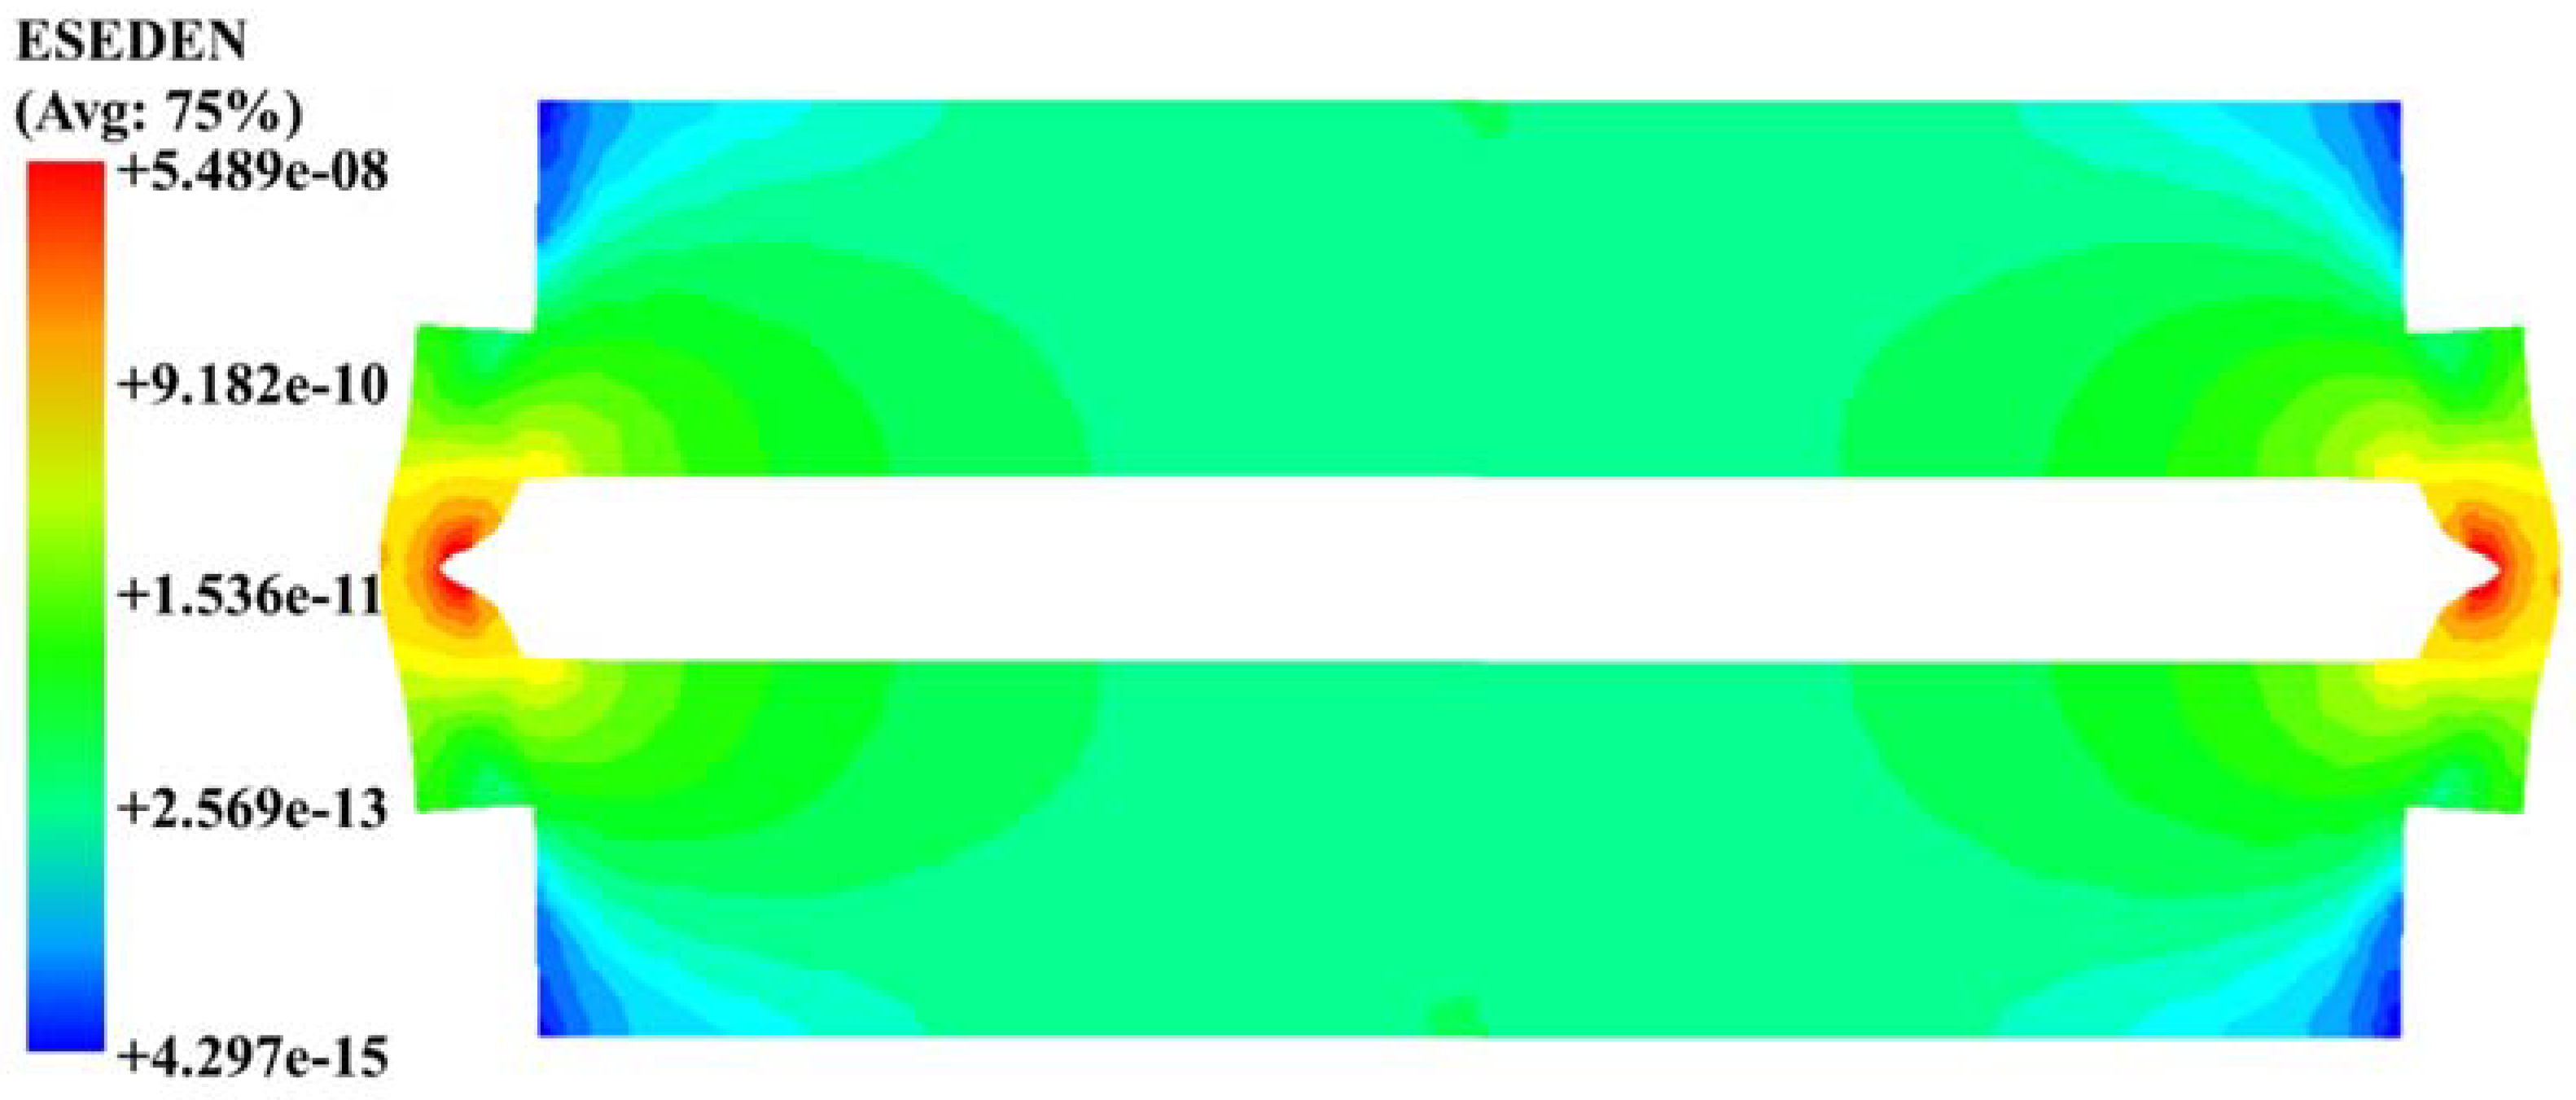
3.1. Distribution Characteristics of ESE

Figure 3 shows that the majority of the ESE in the USC is mainly located in the two mirrors, which is similar to the USCs of other shapes [16,17,23]. The mirror’s deformation reflects the Gaussian distribution. In the simulation, a radius w0 of the Gaussian laser beam is 2 mm for illustration. The maximum ESE in the spacer locates around the light hole, which is in close contact with the two mirrors. The simulation results show that there are large deformations at the boundary between the two mirrors and the spacer. Uniform ESE density distribution is obtained at distances beyond this critical depth. According to Equation (2) in ref. [16], the analytical estimation of the spacer is not satisfied for the entire spacer length because it ignores the local deformation caused by the uneven pressure distribution on the cross-sectional area.

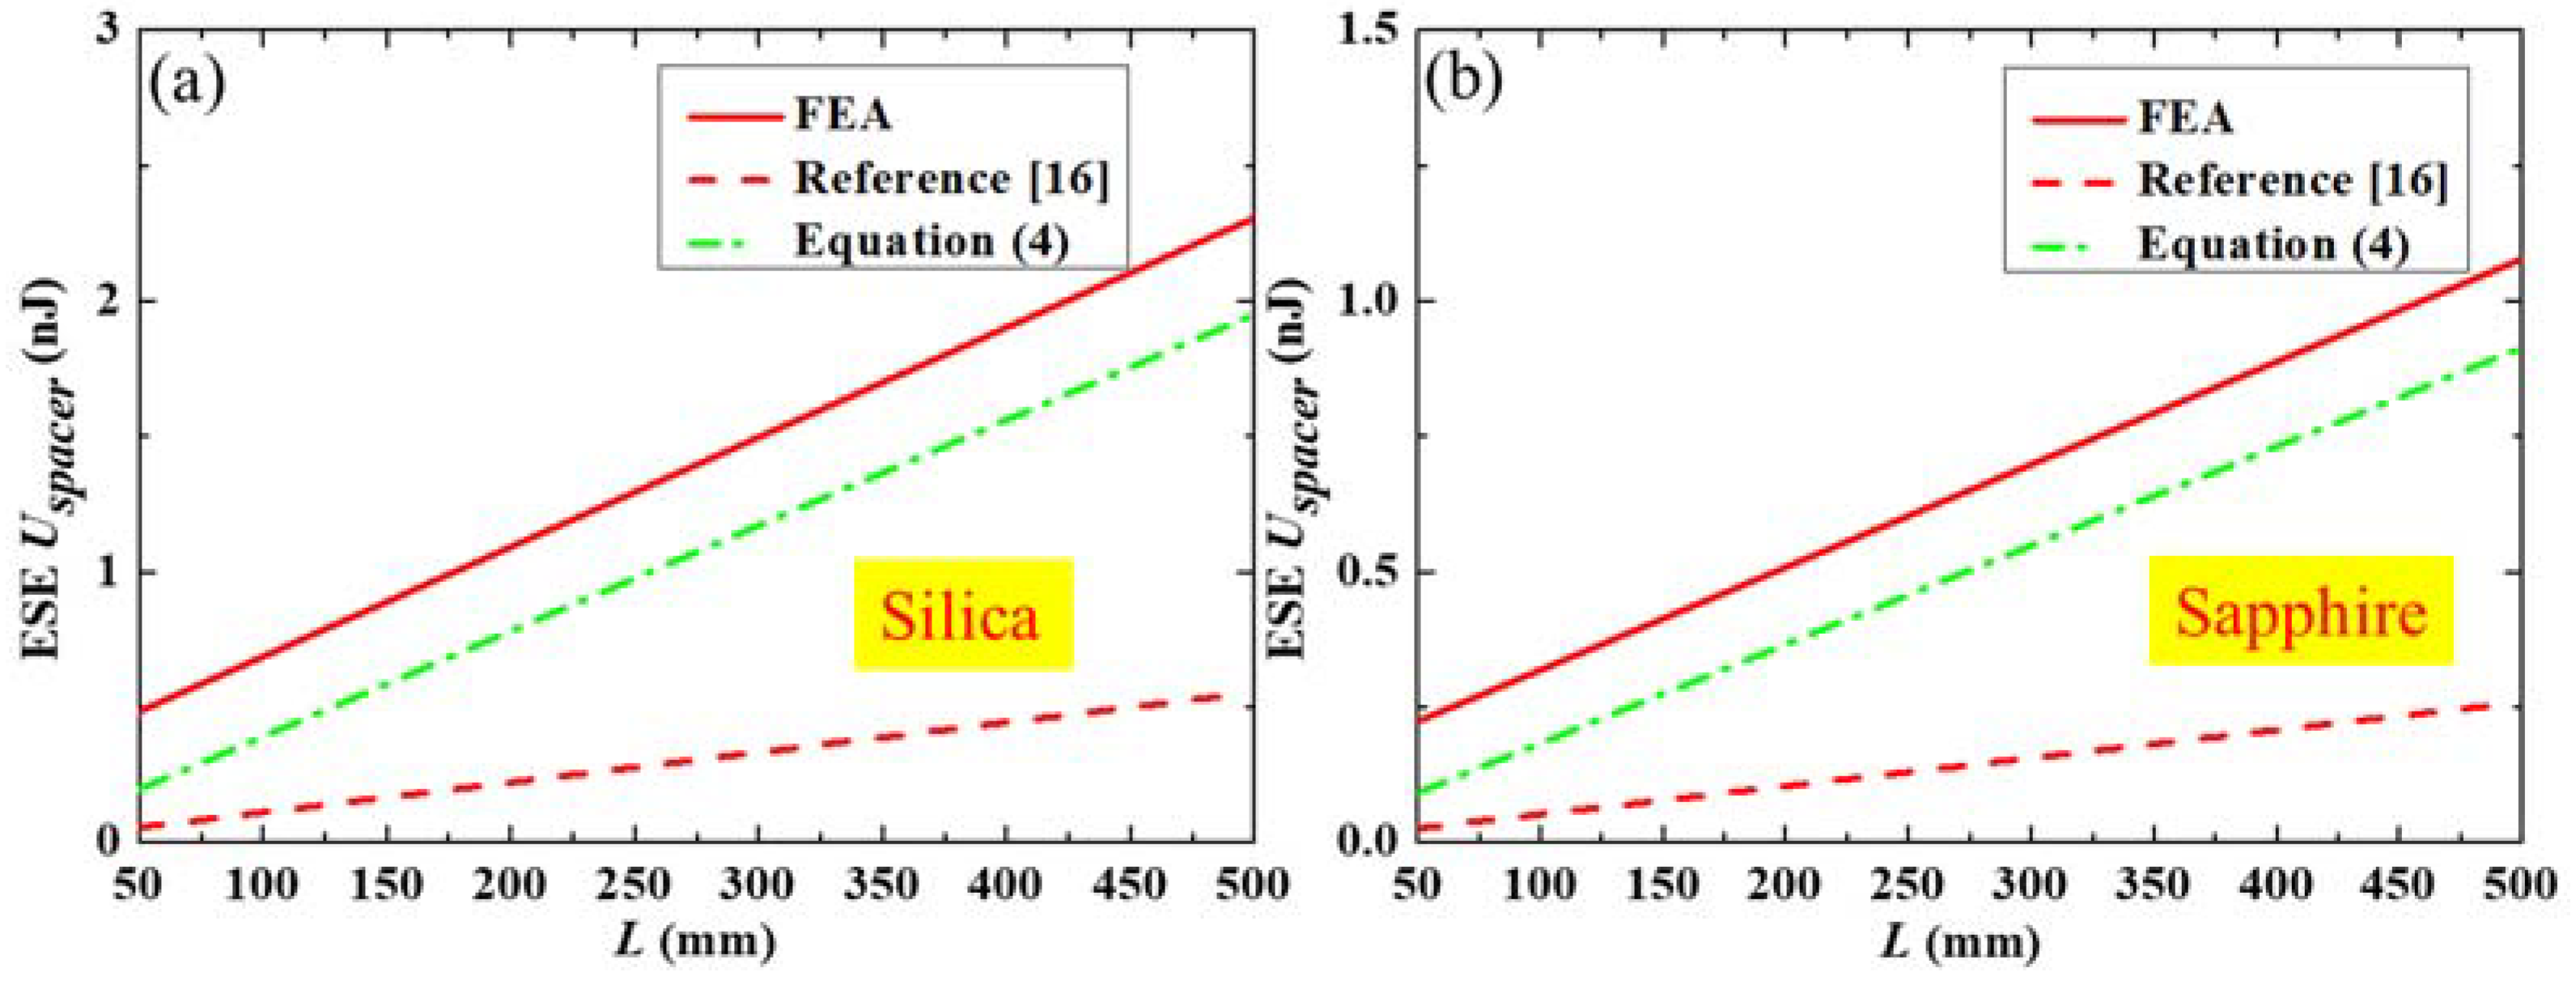
3.2. Influence of USC Geometric and Materials on ESE

To better investigate the difference between FEA and analytical estimate, we studied the TN in spacers under different conditions, such as the length and materials of spacers.

3.2.1. Room-Temperature Materials

For a room-temperature material USC shown in Figure 4, as the length L of the USC increases, the ESE calculated by FEA, Equation (4) in this work, and Equation (2) in ref. [16] just gets bigger. As shown in Figure 4, for the 2 spacers with a length L of 300 mm, the FEA results are approximately 1.3 times larger than that of Equation (4) and 5 times larger than that of Equation (2) in ref. [16], respectively. For the ULE and zerodur spacers, the ESE divergences between the simulation and Equation (4) are near-constant deviations with approximately 0.8 nJ and 0.7 nJ, respectively. However, gaps between the FEA simulation and estimation by Equation (2) in ref. [16] widen with the increase in length L. Taking the two spacers with a length L of 500 mm as an example, the gaps of ESE between Equation (2) in ref. [16] and FEA are roughly 5 nJ and 3.6 nJ, respectively. Compared with the results calculated by Equation (2) in ref. [16], the estimation by Equation (4) in this work is more fit with the simulation results.

3.2.2. Low-Temperature Materials

For the silica and sapphire USCs shown in Figure 5, the ESE estimated by Equation (4) is closer to the FEA results than that calculated by Equation (2) from ref. [16], which is similar to ULE and zerodur. For the two spacers with a length L of 500 mm, the FEA results are roughly 1.2 times larger than that of Equation (4) and 4 times larger than that of Equation (2) in ref. [16]. When the length L of the spacer increases, for the low-temperature materials USCs, the divergence of the ESE between simulation and Equation (2) tends to be approximately 0.25 nJ and 0.12 nJ, respectively. The gap is similar to USCs made of room-temperature materials.

4. Effect of Support Pads on TN

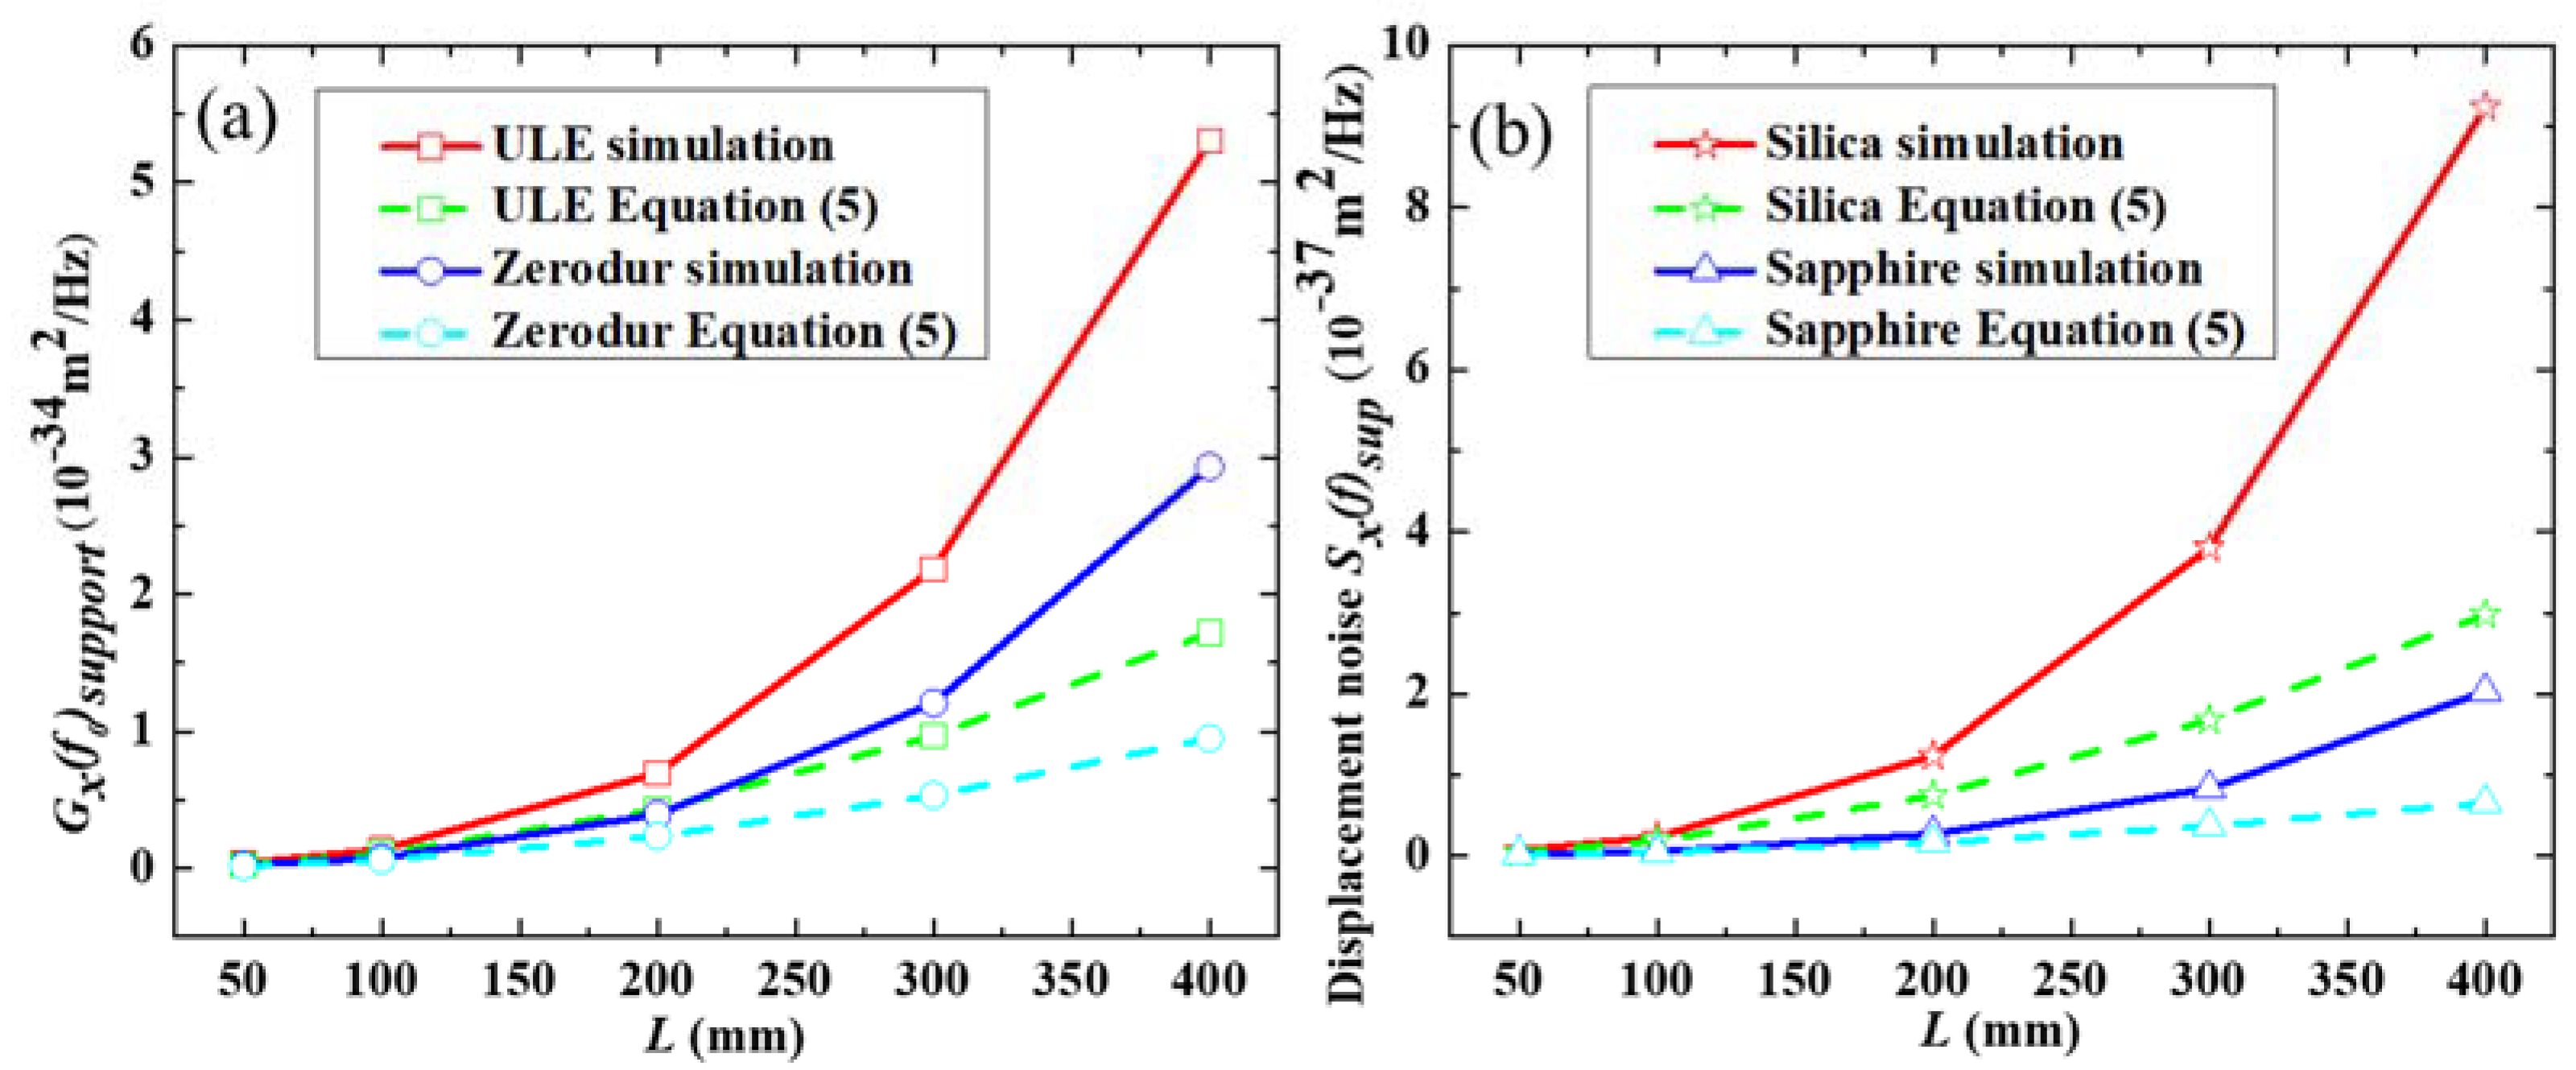
4.1. Comparison between Simulation and Estimation

To verify Equation (5), the TN of the support pads under various parameters is calculated and simulated, including materials and USC lengths L. The thickness and diameter of the two mirrors are 6.3 mm and 25.4 mm, respectively. The support pad material is Viton rubber. The geometric dimensions and the material properties are based on Table 1 and Table 2, respectively. The position of the four support pads is arranged according to the “Airy point” estimated in ref. [31].
As shown in Figure 6, Equation (5) can estimate the TN of the support pads with the USC length L. With the increase in the length L, the gap between the TN of the support pad estimated by Equation (5) and that of the simulation also increases. For different USC materials, this gap is discrepant, and the primary reason may be that the mechanical properties of USC materials are different. For room-temperature materials, when the USC length is 400 mm, the simulation result is about three times the estimate. For low-temperature materials, the result of the all-silica USC simulation is roughly three times the estimate, while for the sapphire USC, this is approximately four times. For cylindrical USCs with a length L less than 100 mm, the TN of the support pads estimated by Equation (5) is basically consistent with the simulation.

4.2. Contribution Ratio of Components to TN

4.2.1. Room-Temperature Materials

Figure 7 shows the contribution ratio of the four parts of the room-temperature cylindrical USC to the total TN including the spacer, the two mirror substrates, the coating, and the four support pads. The coating material is GaAs/AlGaAs with a thickness of 6.83 μm. The support pad is Viton.
As shown in Figure 7a, for all-ULE USCs, the main contribution of TN comes from the two mirror substrates. With the increase in the USC length L, the TN contribution of the two mirror substrates decreases. For instance, compared with the length of 50 mm, the TN contribution of the mirror substrates of the length of 400 mm USC decreases by about 20%. The TN contribution of the mirror coating is the smallest, and its TN contribution remains unchanged with the increase in the USC length and can be ignored. The TN contributions of the four support pads and the spacer increase with the increase in the USC length. For example, compared with the USC length of 50 mm, the TN contributions of the support pads and spacer of the USC length of 400 mm increase by approximately 10%.
According to Figure 7b, for the USC with ULE spacer and FS mirror substrates, with the increase in USC length L, the contribution of the support pads to TN increases. However, for the mirror substrates and coating, it decreases. When the USC length is 400 mm, the TN contributions of the spacer and the four support pads are roughly 40%. The interesting phenomenon is that when the USC length increases, the contribution of the spacer to the total TN increases first and then decreases. When the USC length L is approximately 200 mm, it reaches the maximum, about 45%.
As shown in Figure 7c, for the all-zerodur USC, the main contribution of TN comes from the mirror substrates, which is similar to the all-ULE USC. With the increase in the USC length L, the contribution of the TN of the spacer gradually increases, and the contribution of the mirror substrates gradually decreases, while the contributions of the coating and the support pads are unchanged, close to zero, which can be ignored. When the USC length increases to about 400 mm, the two mirror substrates are still the main contributor to the TN, with a value of approximately 80%, and the contribution of the spacer is about 20%.
According to Figure 7, the contribution of the four support pads to the total TN cannot be ignored in some cases, even the main factor, which is mainly reflected in the relatively long cylindrical USC. For instance, when a 400 mm ULE spacer and FS mirror substrate are used, the contribution of the four support pads has risen to the primary position.

4.2.2. Low-Temperature Materials

The contributions of the four parts of the low-temperature cylindrical USC to the total TN are shown in Figure 8. The relevant parameters are identical to those of the room-temperature USC.
As shown in Figure 8a, for the all-silica USC, with the increase in USC length L, the contribution of TN of the support pads gradually increases, whereas the contributions of mirror substrates and coating decrease, and the spacer’s contribution remains unchanged, which is almost negligible. When the USC length L is 50 mm, the main contribution is the coating, accounting for about 80%, and the contributions of the support pads and the spacer is close to zero. When the USC length L is 400 mm, the main contribution is the four support pads, accounting for approximately 70%.
According to Figure 8b, for the all-sapphire USC, as the USC length L increases, the TN contribution of the four support pads increases, and the TN contribution of the coating decreases, which is similar to the all-silica USC. The TN contributions of the mirror substrates and spacer are close to zero, which is almost negligible. When the USC length L is 50 mm, the main contribution is the coating, accounting for about 100%. When the USC length L is 400 mm, its contribution value decreases to approximately 40%, and the main contribution becomes the four support pads, accounting for roughly 60%.
For a low-temperature cylindrical USC, under some conditions, the contribution of the four support pads to the TN of the USC cannot be ignored, which needs to be taken into consideration.

5. Conclusions

This work uses theoretical estimation and FEA simulation to study the TN of cylindrical USCs with the four support pads in detail. According to the FDT theory, an estimation formula of the TN of the spacer is derived. The calculation results of the estimation formula are qualitatively consistent with the simulation results. In comparison with the previous estimation, this estimation formula is well suited for the TN estimations of cylindrical USCs. We provide the reasons for the results gap between the theoretical estimation and simulation.
The support pads must be used for cylindrical USCs. The effect of the support pads on the TN of cylindrical USCs is investigated in detail. In previous relevant studies, this impact on TN has not been considered in detail. This study is the first investigation of the support pads influenced by FEA simulations.
For a 400 mm length ULE cylindrical USC with FS substrates, the Gx(f0) of the four support pads is approximately four times that of the substrates and the GaAs/AlGaAs crystalline coating. The simulation results show that the four support pads are the major TN contributors under certain materials and dimensions of USCs. In the future, when studying TN in other USCs with different geometric shapes, the support pads should be a consideration, especially the transportable USCs [37]. The results in this work provide guidance on design and minimizing TN for long cylindrical USCs.

Author Contributions

Conceptualization, G.X.; methodology, D.J.; software, D.J.; validation, G.X.; investigation, D.J.; data curation, L.Z.; writing—original draft preparation, D.J.; writing—review and editing, G.X.; visualization, J.G. and Y.L.; supervision, T.L.; project administration, R.D. and S.Z. All authors have read and agreed to the published version of the manuscript.

Funding

This work received funding from the Youth Innovation Promotion Association of the Chinese Academy of Sciences (Grant No. 1188000XGJ), the Chinese National Natural Science Foundation (Grant No. 12103059), and the Xi’an Science and Technology Bureau (No. E019XK1S04).

Data Availability Statement

The data presented in this study are available on request from the corresponding authors.

Acknowledgments

We would like to acknowledge Xianjie Zhang of Northwestern Polytechnical University and Fuyu Sun of the National Time Service Center for their contributions to the strain energy theory of USCs.

Conflicts of Interest

The authors declare no conflict of interest.

References

  1. Millo, J.; Magalhães, D.V.; Mandache, C.; Le Coq, Y.; English, E.M.L.; Westergaard, P.G.; Lodewyck, J.; Bize, S.; Lemonde, P.; Santarelli, G. Ultrastable lasers based on vibration insensitive cavities. Phys. Rev. A 2009, 79, 053829. [Google Scholar] [CrossRef] [Green Version]
  2. Chen, L.; Hall, J.L.; Ye, J.; Yang, T.; Zang, E.; Li, T. Vibration-induced elastic deformation of Fabry-Perot cavities. Phys. Rev. A 2006, 74, 053801. [Google Scholar] [CrossRef] [Green Version]
  3. Katori, H. Optical lattice clocks and quantum metrology. Nat. Photon. 2011, 5, 203–210. [Google Scholar] [CrossRef]
  4. Swallows, M.D.; Bishof, M.; Lin, Y.; Blatt, S.; Martin, M.J.; Rey, A.M.; Ye, J. Suppression of Collisional Shifts in a Strongly Interacting Lattice Clock. Science 2011, 331, 1043–1046. [Google Scholar] [CrossRef] [PubMed] [Green Version]
  5. Huntemann, N.; Okhapkin, M.; Lipphardt, B.; Weyers, S.; Tamm, C.; Peik, E. High-accuracy optical clock based on the octupole transition in 171Yb+. Phys. Rev. Lett. 2012, 108, 090801. [Google Scholar] [CrossRef] [PubMed] [Green Version]
  6. Sherman, J.A.; Lemke, N.D.; Hinkley, N.; Pizzocaro, M.; Fox, R.W.; Ludlow, A.D.; Oates, C.W. High-Accuracy Measurement of Atomic Polarizability in an Optical Lattice Clock. Phys. Rev. Lett. 2012, 108, 153002. [Google Scholar] [CrossRef] [PubMed] [Green Version]
  7. McFerran, J.J.; Yi, L.; Mejri, S.; Di Manno, S.; Zhang, W.; Guéna, J.; Le Coq, Y.; Bize, S. Neutral atom frequency reference in the deep ultraviolet with fractional uncertainty = 5.7 × 10⁻¹⁵. Phys. Rev. Lett. 2012, 108, 183004. [Google Scholar] [CrossRef] [Green Version]
  8. Herrmann, S.; Senger, A.; Nagel, K.; Mohle, M.; Kovalchuk, E.; Peters, A. Rotating optical reference cavity experiment testing Lorentz invariance at the 10−17 level. Phys. Rev. D 2009, 80, 105011. [Google Scholar] [CrossRef] [Green Version]
  9. Kennedy, C.J.; Oelker, E.; Robinson, J.M.; Bothwell, T.; Kedar, D.; Milner, W.R.; Marti, G.E.; Derevianko, A.; Ye, J. Precision Metrology Meets Cosmology: Improved Constraints on Ultralight Dark Matter from Atom-Cavity Frequency Comparisons. Phys. Rev. Lett. 2020, 125, 201302. [Google Scholar] [CrossRef]
  10. Chou, C.W.; Hume, D.B.; Rosenband, T.; Wineland, D.J. Optical Clocks and Relativity. Science 2010, 329, 1630–1633. [Google Scholar] [CrossRef]
  11. Jiang, H.; Kéfélian, F.; Crane, S.; Lopez, O.; Lours, M.; Millo, J.; Holleville, D.; Lemonde, P.; Chardonnet, C.; AmyKlein, A.; et al. Long-distance frequency transfer over an urban fiber link using optical phase stabilization. J. Opt. Soc. Am. B 2008, 25, 2029–2035. [Google Scholar] [CrossRef] [Green Version]
  12. Predehl, K.; Grosche, G.; Raupach, S.M.F.; Droste, S.; Terra, O.; Alnis, J.; Legero, T.; Hänsch, T.W.; Udem, T.; Holzwarth, R.; et al. A 920-Kilometer Optical Fiber Link for Frequency Metrology at the 19th Decimal Place. Science 2012, 336, 441–444. [Google Scholar] [CrossRef] [PubMed]
  13. Barger, R.L.; Sorem, M.; Hall, J. Frequency stabilization of a cw dye laser. Appl. Phys. Lett. 1973, 22, 573–575. [Google Scholar] [CrossRef] [Green Version]
  14. Jiang, Y.Y.; Ludlow, A.D.; Lemke, N.D.; Fox, R.W.; Sherman, J.A.; Ma, L.S.; Oates, C.W. Making optical atomic clocks more stable with 10−16 level laser stabilization. Nat. Photon. 2011, 5, 158–161. [Google Scholar] [CrossRef] [Green Version]
  15. Levin, Y. Internal thermal noise in the LIGO test masses: A direct approach. Phys. Rev. D 1998, 57, 659–663. [Google Scholar] [CrossRef] [Green Version]
  16. Numata, K.; Kemery, A.; Camp, J. Thermal-Noise Limit in the Frequency Stabilization of Lasers with Rigid Cavities. Phys. Rev. Lett. 2004, 93, 250602. [Google Scholar] [CrossRef]
  17. Kessler, T.; Legero, T.; Sterr, U. Thermal noise in optical cavities revisited. J. Opt. Soc. Am. B 2011, 29, 178–184. [Google Scholar] [CrossRef] [Green Version]
  18. Legero, T.; Kessler, T.; Sterr, U. Tuning the thermal expansion properties of optical reference cavities with fused silica mirrors. J. Opt. Soc. Am. B 2010, 27, 914–919. [Google Scholar] [CrossRef] [Green Version]
  19. Cole, G.; Zhang, W.; Martin, M.; Ye, J.; Aspelmeyer, M. Tenfold reduction of Brownian noise in high-reflectivity optical coatings. Nat. Photon. 2013, 7, 644–650. [Google Scholar] [CrossRef]
  20. Brückner, F.; Friedrich, D.; Clausnitzer, T.; Britzger, M.; Burmeister, O.; Danzmann, K.; Burmeister, O.; Danzmann, K.; Kley, E.B.; Tunnermann, A.; et al. Realization of amonolithic high-reflectivity cavity mirror from a single silicon crystal. Phys. Rev. Lett. 2010, 104, 163903. [Google Scholar] [CrossRef]
  21. Xu, G.; Zhang, L.; Liu, J.; Gao, J.; Chen, L.; Dong, R.; Liu, T.; Zhang, S. Estimation of thermal noise for spindle optical reference cavities. Opt. Commun. 2016, 360, 61–67. [Google Scholar] [CrossRef]
  22. Robinson, J.M.; Oelker, E.; Milner, W.R.; Kedar, D.; Zhang, W.; Legero, T.; Matei, D.G.; Hafner, S.; Riehle, F.; Sterr, U.; et al. Thermal noise and mechanical loss of SiO2/Ta2O5 optical coatings at cryogenic temperatures. Opt. Lett. 2021, 46, 592–595. [Google Scholar] [CrossRef] [PubMed]
  23. Xu, G.; Jiao, D.; Chen, L.; Zhang, L.; Dong, R.; Liu, T.; Wang, J. Thermal Noise in Cubic Optical Cavities. Photonics 2021, 8, 261. [Google Scholar] [CrossRef]
  24. Matei, D.G.; Legero, T.; Häfner, S.; Grebing, C.; Weyrich, R.; Zhang, W.; Sonderhouse, L.; Robinson, J.M.; Ye, J.; Riehle, F.; et al. 1.5 μm Lasers with Sub-10 mHz Linewidth. Phys. Rev. Lett. 2017, 118, 263202. [Google Scholar] [CrossRef] [PubMed] [Green Version]
  25. Robinson, J.M.; Oelker, E.; Milner, W.R.; Zhang, W.; Legero, T.; Matei, D.G.; Riehle, F.; Sterr, U.; Ye, J. Crystalline optical reference cavity at 4 K with thermal-noise-limited instability and ultralow drift. Optica 2019, 6, 240–243. [Google Scholar] [CrossRef] [Green Version]
  26. Sebastian, H.; Stephan, F.; Christian, G.; Stefan, V.; Thomas, L.; Mikko, M.; Christian, L.; Uwe, S. 8 × 10⁻¹⁷ fractional laser frequency instability with a long room-temperature cavity. Opt. Lett. 2015, 40, 2112–2115. [Google Scholar]
  27. Zhadnov, N.O.; Kudeyarov, K.S.; Kryuchkov, D.S.; Semerikov, I.Y.A.; Khabarova, K.Y.; Kolachevsky, N.N. On the thermal noise limit of highly stable optical resonators. Quantum Electron. 2018, 48, 425–430. [Google Scholar] [CrossRef]
  28. Zhadnov, N.O.; Kudeyarov, K.S.; Kryuchkov, D.S.; Vishnyakova, G.A.; Khabarova, K.Y.; Kolachevsky, N.N. 48-cm long room-temperature cavities in vertical and horizontal orientations for Sr optical clock. Appl. Opt. 2021, 60, 9151–9159. [Google Scholar] [CrossRef]
  29. Allan, D.W. Statistics of atomic frequency standards. Proc. IEEE 1966, 54, 221. [Google Scholar] [CrossRef] [Green Version]
  30. Nazarova, T.; Riehle, F.; Sterr, U. Vibration-insensitive reference cavity for an ultra-narrow-linewidth laser. Appl. Phys. A 2006, 83, 531–536. [Google Scholar] [CrossRef]
  31. Webster, S.A.; Oxborrow, M.; Gill, P. Vibration insensitive optical reference cavity. Phys. Rev. A 2007, 75, 011801. [Google Scholar] [CrossRef]
  32. Xu, G.; Jiao, D.; Chen, L.; Zhang, L.; Dong, R.; Liu, T.; Wang, J. Vibration modes of a transportable optical reference cavity. Optics Express 2021, 29, 24264–24277. [Google Scholar] [CrossRef] [PubMed]
  33. Phelps, F.M. Airy Points of a Meter Bar. Am. J. Phys. 1966, 34, 419–422. [Google Scholar] [CrossRef]
  34. Hoffman, D.M. Dynamic mechanical signatures of Viton A and plastic bonded explosives based on this polymer. Polym. Eng. Sci. 2003, 43, 139–156. [Google Scholar] [CrossRef]
  35. Cerdonio, M.; Conti, L.; Heidmann, A.; Pinard, M. Thermoelastic effects at low temperatures and quantum limits in displacement measurements. Phys. Rev. D 2001, 63, 082003. [Google Scholar] [CrossRef] [Green Version]
  36. Giaime, J.; Saha, P.; Shoemaker, D.; Sievers, L. A passive vibration isolation stack for LIGO: Design, modeling, and testing. Rev. Sci. Instrum. 1996, 67, 208–214. [Google Scholar] [CrossRef] [Green Version]
  37. Herbers, S.; Häfner, S.; Dörscher, S.; Lücke, T.; Sterr, U.; Lisdat, C. Transportable clock laser system with an instability of 1.6 × 10⁻¹⁶. Opt. Lett. 2022, 47, 5441–5444. [Google Scholar] [CrossRef]
Figure 1. Geometrical model of the cylindrical USC supported by four elastic support pads. (a) Front view. (b) Side view.
Crystals 12 01682 g001
Figure 2. Schematic diagram of the Gaussian laser beam acting on the two mirrors of the USC.
Crystals 12 01682 g002
Figure 3. Plot of the ESEDEN of the USC, in which the ESEDEN denotes the ESE density. The logarithms of ESEDEN and the color coding are corresponding. The USC length L is 80 mm. For the demonstration, the deformation amplified by a factor of 1 × 10⁶ has been adopted.
Crystals 12 01682 g003
Figure 4. ESE as a function of the length L of the spacer made of room-temperature materials. The solid red line represents the simulation results. The red dashed line denotes the analysis estimates based on Equation (2) in ref. [16]. The green dash-dot line denotes the analysis estimates based on Equation (4). (a) All-ULE USC. (b) All-zerodur USC.
Crystals 12 01682 g004
Figure 5. ESE as a function of the length L of the spacer made of low-temperature materials. The solid red line presents the simulation results. The red dashed line denotes the analysis estimates based on Equation (2) in ref. [16]. The green dash–dot line denotes the analysis estimates based on Equation (4). (a) All-silica USC. (b) All-sapphire USC.
Crystals 12 01682 g005
Figure 6. TN of the four support pads as functions of the spacer length L. The red solid line with squares and the green dashed line with squares denote the FEA simulation results and the estimated results of the all-ULE USC, respectively. The blue solid line with circles and the light blue dashed line with circles denote the FEA simulation results and the estimated results of the all-zerodur USC, respectively. The red solid line with stars and the green dashed line with stars denote the FEA simulation results and the estimated results of the all-silica USC, respectively. The blue solid line with triangles and the light blue dashed line with triangles denote the FEA simulation results and the estimated results of the all-sapphire USC, respectively. (a) Room-temperature materials. (b) Low-temperature materials.
Crystals 12 01682 g006
Figure 7. Percentage of contributions to the TN of the optical length Gx(f0) as functions of the length L. The coating is GaAs/AlGaAs crystalline with the thickness dcoa = 6.83 μm cited from ref. [19]. The solid red line with circles denotes the spacer results. The dashed green line with squares denotes the substrate results. The dot blue line with triangles denotes the coating results. The dash–dot cyan line with stars denotes the four support pads’ results. (a) All-ULE USC. (b) ULE spacer and FS substrates. (c) All-zerodur USC.
Crystals 12 01682 g007
Figure 8. Percentage of contributions to the TN of the optical length Gx(f0) as functions of the length L. The coating is GaAs/AlGaAs crystalline with the thickness dcoa = 6.83 μm cited from ref. [19]. The solid red line with circles denotes the spacer results. The dashed green line with squares denotes the substrate results. The dot blue line with triangles denotes the coating results. The dash–dot cyan line with stars denotes the four support pads’ results. (a) All-silica USC. (b) All-sapphire USC.
Crystals 12 01682 g008
Table 1. Parameters used in the calculation estimation and FEA simulation.
Parameters (mm)Rrrsupwchcdsup
Value16427100.5
Table 2. Material properties used for the estimation and simulation.
Material PropertiesULE [1]Fused Silica [18]Silica <111> [25]Zerodur [19]Sapphire [35]GaAs/Al GaAs [19]Viton [34,36]
Elastic modulus (GPa)67.673187.5914001008 × 10−4
Poisson ratio0.170.160.230.240.290.320.27
Loss angle1.67 × 10−510−610−73 × 10−43 × 10−92.5 × 10−50.33
Publisher’s Note: MDPI stays neutral with regard to jurisdictional claims in published maps and institutional affiliations.

