Article

Mix-and-Match Diols: Adjusting Self-Assembly of Micellar Phases in Choline Chloride Eutectics

by
Oliver S. Hammond
1,2,*,†,
Adrian Sanchez-Fernandez
2,‡,
Rachel Tyte
2,
Robert Dalgliesh
3,
Andrew J. Smith
4 and
Karen J. Edler
1,2,§
1
Centre for Sustainable Chemical Technologies, University of Bath, Claverton Down, Bath BA2 7AY, UK
2
Department of Chemistry, University of Bath, Claverton Down, Bath BA2 7AY, UK
3
ISIS Neutron and Muon Source, Science and Technology Facilities Council, Rutherford Appleton Laboratory, Harwell, Oxford OX11 0QX, UK
4
Diamond Light Source, Science and Technology Facilities Council, Rutherford Appleton Laboratory, Harwell, Oxford OX11 0DE, UK
*
Author to whom correspondence should be addressed.
Current address: Department of Materials and Environmental Chemistry, Stockholm University, 114 18 Stockholm, Sweden.
Current address: Biological Chemistry and Molecular Materials Research Center, Universidade de Santiago de Compostela, 15782 Santiago de Compostela, Spain.
§
Current address: Centre for Analysis and Synthesis, Lund University, 223 62 Lund, Sweden.
Crystals 2022, 12(11), 1621; https://doi.org/10.3390/cryst12111621
Submission received: 24 October 2022 / Revised: 8 November 2022 / Accepted: 10 November 2022 / Published: 12 November 2022
(This article belongs to the Special Issue Disclosing Deep Eutectic Solvents)

Abstract

:
The common Deep Eutectic Solvent (DES) ‘ethaline’ (1:2 choline chloride:ethylene glycol) was examined here as a basis for the self-assembly of the surfactant dodecyltrimethylammonium bromide (C12TAB). A phase diagram was constructed, showing evidence for a L1 (micellar) phase, confirmed by tensiometry to have a room temperature critical micelle concentration (CMC) of 1.2 wt.%. Small angle neutron scattering (SANS) measurements indicate formation of interacting globular micelles with slightly smaller apparent radii than in water. The apparent mesophase/multiphase region was studied using SWAXS, demonstrating rich mesoscopic lyotropic liquid crystalline phase behaviour, with evidence for lamellar Lα peaks, alongside potential co-crystalline phases. We attempted to tailor the self-assembly by studying binary DES containing longer diols including 1,2-propanediol, 1,3-propanediol, 1,4-butanediol, and 1,5-pentanediol, and ternary DES where the HBD component was a 1:1 ethylene glycol:diol mixture. However, synchrotron SAXS showed that only ternary ‘propethaline’ mixtures displayed signs of self-assembly and micellization, perhaps due to the reduction in calculated Gordon parameter, which decreases linearly with increasing alkyl chain length. Systematic differences were thus observed in the ability of the solvents to modulate assembly, from globular micelles in ChCl:EG, to weaker assembly in long-tail DES, and complete solubilisation in butaline and pentaline.

1. Introduction

First described in 2001 [1] as an extension of Ionic Liquids (ILs) [2], and of well-established eutectic mixtures [3], ‘Deep Eutectic Solvents’ (DES) are considered as a distinct class of solvents where the melting point depression of the mixture exceeds that observed for the ideal mixture [4]. While DES are not necessarily ionic [5], DES based on choline chloride (ChCl)-based mixtures have a set of properties reminiscent of IL ‘character’, with high ionic strength and non-ideality [6]. Accordingly, ChCl-DES have been particularly popular in a huge quantity of applications [7], most prominently electrochemistry [8,9,10], but also in synthesis, be it organic [11], inorganic [12], or of nanostructured materials [13]. In part, DES are attractive due to the potential to ‘design the solvent’, optimising properties to yield systems which are task-specific [14], although unlocking this requires further developments in fundamental understanding [15].
While the basic properties of DES are now well-reviewed, an increasing number of studies are deploying advanced analytical techniques, and allowing the field to evolve [7,13,15,16,17,18,19]. Building upon initial ideas, DES are now considered as H-bonded ‘soups’, driven by increased understanding of structure, using techniques such as neutron diffraction and molecular simulation. In-depth studies repeatedly show that there may be some strong HBD-anion association [20], but also there is naturally a major component of disorder [21], with a broad set of intermolecular configurations representing states with similar energies [22]. Similarly, the thermodynamic understanding of DES has been refined, clarifying understanding around the ‘deep’ eutectic depression [23,24,25]; even the idea of the idealised mixing ratios, and the accepted status of some systems as ‘deep’ eutectics [26], has come into question [27].
DES have been recently shown to be capable as hosts for the self-assembly of small-molecule amphiphiles [16]. In particular, the prototypical DES of ChCl:urea (xurea = 0.67) was first shown to support self-assembly of anionic surfactants, but the DES showed only sparing solubility of cationics, and insolubility of nonionics [28]. Later, SDS was shown to have a much lower CMC in ChCl:urea (2 mM), fourfold less than that seen in water. The observed reduction in the CMC could not be associated with the cohesive energy density of the solvent, defined by the Gordon Parameter and π* solvent polarizability parameter [29]. Instead, the highly ionic character of the solvent was hypothesised to be the origin of the CMC reduction. SANS was used to demonstrate an unusual elongated cylindrical morphology for SDS in ChCl:urea, with elongation depending on surfactant concentration, and effectively defined by headgroup area, which is dictated by the availability of choline counterions to shield the sulfate headgroups [30]; altering the surfactant counterion yielded small changes in size despite the high solvent salt content [31]. Cationic (alkyltrimethylammonium bromide) surfactants were found to be soluble and readily self-assemble in ChCl:glycerol [32], with similar CMCs, but in a slightly more elongated prolate ellipsoid geometry than observed in water [33]. The same alkyltrimethylammonium surfactants were studied in ChCl:malonic acid, showing slightly higher CMCs than in other studied DES when pure, but which reduced strongly upon addition of water [34]. Interestingly, in this case the DES was found to be more interactive with the micelles through charge screening in the headgroup region of the micelle, and the addition of water reduced the micelle elongation to be more globular. More esoteric surfactants have also been studied, including zwitterionic surfactants, which were shown to self-assemble into globular micelles in ChCl:glycerol [35], and long-chain CnmimCl surfactant ILs in ChCl:glycerol [36]. Other DES compositions have also been explored, including ternary mixtures, such as choline dodecylsulfate in choline glutarate:ChCl:urea mixtures [37]. An in-depth scattering study by Atri et al. showed that the ternary DES composition could be altered, by modifying the ratio of urea and glycerol, to enable solubility of surfactant types that are insoluble in DES containing only one of the HBDs, or alter the micelle morphology [38]. Most recently, unusual lanthanide-containing DES [39] were used for the self-assembly of cationic and nonionic amphiphiles; micelle morphology clearly depends strongly on the identity of both the surfactant and solvent chosen [40]. In addition, the co-assembly of a common cationic surfactant with an oppositely-charged hydrotrope was shown to promote micelle elongation into worm-like micelles [41]. Therefore, the self-assembly of surfactants in DES might be controlled through changes in the surfactant, the constituents and composition of the solvent, as well as the participation of exogenous interacting molecules.
Here, the goal was to establish whether prediction of self-assembly is possible by analysis of the basic physicochemical properties of the DES, and to characterise the structure at different compositions, as the mixtures transition between different phases, thus altering their behaviour. We therefore explored the self-assembly of dodecyltrimethylammonium bromide (C12TAB), a common cationic surfactant, with an eye towards development of solvents as task-specific self-assembly environments. To do this, we began with ChCl:EG as a ‘baseline’ DES, and sought to evolve the DES properties by using binary DES with a variety of longer-chain diols, and ternary DES formulated as ChCl:EG:diol. The chemical structures for all of the components of these eutectic diol-based systems are shown in Figure 1.

2. Materials and Methods

2.1. Materials

Choline chloride (≥99%) and 1,5-pentanediol (98%) were provided by Acros Organics. Ethylene glycol (≥99.9%, anhydrous), 1,2-propanediol (≥99.5%), 1,3-propanediol (98%), 1,4-butanediol (99%) and C12TAB (≥99%) were procured from Sigma-Aldrich. d9-choline chloride ((CD3)3N(CH2)2OHCl, ≥99% chemical purity) and d6-ethylene glycol (98%) were provided by CK Isotopes. d34-C12TAB was provided by the ISIS Deuteration facility. The DES were prepared by mixing the two components in a sealed vial at the selected molar ratio at 70 °C with vigorous mixing, until they were homogenous in appearance. Care was taken to keep samples anhydrous: Prior to use, diols were dried using molecular sieves, and choline chloride was dried in a lyophiliser. Prepared solvents were kept in a desiccator to prevent moisture ingress. Surfactant-containing samples prepared for experiments were equilibrated in an oven and used immediately.

2.2. Solvent Property Measurements

The densities of the prepared solvents were measured using 10 mL pycnometer flasks, with volumes individually calibrated to the density of 18.2 MΩ deionised water at 22 °C. The Du Noüy ring method was then used for the measurement of surface tension [42], using an Attension Sigma 700 force tensiometer and OpenAttension software. A platinum ring of radius 9.85 mm and wire diameter 0.185 mm was flamed between different samples, and used to take measurements of each DES at 22 °C, with the exception of butaline, pentaline and pentethaline, where results were obtained at 70 °C due to their tendency to crystallise, presumably due to differing from the actual eutectic ratio, with evidence now appearing that this value is more glycol-rich than initially described [26]. Each system was measured four times, with the mean reported alongside the standard deviation, as the stated error.

2.3. Critical Micelle Concentration (CMC) Measurements

Surface tension measurements were made using a Krüss DSA100 tensiometer and the pendant drop method [43]. Samples were prepared by serial dilution from stock solutions of C12TAB in ethaline. Measurements were made at room temperature, with each datapoint describing the mean value and standard deviation from 15 separate drop shape analysis measurements for every discrete concentration.

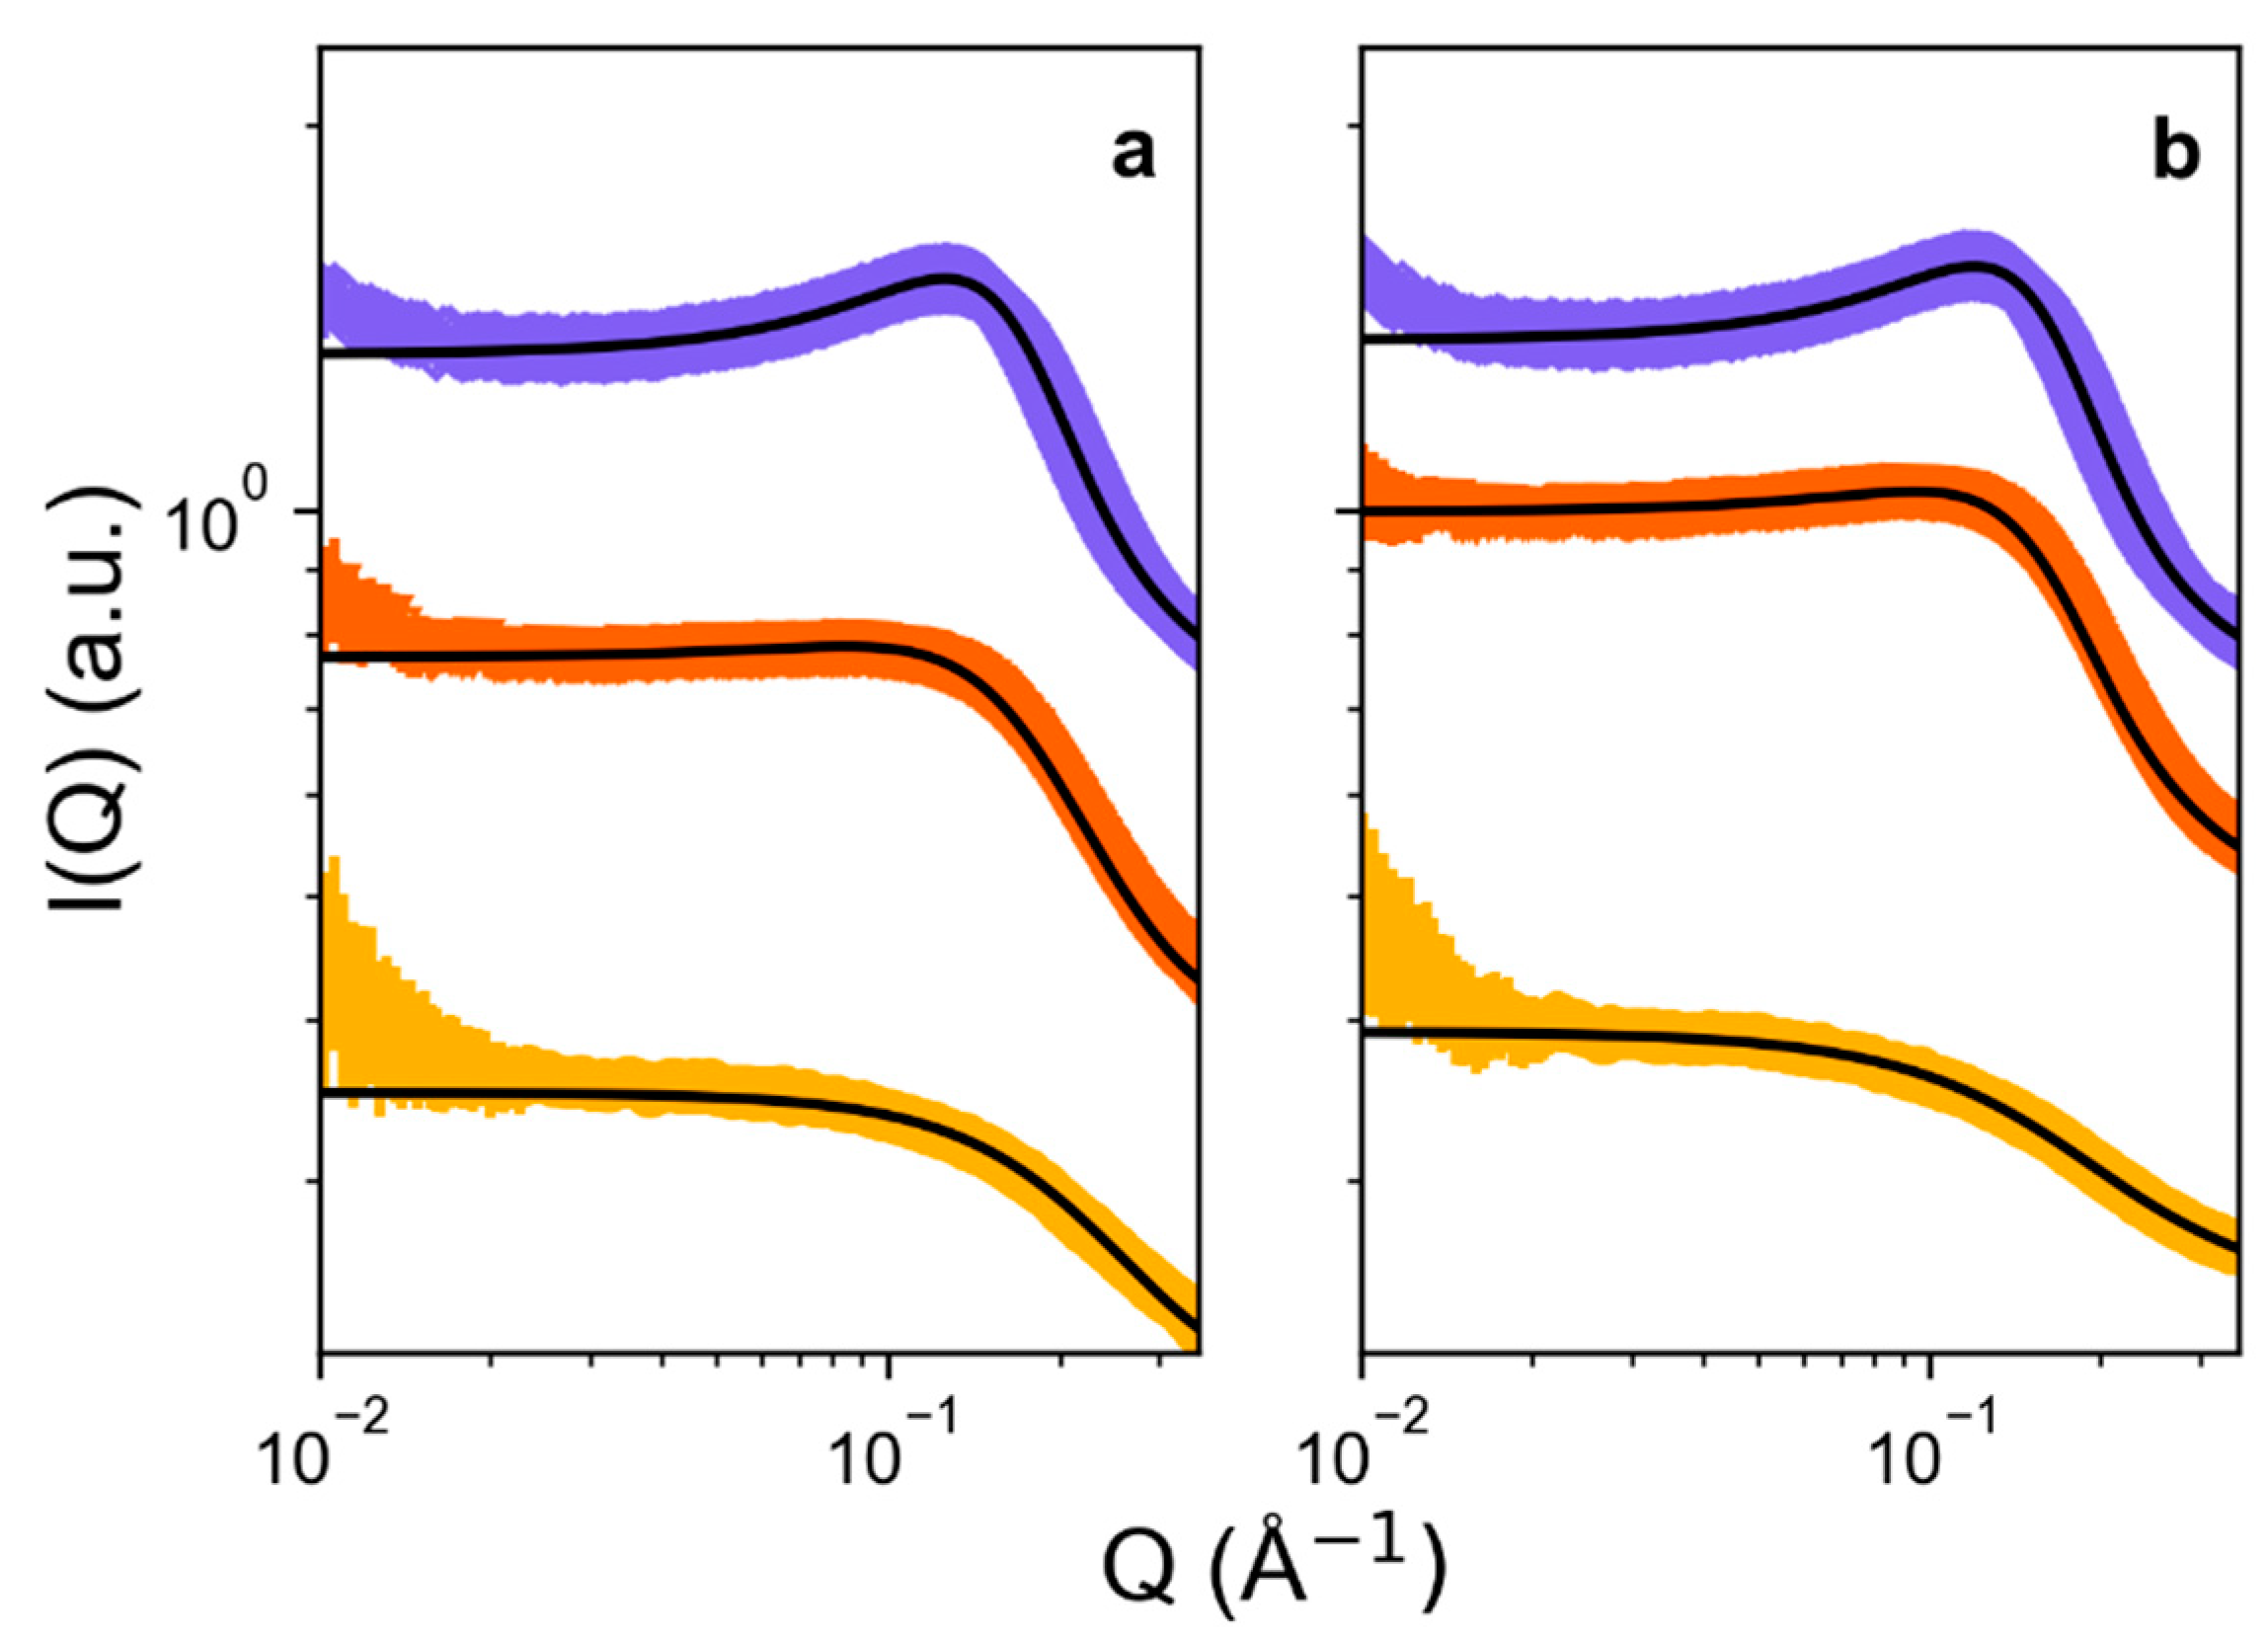
2.4. Micelle Structure Determination

Small-angle neutron scattering (SANS) measurements were performed at STFC ISIS Neutron & Muon Source, under beamtime allocation RB1620126, on the time-of-flight diffractometer Larmor operating in conventional SANS mode, at 50 °C. Data were collected over a range of 0.004 Å−1Q ≤ 0.9 Å−1, using neutrons of wavelength 1.5 nm ≤ λ ≤ 17 nm and a detector distance of 4 m. Samples for SANS were prepared on-site, in a concentration series above the measured CMC of C12TAB in ethaline, 2, 5, 10, and 20 wt.% of C12TAB, in two contrast sets, fully protiated C12TAB in [d9-ChCl][d6-EG]2, and d34-C12TAB in fully protiated ChCl:EG. Data were reduced using the standard protocols of the beamline to procure the scattered intensity in absolute scale, I(Q), vs. the momentum transfer vector, Q.
Synchrotron small-angle X-ray scattering measurements were made on the instrument I22 at Diamond Light Source under beamtime allocation SM15194. Samples were placed into soda-glass capillaries with 10 µm wall thickness and path length of 1.5 mm. Operating at a power of 18 keV, SAXS measurements were taken using a Dectris Pilatus-2M detector over a Q-range of 0.007 Å−1 ≤ Q ≤ 0.6 Å−1. Samples were held at a temperature of 50 °C to prevent crystallisation, using a water-recirculating brass block sample holder. Data were reduced using DAWN software and the standard protocols of the beamline to procure the scattered intensity in arbitrary scale, I(Q), vs. the momentum transfer vector, Q [44]. Backgrounds, of which the most pertinent source was the Kapton beam window, were subtracted from the measured scattering to obtain reduced data. Scattering length densities (SLDs) were calculated for both X-ray and neutron measurements, and are shown in Tables S1 and S2.

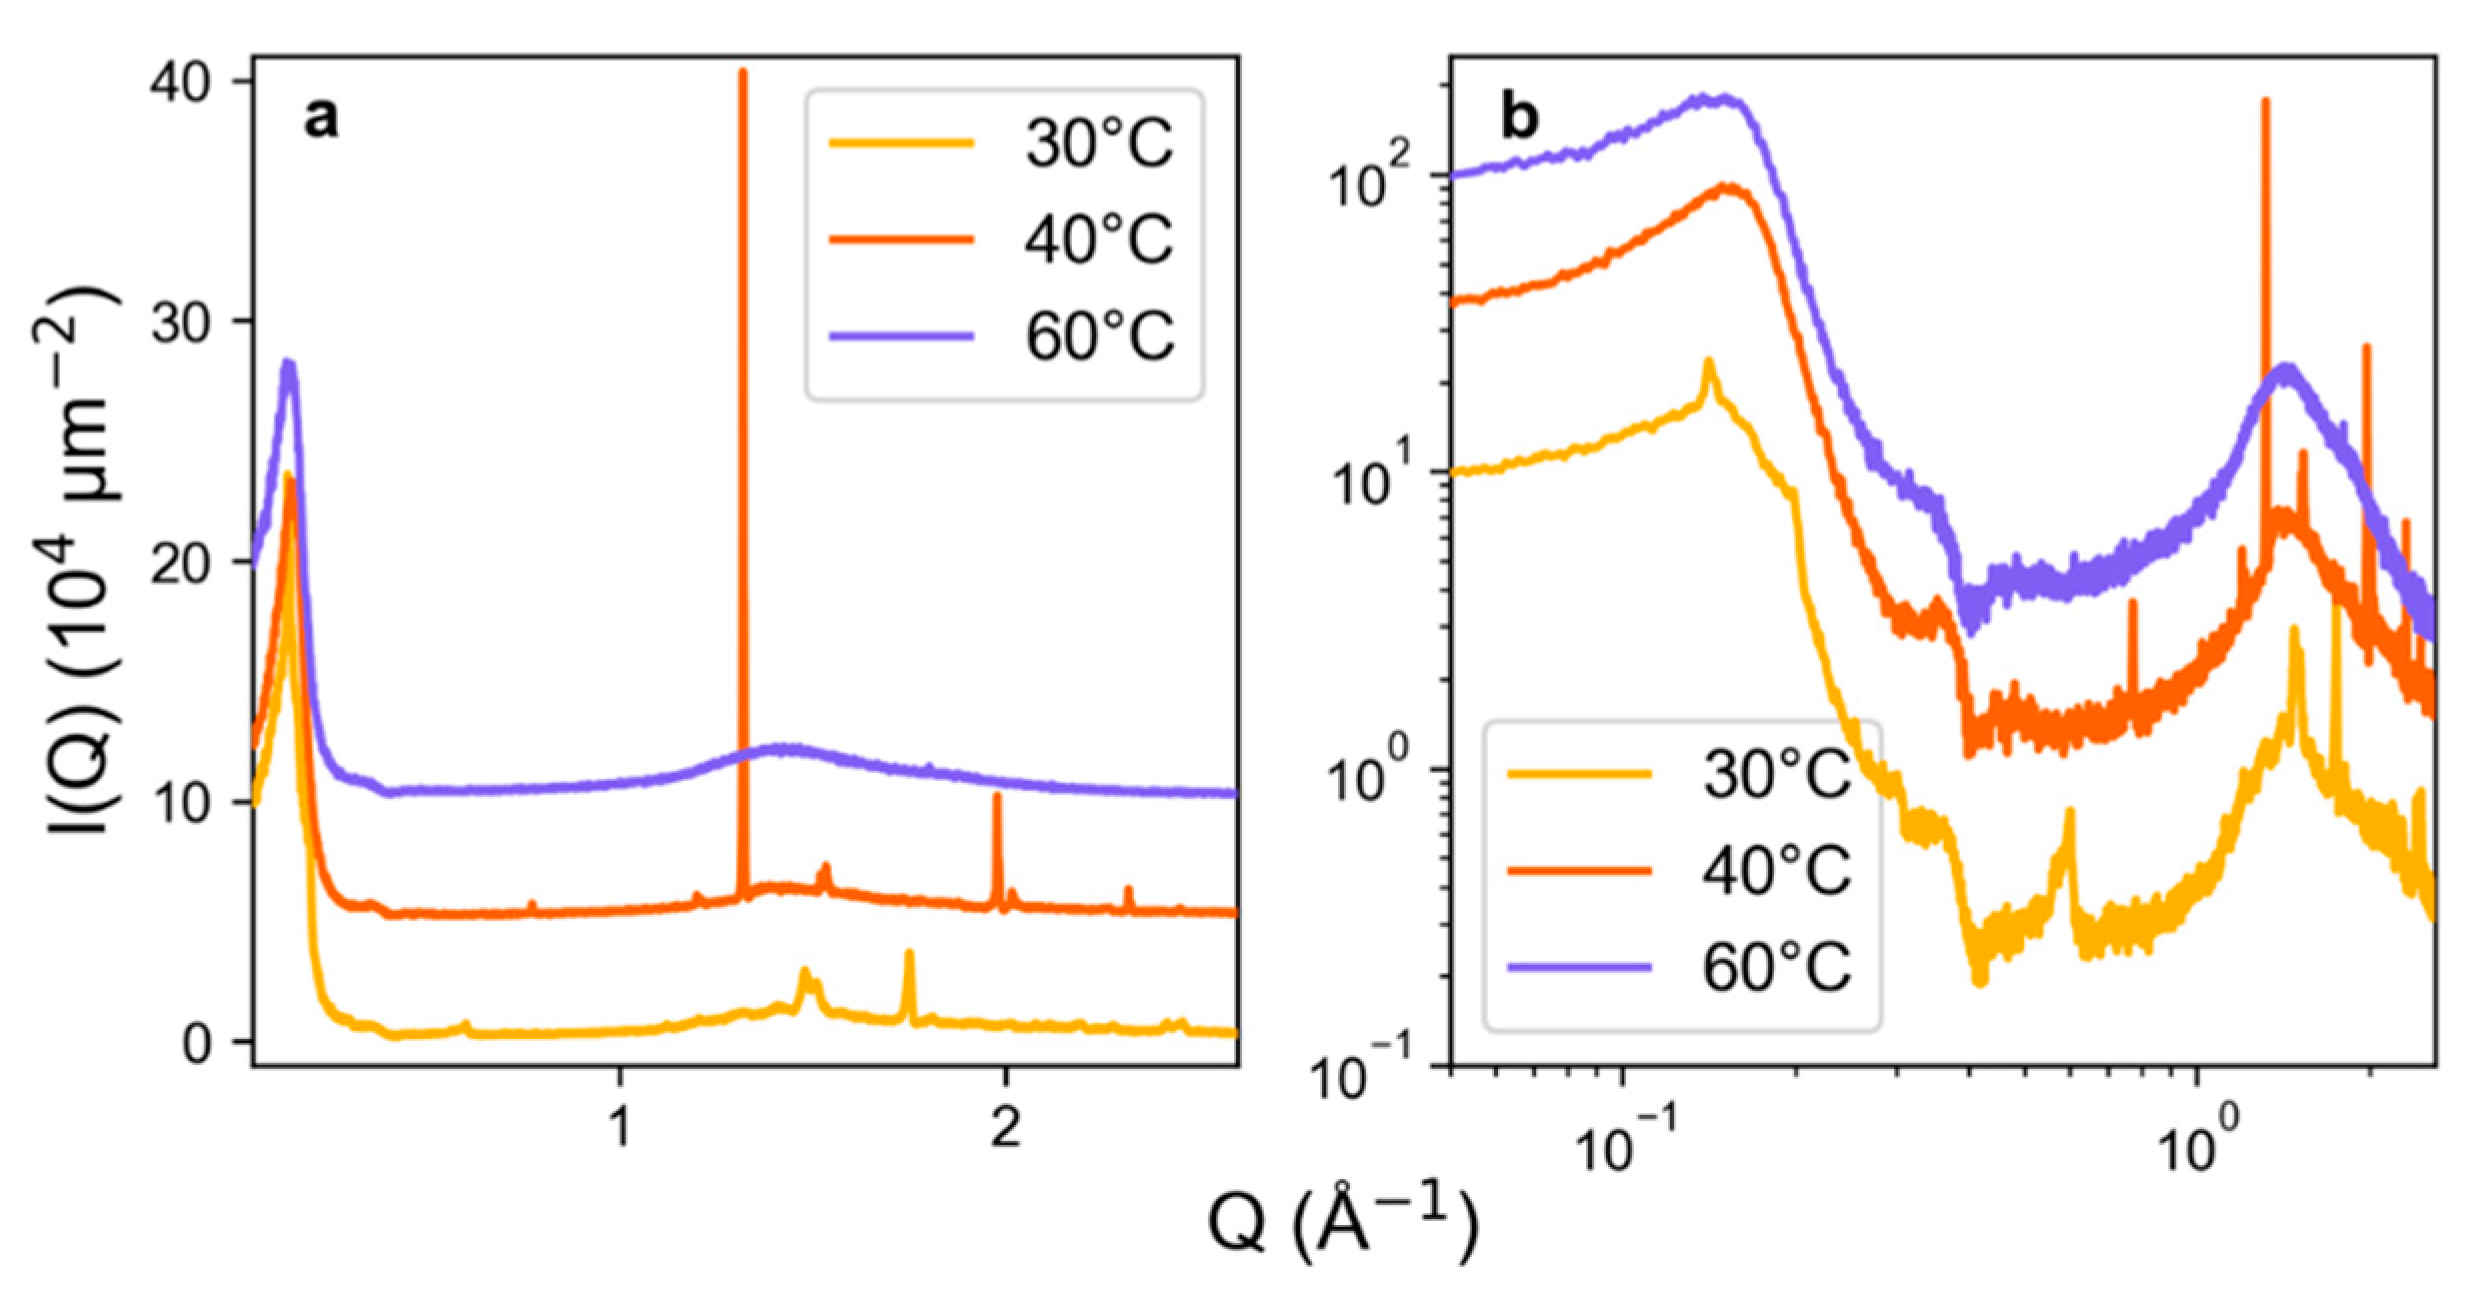
2.5. Lyotropic Phase Characterisation

A phase diagram was constructed from visual inspection of a series of samples, from 20–90 wt.% C12TAB in ethaline, at concentration intervals of 5 wt.%. Samples were placed into a temperature-controlled fan oven and equilibrated at each temperature point for a minimum of two hours before observation. Hot-stage optical microscopy, using an Infinity2 Leica DM1000 microscope and Mettler Toledo FP982HT hot stage, was used to check the melting points of the prepared samples by heating from 30 °C to 120 °C at a ramp rate of 5 °C min−1.
In-house SWAXS measurements were taken of C12TAB/ethaline systems using an Anton Paar SAXSess instrument. Samples, highly concentrated in surfactant, were placed into paste cells with Kapton windows and vacuum-sealed with an O-ring. An X-ray tube operating at 50 mA and 40 kV was used to produce a slit-collimated Cu-Kα X-ray beam of wavelength 1.5418 Å. Scattering was collected on static phosphorescent image plates, which were read using a PerkinElmer Cyclone Imager. Anton Paar SAXSQuant software was used to process, normalise, and desmear the data, yielding SWAXS patterns with a Q-range of 0.01 Å−1 ≤ Q ≤ 2.8 Å−1. To avoid heat-induced degradation of the Kapton window, SWAXS measurements were limited to 60 °C.

3. Results and Discussion

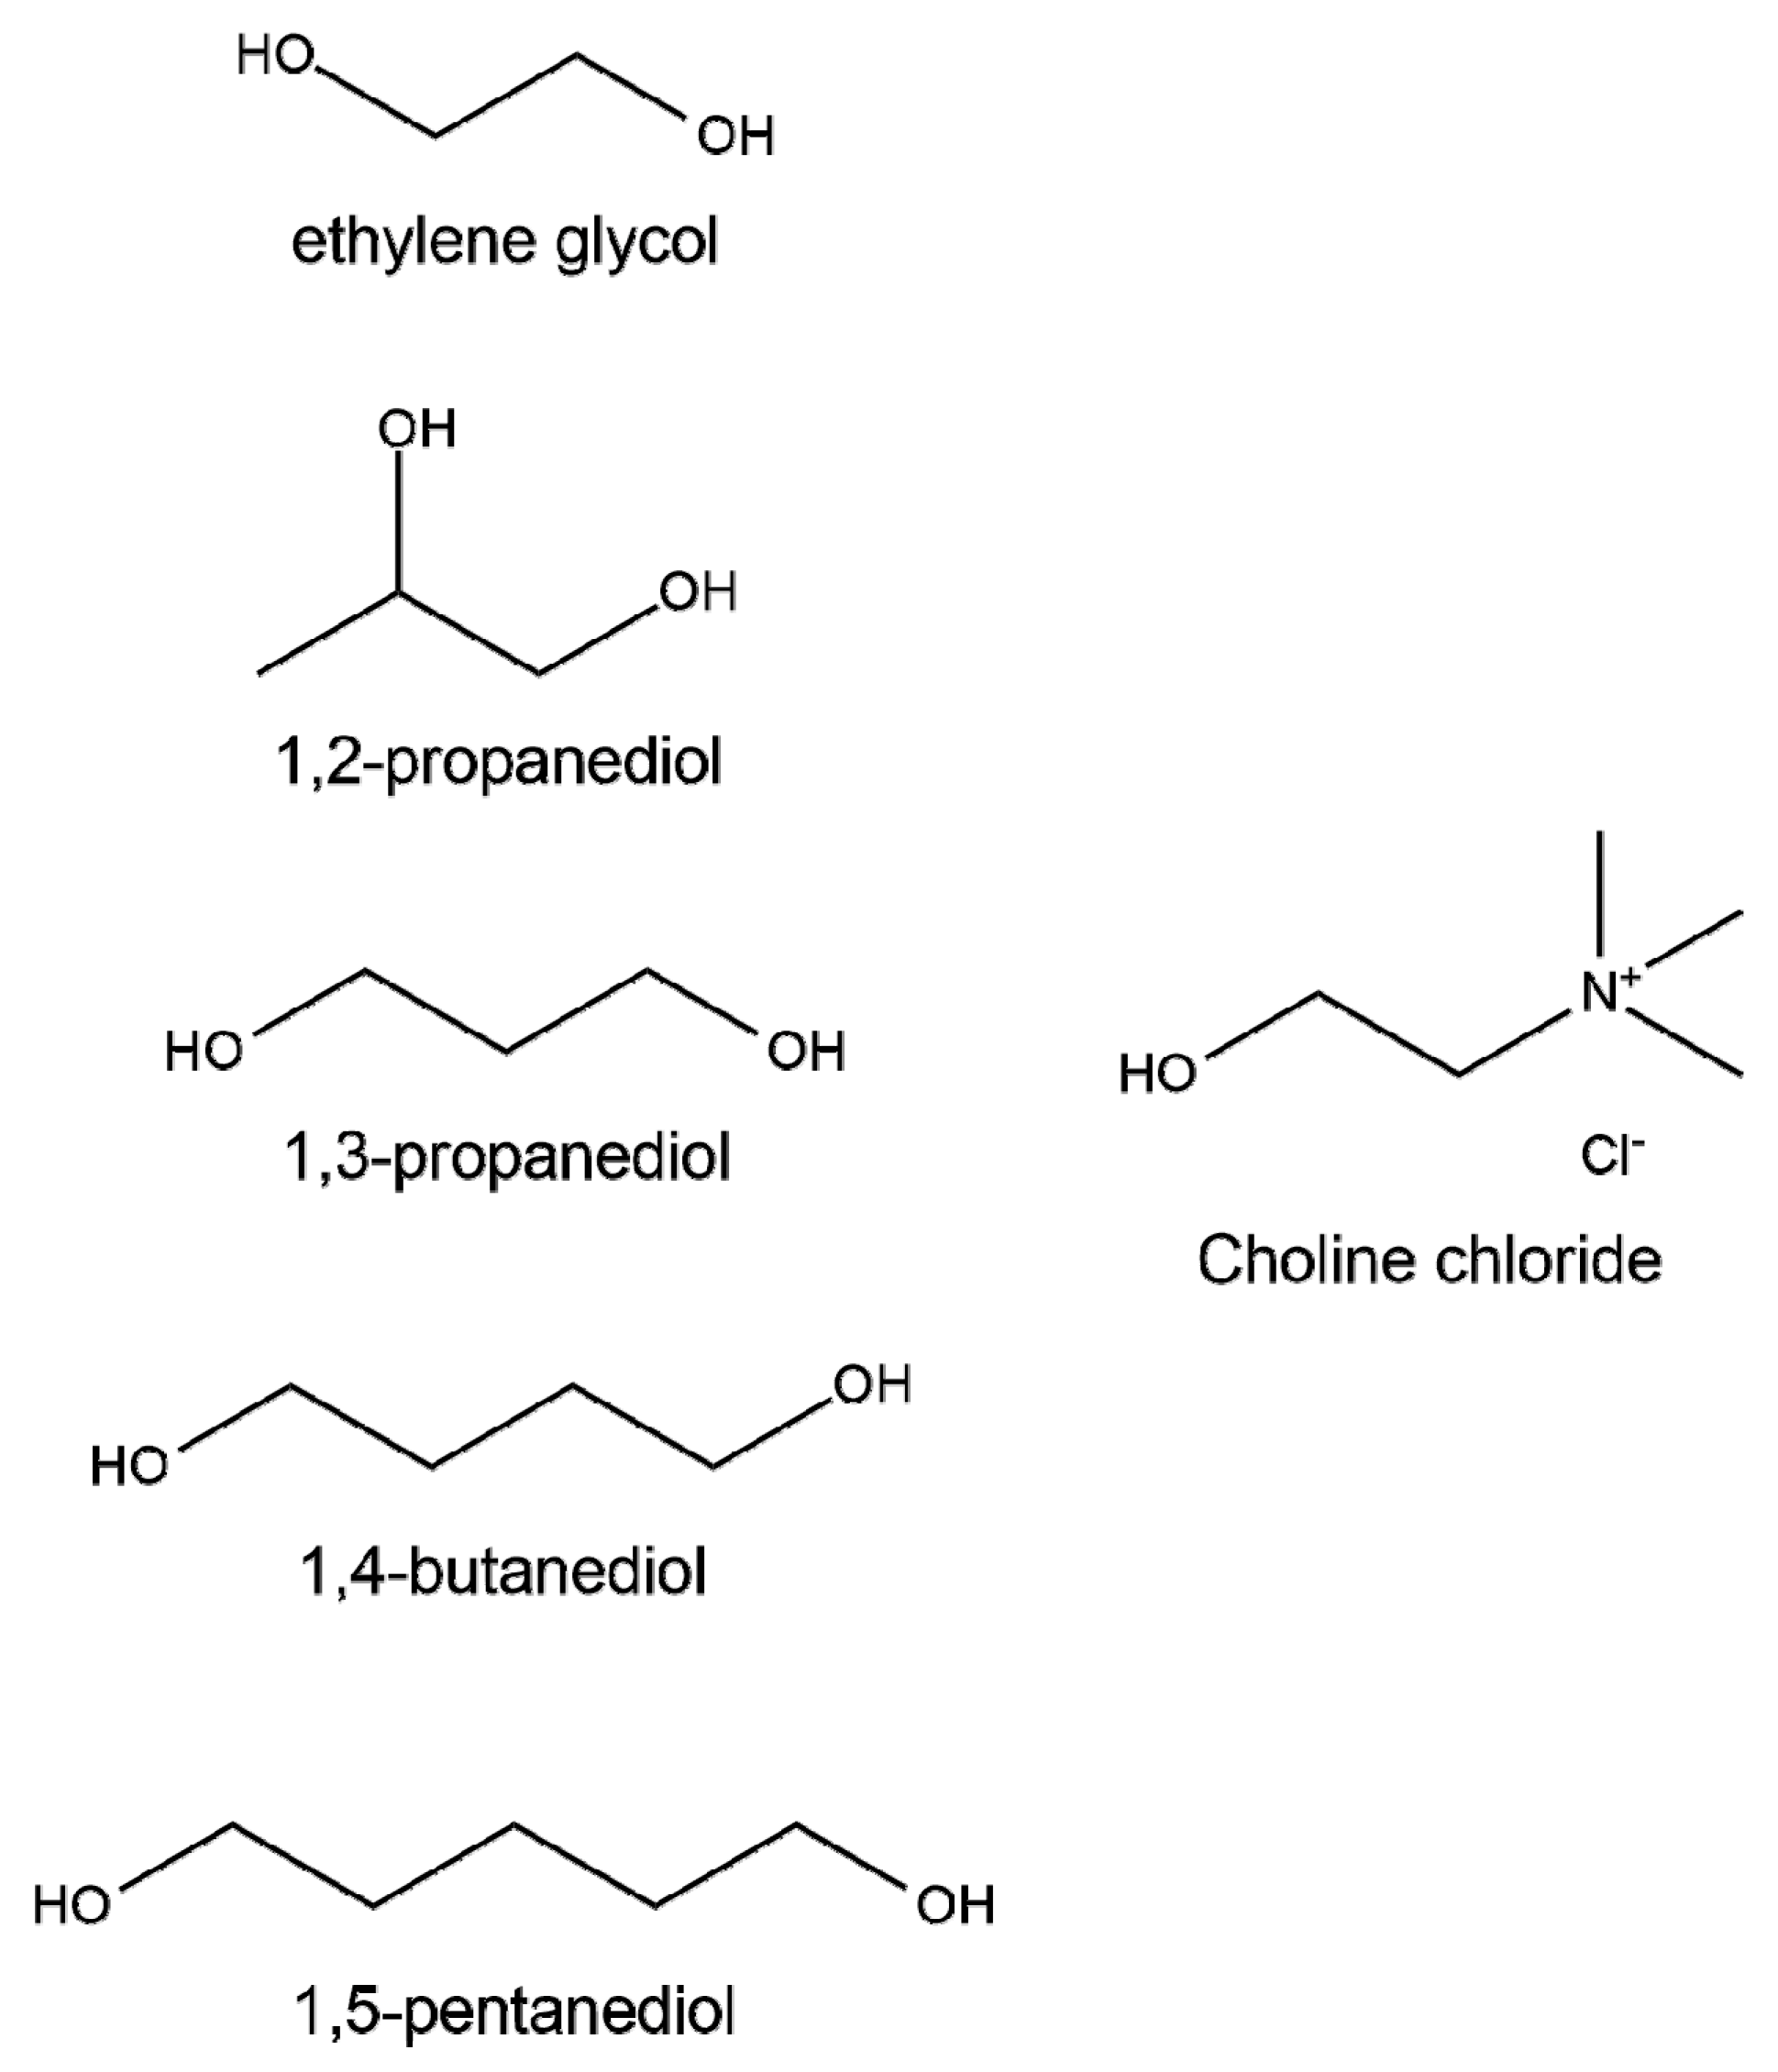
3.1. Choice of Solvents and Physical Properties

Here, we chose to study a series of DES based on choline chloride and diols, with the widely-studied ChCl:EG (1:2) system as the ‘benchmark’, and investigating a series of solvents as a function of diol chain length. We wish to immediately address the choice of mixing ratios for these ChCl:diol systems. Initial reports and understanding of DES were based on the idea of a complex-ion formed with specific complexation ratios [45]. We systematically observed crystallisation of choline chloride in our samples over time, particularly the binary mixtures of long-chain diols, suggesting that the composition with xDiol = 0.67 does not represent a ‘true’ eutectic point [1]. This issue has been revisited recently in the literature by Agieienko and Buchner [26], and most recently by Hayler and Perkin [46], who through detailed studies of the phase transition temperature, observed that the ‘true’ eutectic ratio is 1:4.85 of ChCl:ethylene glycol, or 0.01 < xChCl < 0.02, respectively. Both studies demonstrated that the eutectic depression is not particularly deep, considering the ideal values derived from the components. Thus, our solvents are probably closer to the ‘ideal eutectic mixtures’, but herein we will use the acronym ‘DES’ for continuity. Moreover, ‘magic ratios’ such as 1:2 of salt:hydrogen bond donor are being increasingly questioned as coincidental or unphysical in basis [27], both thermodynamically [47], and due to increasingly advanced structural studies [15,16] which reveal multifaceted structuring and disorder in DES, rather than solely complex ions in solution [21,48,49,50]; complex ions are still seen to some extent, but are more common in halometallate-type systems [39,51]. However, in this study we elected to use the initially reported and widely-studied xChCl = 0.33 composition, since in most cases our samples remained in their liquid windows, or were metastable on experimental timescales, at accessible temperatures. To facilitate direct comparison, all systems described in this study were therefore held at the same ChCl:diol ratio, although the actual eutectic points are likely to differ across the series.
Table 1 shows our assigned nomenclature, alongside the measured physical properties of our diol DES series, and the calculated Gordon Parameters. The densities of the pure diols and mixtures are generally within a 10% range. However, the surface tension values decrease linearly (see Figure S1) as the carbon chain increases in length, but even the highest measured value, ethaline (54.7 mN m−1) was still significantly below that of water (71.0 mN m−1). One exception to this linear variation is for 1,2-propanediol; this system has significantly lower surface tension as a pure diol, and when incorporated into a binary or ternary mixture. 1,2-propanediol is capable of intramolecular H-bonding, and has a slight hydrophobic ‘tail’ rather than being purely bolaform like the other diols studied here (i.e., bearing an alkyl chain ‘core’ with two hydrophilic ‘heads’ at opposite ends). Therefore, 1,2-propanediol has weaker intermolecular interactions overall, as indicated by its lower surface tension.
One way of predicting whether a solvent can support self-assembly is the calculation of the Gordon parameter (G), describing solvent cohesive energy density, from the surface tension and density [16]. This has been determined for several DES, and for ‘typical’ formulations such as ChCl:Urea, is in the region of 1.5 J m−3, whereas many common ILs have Gordon parameters from 0.5–1.5 J m−3, while water is as high as 2.7 J m−3 [52]. Exceptions exist, such as highly dense lanthanide-containing DES, which can even exceed the value of water [39,40]. The family of ChCl:diol systems studied here have relatively low Gordon parameters, with an average Gordon parameter of 1.05 ± 0.11 J m−3. The Gordon parameters also decrease linearly (see Figure S2) as a function of alkyl chain length, and here 2-propanediol systems are outliers again, with systematically lower G values. Accordingly, we expect a poorer ability to promote self-assembly of amphiphiles in these systems than in other DES, such as ChCl:Urea or metal-containing systems, particularly for longer diol chains.
Table 1. Chosen nomenclature, compositions, measured surface tensions, densities, and Gordon parameter (G) values for each of the investigated eutectic solvent systems.
Name of SolventDiol *Molar Ratio
Choline ChlorideEthylene GlycolDiolγ (mN m−1)Density (g cm−3)G
(J m−3)
water----71.0 ± 1.30.998 §2.71
ethylene glycol----47.2 ± 0.11.1111.23
1,2-propanediol----33.6 ± 0.21.0350.80
1,3-propanediol----46.8 ± 0.21.0531.12
1,4-butanediol----44.2 ± 0.21.0150.99
1,5-pentanediol----42.8 ± 0.10.9890.91
ethalineethylene glycol1-254.7 ± 0.31.1151.28
2-propaline1,2-propanediol1-241.7 ± 0.11.0790.93
3-propaline1,3-propanediol1-252.9 ± 0.31.0861.18
butaline1,4-butanediol1-247.5 ± 0.2 1.042 1.01
pentaline1,5-pentanediol1-245.0 ± 0.3 1.016 0.93
2-propethaline1,2-propanediol11146.1 ± 0.21.0951.05
3-propethaline1,3-propanediol11153.4 ± 0.41.0961.22
butethaline1,4-butanediol11149.4 ± 0.51.0851.10
pentethaline1,5-pentanediol11146.5 ± 0.2 1.052 1.01
* The ‘diol’ column refers to the species mixed with choline chloride to form a eutectic system; for ternary mixtures, this is the secondary diol, with the primary diol always being ethylene glycol. § From Kestin et al. [53]. Measurement was carried out at 70 °C due to crystallisation, as opposed to ambient.

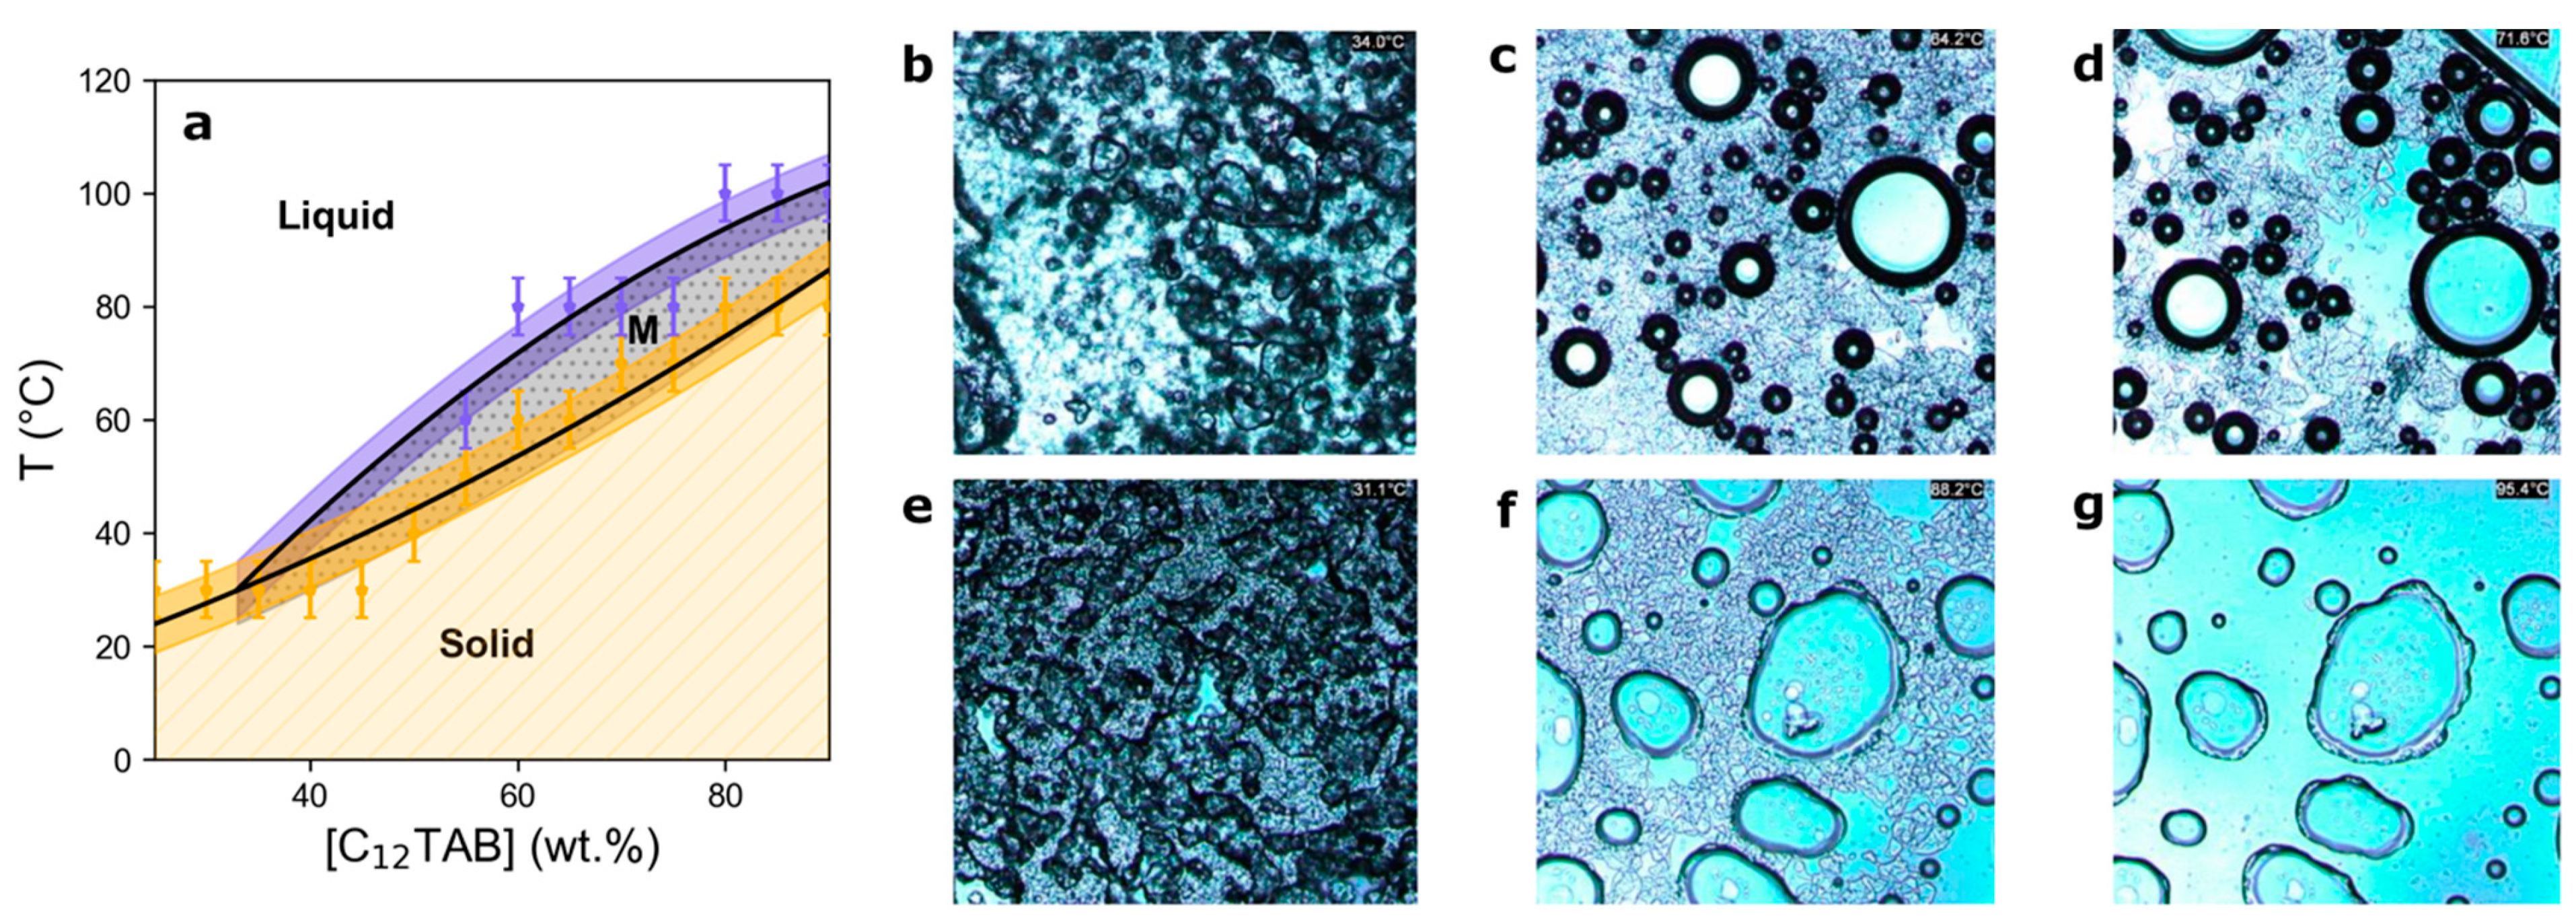
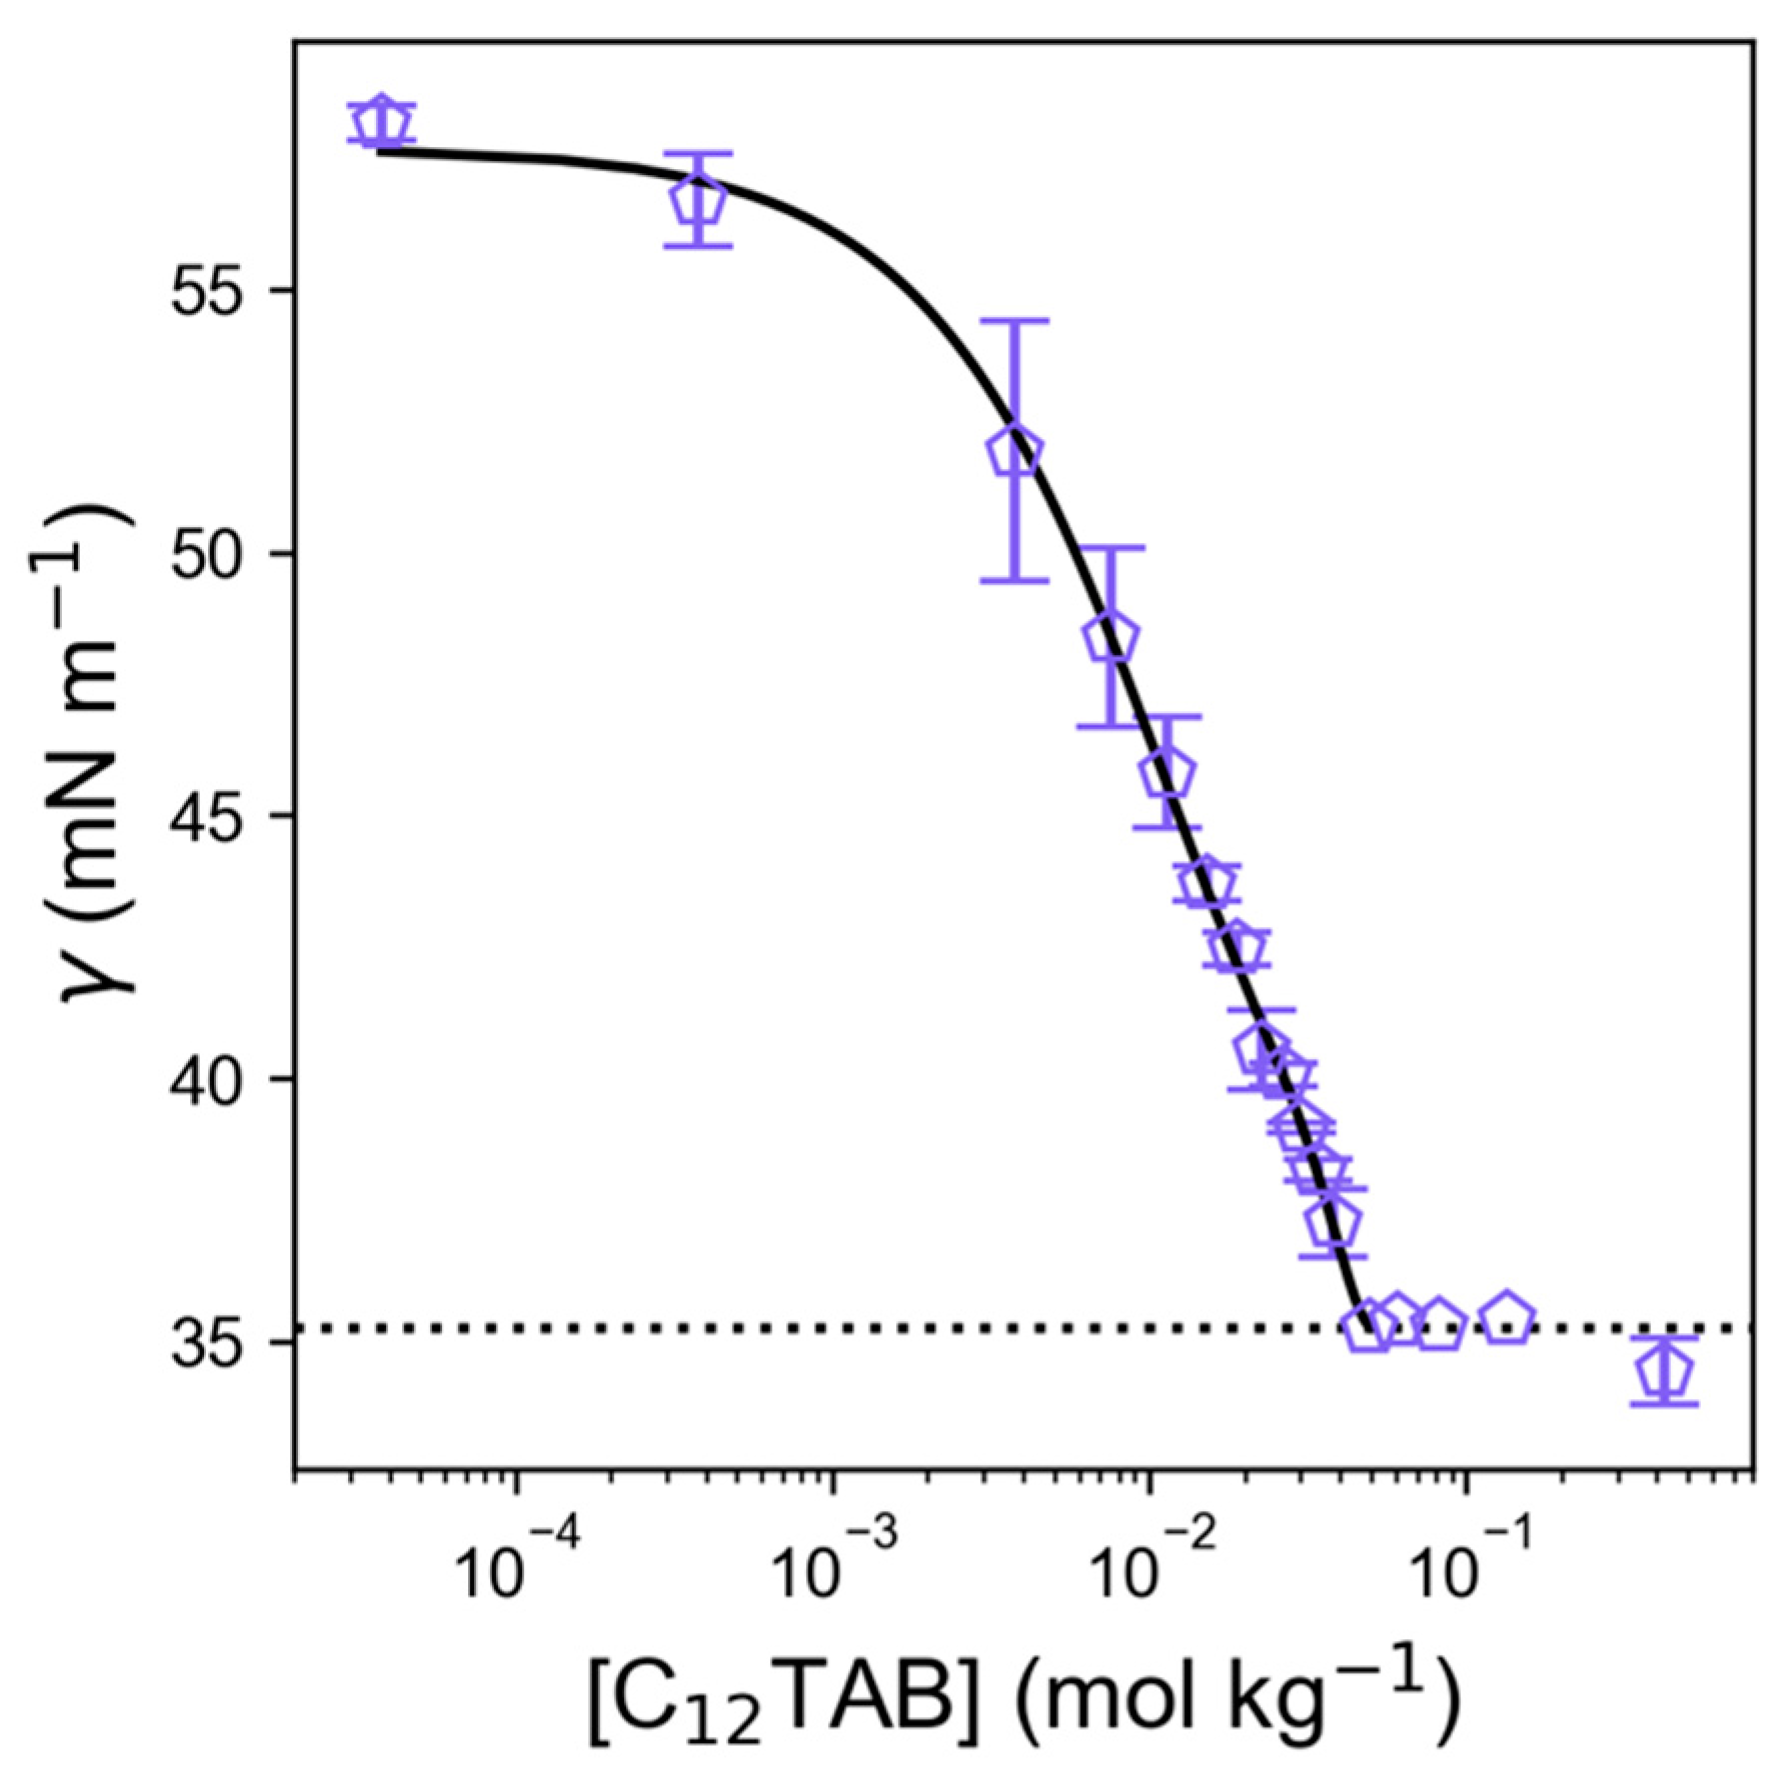
3.2. C12TAB Phase Behaviour and Micellization in Binary Choline Chloride:Ethylene Glycol

In the first instance, a phase diagram (shown in Figure 2) of C12TAB in the binary eutectic mixture of ChCl:ethylene glycol (xEG = 0.67) was constructed by visual inspection of the surfactant-DES mixtures across a wide temperature and concentration range. This allowed the determination of the solid–liquid phase boundary, below which crystallisation of the surfactant and/or DES is observed, and has previously been used to observed the same phase-richness for hexadecylpyridinium bromide in DES as in water [54]. The phase diagram shows a relatively high solubility of C12TAB within the ChCl:EG DES, and that any self-assembly behaviour would have a relatively low Krafft point (below room temperature), as may be anticipated for C12 amphiphiles such as this, in solvents with an appropriate Gordon parameter [32]. A region was observed in the phase diagram whose behaviour suggests the formation of a mesophase (vide infra); equilibrated samples at high C12TAB content formed a gel-like, turbid state within a specific and narrow compositional window. Hot-stage optical microscopy (see Figure 2b–g) was used to confirm that the mesophase transforms into a visually isotropic liquid above the upper transition temperature, and crystallises below the lower transition temperature.
To determine whether the measured liquid region corresponds with a micellar (L1) phase, a dilute solution series of C12TAB in ChCl:EG was measured at room temperature (without specific environmental control) using pendant drop tensiometry, shown in Figure 3. Interestingly, the surface tension of the pure solvent measured via this method (58.2 mN m−1) is slightly higher than the value we measured using the Du Noüy ring method (54.7 mN m−1), likely due to differences in the techniques and laboratory conditions. The results show the typical sigmoidal plot expected from a surfactant solution. As a function of concentration, the surface tension gradient increases as the surfactant adsorbs at the air-DES interface, until reaching a plateau—the critical micelle concentration (CMC)—where the surface is saturated with surfactant, and self-assembly structures begin forming in the bulk [55]. From these measurements, the CMC for C12TAB in ChCl:EG was determined to be 44.7 mM (49.8 mmol kg−1, 1.2 wt.%), which is significantly higher than the value of 22 mM observed for C12TAB in ChCl:glycerol [33], or of 15 mM in water [56,57], similar to the CMC observed in ChCl:malonic acid, 54 ± 6 mM [34], but still much lower than the value recorded for the CMC in the ionic liquid (IL) ethylammonium nitrate (EAN), of 220 mM [58]. The limiting surface tension plateau at the CMC, γCMC, was observed to be 35.25 mNm−1, which is typical of linear hydrocarbon surfactants at aqueous interfaces [59]. To demonstrate that the interfacial composition is chemically modified, the surface tension data were fitted to the Gibbs adsorption isotherm, obtaining the gradient (i.e., the d γ d l n C term at the CMC) through a quartic polynomial function (see fit line in Figure 3) [60]. From this, the Gibbs surface excess (Γ), which is the surface enrichment relative to the bulk, was calculated for this system as 2.04 µmol m−2. Further, the average area occupied per surfactant molecule was calculated to be 81.3 Å2 molecule−1. These values are comparable to those seen for various common surfactants in aqueous systems, confirming that there is no intrinsic difference in the composition of the adsorbed interfacial layer [61], likely a surfactant monolayer, despite the fact that our ChCl:EG DES is a multicomponent protic solvent with high ionic strength [59,60,62,63]. The area per molecule is slightly higher than that observed for C12TAB or C12TANO3 in Ce(NO3)3.6H2O DES, which can be explained by the significant difference in the solvent composition, ionic strength, calculated Gordon parameters, and the method applied here to obtain the d γ d l n C tangent [59].
Having established that C12TAB micellizes in ChCl:EG, and the lower concentration limit of the liquid-micellar phase region (1.2 wt.%), we carried out synchrotron small-angle X-ray scattering (SAXS) (Figure 4a), and contrast-variation small-angle neutron scattering (SANS) (Figure 4b,c) to resolve the micellar structure. It is noteworthy that, given the similar atomic compositions of the C12TAB headgroup and the DES itself, i.e., quaternary ammonium-rich, the electron density contrast is negligible for the headgroup, meaning that SAXS here is sensitive only to the micellar ‘core’. Notwithstanding any solvent penetration into the micelle, selective deuteration of either the solvent, or surfactant, provides strong SANS contrast for the entire micelle, including head and tail, not only the hydrophobic ‘core’.
The measured small-angle scattering data generally followed a Q−4 gradient for the diffuse scattering slope, meaning they could all be fitted to a simple prolate-ellipsoidal form factor, where the effective radius is calculated from the radius of an equivalent sphere with the same second virial coefficient [33]. The structural picture is therefore of imperfect fluctuating spheroids, rather than perfect spheres. The results are shown in Table 2. It is important to first note that a structure factor (S(Q) contribution) is present, which is indicative of intermicellar repulsions, and scales with the volume fraction of micelles in solution (excluding non-absolute-scaled SAXS data). Previous investigations have shown that micellar repulsion in DES cannot be accounted for by simply using an excluded volume effect, as some excess interactions prevail in the long range [64]. Therefore, a modified Percus-Yevick hard sphere S(Q) was used as a proxy to model this interparticle potential, where the volume fraction of the excluded volume effect is not constrained to the micelle volume fraction. Secondly, we note that at 2 wt.% of C12TAB, i.e., just above the CMC, the volume fraction of micelles in solution is very small, such that the data from the D-C12TAB/H-ChCl:EG neutron contrast had insufficient signal-to-noise ratio to be reliably fitted (see Figure S4), and the uncertainty in the fitted SAXS and H-C12TAB/D-ChCl:EG SANS data is high for these concentrations, giving atypically small radii. In a previous analysis of C12TAB in ChCl:glycerol, Sanchez-Fernandez et al. assumed no solvent penetration in the hydrophobic micellar core, and held the micelle core radii constant across each dataset in simultaneous fitting of a core–shell model [33]. Here, we have elected to apply ‘drop’ contrast of simple globules, since the partially (tail-deuterated) C12TAB in ChCl:EG were not measured to help in co-refining the precise shell radius and composition (i.e., extent of headgroup solvation). This means that there are small discrepancies between micelle radius at each concentration point, though these are within the instrumental resolution. The mean calculated micelle polar radius from all combined fitted SANS and SAXS contrasts across 5–20 wt.% of C12TAB is therefore 25.7 ± 1.8 Å, while for the equatorial radius it is 13.2 ± 0.2 Å (with errors representing the geometric mean of fitting errors). As noted, SAXS here is likely to be sensitive only to the core, whereas SANS should represent the entire drop. However, in SANS it is possible that strong headgroup solvation causes contrast-matching, altering the observed radii. Our measured micelle radii are equatorially smaller, and at the poles more extended than, the 16.7 Å C12TAB (spherical) micelle core radius reported by D’Errico in water [65]. Similarly, C12TAB micelles in ChCl:glycerol gave an equatorial radius of 14.8 ± 0.3 Å, which is also larger than those observed in ChCl:EG here [33]. This may also pertain to weaker, less-well-defined assemblies of C12TAB in ChCl:EG compared to the other DES, with stronger headgroup solvation and penetration, and a poorly defined interface. It therefore appears likely that even the rather small diols used here, which contain only a small hydrophobic (alkyl) backbone, are capable of associating with the micellar headgroup region, and perhaps also into the outer layers of the core itself, to a greater extent than H2O, other DES, or ILs [66].
Next, we investigated the solid and mesophase regions of the phase diagram using SWAXS. Figure 5 shows results for 40 wt.% of C12TAB in ChCl:EG as a function of temperature. Samples of pure ChCl:EG and C12TAB powder were also measured as a reference and are shown in Figure S3. Features of note in the pure compounds are major Bragg peaks for C12TAB at 1.48 and 1.72 Å−1, and a broad ‘solvent structure’ peak corresponding with nearest-neighbour interactions within the DES, centred at 1.39 Å−1, similar to that found for similar ChCl DES [21,48]. All samples show evidence for the existence of micelles, with the low-Q scattering data agreeing well with the form and structure factors observed by synchrotron SAXS, and a Q−4 slope with prepeak centred at 0.14 Å−1, indicative of strongly interacting assemblies particularly evident in the Porod plot (Figure 5b). This S(Q) signal corresponds to a d-spacing (regular intermicellar separation) of 88 Å. When the system containing 40 wt.% C12TAB in ChCl:EG is held at 60 °C, only this low-Q peak, and the high-Q ChCl:EG intermolecular structuring peak, are observed. On the other end of the spectrum, measuring the system at 30 °C, which gives a semi-solid sample just below the measured solid–liquid phase transition, clearly shows the same series of Bragg peaks as in pure C12TAB, indicating the presence of undissolved, crystalline surfactant despite extensive equilibration of the sample. However, at this temperature it is also possible to observe small pseudo-Bragg peaks at 0.14 Å−1, 0.3 Å−1, and 0.6 Å−1, thus with relative peak positions of 1:2:4. These reciprocal space reflections are indicative of lamellar phase formation, where the ratio is typically 1:2:3:4 [67], with the 3rd order peak hidden for our samples behind the prominent background scattering of the Kapton cell windows. Heating the sample to 40 °C reveals overwhelming scattering features at 1.32 Å−1 and 1.99 Å−1; d = 4.8 Å and 3.2 Å in real space, respectively, in an intensity ratio of ca. 7:1. These features could not be easily related to any of the common crystalline phases, including those of solid C12TAB. The known diffraction peaks of ChCl are close to these, however, the peak intensities do not match, and ChCl is also known to form co-crystals with small organic molecules [68], giving powder patterns which can be indistinguishable from pure ChCl [69]. Moreover, crystalline α-ChCl is one of the most radiation-sensitive organic crystals known, while our SWAXS collection time is long (ca. 1–2 h), and these peaks were not observed at the lower temperature of 30 °C [70,71]. Therefore, these features are most likely either a co-crystalline, or solvent-expanded surfactant phase of C12TAB formed upon interaction with the DES [72], containing ethylene glycol molecules and/or cholinium cations, with the cationic surfactant. Therefore, we present evidence for the formation of various phases across our observed mesophase region for C12TAB in ChCl:EG.

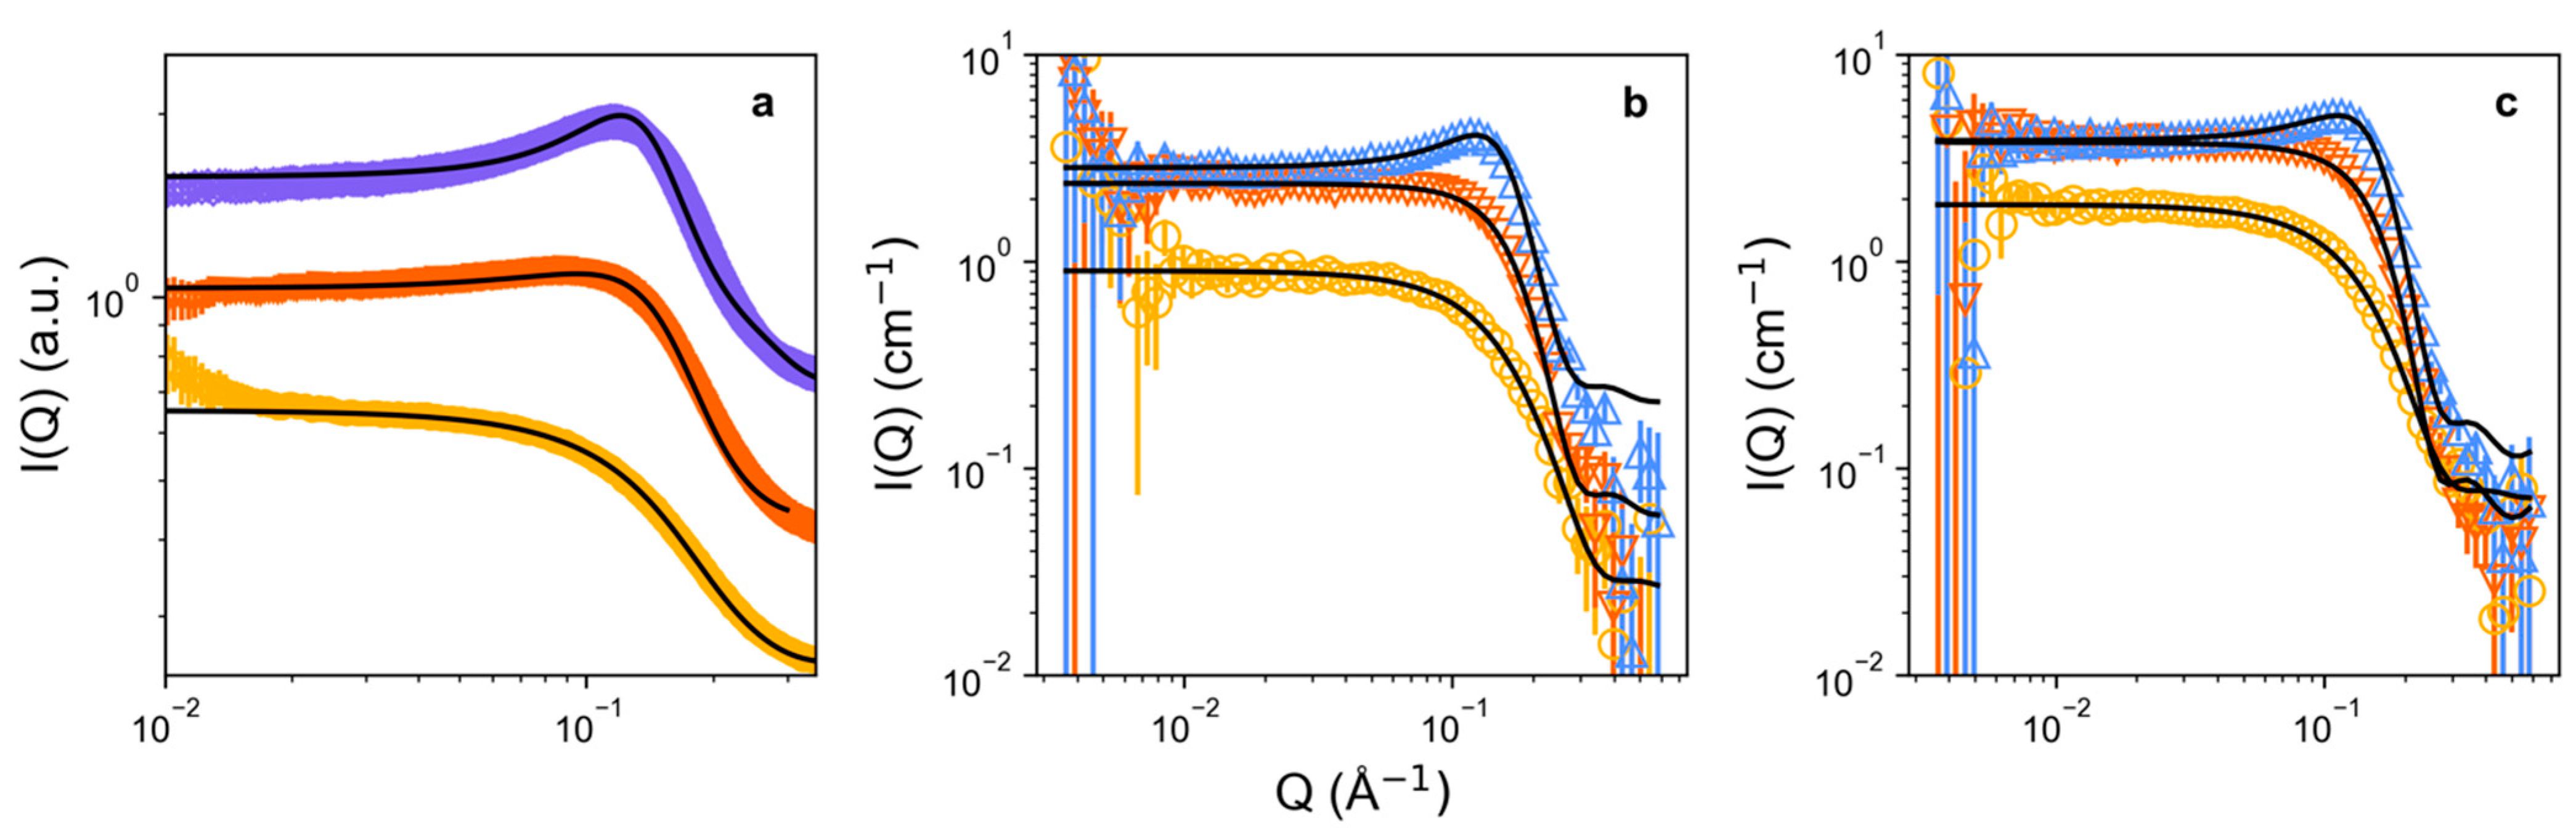
3.3. C12TAB Micellization in Mixed (Ternary) Choline Chloride:Diol Eutectics

Synchrotron SAXS measurements were attempted for C12TAB in all of the eutectic mixtures introduced herein, but as predicted by the measured solvent Gordon parameters [40,52], only pure ethaline, and the two propethaline ternary DES, showed anything other than flat scattering patterns, even at 50 °C. In particular, the longer-chain binary DES butaline and pentaline solidified readily in their capillaries at this temperature, whereas the tertiary DES butethaline and pentethaline simply showed no small-angle scattering signal. As well as the Gordon parameter argument, this lack of aggregation could be due to a weak self-association tendency, where the surfactant remains solubilized in the monomeric form in these DES. Therefore, Figure 6 shows SAXS data collected for the only two micelle-forming systems, namely, the ternary 2-propethaline and 3-propethaline samples, including best fit lines.
Like ChCl:EG, propethaline SAXS data were fitted to a prolate-ellipsoidal form factor, with a Percus-Yevick hard sphere structure factor [33]. Results from the SAXS fits are given in Table 3. Firstly, it is noted that no scattering data could be collected for the 2 wt.% sample of C12TAB in 3-propethaline, and the same composition in 2-propethaline scattered very weakly, suggesting a higher solubility and, thus, CMC for C12TAB as the diol length increases. While SAXS is only sensitive to the micelle core, we observe systematically even smaller radii for these systems than the binary ethaline DES. The average polar and equatorial micelle core radii between 5–15 wt.% C12TAB for the 2-propethaline DES were 14.2 ± 0.7 Å and 8.7 ± 0.3 Å, respectively, whereas for the 3-propethaline DES these radii were, respectively 18.2 ± 0.8 Å and 8.3 ± 0.2 Å. Therefore, it appears that lengthening the hydrophobic region of the diol has a major effect on morphology, such that the solvent is able to penetrate the micelle core more effectively, reducing the effective radius of the micelle visible to SAXS. For 2-propanediol, this effect is stronger because it is more traditionally amphiphile-like, with a longer region of exposed tail that is able to slot into the micelle, in the same way that linear alcohols are traditionally introduced into microemulsion formulations, where they help to modulate the film bending rigidity [55,73,74]. However, it is interesting that this effect also strengthens for 3-propanediol relative to the binary ethylene glycol DES, since it is effectively a small bolaform hydrotrope, not traditionally considered as an amphiphile. In ChCl:glycerol, the glycerol does not appear to penetrate cationic surfactant micelles [33], however the diol-based ternary DES studied here can modulate the hydrophobic solvation of the micelle, resulting in a decrease in micelle size with increasing apparent amphiphilicity of the diol. This can be extended to the DES composed of the largest diols, i.e., butaline and pentaline, which seem to be capable of solubilising the surfactant in the monomeric form and hindering micellization.

4. Conclusions

Here, we have shown evidence for the controlled self-assembly of dodecyltrimethylammonium bromide in deep eutectic solvents based on ChCl:ethylene glycol, and some ternary mixtures using the same base DES, with an eye towards designing specific solvent systems to drive self-assembly. Fundamental solvent properties such as density and surface tension were measured and used to calculate the cohesive energy density (Gordon Parameters) of prepared solvents, showing a linear decrease with alkyl chain length, corresponding with poorer general support for self-assembly.
A basic phase diagram for C12TAB in ethaline was constructed, showing the expected liquid, solid, and mesophase boundaries. The liquid phase was confirmed to be a micellar L1 phase by drop shape analysis, giving a rather high CMC of 1.2 wt.%, also suggesting high surfactant solubility in the DES. This phase was analysed by SANS and SAXS, showing slightly smaller globular micelles than in water or ChCl:glycerol, indicative of penetration of the micelles by the solvent molecules. The phase beneath the mesophase (or multiphase) region displayed micellar lyotropic features but also crystalline features indexed to C12TAB. Within the mesophase region, complex behaviour was observed, including potential evidence for a small population of lamellar structures, and a feature potentially indicative of another strongly ordered phase, which could be co-crystalline.
The final aim of this work was to develop specificity in the solvent as ‘designer’ self-assembly media. We observed by SAXS that, possibly due to the low Gordon parameter, using long-chain diols in the ChCl-based DES mixtures was not an appropriate route to achieve this for C12TAB, since no micelles were observed even for the pure DES based on C3-diols; self-assembly structures were only observed in ‘hybrid’ ternary mixtures of 1,2-propanediol or 1,3-propanediol with ethylene glycol and ChCl. Significant micelle modification was seen, with 1,2-propanediol in particular penetrating the micelles significantly, altering the size. In future, it will be edifying to expand studies such as this to a greater variety of HBDs and salts, however, this illustrates both one of the strengths and weaknesses of DES: to do so becomes a naturally combinatorial problem, compounding exponentially for every new surfactant, concentration, composition, salt, HBD, or co-solvent of interest.

Supplementary Materials

The following supporting information can be downloaded at: https://www.mdpi.com/article/10.3390/cryst12111621/s1, Figure S1: measured surface tension; Figure S2: calculated Gordon parameter; Figure S3: SWAXS backgrounds of pure DES and C12TAB; Figure S4: small-angle scattering data of 2 wt.% samples; Table S1: neutron scattering length densities; Table S2: X-ray scattering length densities. (References [33,75,76] are cited in the Supplementary Materials).

Author Contributions

Conceptualization, O.S.H. and K.J.E.; Data curation, O.S.H.; Formal analysis, O.S.H. and A.S.-F.; Funding acquisition, K.J.E.; Investigation, O.S.H., A.S.-F., R.T., R.D. and A.J.S.; Methodology, O.S.H. and A.S.-F.; Project administration, O.S.H. and K.J.E.; Supervision, O.S.H. and A.S.-F.; Visualization, O.S.H.; Writing—original draft, O.S.H.; Writing—review and editing, O.S.H., A.S.-F. and K.J.E. All authors have read and agreed to the published version of the manuscript.

Funding

This research was funded by a PhD Studentship for O.S.H, jointly from the EPSRC Centre for Sustainable Chemical Technologies (EP/L016354/1) and STFC ISIS Neutron & Muon Source (STFC Studentship Agreement 3578).

Data Availability Statement

Raw SANS data are available from the ISIS-ICAT system [77]. Corrected SANS and SAXS data are available through the University of Bath Research Data Archive System; DOI:10.15125/BATH-01222.

Acknowledgments

We thank ISIS for access to Larmor under beamtime allocation RB1620126, and Diamond Light Source for access to I22 under beamtime allocation SM15194.

Conflicts of Interest

The authors declare no conflict of interest.

References

  1. Abbott, A.P.; Capper, G.; Davies, D.L.; Munro, H.L.; Rasheed, R.K.; Tambyrajah, V. Preparation of Novel, Moisture-Stable, Lewis-Acidic Ionic Liquids Containing Quaternary Ammonium Salts with Functional Side Chains. Chem. Commun. 2001, 19, 2010–2011. [Google Scholar] [CrossRef] [PubMed] [Green Version]
  2. Earle, M.J.; Seddon, K.R. Ionic Liquids. Green Solvents for the Future. Pure Appl. Chem. 2000, 72, 1391–1398. [Google Scholar] [CrossRef] [Green Version]
  3. Guthrie, F. LII. On Eutexia. Lond. Edinb. Dublin Philos. Mag. J. Sci. 1884, 17, 462–482. [Google Scholar] [CrossRef] [Green Version]
  4. Coutinho, J.A.P.; Pinho, S.P. Special Issue on Deep Eutectic Solvents: A Foreword. Fluid Phase Equilibria 2017, 448, 1. [Google Scholar] [CrossRef]
  5. Abranches, D.O.; Martins, M.A.R.; Silva, L.P.; Schaeffer, N.; Pinho, S.P.; Coutinho, J.A.P. Phenolic Hydrogen Bond Donors in the Formation of Non-Ionic Deep Eutectic Solvents: The Quest for Type V DES. Chem. Commun. 2019, 55, 10253–10256. [Google Scholar] [CrossRef] [Green Version]
  6. van den Bruinhorst, A.; Kollau, L.J.B.M.; Kroon, M.C.; Meuldijk, J.; Tuinier, R.; Esteves, A.C.C. A Centrifuge Method to Determine the Solid–Liquid Phase Behavior of Eutectic Mixtures. J. Chem. Phys. 2018, 149, 224505. [Google Scholar] [CrossRef] [Green Version]
  7. Hansen, B.B.; Spittle, S.; Chen, B.; Poe, D.; Zhang, Y.; Klein, J.M.; Horton, A.; Adhikari, L.; Zelovich, T.; Doherty, B.W.; et al. Deep Eutectic Solvents: A Review of Fundamentals and Applications. Chem. Rev. 2021, 121, 1232–1285. [Google Scholar] [CrossRef]
  8. Abbott, A.P.; Barron, J.C.; Frisch, G.; Ryder, K.S.; Silva, A.F. The Effect of Additives on Zinc Electrodeposition from Deep Eutectic Solvents. Electrochim. Acta 2011, 56, 5272–5279. [Google Scholar] [CrossRef]
  9. Abbott, A.; Aldous, L.; Borisenko, N.; Coles, S.; Fontaine, O.; Gamarra Garcia, J.D.; Gardas, R.; Hammond, O.; Hardwick, L.J.; Haumesser, P.-H.; et al. Electrochemistry: General Discussion. Faraday Discuss. 2018, 206, 405–426. [Google Scholar] [CrossRef]
  10. Buzzeo, M.C.; Evans, R.G.; Compton, R.G. Non-Haloaluminate Room-Temperature Ionic Liquids in Electrochemistry—A Review. ChemPhysChem 2004, 5, 1106–1120. [Google Scholar] [CrossRef]
  11. Alonso, D.A.; Baeza, A.; Chinchilla, R.; Guillena, G.; Pastor, I.M.; Ramón, D.J. Deep Eutectic Solvents: The Organic Reaction Medium of the Century. Eur. J. Org. Chem. 2016, 2016, 612–632. [Google Scholar] [CrossRef] [Green Version]
  12. García-Álvarez, J.; Hevia, E.; Capriati, V. The Future of Polar Organometallic Chemistry Written in Bio-Based Solvents and Water. Chem.-Eur. J. 2018, 24, 14854–14863. [Google Scholar] [CrossRef] [PubMed] [Green Version]
  13. Hammond, O.S.; Mudring, A.-V. Ionic Liquids and Deep Eutectics as a Transformative Platform for the Synthesis of Nanomaterials. Chem. Commun. 2022, 58, 3865–3892. [Google Scholar] [CrossRef] [PubMed]
  14. Hammond, O.S.; Simon, G.; Gomes, M.C.; Padua, A.A.H. Tuning the Solvation of Indigo in Aqueous Deep Eutectics. J. Chem. Phys. 2021, 154, 224502. [Google Scholar] [CrossRef] [PubMed]
  15. Hammond, O.S.; Edler, K.J. Structure and Implications. In Deep Eutectic Solvents: Synthesis, Properties, and Applications; Wiley-VCH: Weinheim, Germany, 2019; pp. 25–42. ISBN 978-3-527-81848-8. [Google Scholar] [CrossRef]
  16. Manasi, I.; Bryant, S.J.; Hammond, O.S.; Edler, K.J. Interactions of Water and Amphiphiles with Deep Eutectic Solvent Nanostructures; Academic Press: New York, NY, USA, 2021; p. 28. [Google Scholar] [CrossRef]
  17. Smith, E.L.; Abbott, A.P.; Ryder, K.S. Deep Eutectic Solvents (DESs) and Their Applications. Chem. Rev. 2014, 114, 11060–11082. [Google Scholar] [CrossRef] [Green Version]
  18. Kaur, S.; Kumari, M.; Kashyap, H.K. Microstructure of Deep Eutectic Solvents: Current Understanding and Challenges. J. Phys. Chem. B 2020, 124, 10601–10616. [Google Scholar] [CrossRef]
  19. Zhang, Q.; De Oliveira Vigier, K.; Royer, S.; Jérôme, F. Deep Eutectic Solvents: Syntheses, Properties and Applications. Chem. Soc. Rev. 2012, 41, 7108–7146. [Google Scholar] [CrossRef]
  20. Hammond, O.S.; Atri, R.; Bowron, D.T.; Edler, K.J. Neutron Diffraction Study of Indole Solvation in Deep Eutectic Systems of Choline Chloride, Malic Acid, and Water. Chem.-Eur. J. 2022, 28, e202200566. [Google Scholar] [CrossRef]
  21. Hammond, O.S.; Bowron, D.T.; Edler, K.J. Liquid Structure of the Choline Chloride-Urea Deep Eutectic Solvent (Reline) from Neutron Diffraction and Atomistic Modelling. Green Chem. 2016, 18, 2736–2744. [Google Scholar] [CrossRef] [Green Version]
  22. Ashworth, C.R.; Matthews, R.P.; Welton, T.; Hunt, P.A. Doubly Ionic Hydrogen Bond Interactions within the Choline Chloride–Urea Deep Eutectic Solvent. Phys. Chem. Chem. Phys. 2016, 18, 18145–18160. [Google Scholar] [CrossRef] [Green Version]
  23. Kollau, L.J.B.M.; Vis, M.; Van Den Bruinhorst, A.; Tuinier, R.; de With, G. Entropy Models for the Description of the Solid-Liquid Regime of Deep Eutectic Solutions. J. Mol. Liq. 2020, 302, 112155. [Google Scholar] [CrossRef]
  24. Kollau, L.J.B.M.; Vis, M.; van den Bruinhorst, A.; de With, G.; Tuinier, R. Activity Modelling of the Solid–Liquid Equilibrium of Deep Eutectic Solvents. Pure Appl. Chem. 2019, 91, 1341–1349. [Google Scholar] [CrossRef]
  25. Martins, M.A.R.; Pinho, S.P.; Coutinho, J.A.P. Insights into the Nature of Eutectic and Deep Eutectic Mixtures. J. Solut. Chem. 2018, 48, 962–982. [Google Scholar] [CrossRef] [Green Version]
  26. Agieienko, V.; Buchner, R. Is Ethaline a Deep Eutectic Solvent? Phys. Chem. Chem. Phys. 2022, 24, 5265–5268. [Google Scholar] [CrossRef] [PubMed]
  27. Alizadeh, V.; Malberg, F.; Pádua, A.A.H.; Kirchner, B. Are There Magic Compositions in Deep Eutectic Solvents? Effects of Composition and Water Content in Choline Chloride/Ethylene Glycol from Ab Initio Molecular Dynamics. J. Phys. Chem. B 2020, 124, 7433–7443. [Google Scholar] [CrossRef]
  28. Pal, M.; Rai, R.; Yadav, A.; Khanna, R.; Baker, G.A.; Pandey, S. Self-Aggregation of Sodium Dodecyl Sulfate within (Choline Chloride + Urea) Deep Eutectic Solvent. Langmuir 2014, 30, 13191–13198. [Google Scholar] [CrossRef]
  29. Arnold, T.; Jackson, A.J.; Sanchez-Fernandez, A.; Magnone, D.; Terry, A.E.; Edler, K.J. Surfactant Behavior of Sodium Dodecylsulfate in Deep Eutectic Solvent Choline Chloride/Urea. Langmuir 2015, 31, 12894–12902. [Google Scholar] [CrossRef] [Green Version]
  30. Sanchez-Fernandez, A.; Edler, K.J.; Arnold, T.; Heenan, R.K.; Porcar, L.; Terrill, N.J.; Terry, A.; Jackson, A.J. Micelle Structure in a Deep Eutectic Solvent: A Small-Angle Scattering Study. Phys. Chem. Chem. Phys. 2016, 18, 14063–14070. [Google Scholar] [CrossRef]
  31. Sanchez-Fernandez, A.; Hammond, O.S.; Edler, K.J.; Arnold, T.; Doutch, J.; Dalgliesh, R.M.; Li, P.; Ma, K.; Jackson, A.J. Counterion Binding Alters Surfactant Self-Assembly in Deep Eutectic Solvents. Phys. Chem. Chem. Phys. 2018, 20, 13952–13961. [Google Scholar] [CrossRef] [Green Version]
  32. Pal, M.; Singh, R.K.; Pandey, S. Evidence of Self-Aggregation of Cationic Surfactants in a Choline Chloride+Glycerol Deep Eutectic Solvent. ChemPhysChem 2015, 16, 2538–2542. [Google Scholar] [CrossRef]
  33. Sanchez-Fernandez, A.; Arnold, T.; Jackson, A.J.; Fussell, S.L.; Heenan, R.K.; Campbell, R.A.; Edler, K.J. Micellization of Alkyltrimethylammonium Bromide Surfactants in Choline Chloride:Glycerol Deep Eutectic Solvent. Phys. Chem. Chem. Phys. 2016, 18, 33240–33249. [Google Scholar] [CrossRef] [PubMed] [Green Version]
  34. Sanchez-Fernandez, A.; Hammond, O.S.; Jackson, A.J.; Arnold, T.; Doutch, J.; Edler, K.J. Surfactant-Solvent Interaction Effects on the Micellization of Cationic Surfactants in a Carboxylic Acid-Based Deep Eutectic Solvent. Langmuir 2017, 33, 14304–14314. [Google Scholar] [CrossRef] [PubMed]
  35. Sanchez-Fernandez, A.; Moody, G.L.; Murfin, L.C.; Arnold, T.; Jackson, A.J.; King, S.M.; Lewis, S.E.; Edler, K.J. Self-Assembly and Surface Behaviour of Pure and Mixed Zwitterionic Amphiphiles in a Deep Eutectic Solvent. Soft Matter 2018, 14, 5525–5536. [Google Scholar] [CrossRef] [PubMed] [Green Version]
  36. Tan, X.; Zhang, J.; Luo, T.; Sang, X.; Liu, C.; Zhang, B.; Peng, L.; Li, W.; Han, B. Micellization of Long-Chain Ionic Liquids in Deep Eutectic Solvents. Soft Matter 2016, 12, 5297–5303. [Google Scholar] [CrossRef] [PubMed]
  37. Rengstl, D.; Fischer, V.; Kunz, W. Low-Melting Mixtures Based on Choline Ionic Liquids. Phys. Chem. Chem. Phys. 2014, 16, 22815–22822. [Google Scholar] [CrossRef] [Green Version]
  38. Atri, R.; Sanchez-Fernandez, A.; Hammond, O.S.; Manasi, I.; Doutch, J.; Tellam, J.P.; Edler, K.J. Morphology Modulation of Ionic Surfactant Micelles in Ternary Deep Eutectic Solvents. J. Phys. Chem. B 2020, 124, 6004–6014. [Google Scholar] [CrossRef]
  39. Hammond, O.S.; Bowron, D.T.; Edler, K.J. Structure and Properties of “Type IV” Lanthanide Nitrate Hydrate:Urea Deep Eutectic Solvents. ACS Sustain. Chem. Eng. 2019, 7, 4932–4940. [Google Scholar] [CrossRef]
  40. Manasi, I.; Andalibi, M.R.; Atri, R.S.; Hooton, J.; King, S.M.; Edler, K.J. Self-Assembly of Ionic and Non-Ionic Surfactants in Type IV Cerium Nitrate and Urea Based Deep Eutectic Solvent. J. Chem. Phys. 2021, 155, 084902. [Google Scholar] [CrossRef]
  41. Sanchez-Fernandez, A.; Leung, A.E.; Kelley, E.G.; Jackson, A.J. Complex by Design: Hydrotrope-Induced Micellar Growth in Deep Eutectic Solvents. J. Colloid Interface Sci. 2021, 581, 292–298. [Google Scholar] [CrossRef]
  42. Du Noüy, P.L. Advantages of the Ring Method for the Study of the Surface Equilibria of Colloidal Solutions. Nature 1927, 119, 598. [Google Scholar] [CrossRef]
  43. Berry, J.D.; Neeson, M.J.; Dagastine, R.R.; Chan, D.Y.C.; Tabor, R.F. Measurement of Surface and Interfacial Tension Using Pendant Drop Tensiometry. J. Colloid Interface Sci. 2015, 454, 226–237. [Google Scholar] [CrossRef] [PubMed]
  44. Basham, M.; Filik, J.; Wharmby, M.T.; Chang, P.C.Y.; El Kassaby, B.; Gerring, M.; Aishima, J.; Levik, K.; Pulford, B.C.A.; Sikharulidze, I.; et al. Data Analysis WorkbeNch (DAWN). J. Synchrotron Radiat. 2015, 22, 853–858. [Google Scholar] [CrossRef] [PubMed] [Green Version]
  45. Abbott, A.P.; Capper, G.; Davies, D.L.; Rasheed, R.K.; Tambyrajah, V. Novel Solvent Properties of Choline Chloride/Urea Mixtures. Chem. Commun. 2003, 70–71. [Google Scholar] [CrossRef] [Green Version]
  46. Hayler, H.J.; Perkin, S. The Eutectic Point in Choline Chloride and Ethylene Glycol Mixtures. Chem. Commun. 2022. [Google Scholar] [CrossRef] [PubMed]
  47. van den Bruinhorst, A.; Kollau, L.J.B.M.; Vis, M.; Hendrix, M.M.R.M.; Meuldijk, J.; Tuinier, R.; Esteves, A.C.C. From a Eutectic Mixture to a Deep Eutectic System via Anion Selection: Glutaric Acid + Tetraethylammonium Halides. J. Chem. Phys. 2021, 155, 014502. [Google Scholar] [CrossRef] [PubMed]
  48. Hammond, O.S.; Bowron, D.T.; Jackson, A.J.; Arnold, T.; Sanchez-Fernandez, A.; Tsapatsaris, N.; Sakai, V.G.; Edler, K.J. Resilience of Malic Acid Natural Deep Eutectic Solvent Nanostructure to Solidification and Hydration. J. Phys. Chem. B 2017, 121, 7473–7483. [Google Scholar] [CrossRef] [Green Version]
  49. Araujo, C.F.; Coutinho, J.A.P.; Nolasco, M.M.; Parker, S.F.; Ribeiro-Claro, P.J.A.; Rudić, S.; Soares, B.I.G.; Vaz, P.D. Inelastic Neutron Scattering Study of Reline: Shedding Light on the Hydrogen Bonding Network of Deep Eutectic Solvents. Phys. Chem. Chem. Phys. 2017, 19, 17998–18009. [Google Scholar] [CrossRef] [PubMed] [Green Version]
  50. Di Pietro, M.E.; Goloviznina, K.; van den Bruinhorst, A.; de Araujo Lima e Souza, G.; Costa Gomes, M.; Padua, A.A.H.; Mele, A. Lithium Salt Effects on the Liquid Structure of Choline Chloride–Urea Deep Eutectic Solvent. ACS Sustain. Chem. Eng. 2022, 10, 11835–11845. [Google Scholar] [CrossRef]
  51. Estager, J.; Holbrey, J.D.; Swadźba-Kwaśny, M. Halometallate Ionic Liquids—Revisited. Chem. Soc. Rev. 2014, 43, 847–886. [Google Scholar] [CrossRef] [Green Version]
  52. Greaves, T.L.; Drummond, C.J. Solvent Nanostructure, the Solvophobic Effect and Amphiphile Self-Assembly in Ionic Liquids. Chem. Soc. Rev. 2013, 42, 1096–1120. [Google Scholar] [CrossRef]
  53. Kestin, J.; Sokolov, M.; Wakeham, W.A. Viscosity of Liquid Water in the Range −8 °C to 150 °C. J. Phys. Chem. Ref. Data 1978, 7, 941–948. [Google Scholar] [CrossRef] [Green Version]
  54. Li, Q.; Wang, J.; Lei, N.; Yan, M.; Chen, X.; Yue, X. Phase Behaviours of a Cationic Surfactant in Deep Eutectic Solvents: From Micelles to Lyotropic Liquid Crystals. Phys. Chem. Chem. Phys. 2018, 20, 12175–12181. [Google Scholar] [CrossRef] [PubMed]
  55. Eastoe, J.; Tabor, R.F. Surfactants and Nanoscience; Elsevier: Amsterdam, The Netherlands, 2014; ISBN 978-0-444-59541-6. [Google Scholar] [CrossRef]
  56. Evans, D.F.; Allen, M.; Ninham, B.W.; Fouda, A. Critical Micelle Concentrations for Alkyltrimethylammonium Bromides in Water from 25 to 160 °C. J. Solut. Chem. 1984, 13, 87–101. [Google Scholar] [CrossRef]
  57. Schick, M.J. Effect of temperature on the critical micelle concentration of nonionic detergents. thermodynamics of micelle formation 1. J. Phys. Chem. 1963, 67, 1796–1799. [Google Scholar] [CrossRef]
  58. Evans, D.F.; Yamauchi, A.; Roman, R.; Casassa, E.Z. Micelle Formation in Ethylammonium Nitrate, a Low-Melting Fused Salt. J. Colloid Interface Sci. 1982, 88, 89–96. [Google Scholar] [CrossRef]
  59. Alexander, S.; Smith, G.N.; James, C.; Rogers, S.E.; Guittard, F.; Sagisaka, M.; Eastoe, J. Low-Surface Energy Surfactants with Branched Hydrocarbon Architectures. Langmuir 2014, 30, 3413–3421. [Google Scholar] [CrossRef] [Green Version]
  60. Mukherjee, I.; Moulik, S.P.; Rakshit, A.K. Tensiometric Determination of Gibbs Surface Excess and Micelle Point: A Critical Revisit. J. Colloid Interface Sci. 2013, 394, 329–336. [Google Scholar] [CrossRef]
  61. McCluskey, A.R.; Sanchez-Fernandez, A.; Edler, K.J.; Parker, S.C.; Jackson, A.J.; Campbell, R.A.; Arnold, T. Bayesian Determination of the Effect of a Deep Eutectic Solvent on the Structure of Lipid Monolayers. Phys. Chem. Chem. Phys. 2019, 9, 6133–6141. [Google Scholar] [CrossRef] [Green Version]
  62. Brown, P.; Butts, C.; Dyer, R.; Eastoe, J.; Grillo, I.; Guittard, F.; Rogers, S.; Heenan, R. Anionic Surfactants and Surfactant Ionic Liquids with Quaternary Ammonium Counterions. Langmuir 2011, 27, 4563–4571. [Google Scholar] [CrossRef]
  63. Perkin, S.; Salanne, M.; Madden, P.; Lynden-Bell, R. Is a Stern and Diffuse Layer Model Appropriate to Ionic Liquids at Surfaces? Proc. Natl. Acad. Sci. USA 2013, 110, E4121. [Google Scholar] [CrossRef] [Green Version]
  64. Sanchez-Fernandez, A.; Jackson, A.J.; Prévost, S.F.; Doutch, J.J.; Edler, K.J. Long-Range Electrostatic Colloidal Interactions and Specific Ion Effects in Deep Eutectic Solvents. J. Am. Chem. Soc. 2021, 143, 14158–14168. [Google Scholar] [CrossRef] [PubMed]
  65. D’Errico, G.; Ortona, O.; Paduano, L.; Vitagliano, V. Transport Properties of Aqueous Solutions of Alkyltrimethylammonium Bromide Surfactants at 25 °C. J. Colloid Interface Sci. 2001, 239, 264–271. [Google Scholar] [CrossRef] [PubMed]
  66. Greaves, T.L.; Drummond, C.J. Ionic Liquids as Amphiphile Self-Assembly Media. Chem. Soc. Rev. 2008, 37, 1709–1726. [Google Scholar] [CrossRef] [PubMed]
  67. Hamley, I.W. Diffuse Scattering from Lamellar Structures. Soft Matter 2022, 18, 711–721. [Google Scholar] [CrossRef]
  68. Yuan, C.; Chu, K.; Li, H.; Su, L.; Yang, K.; Wang, Y.; Li, X. In Situ Raman and Synchrotron X-ray Diffraction Study on Crystallization of Choline Chloride/Urea Deep Eutectic Solvent under High Pressure. Chem. Phys. Lett. 2016, 661, 240–245. [Google Scholar] [CrossRef]
  69. Alhadid, A.; Jandl, C.; Mokrushina, L.; Minceva, M. Cocrystal Formation in Choline Chloride Deep Eutectic Solvents. Cryst. Growth Des. 2022, 22, 1933–1942. [Google Scholar] [CrossRef]
  70. Petrouleas, V.; Lemmon, R.M.; Christensen, A. X-ray Diffraction Study of Choline Chloride’s β Form. J. Chem. Phys. 1978, 68, 2243–2246. [Google Scholar] [CrossRef]
  71. Nath, A.; Agarwal, R.; Lemmon, R.M. Further Studies on the Solid-state Chemistry of Irradiated Choline Chloride. J. Chem. Phys. 1974, 61, 1542–1547. [Google Scholar] [CrossRef] [Green Version]
  72. Philippoff, W.; Mcbain, J.W. Expansion of the Lamellar Crystal Lattice of Aerosol OT’ upon the Addition of Water. Nature 1949, 164, 885. [Google Scholar] [CrossRef]
  73. Klee, A.; Prevost, S.; Kunz, W.; Schweins, R.; Kiefer, K.; Gradzielski, M. Magnetic Microemulsions Based on Magnetic Ionic Liquids. Phys. Chem. Chem. Phys. 2012, 14, 15355. [Google Scholar] [CrossRef] [Green Version]
  74. Eastoe, J. Microemulsions. In Surfactant Chemistry; Wuhan University Press: Whuan, China, 2003; pp. 59–95. ISBN 978-1-4443-0552-4. [Google Scholar]
  75. Sears, V.F. Neutron Scattering Lengths and Cross Sections. Neutron News 1992, 3, 26–37. [Google Scholar] [CrossRef]
  76. Azizian, S.; Bashavard, N. Surface Properties of Diluted Solutions of Cyclohexanol and Cyclopentanol in Ethylene Glycol. J. Colloid Interface Sci. 2005, 282, 428–433. [Google Scholar] [CrossRef] [PubMed]
  77. Edler, K.J.; Jackson, A.J.; Sanchez-Fernandez, A.; Doutch, J.; Bowron, D.T.; Hammond, O.S.; Arnold, T.; da Silva, M.A.; Moody, G.L.; Dalgliesh, R.M.; et al. Anion Effects on Self-Assembly in Deep Eutectic Solvents. ISIS Neutron Muon Source Data J. 2017. [Google Scholar] [CrossRef]
Figure 1. Structures of the compounds used in this investigation.
Crystals 12 01621 g001
Figure 2. (a) Phase diagram generated by interpolating datapoints from visual inspection of C12TAB in 1:2 choline chloride:ethylene glycol eutectic mixtures at varying compositions and temperatures. The pale-yellow dashed area (bottom) shows compositions where samples contained solids. The grey dotted area marked ‘M’ denotes the possible mesophase region, with the dark shaded coloured regions showing the associated uncertainties (±5 °C) arising from the temperature sampling interval. The clear region shows the compositions at which the samples were transparent and isotropic. (bg) Hot-stage optical microscopy of ((bd); top row) 70 wt.% C12TAB in 1:2 choline chloride:ethylene glycol at 34.0 °C (b), 64.2 °C (c), and 71.6 °C (d), and of ((eg); bottom row) 80 wt.% C12TAB in 1:2 choline chloride:ethylene glycol at 31.1 °C (e), 88.2 °C (f), and 95.4 °C (g).
Crystals 12 01621 g002
Figure 3. Surface tension plot showing measured CMC of C12TAB in ethaline. The solid line represents a quartic polynomial fit, which is used to obtain the maximum gradient, and hence, the fitted Gibbs adsorption isotherm and CMC values. The dashed line shows the limiting surface tension at CMC, γCMC (35.25 mN m−1).
Crystals 12 01621 g003
Figure 4. Measured and background-subtracted scattering data: (a) SAXS of C12TAB (5, 10, and 15 wt.%) in ethaline DES; (b) SANS of D-C12TAB (5, 10, and 20 wt.%) in H-ethaline DES; (c) SANS of H-C12TAB (5, 10, and 20 wt.%) in D-ethaline DES. Experimental surfactant concentrations are represented by yellow circles (5 wt.%), orange downwards triangles (10 wt.%), purple diamonds (15 wt.%), and blue upwards triangles (20 wt.%), whereas fits are shown as black lines. Data and fits are omitted where small-angle scattering could not be reliably fitted due to signal-to-noise ratio, i.e., for 2 wt.% samples of C12TAB.
Crystals 12 01621 g004
Figure 5. Normalised and desmeared SWAXS patterns for 40 wt.% of C12TAB in ethaline DES as a function of temperature, shown as a linear plot (a) and a log-log plot (b) To aid visibility, SWAXS data are arbitrarily offset in (a) by I(Q)+5 (40 °C) and I(Q)+10 (60 °C), and in (b) 5·I(Q) (40 °C) and 10·I(Q) (60 °C).
Crystals 12 01621 g005
Figure 6. (a) SAXS of C12TAB (5, 10, and 15 wt.%) in 2-propethaline DES; (b) SAXS of C12TAB (5, 10, 15 wt.%) in 3-propethaline DES. Experimental surfactant concentrations are represented by yellow circles (5 wt.%), orange downwards triangles (10 wt.%), and purple diamonds (15 wt.%), and fits are shown as black lines. Data and fits are omitted where small-angle scattering could not be reliably fitted due to signal-to-noise ratio, i.e., for 2 wt.% samples of C12TAB.
Crystals 12 01621 g006
Table 2. SAXS and SANS fitting parameters for binary eutectic systems.
ContrastC (wt.%)C (mol kg−1)Polar Radius (Å)Equatorial Radius (Å)ϕHSϕmicelles
SAXS50.1724.7 ± 1.312.8 ± 0.70.0580.052 *
100.3624.3 ± 0.712.3 ± 0.20.1080.127 *
150.5732.0 ± 0.112.0 ± 0.00.1890.260 *
SANS D-C12TAB/H-ChCl:EG50.1726.6 ± 2.813.1 ± 0.50.0380.023
100.3624.3 ± 1.715.4 ± 0.10.0960.065
200.8124.5 ± 2.614.9 ± 0.30.1880.131
SANS H-C12TAB/D-ChCl:EG50.1725.4 ± 6.210.9 ± 0.80.0360.021
100.3623.8 ± 3.813.5 ± 0.40.0870.061
200.8126.0 ± 4.114.0 ± 0.30.2090.141
* The ϕmicelles derived from the analysis of SAXS data do not correspond to the micelle volume fraction but to an arbitrary scale factor, as data are not in absolute scale. It should be noted that this factor scales with the fraction of micelles in solution.
Table 3. SAXS fitting parameters for ternary eutectic systems.
SolventC (wt.%)C (mol kg−1)Polar Radius (Å)Equatorial Radius (Å)ϕHSScale Factor
2-propethaline50.1710.1 ± 1.18.6 ± 0.80.0180.047
100.3614.6 ± 1.38.7 ± 1.10.050.127
150.5817.9 ± 0.28.9 ± 0.00.1120.266
3-propethaline50.1716.5 ± 2.36.6 ± 0.80.0180.044
100.3718.5 ± 0.88.9 ± 0.40.0530.146
150.5719.6 ± 0.39.5 ± 0.00.1290.223
Publisher’s Note: MDPI stays neutral with regard to jurisdictional claims in published maps and institutional affiliations.

