Article

Anomalous In Vitro Corrosion Behaviour of Rolled Mg-1 wt. % Zn Alloy Due to Buffer-Microstructure Interactions

1
Department of Mechanical Engineering, University of Canterbury, Private Bag 4800, Christchurch 8140, New Zealand
2
Department of Anatomy and Structural Biology, University of Otago, Dunedin 9054, New Zealand
*
Author to whom correspondence should be addressed.
Crystals 2022, 12(10), 1491; https://doi.org/10.3390/cryst12101491
Submission received: 13 September 2022 / Revised: 12 October 2022 / Accepted: 14 October 2022 / Published: 20 October 2022

Abstract

:
In this study, the influence of microstructure and buffer system on the corrosion behaviour of Mg-1 wt. % Zn is examined. The grain size of the alloy was refined from 700 µm to under 15 µm by rolling with varying reduction percentages per pass. The effects of the rolling procedure on the resulting corrosion profile were analysed with immersion and electrochemical methods. Though the rolling procedure resulted in significant grain refinement, the as-cast samples had the lowest corrosion rate of 2.8 mm/yr, while those of the rolled samples were as high as 15.8 mm/yr. The HEPES buffer system did not control the pH or support the formation of insoluble precipitates as well as the NaHCO3/CO2 buffer system, leading to more severe localised pitting corrosion in samples immersed in HEPES buffered media. While reducing grain size generally corresponds to a lower corrosion rate in Mg alloys, this study provides evidence that other factors such as texture and buffer system must also be considered to accurately test candidate alloys for biodegradable orthopaedic applications.

1. Introduction

Magnesium (Mg) and its alloys are emerging as a promising class of metallic biomedical implant materials that are differentiated by their biodegradability in the physiological environment. However, Mg-based alloys exhibit variable degradability, biocompatibility, bioactivity and mechanical stability, depending on the composition, microstructure and environmental factors [1,2,3,4,5]. Therefore, there is a strong need to develop more ethical and cost-effective approaches to accurately ascertain the performance of Mg alloys in vivo through the use of an in vitro test that aims to mimic the physiological environment [6]. The development of validated in vitro tests would also help to establish standards for the assessment of biodegradable metals [7]. A review of in vitro and in vivo studies by Gonzalez et al. concludes that the mechanisms of Mg corrosion in the physiological environment require significant elucidation before the development of an in vitro corrosion test suitable for biodegradable metals will be achievable [8]. The correct combination of simulated body fluid, buffering system and biologically relevant components is essential to the development of an in vitro test standard that simulates the in vivo corrosion behaviour of biodegradable metals [8].
The concentration of H+ in blood plasma and various other body solutions is among the most tightly regulated variables in human (and animal) physiology. The pH of normal arterial blood is controlled within a very narrow range of 7.35 to 7.45 by a combination of buffer systems, with the most important of these being the bicarbonate (HCO3/CO2) and haemoglobin buffers [9]. Typically, the in vitro study of magnesium degradation involves the use of a simulated physiological solution (SPS) as the corrosion medium that aims to partially simulate the physiological environment (including pH). However, in general the formation of hydroxide ions (OH) during the aqueous corrosion of Mg progressively increases the pH of the SPS above normal physiological levels. Thus, a buffering system is required to maintain the pH at appropriate physiological levels during such in vitro testing. Various buffer systems have been utilised in such in vitro degradation experiments with Mg. An ideal buffer system for studying Mg degradation is sodium bicarbonate (NaHCO3) in a controlled partial CO2 atmosphere due to its similarities to the physiological system, although this system requires an external supply of CO2 to maintain the desired concentration. Consequently, various buffers based on the zwitterionic N-substituted aminosulfonic acids are relatively common in the Mg literature due to their relative ease of use, long history in cell culture studies, and minimal complexation with metal ions. However, piperazinic buffers such as 4-(2-hydroxyethyl)-1-piperazineethanesulfonic acid (aka HEPES) have been shown to undergo complexation with Mg ions, leading to accelerated corrosion of Mg [10,11]. Furthermore, HEPES appears to interfere with the formation of insoluble salts that normally act to slow the corrosion rate of Mg compared with that of the NaHCO3/CO2 buffer system [10,11,12,13,14,15]. Although there are some limited studies of Mg ion complexation with the buffer system, a survey of the literature shows that there is little understanding of how microstructural variations may influence the relative effects of the buffer type on the corrosion rate of Mg alloys. Studies of the combined effects of the microstructure (grain size, crystallographic texture, deformation structure, etc.) and buffer type on Mg corrosion are lacking.
Thermomechanical processing (TMP) by rolling, extrusion or drawing has been widely used to influence the corrosion resistance of Mg alloys. For example, there is experimental evidence that grain refinement of the microstructure leads to increased passivation of Mg [16]. Other microstructural features of Mg alloys such as grain size and morphology, secondary phase content and distribution, crystallographic texture, and dislocation density may also be altered by TMP, thereby increasing [17,18,19,20,21,22] or decreasing [17,23,24] the corrosion rate. For instance, Mg alloys typically develop a strong deformation texture in the form of a (0001) basal plane texture normal to the rolling direction (RD) [25]. The development of a basal plane texture can then influence the bulk corrosion resistance of Mg since (0001) planes exhibit a higher corrosion resistance compared to the 11 2 ¯ 0 and 10 1 ¯ 0 planes [26,27,28,29,30].
Published studies on the effect of the buffer type (and pH) on the corrosion of Mg alloys in vitro are largely restricted to as-cast (AC) materials. In the present work, the buffer type and microstructural evolution are both considered in evaluating the corrosion behaviour of as-cast and rolled Mg-1 wt. % Zn in vitro. Zinc (Zn) is an essential trace element in the human body and plays a role in many physiological functions [31,32,33]. Zn additions (1–5 wt. %) increase the corrosion resistance of Mg through grain refinement, although the composition that gives the lowest corrosion rate is debated in the literature [16,34,35,36,37,38,39]. Consequently, the binary Mg-Zn alloy system has been examined extensively as a potential degradable biomaterial [35,36,37,38,39,40,41,42,43,44,45,46,47,48,49,50,51,52,53,54,55]. The overarching objective of this study is to elucidate interactions between the microstructural parameters and media buffer and how this interaction potentially influences the corrosion behaviour in a simple Mg-Zn binary alloy.

2. Experimental Procedures

2.1. Alloy Preparation

High-purity (HP) Mg (Timmenco Ltd., Toronto, ON, Canada) and zinc (Sigma Aldrich, Auckland, New Zealand) pellets were combined in a mild steel crucible of 60 mm diameter and a height of 140 mm. The inner surface of the crucible was coated with boron nitride (BN HARDCOAT®, ZYP Coatings, Oak Ridge, TN, USA). Melting was performed in a 10 kW vacuum induction furnace (Induktio GmBH, Ljubljana, Slovenia). The furnace chamber was evacuated to ~0.01 bar, then filled with instrument grade argon (>99.99% purity, BOC, Auckland, New Zealand) and allowed to continuously flow throughout the casting process at 0.4 L/min. The alloy was heated up to 700 °C and held for ~20 min under a constant flow of argon. The melt was then delivered under argon into a 90 × 120 × 13 mm (w × h × t) preheated (400 °C) mild steel mould. The nominal chemical composition was verified by inductively coupled plasma mass spectrometry (ICP-MS) (Table 1).

2.2. Thermomechanical Processing

AC samples were homogenised for 8 h at 350 °C and water quenched. The AC material was then subjected to warm rolling to give a total thickness reduction of ~75–78% (Table 1). The AC material was reheated to 350 °C prior to rolling, while the actual rolling temperature was ~250 °C as measured by a thermocouple imbedded in the billet. The plates were rolled at a constant speed of 17.3 m/min, using rolls with a diameter of 460 mm. The number of rolling passes was varied from 2 to 4 to give percentage reductions per pass of 30, 40 or 50%, designated as R30, R40 and R50 (or RX), respectively (Table 2). The plates were reheated to 350 °C for 20 min between each pass. Samples were cooled in air following the final rolling pass.

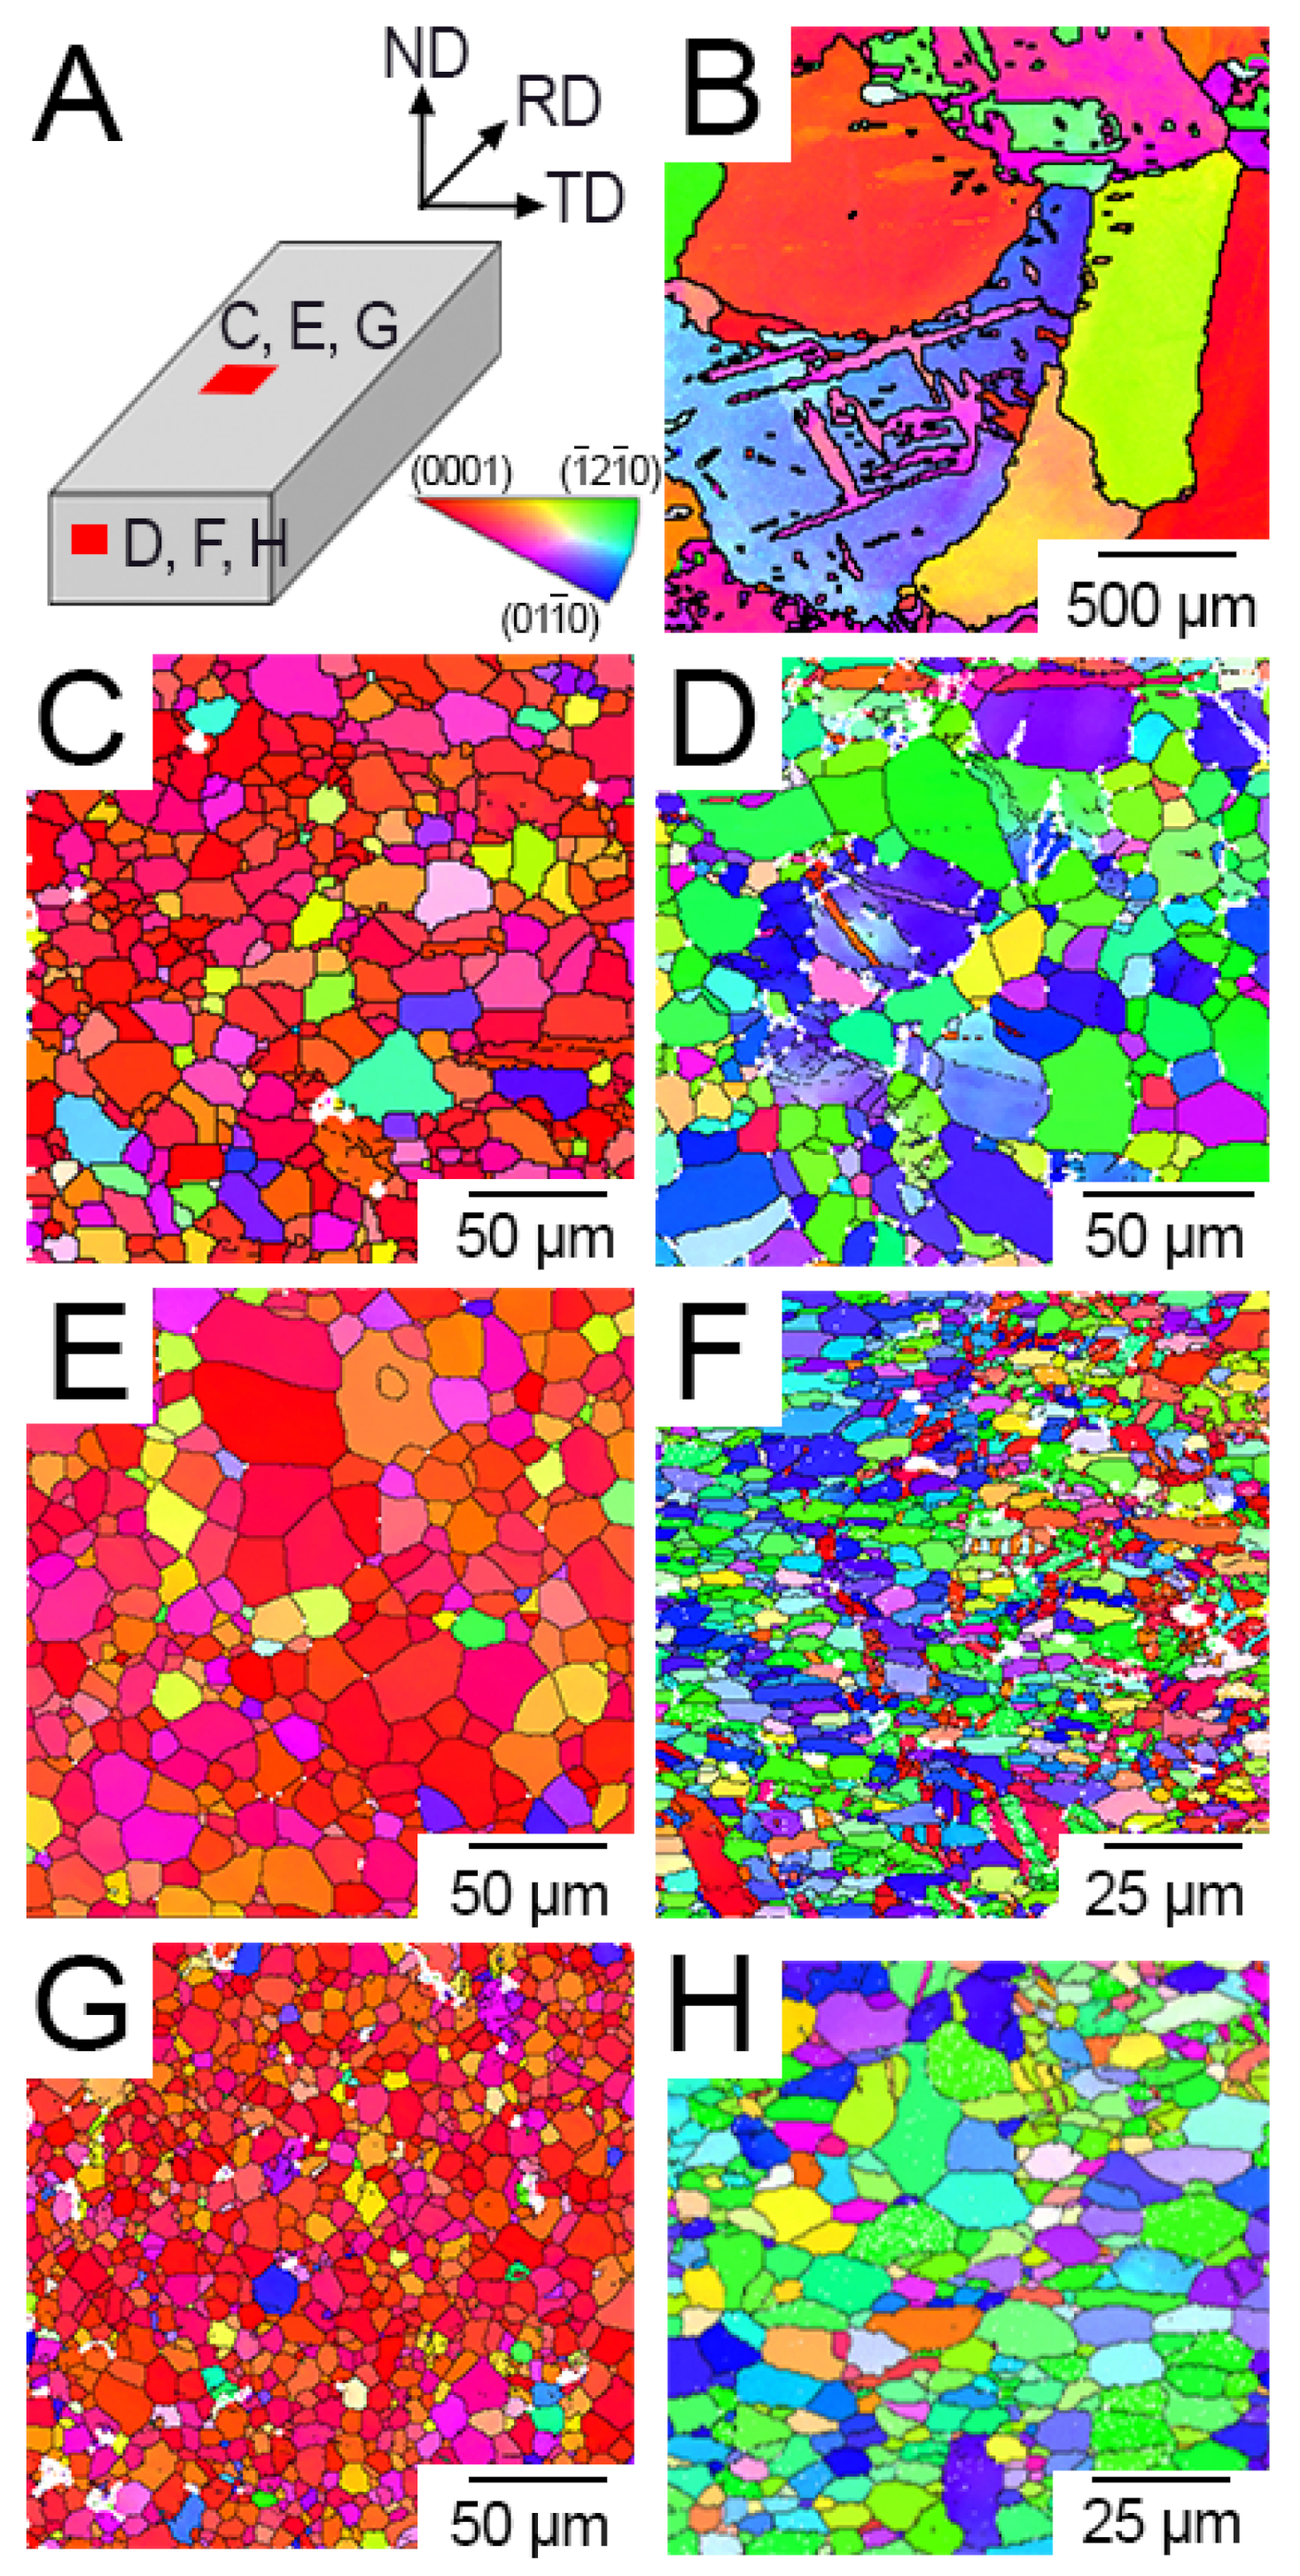
2.3. Microstructural Characterisation

Samples were ground with 240, 400, 600 and 1200 grit SiC paper and then polished with 9 and 3 µm diamond slurries in preparation for electron backscatter diffraction (EBSD). The final polish was achieved with a colloidal silica suspension (Beuhler® Master-Met, Lake Bluff, IL, USA). High purity ethanol (99.5%) was used to clean the samples between polishing steps. A nitric acid solution (1 mL nitric acid, 20 mL acetic acid, 60 mL ethylene glycol, and 19 mL distilled water) was used to etch the samples. Finally, samples were ultrasonically cleaned in ethanol and either immediately imaged or stored in a desiccator. EBSD was performed with a HKL Nordlys EBSD detector (Oxford Instruments, Abington, UK) attached to a JEOL JSM-6100 SEM (JEOL Ltd., Tokyo, Japan) operating at 20 kV at a working distance of 15 mm. Texture analysis was performed with AZtec V 3.2 and Tango V 5.12.62 (Oxford Instruments, Abington, UK). A misorientation angle of 15° was used as the threshold to differentiate high angle from low angle grain boundaries [56]. Recrystallised fractions were obtained from the Tango software which uses a grain orientation spread (GOS) function to distinguish recrystallised grains from deformed grains. GOS is calculated by averaging the difference in orientation between each pixel in a given grain and the average orientation of the entire grain.

2.4. Corrosion Measurements

2.4.1. Mass Loss Measurements

Samples were cut into 7.5 × 7.5 × 2.5 mm blocks using a TechCut® 5 precision saw (Allied High Tech Products Inc., Rancho Dominguez, CA, USA). All surfaces were ground sequentially with 240, 400, 600 and 1200 grit SiC paper. Earle’s balanced salt solution (EBSS) (Sigma Aldrich Co., Auckland, New Zealand) was used as the SPS and buffered with either 5.96 g/L of HEPES (99.5% titration, H3375, Sigma Aldrich Co., Auckland, New Zealand) or 2.2 g/L NaHCO3. The underside of the specimen was coated with an epoxy resin (EpoFix Resin, Struers, Cleveland, OH, USA) prior to testing to avoid non-uniform corrosion induced by the static conditions. An EBSS volume to specimen area ratio of 40 mL/cm2 was used for all tests [8]. Corrosion products were collected from the surface of corroded samples and placed in a Petri dish using a plastic scraper for analysis after 5, 10 and 15 days. The remaining corrosion products were removed from the specimen surface by immersion in a 2 M chromic acid solution (200 g/L CrO3, 10 g/L AgNO3) for 30 min. The mass loss corrosion rate (CRm) in mm/yr was calculated using the following equation [57]:
C R m = Δ W × ρ A × t
where ΔW is the change in mass, ρ is the equivalent density of the respective alloy, A is the surface area of the sample exposed to the media and t is the immersion duration. Mass loss measurements were performed in triplicate.
The pH of the media was initially adjusted to 7.4 and then measured daily (SevenEasy™, Mettler-Toledo Inc., Columbus, OH, USA). The pH stability of the buffered EBSS systems without immersed samples was also verified using blanks. Mass loss measurements in HEPES-buffered EBSS were performed in a temperature controlled (37 ± 1 °C) water bath, while measurements in NaHCO3/CO2 buffered EBSS were carried out in a temperature-controlled (37 ± 0.5 °C) CO2 incubator (MCO-20AIC, Sanyo, Osaka, Japan).
Attenuated total reflectance Fourier transform infrared spectroscopy (ATR-FTIR) was used to analyse the chemical composition of dried corrosion layers removed from the surface of specimens. A total of 9 scans were performed per specimen using an ALPHA FTIR Spectrometer and OPUS software (Bruker, Billerica, MA, USA) over the wavenumber range of 400 to 4000 cm−1 (resolution of 1 cm−1). Energy dispersive X-ray spectroscopy (EDS) of the corrosion layers was also performed with a JEOL IT-300 SEM (JEOL Ltd., Tokyo, Japan), Oxford EDS detector (Oxford Instruments, Abington, UK), and AZtec V 3.2 software (Oxford Instruments, Abington, UK).

2.4.2. Electrochemical Measurements

Samples were cut into 15 × 15 × 3 mm blocks. Sample surfaces were prepared by sequential grinding with 240, 600 and 1200 grit SiC paper, with rinsing in pure ethanol and drying carried out between grinding steps. A three-electrode flat cell setup (Princeton Applied Research, Oak Ridge, TN, USA) was used for potentiodynamic polarisation (PDP) tests that were carried out at 37 ± 0.5 °C and pH of 7.40 ± 0.05. A saturated calomel electrode (SCE) and a platinum mesh were used as the reference and counter electrodes, respectively. 1 cm2 of sample surface area (working electrode) was exposed to 300 mL of EBSS buffered with either 5.96 g/L HEPES or 2.2 g/L NaHCO3. PDP tests using the HEPES-buffered EBSS were carried out on a bench top in air, while those in the CO2/NaHCO3 buffer were performed inside a CO2 incubator (MCO-20AIC, Sanyo, Osaka, Japan) with a 5% CO2 atmosphere. Electrochemical measurements were carried out using a BioLogic® VMP-3Z potentiostat and EC Lab V 10.44 software (Seyssinet-Pariset, France). Specimens were allowed a settling time of 15 min to allow the open circuit potential (OCP) to stabilise prior to testing [58]. Each specimen was subjected to a minimum of three linear polarisation scans at a scan rate of 1 mV/s from −250 mV to + 500 mV vs. OCP to ensure reproducibility. The corrosion current (Icorr) was estimated from Tafel analysis of the polarisation curves and was used to calculate an average corrosion rate (CRi) in mm/yr using (simplified from ASTM G102) [59]
C R i = 22.85 × I c o r r
The electrochemical experiments were performed on the surface perpendicular to the normal direction (Figure 1).

3. Results

3.1. Microstructural Evolution of Warm-Rolled Mg-1 wt. % Zn

Warm-rolling of Mg-1 wt. % Zn resulted in a significant refinement of the grain size compared to the as-cast material. The average recrystallised grain sizes of AC, R30, R40 and R50 were 500–700 µm, 10.6 ± 5.3 µm, 12.0 ± 6.8 µm, and 6.6 ± 3.3 µm, respectively (Table 3).
Warm rolling created a preferred texture throughout the rolled samples. Inverse pole figure (IPF) maps were generated using EBSD to display the grain orientations of each sample (Figure 1). The surface parallel to RD displayed a strong (0001) basal texture, whereas the surface normal to the RD displayed a prismatic texture. A detailed examination of the variation of texture through the thickness of the rolled plate shows that the (0001) basal texture features at the top and bottom surfaces of the plate, while pyramidal and prismatic texture are more prominent toward the centre of the plate (Figure 1).

3.2. Corrosion Behaviour of AC and Warm-Rolled Mg-1 wt. % Zn

Combined Effects of Buffer System, Immersion Time and Thermomechanical Processing

Specimens of AC and R50 were covered in a dark corrosion layer following 1 and 10 d of immersion in the NaHCO3/CO2 buffered EBSS, indicative of OH species [38,46,55,60] (Figure 2). In contrast, specimens of AC and R50 immersed in HEPES buffered EBSS after 1 and 10 d present a bare metal surface, without the presence of the dark OH layers (Figure 2). Ca and P-rich precipitates partially covered the surfaces of all samples after 1 d, although the AC specimen in NaHCO3/CO2 buffered EBSS exhibited considerably less (Figure 2). A non-uniform coverage of white precipitates was observed on the surface of AC after 10 d of immersion (Figure 2). Pitting corrosion and the formation of white precipitates on the warm rolled Mg-1Zn was concomitant with either buffer system after an immersion time of 10 d. The surfaces of R30, R40 and R50 were covered in a layer of white precipitates (Figure 2). Upon further inspection, pitting was observed beneath the white precipitate layer.
The corroded surfaces of the samples were subsequently analysed after removal of the corrosion products with chromic acid (Figure 3). AC immersed in either of the buffer systems exhibited the least pitting (Figure 3a). Pitting of the AC sample was observed after an immersion time of 5 d when using the HEPES buffer, whereas no pitting of the AC sample with the NaHCO3/CO2 buffer was observed up to immersion times of ~15 d. Pitting was observed on the surfaces of R30, R40 and R50 after 5 d of immersion regardless of the buffer system used (Figure 3b–d). Further, the spatial distribution of pits was more uniform on the surfaces of R30, R40 and R50 when immersed in EBSS with a NaHCO3/CO2 buffer compared to that with the HEPES buffer. The depth of the pits of R30, R40 and R50 immersed in the HEPES-buffered EBSS was also significantly greater than that in NaHCO3/CO2.

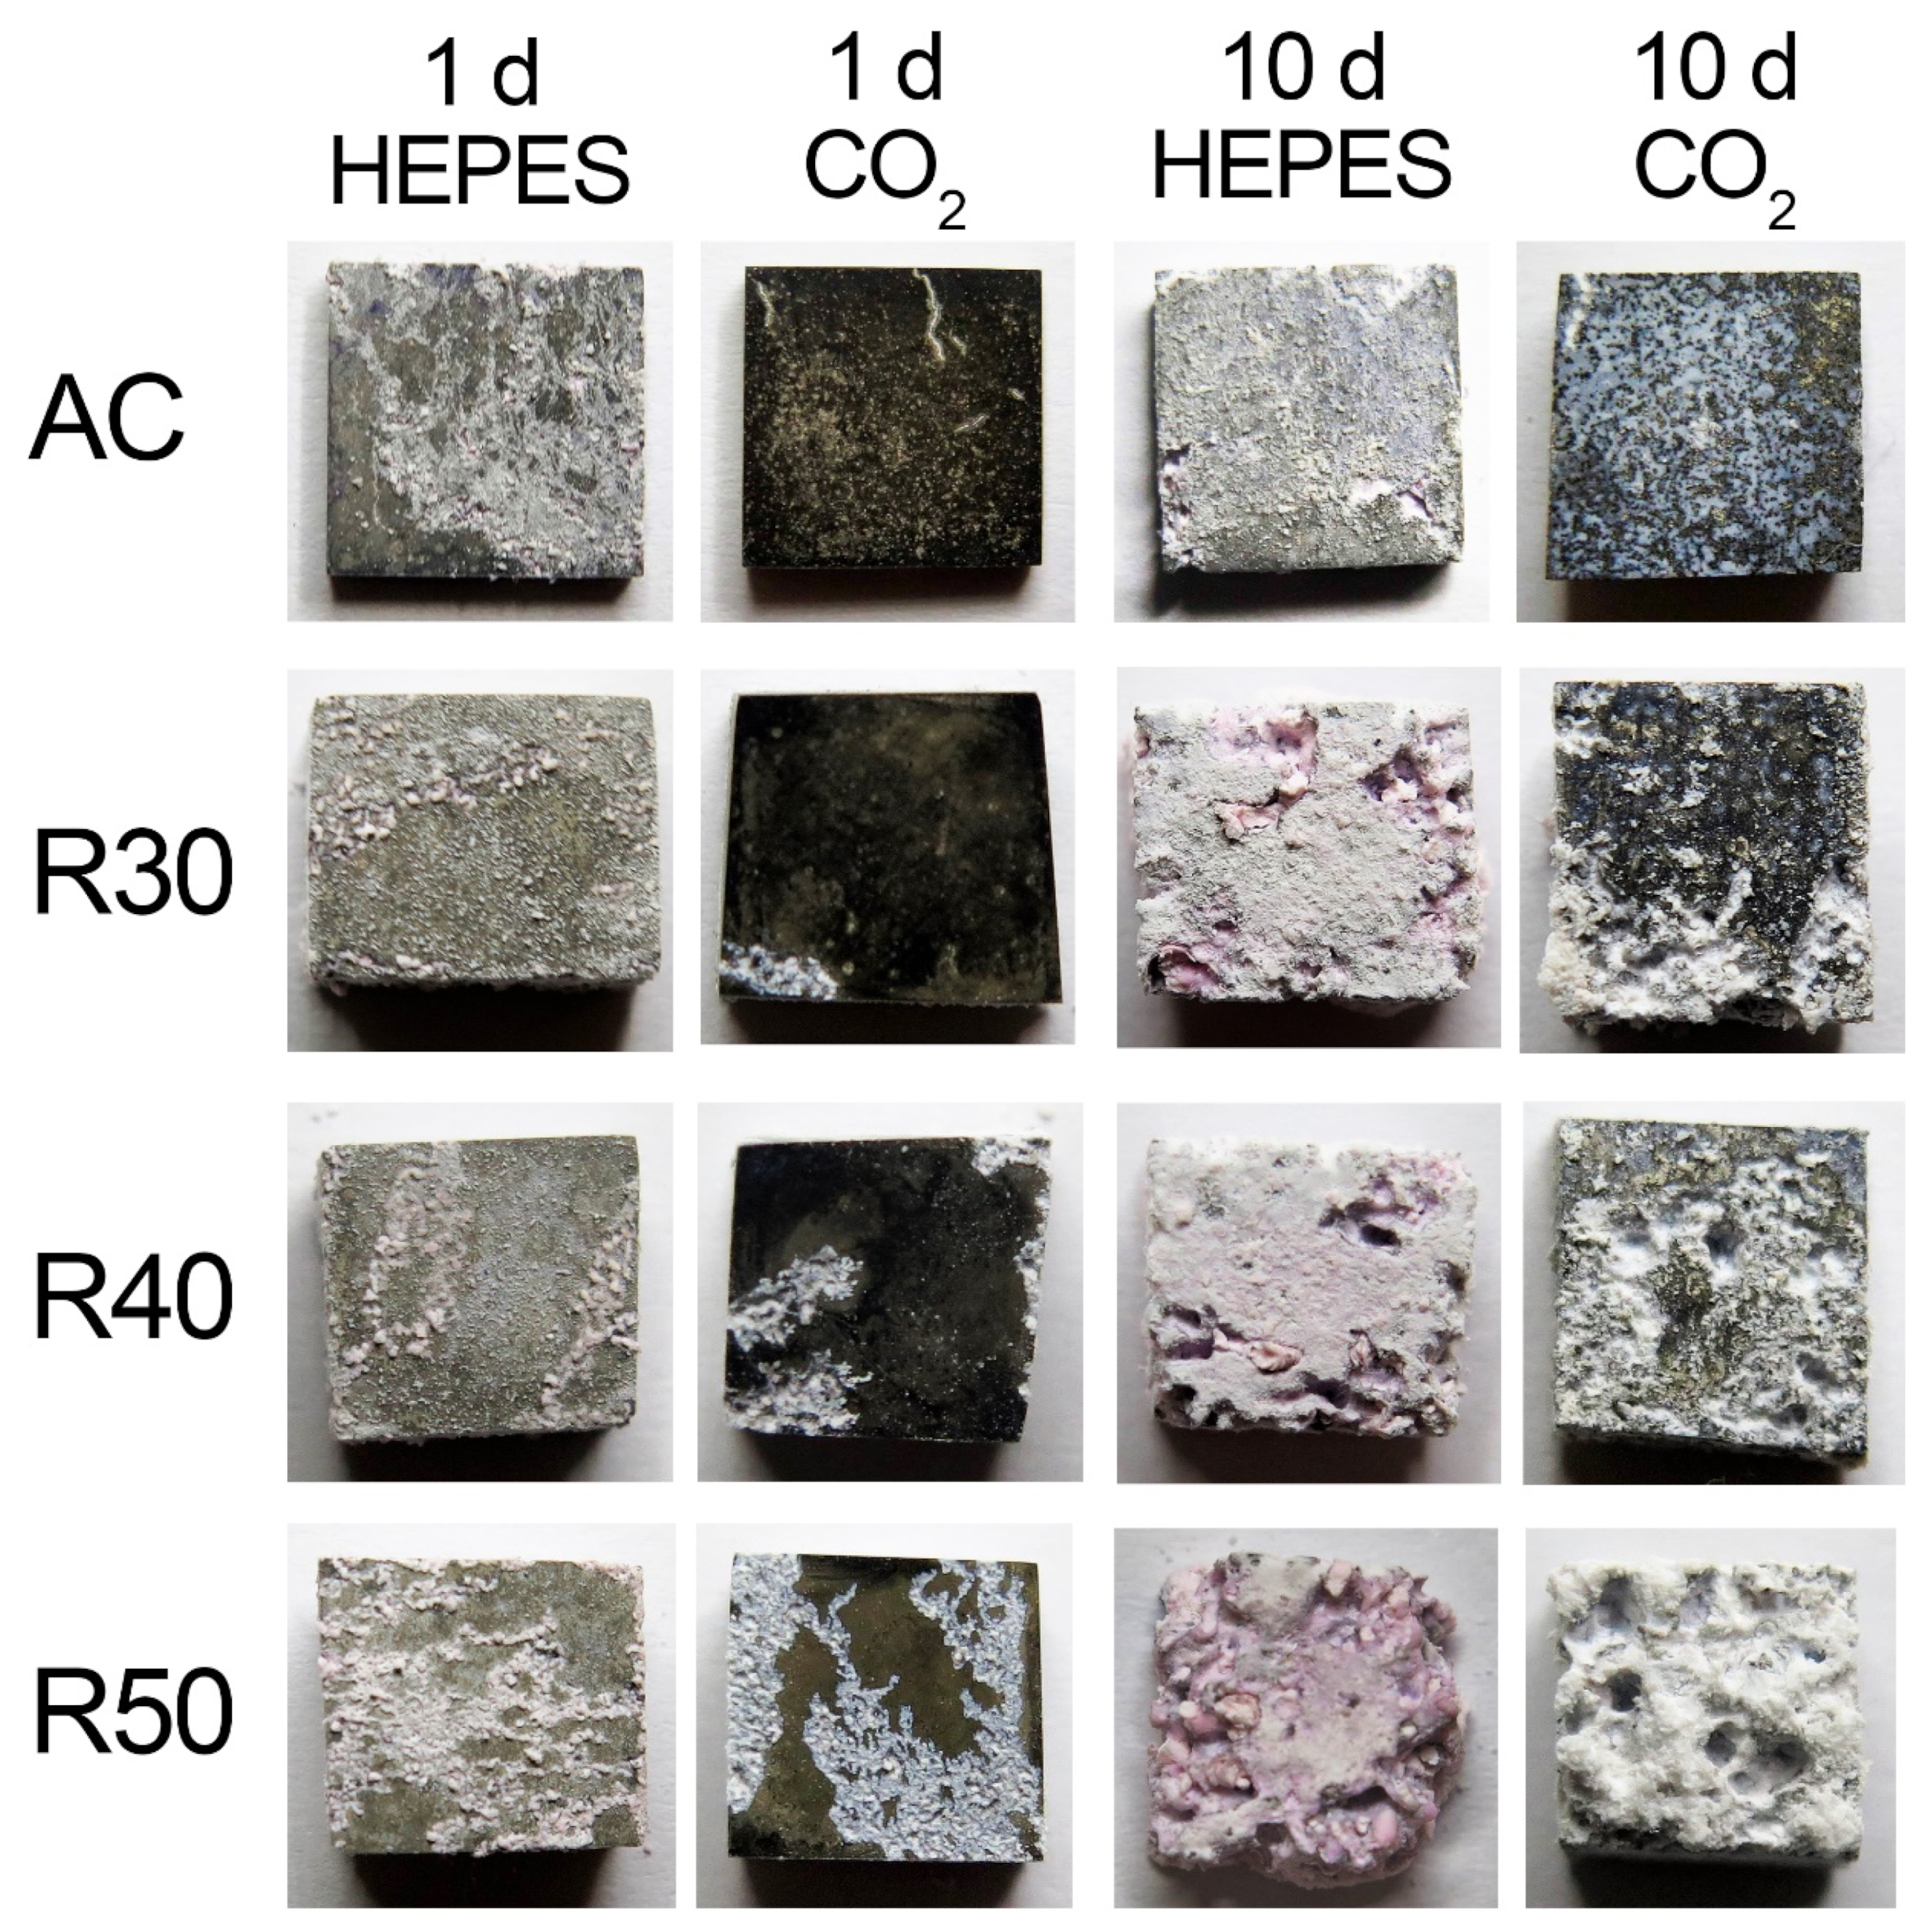
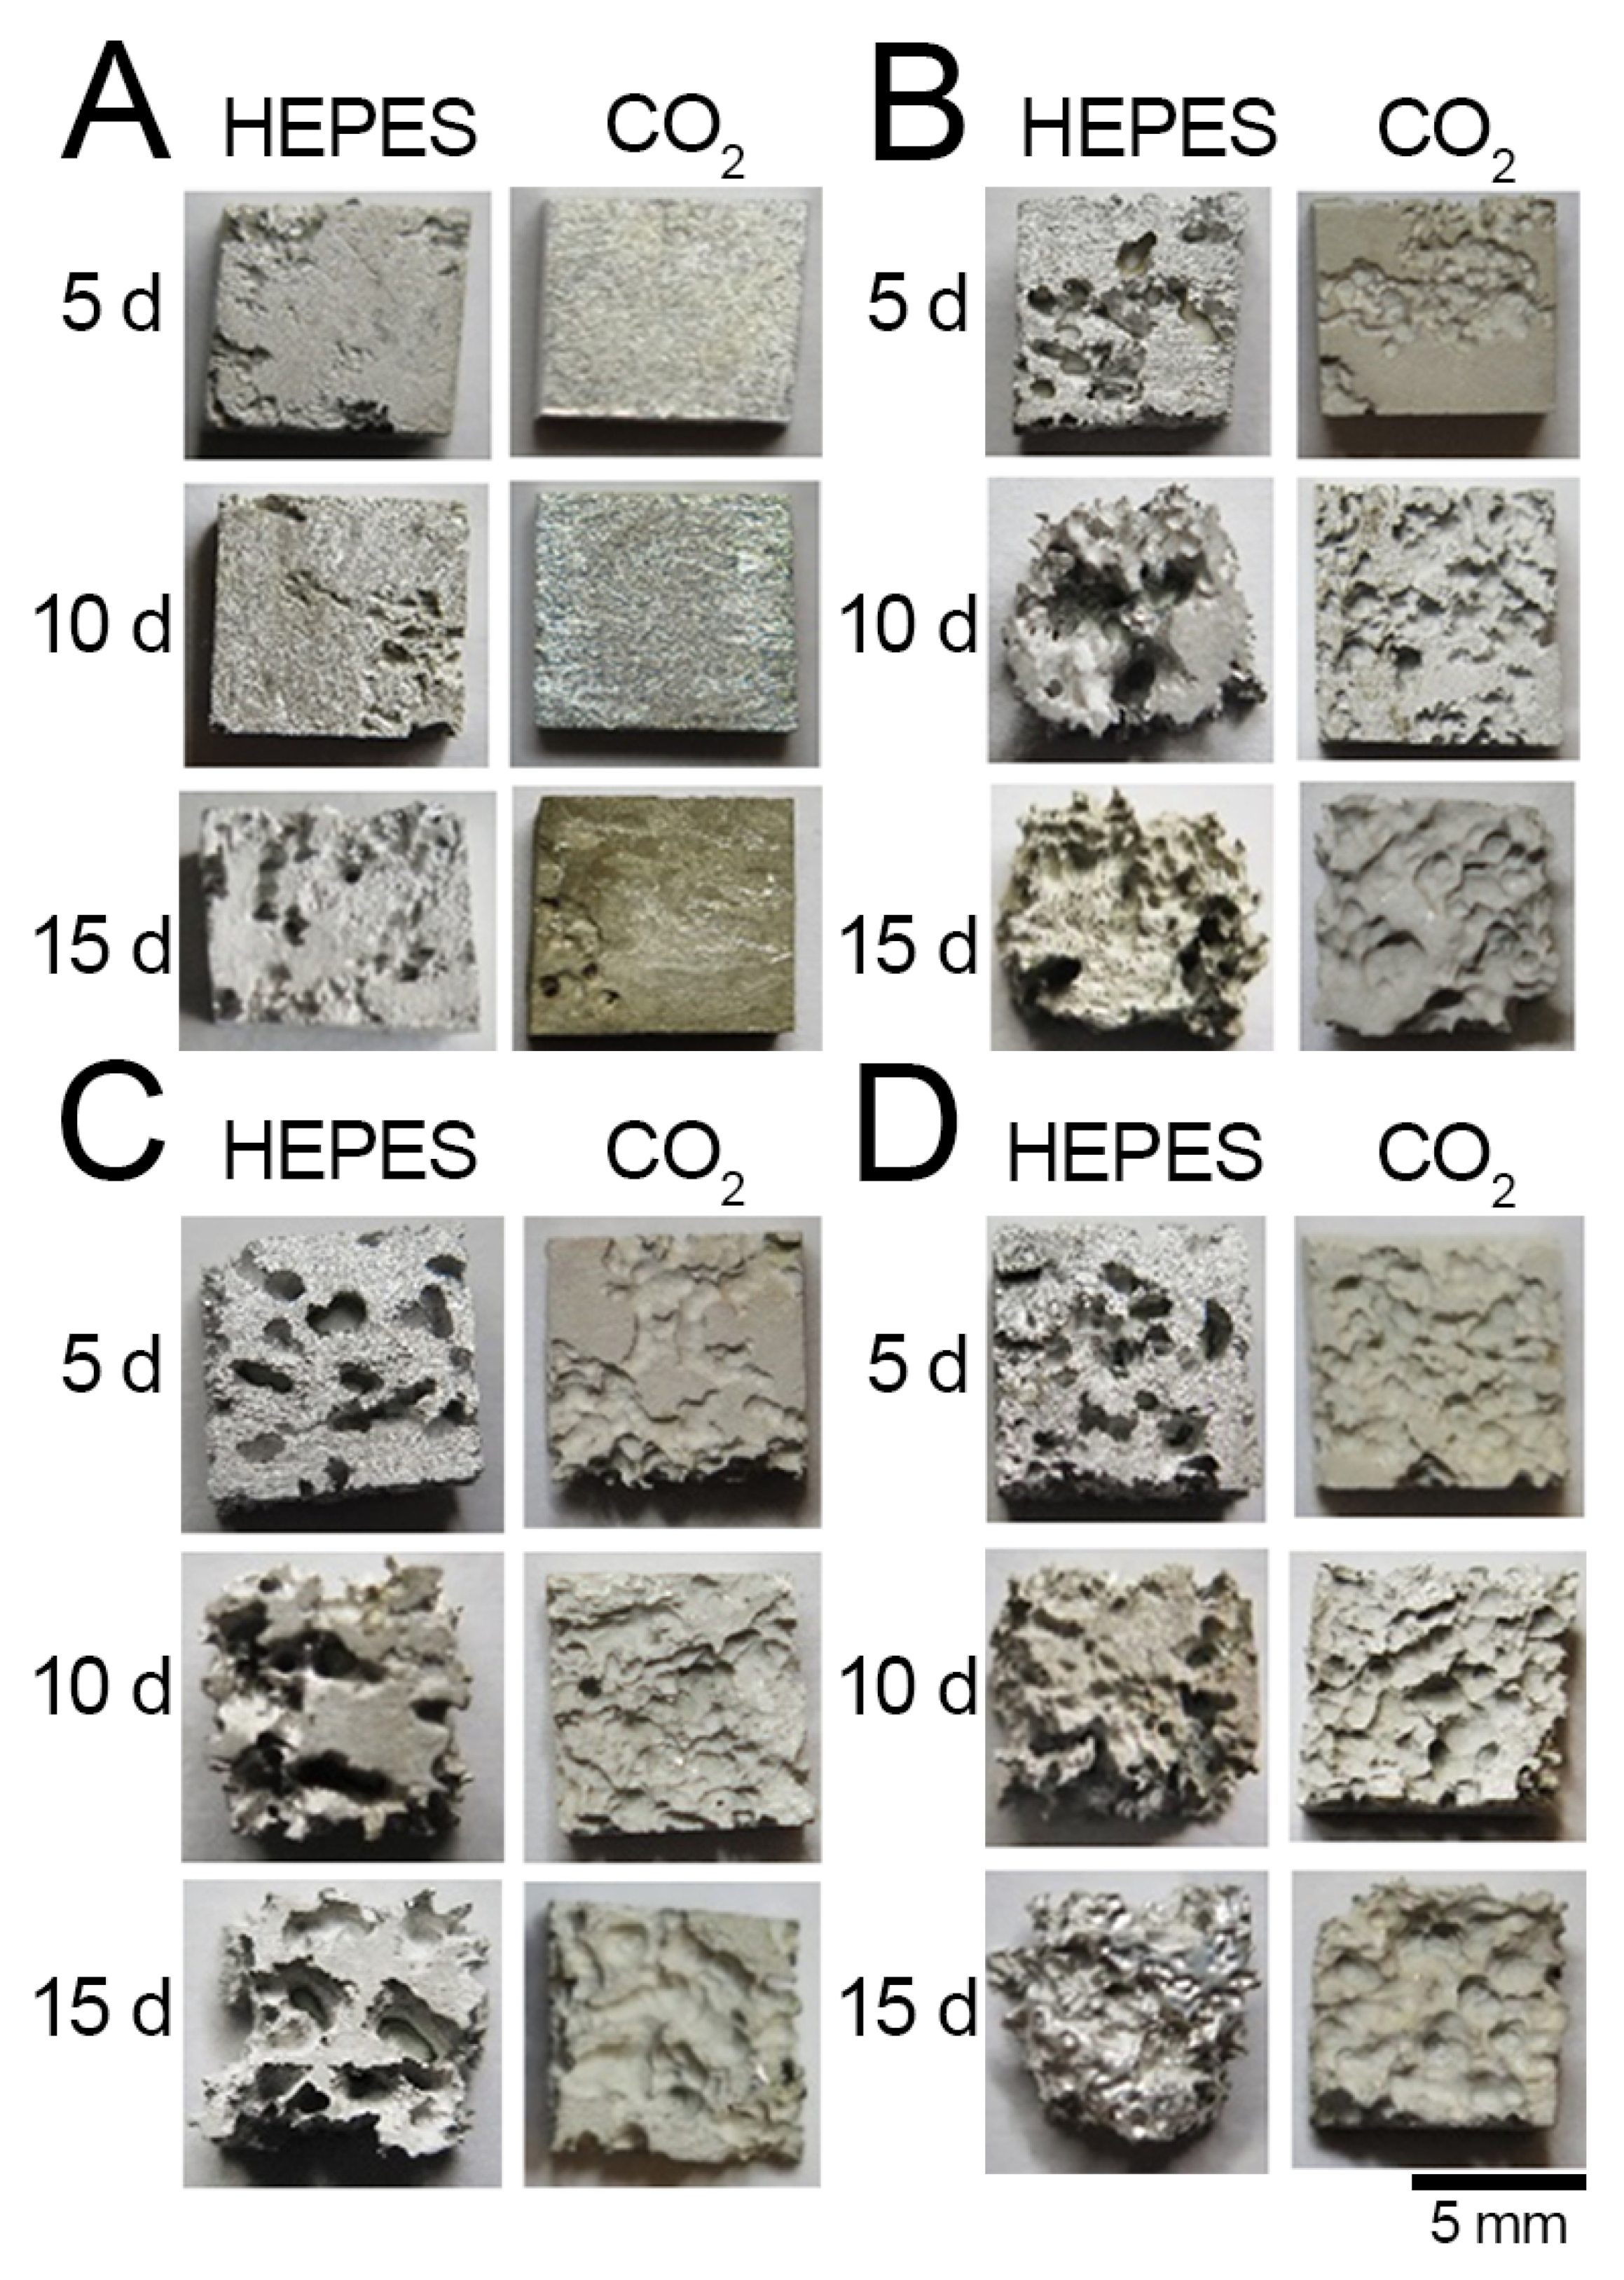
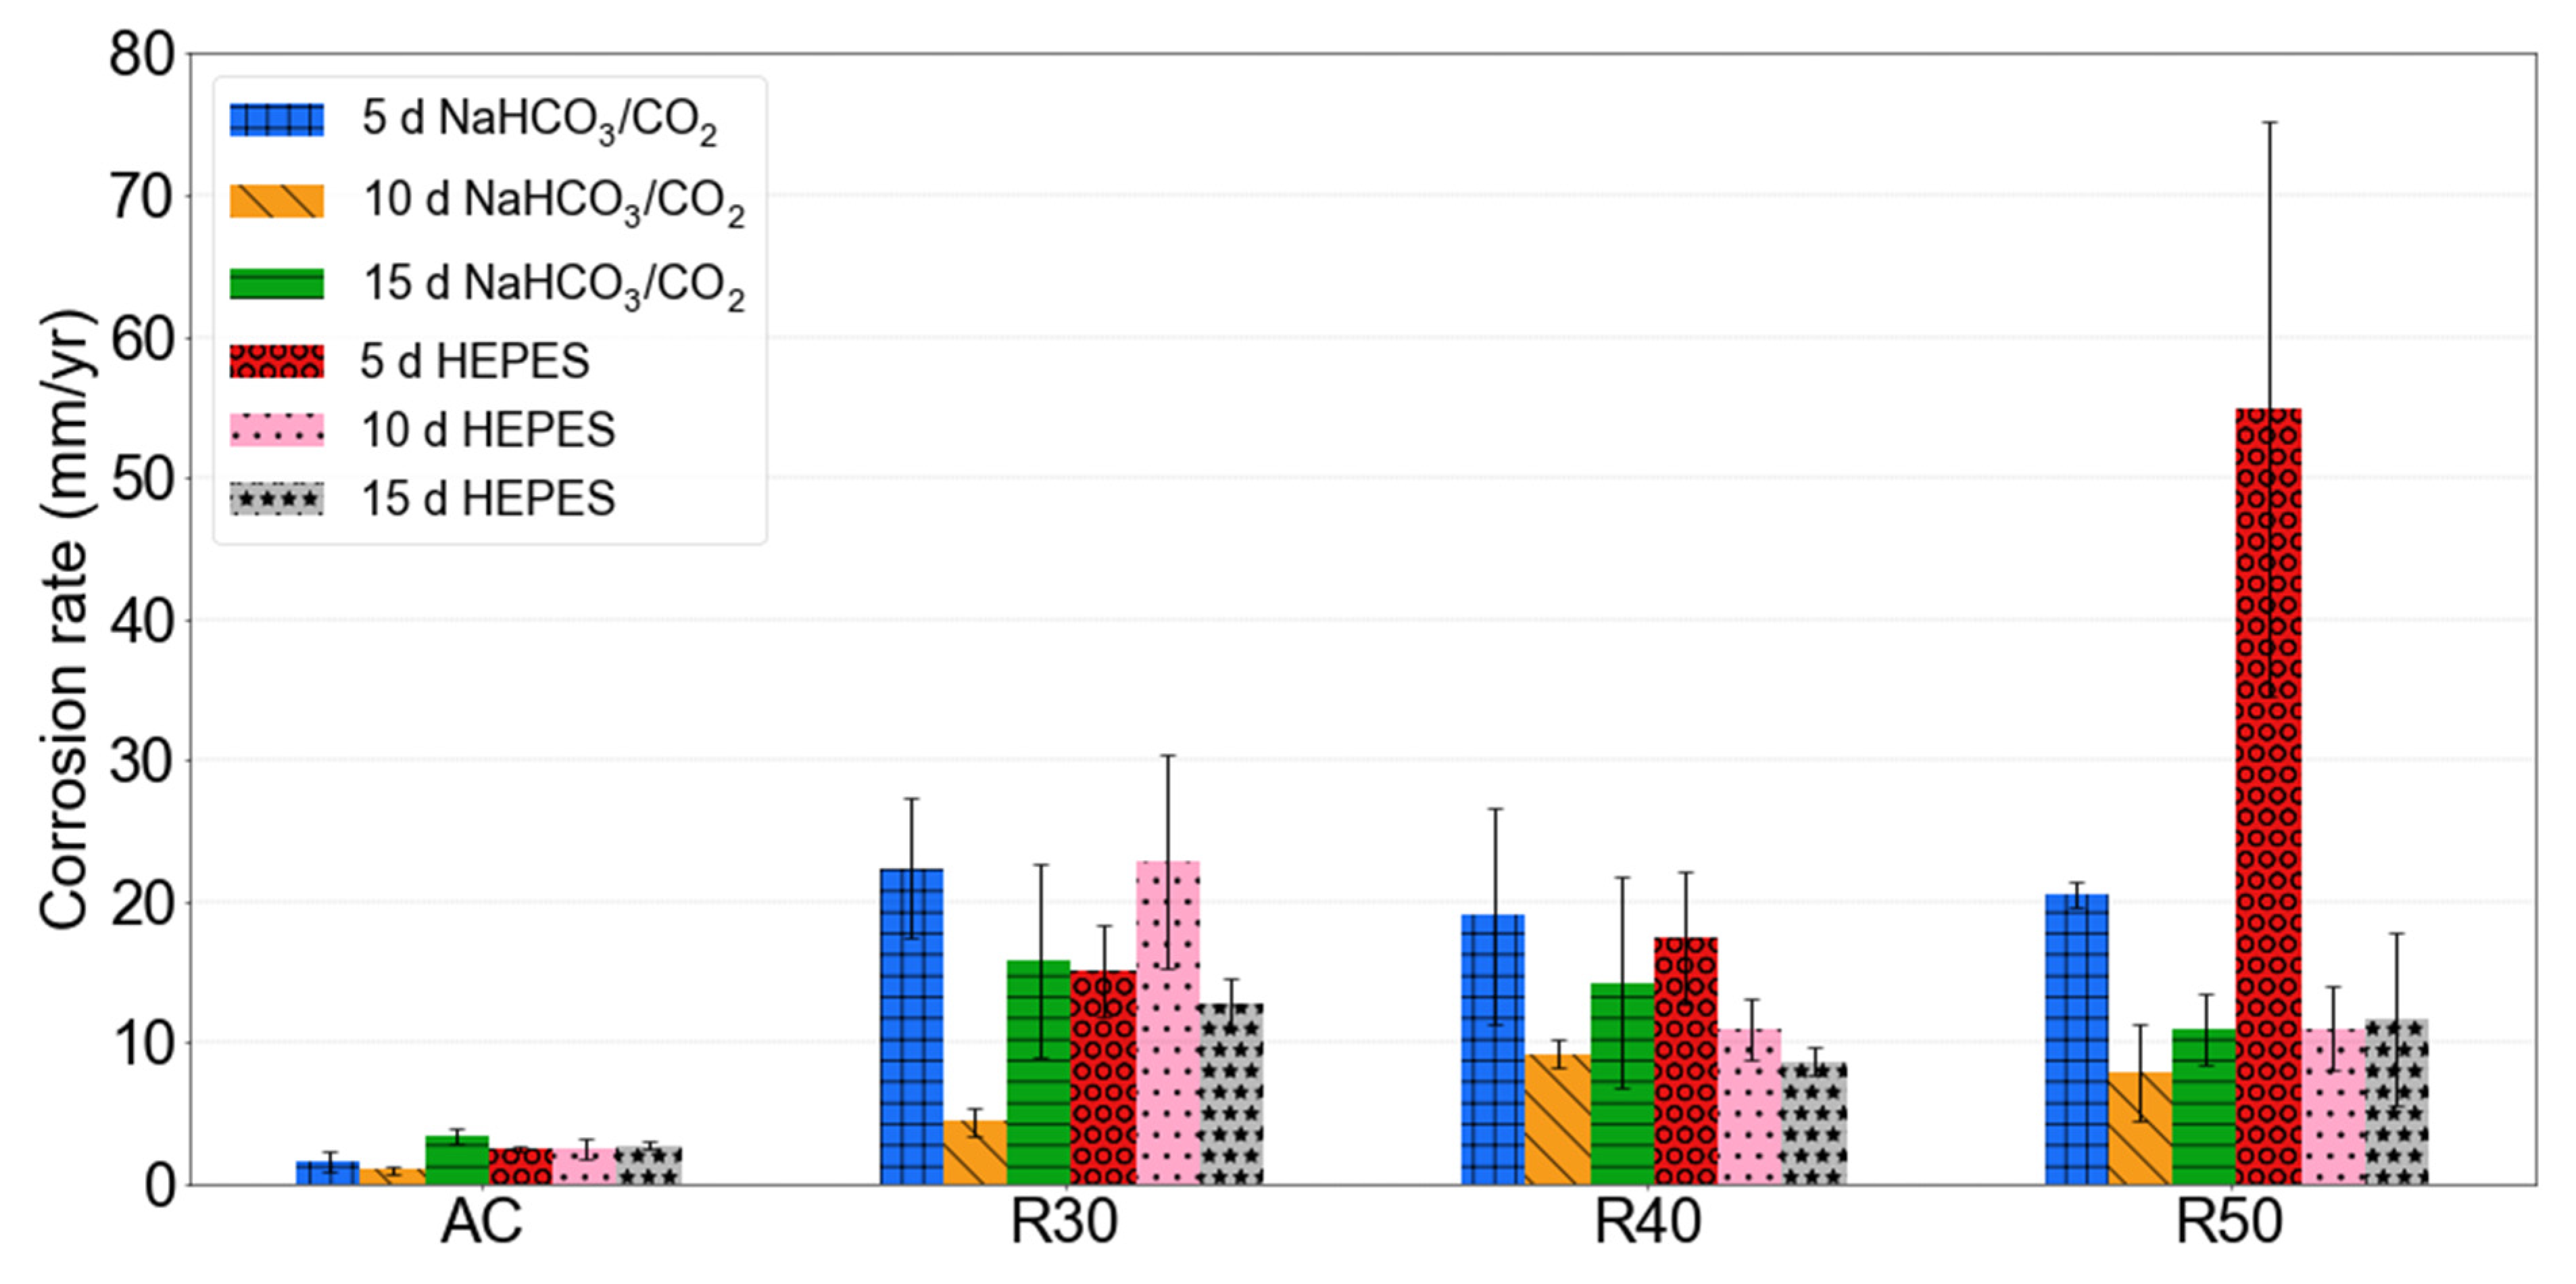
3.3. Mass Loss Results

AC specimens exhibited lower corrosion rates than RX samples over all immersion time intervals. The corrosion rates of AC in NaHCO3/CO2-buffered EBSS were 1.62, 1.02 and 3.44 mm/yr after 5, 10 and 15 d, respectively (Figure 4). AC samples in HEPES exhibited corrosion rates of 2.48, 2.51 and 2.77 mm/yr after 5, 10 and 15 d, respectively. These results are comparable to those of Cai et al. who observed a corrosion rate of 2.01 mm/yr for AC Mg-1Zn immersed in SBF for 5 d [36].
All RX specimens had relatively similar corrosion rates after 5 d in NaHCO3/CO2-buffered EBSS. The corrosion rates of R30, R40 and R50 after 5 d in NaHCO3/CO2 were 22.38, 19.03 and 20.50 mm/yr, respectively (Figure 4). However, there was more variation in the corrosion rates of RX samples immersed in HEPES-buffered EBSS. R30, R40 and R50 had corrosion rates of 15.18, 17.47 and 54.87 mm/yr, respectively, after 5 d in HEPES.
After 10 d the corrosion rate of all RX samples immersed in NaHCO3/CO2-buffered EBSS decreased from the rate measured after 5 d. The same trend was observed for R40 and R50 immersed in HEPES-buffered EBSS, however, the 10 d corrosion rate of R30 was higher than after 5 d.
The corrosion rate of RX specimens in NaHCO3/CO2-buffered EBSS increased between 10 and 15 d, while there was no obvious trend for the specimens immersed in HEPES-buffered EBSS. The corrosion rate decreased between 10 and 15 d for R30 and R40 immersed in HEPES and slightly increased for R50.
Although corrosion studies of rolled Mg-Zn alloys are lacking in the literature, the corrosion rates of all RX samples were much higher than those reported in the literature for similar alloys systems that underwent thermomechanical processing. Li et al. observed a corrosion rate of ≈ 1.8 mm/yr for extruded Mg-1Zn-0.2Sr immersed in SBF without a buffer [61].

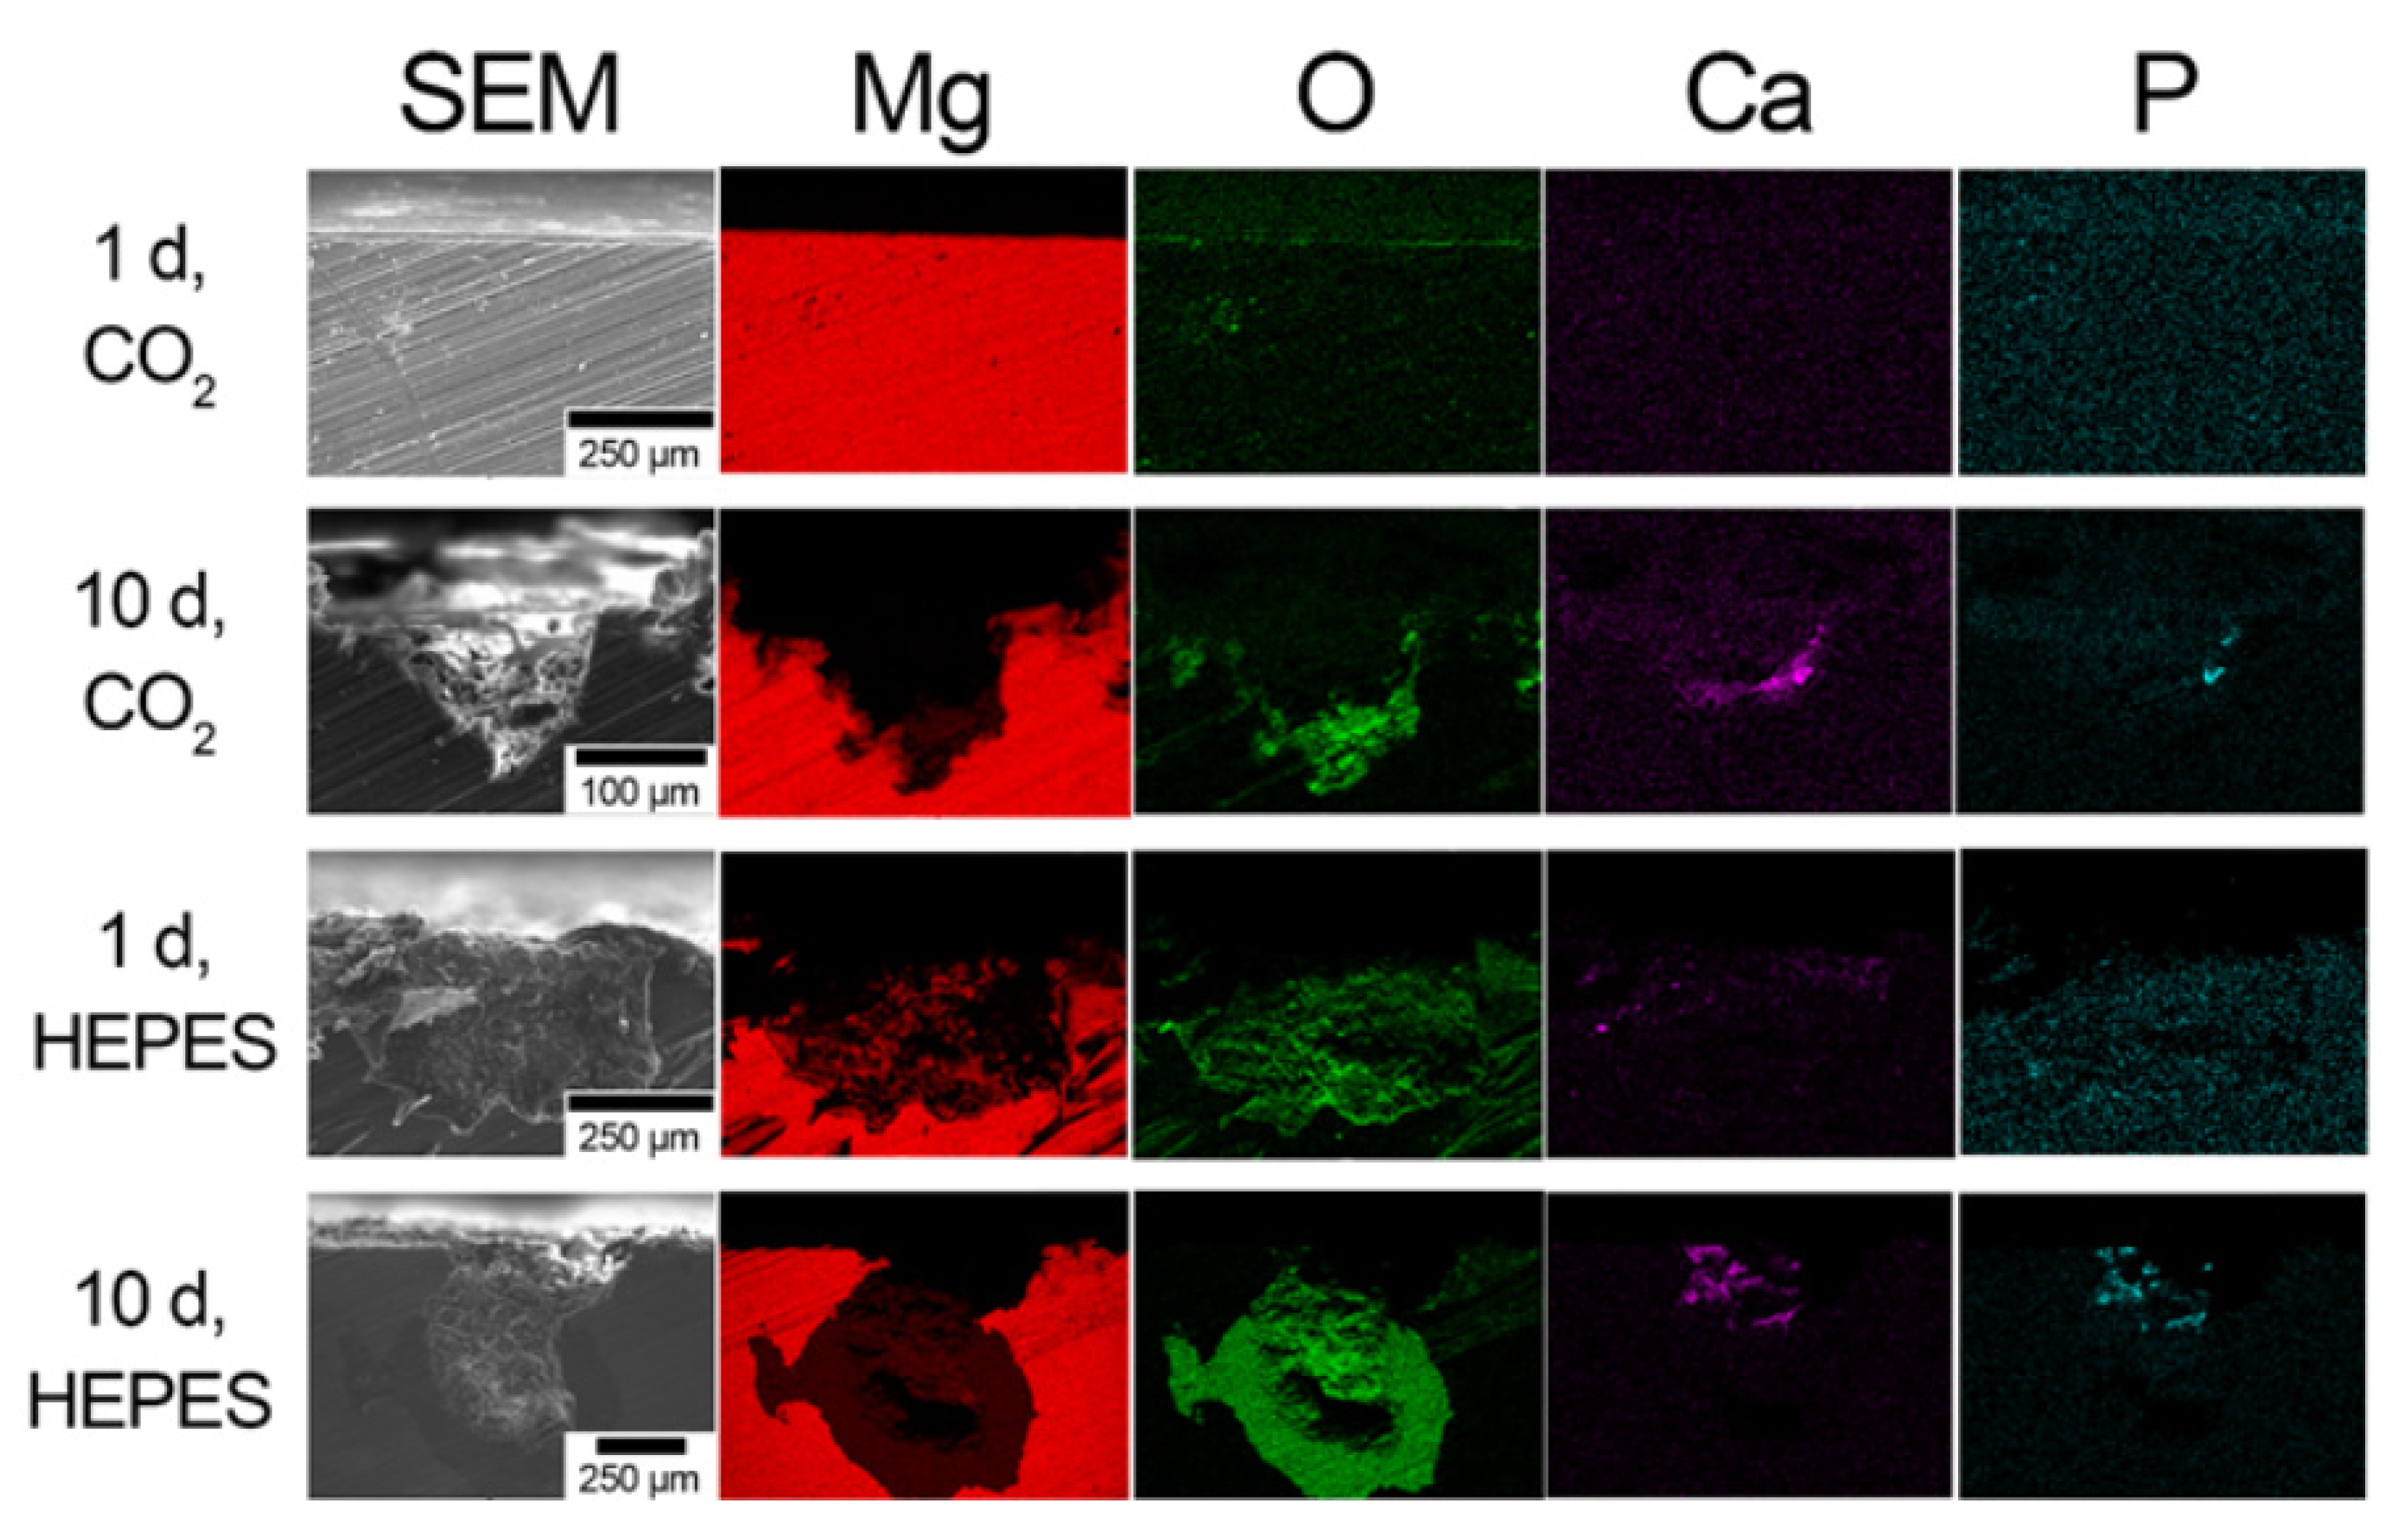
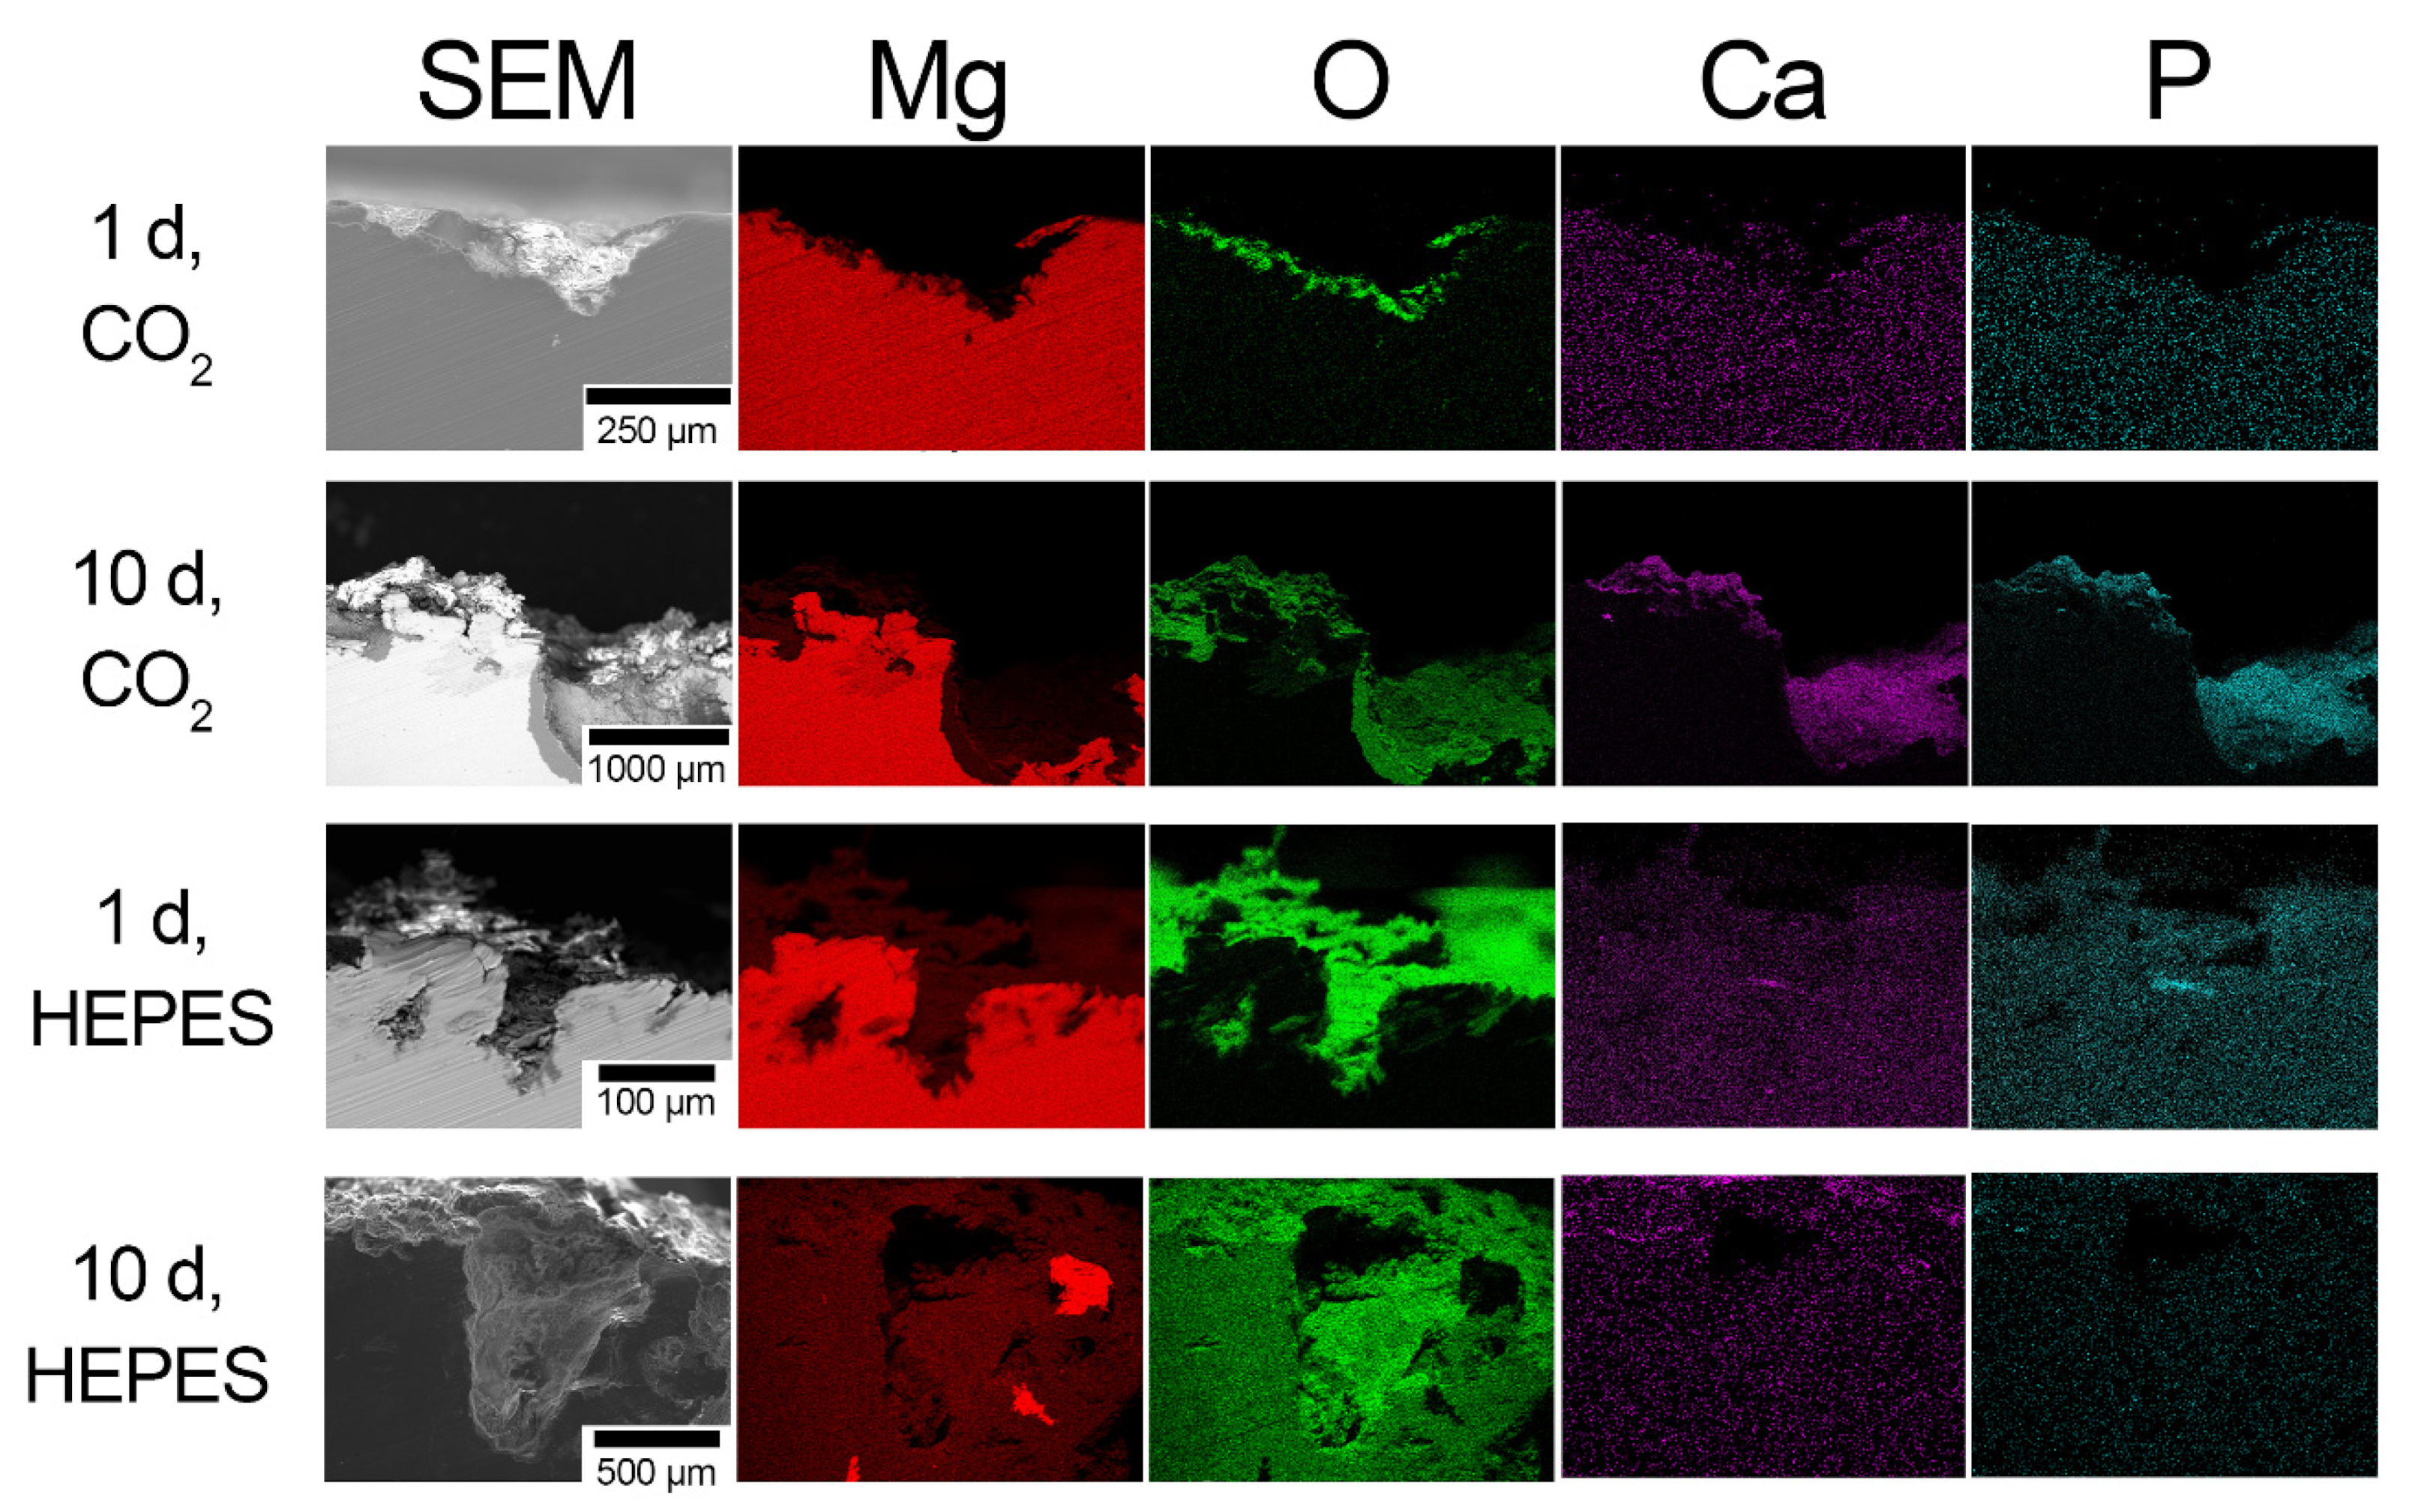
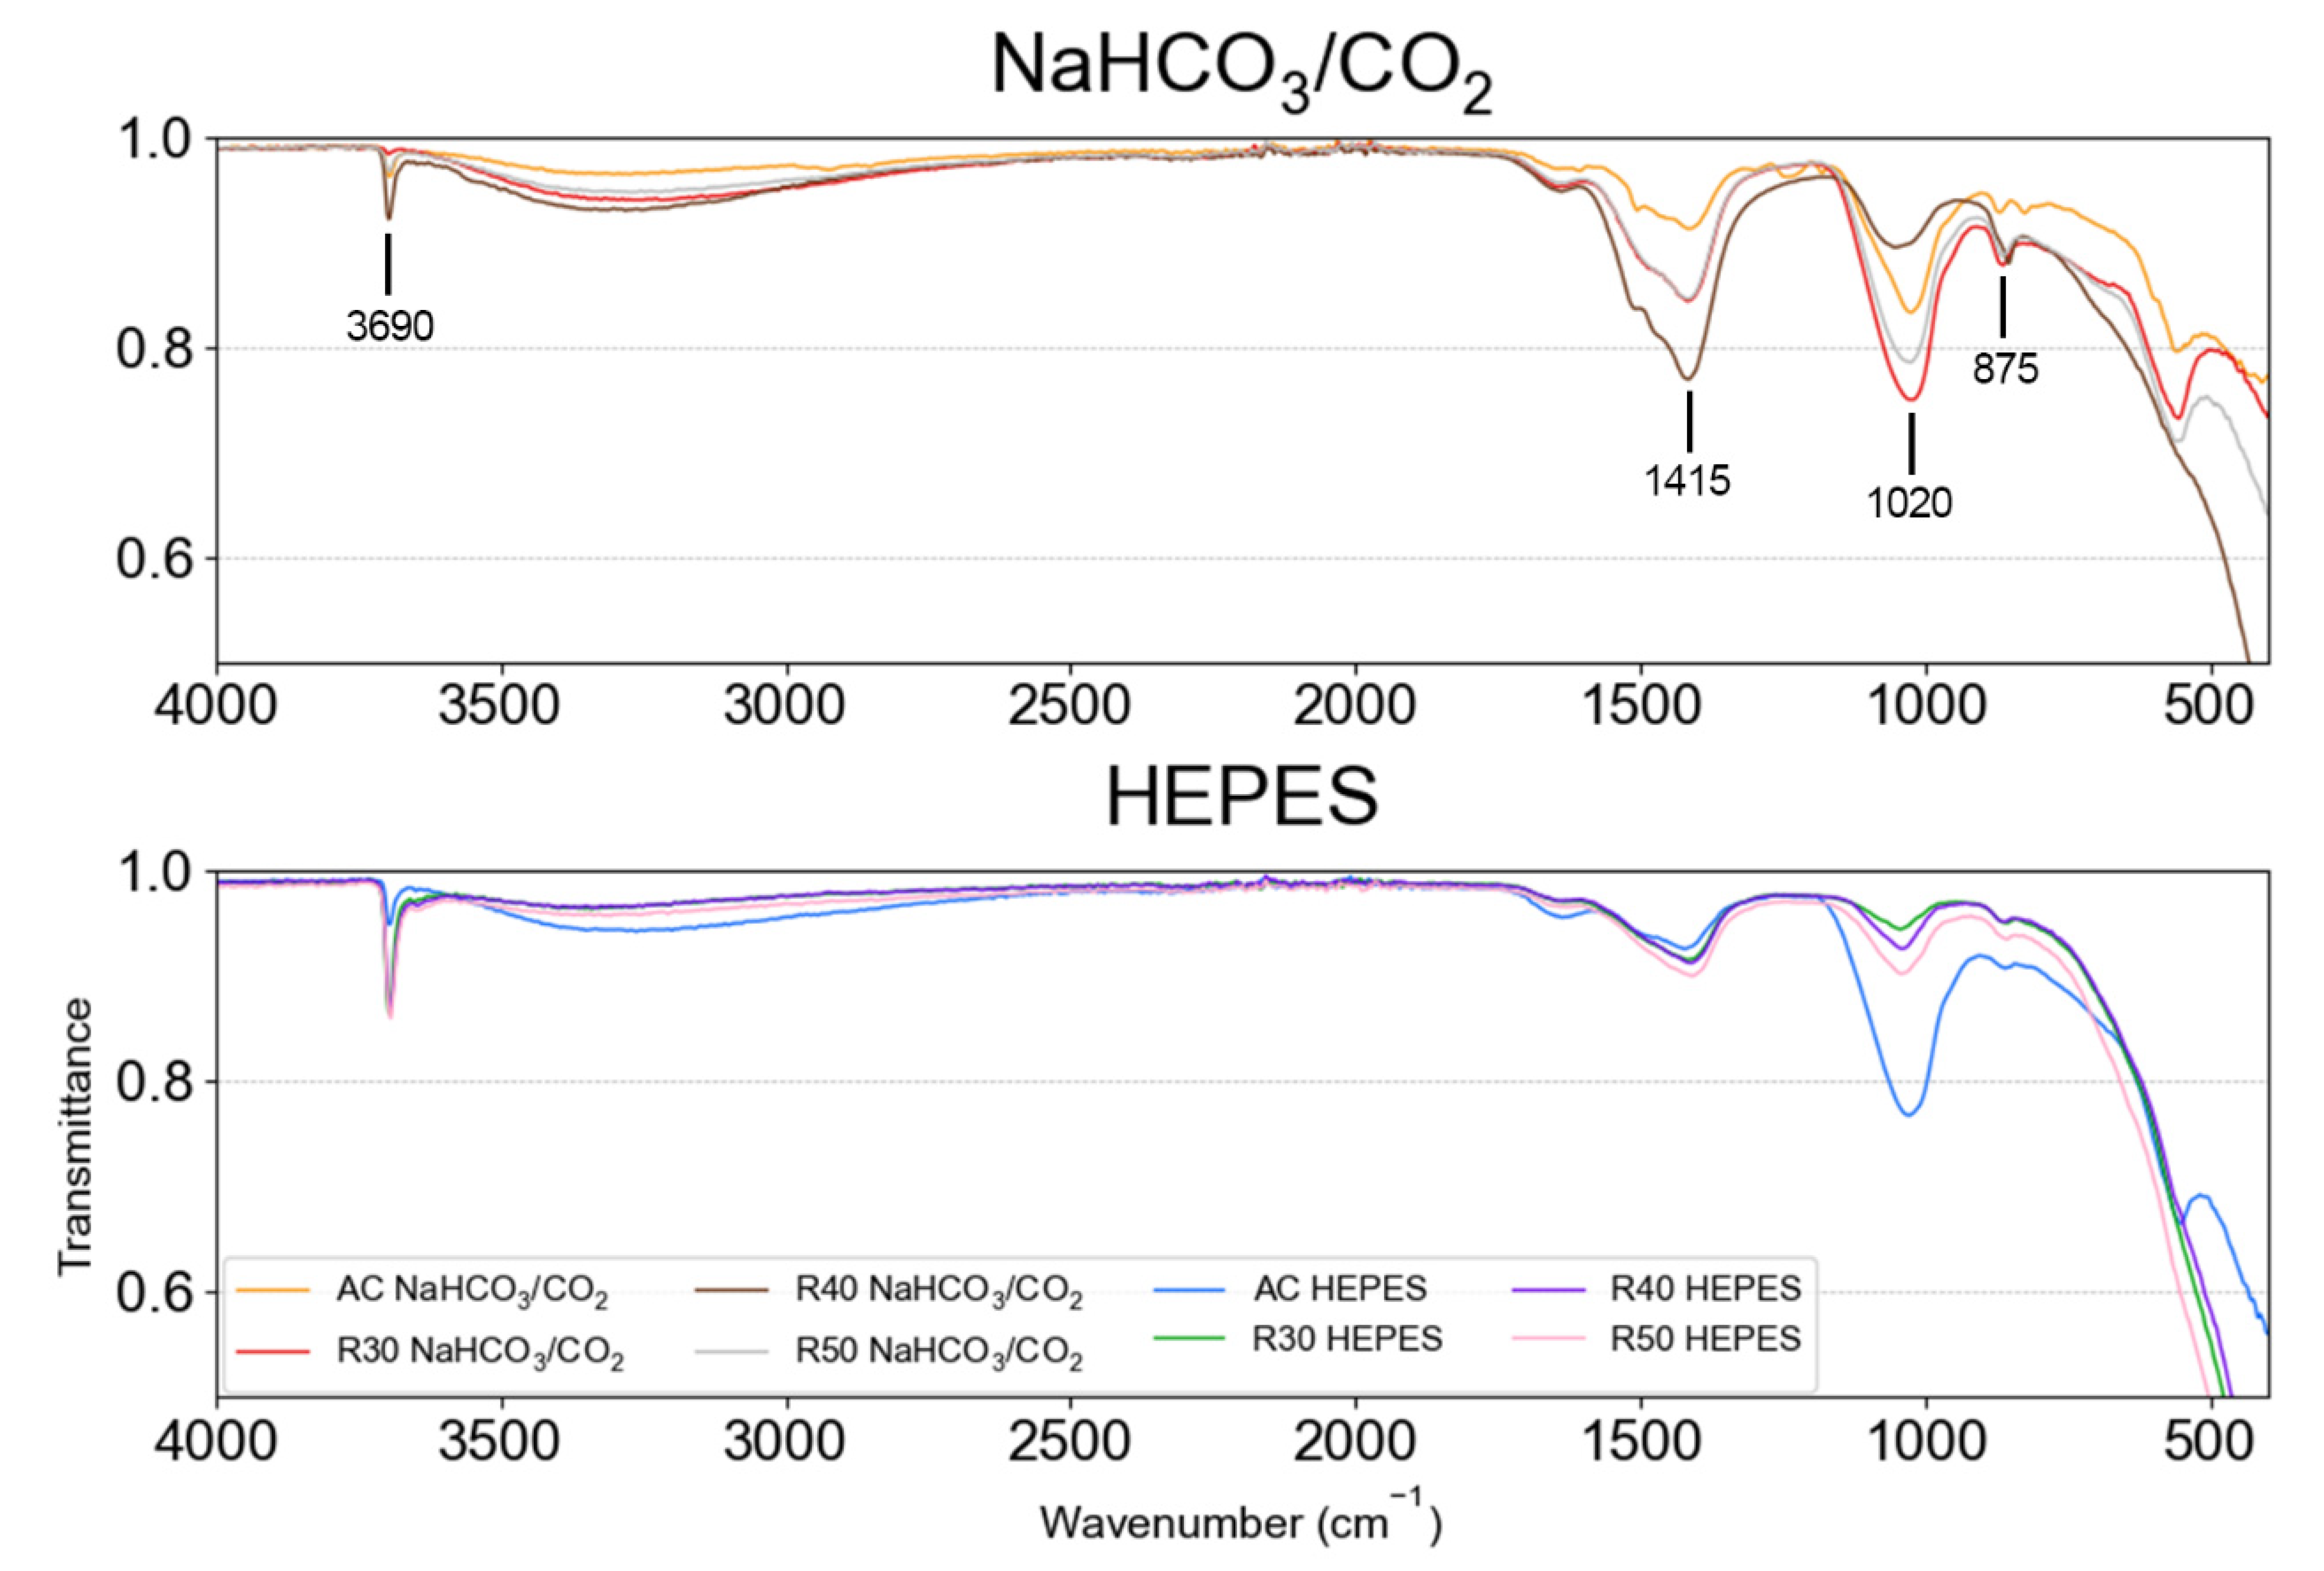
3.4. Analysis of Corrosion Products from Immersion in EBSS

Figure 5 and Figure 6 display elemental EDS maps taken from the transverse plane following immersion in NaHCO3/CO2 and HEPES-buffered EBSS after 1 and 10 d immersion for AC and R50 specimens, respectively. Pitting corrosion was not visible on the surface of the AC specimen immersed in NaHCO3/CO2-buffered EBSS after 1 d, whereas pits up to ~250 µm deep were visible for the specimen immersed in HEPES-buffered EBSS (Figure 5). After 10 d immersion the pitted regions extended up to ~500 and ~150 µm for the AC specimens in HEPES and NaHCO3/CO2-buffered EBSS, respectively. Furthermore, the O-rich region extended up to ~200 µm past the base of the pitted regions in HEPES buffered specimens after 10 d. Conversely, the pitted regions in the AC specimens in NaHCO3/CO2-buffered EBSS lack the presence of the O-rich region extending into the base metal. The precipitation of Ca and P were present on specimens in both HEPES and NaHCO3/CO2-buffered EBSS after 10 d. However, the Ca and P were deposited towards the surface of the pitted region in HEPES-buffered EBSS, while they were observed to be closer to the base of the pit in NaHCO3/CO2-buffered EBSS.
Short term immersion (1 d) of R50 in EBSS resulted in similar surface corrosion layers and pitting, regardless of the buffer system used (Figure 6). The pitted regions of R50 were up to 200 µm deep after short term immersion (1 d) in both NaHCO3/CO2-buffered and HEPES-buffered EBSS (Figure 6). The thickness of the Mg/O-rich layer around the pit grew to ~200 µm in NaHCO3/CO2-buffered EBSS with immersion times up to 10 d, while that in the HEPES-buffered EBSS increased to ~1000 µm into the base metal (Figure 6). The shape of the pits on the surface of R50 in HEPES-buffered EBSS were narrower after both 1 and 10 d immersion.
A dual-layered coating was observed on the pits of R50 samples after 10 d immersion in both HEPES and NaHCO3/CO2-buffered EBSS. The dual-layered structure was composed of a Mg/O-rich base layer and Ca/P-rich upper layer. The Ca/P-rich coating was distributed homogeneously over the entire surface of RX samples that have been immersed in NaHCO3/CO2-buffered EBSS for 10 d (Figure 6). In contrast, the Ca/P-rich coating on samples immersed in HEPES-buffered EBSS for 10 d was present almost exclusively on the surface in smaller amounts. (Figure 6). Similarly, Torne et al. demonstrated that pitting in pure Mg was decreased in a NaHCO3/CO2-buffered medium due to an increase in CaP precipitation after the initial formation of the MgO and Mg(OH)2 layers [12]. Corrosion resistance was decreased for samples that were immersed in a HEPES-buffered medium due to the instability of the MgO and Mg(OH)2 layers, and increased diffusion of aggressive chloride ions [12]. The corrosion morphology described above for R50 is consistent with observations of R30 and R40. EDS maps of R30 and R40 can be found in the Supplementary Materials.
The FTIR spectra of the corrosion products of AC and RX after an immersion time of 15 d exhibited an absorption band at 3690 cm−1, indicating the presence of hydroxide groups associated with Mg(OH)2 (Figure 7) [62]. The corrosion products collected from AC and RX were also composed of carbonates ( CO 3 2 ) due to the presence of absorption bands at 875 [63] and 1415 cm−1 [12]. RX samples immersed in NaHCO3/CO2-buffered EBSS yielded the most prominent carbonate bands.

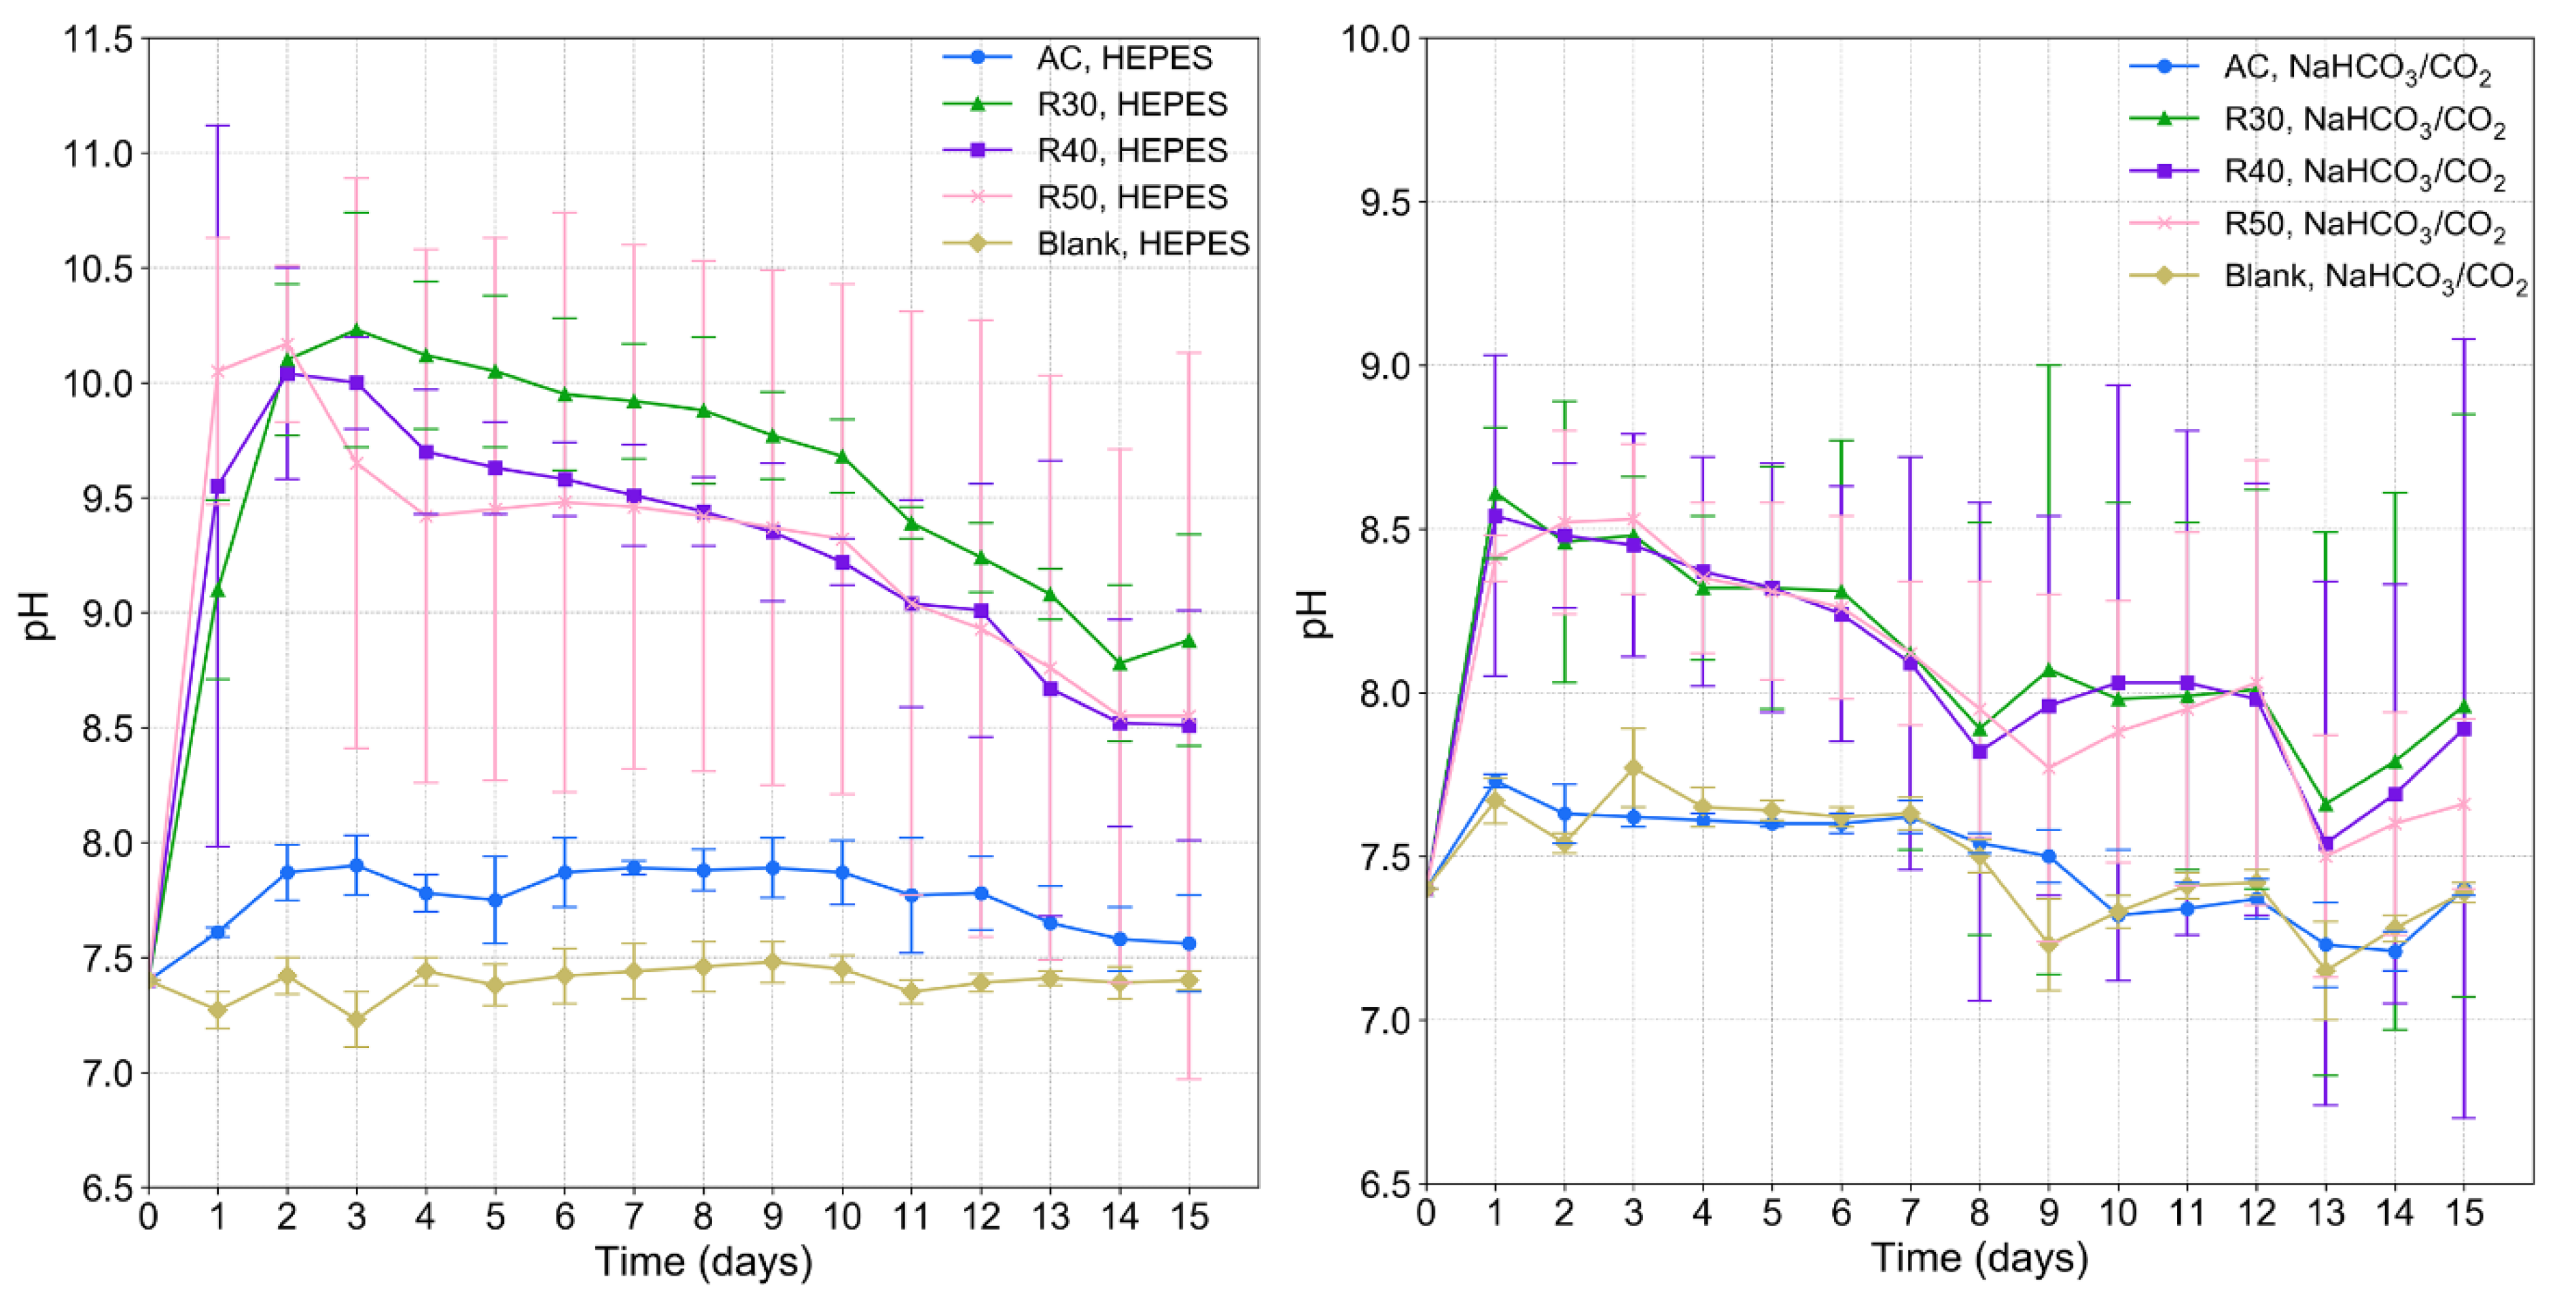
3.4.1. Effect of Buffer Type and Microstructure on the pH of the Corrosion Medium during Immersion Testing in EBSS

Generally, the average pH of the corrosion medium increased above the physiological range of 7.4–7.6 over the first 48 h of immersion testing (Figure 8). The pH of the medium then began to decrease after 48 h of immersion testing (Figure 8). The average pH of the HEPES-buffered EBSS containing the RX samples increased to over 10, while that in the NaHCO3/CO2-buffered EBSS increased to ~8.5. The pH of the medium containing the AC material increased to ~7.7 and ~7.9 with the NaHCO3/CO2 and HEPES buffer systems, respectively. Overall, the pH of the EBSS during the immersion testing of the RX samples was significantly lower when using the NaHCO3/CO2 buffer compared with using the HEPES buffer. R30 and R40 displayed a significantly lower pH in NaHCO3/CO2-buffered EBSS than in HEPES-buffered EBSS between 2 and 10 d immersion. R60 samples did not display significant differences for immersion times longer than 2 d, as data collected for the sample in HEPES buffered EBSS had a large margin of error. The pH of the EBSS during the immersion testing of the AC material remained the lowest amongst all samples when using the NaHCO3/CO2 buffer.

3.4.2. Effect of Thermomechanical Processing and Buffer Type on the Corrosion Potential and Current of AC and RX

In general, the corrosion potential (Ecorr) of the samples was slightly higher for those immersed in NaHCO3/CO2-buffered EBSS than in HEPES-buffered EBSS (Figure 9). AC and R30 in NaHCO3/CO2-buffered media had the most noble Ecorr values of −1627 ± 61 mV and −1653 ± 6 mV, respectively (Table 3).
The Ecorr of the AC sample in NaHCO3/CO2-buffered EBSS is comparable to the observations of Gu et al. [35]. The authors reported an Ecorr of −1609 mV for AC Mg-1Zn immersed in Hanks solution [35]. However, Gu et al. reported a more positive Ecorr for rolled Mg-1Zn which disagrees with the results in the current work, in which RX samples exhibited a more negative Ecorr than AC samples in the same buffer in all but one case. The AC and R50 samples in HEPES-buffered EBSS exhibited Ecorr values of −1686 ± 7 and −1681 ± 12 mV, respectively.
Samples immersed in the same buffer exhibited similar Icorr regardless of alloy processing (i.e., AC or rolled), however, large differences in Icorr were observed for identical samples in different buffer systems. Samples in HEPES-buffered EBSS displayed a corrosion current (Icorr) of up to 7 times higher than that of their NaHCO3/CO2-buffered counterparts (Table 4). The larger Icorr observed in HEPES-buffered EBSS compared to NaHCO3/CO2-buffered EBSS agrees with the results of Kannan et al. [11]. The authors report that a concentration of 25 mM HEPES in EBSS resulted in an Icorr of 28.5 ± 6.42 µA·cm−2 compared to 6.25 ± 2.5 µA·cm−2 (4.5 times lower) in NaHCO3/CO2-buffered EBSS for an AC pure Mg sample. The same concentration of HEPES was employed in the current work and comparable increases in Icorr were observed.
The sudden increase in anodic current, referred to as the breakdown potential (Ebreak), was observed for all samples and indicates an increase in pitting corrosion susceptibility [64] (Figure 9). However, samples in NaHCO3/CO2-buffered EBSS exhibited an Ebreak at a more positive potential than those immersed in HEPES-buffered EBSS, suggesting that localised corrosion can occur more easily on the Mg-1Zn alloy in the presence of HEPES than in the presence of NaHCO3/CO2. This disagrees with the observations of Kannan et al. who report a more positive Ebreak for pure Mg in 25 mM HEPES compared to pure Mg in NaHCO3/CO2 [11]. The authors did not discuss a possible mechanism for the observed change in Ebreak.
Both the anodic and cathodic activity of the alloy were higher in the presence of HEPES than in NaHCO3/CO2, as demonstrated by the shift in the anodic and cathodic portions of the polarisation curves (Figure 9). The lower cathodic activity in NaHCO3/CO2 was likely due to the precipitation of the CaCO3 and MgCO3 insoluble salts on the surface of the samples, which have been identified as cathodic inhibitors [65]. The presence of these species was confirmed by FTIR (Figure 7).

4. Discussion

4.1. The Effect of Microstructure on the Corrosion of Mg-1Zn

Although the total rolling reduction was similar for all RX specimens (~75%), the annealing procedure between rolling passes likely caused recrystallisation of the microstructures. Therefore, it is probable that the strain induced by the final pass dictated the characteristics of the final microstructure. TMP Mg alloys that display a fine-grained microstructure tend to exhibit more homogeneous surface corrosion and lower corrosion rates compared to their AC counterparts [23,66,67]. However, even though R50 exhibited a finer grain size than R30 and R40, no obvious change in corrosion performance was observed and the AC samples performed the best in corrosion experiments despite having a large grain size. Furthermore, TMP may introduce residual stresses and surface defects that can increase the corrosion rate [20,21,68]. In this work, the rolling process produced samples with lower corrosion resistance than the AC samples. Song et al. observed similar results a study of the corrosion of pure Mg following equal channel angular extrusion (ECAE). In their work, AC specimens exhibited lower corrosion activity than the ECAE specimens [20]. The high levels of deformation resulting from ECAE increased the number of sub-grain boundaries and dislocations, providing a greater driving force for corrosion [20]. Zheng et al. observed an increase in the corrosion rate of Mg-2.65Zn due to tensile and compressive stresses [69]. The dislocations and twins present in the microstructure following deformation caused an acceleration of anodic activity due to localised reductions in electrochemical potential [69]. Samples subjected to 16% compressive strain and 10% tensile strain exhibited ~2 and 1.5 times mass loss over 72 h, respectively, compared to unstrained samples [69]. In the current study, the surface of the alloy parallel to the rolling direction was almost completely recrystallised, while the surface normal to the rolling direction (transverse plane) exhibited numerous twin and sub-grain boundaries which may be an indicator of residual strain. For example, the microstructure of R30 consisted of ~80% recrystallised grains at the surface parallel to the rolling direction, while only ~50% of grains were recrystallised normal to the rolling direction. This may be an explanation for the increased corrosion of the rolled samples compared to samples in the AC condition.
Another plausible explanation for the higher corrosion rate of RX samples compared to AC samples is the presence of impurities. The mass loss corrosion rates (CRm) all samples studied herein were higher than the reported intrinsic corrosion rate of HP Mg (0.4 to 0.8 mm/yr) [70]. The AC samples in NaHCO3/CO2-buffered media exhibited the lowest measured CRm of 1.02 ± 0.32 mm/yr after 10 d of immersion. It is well documented that Fe can accelerate the corrosion rate of Mg alloys due to its low solubility in Mg that can lead to the creation of micro-galvanic corrosion cells [71,72]. However, the alloy used in the current study had an Fe level less than 20 ppm as it was cast using HP Mg (Table 1). Therefore, Fe contamination during rolling may be responsible for the increased corrosion rate observed for RX samples as AC samples had no contact with the rolling mill. While the surfaces were not examined for possible Fe contamination in the current work, the analysis will be included in future research and 10 1 ¯ 0 .
The effect of anisotropic texture evolution on corrosion resistance has been well documented in the literature for the AZ31 alloy [26,27,28,29] and pure Mg [30,73]. The increased corrosion resistance of the basal planes is thought to be due to their relatively high atomic packing and stronger atomic bonding [74]. Furthermore, basal texture may assist in the formation of a more stable passive film compared to the prismatic texture [75]. The activation energy for dissolution of the densely packed (0001) (1.13 × 10¹⁹ atoms/m2) plane is higher than that of the more loosely packed ( 11 2 ¯ 0 ) (6.94 × 10¹⁸ atoms/m2) and ( 10 1 ¯ 0 ) (5.99 × 10¹⁸ atoms/m2) planes [26]. According to the literature, the basal plane is more corrosion resistant than the prismatic planes plane due to its densely packed structure [27,29,74,76]. However, a study by Wang et al. showed more severe corrosion on a AZ31 sample parallel to the extrusion direction, even though it displayed more (0001) orientated grains than the sample normal to the extrusion direction [77]. The authors postulated that the behaviour was due to galvanic action between dissimilarly textured grains on the same surface. Although basal texture made up much of the surface, the few prismatic grains that were present were thought to have acted as local anodes. In the present work, while most of the surface parallel to the RD was (0001) textured, a few grains orientated in the ( 11 2 ¯ 0 ) and ( 10 1 ¯ 0 ) directions were present that could have acted as pit-initiation sites. Corrosion studies of various metallic couplings have shown that galvanic corrosion of the system is proportional to the ratio of cathode to anode area exposed to the electrolyte [78,79]. If a situation arises where there is a large cathodic area and a small anodic area, the anode will be aggressively oxidised because the driving force for oxidation is proportional to the ratio of cathodic to anodic surface areas. In the present study, it is possible that the more noble (0001) grains acted as cathodes, while the more reactive ( 11 2 ¯ 0 ) and ( 10 1 ¯ 0 ) grains act as local anodes. This hypothesis is based on the theoretical dissolution rate of the grains, which predict that the corrosion of prismatic planes is 18–20 times higher than that of basal planes [26]. Galvanic corrosion may have also occurred between dissimilarly textured surfaces of the immersed alloys. Figure 3 shows that corrosion initiated near the edges of RX samples where the heavily basal-textured surface meets the prismatic-textured surface as displayed by the EBSD maps in Figure 1.
The CRm values for RX samples are significantly higher than those reported in the literature for thermomechanically processed Mg alloys with similar compositions, but the corrosion rates obtained from Tafel analyses (CRi) are comparable to those observed in previous studies. For example, Li et al. found the CRm and CRi of extruded Mg-1Zn-0.2Sn to be ≈ 1.8 and 0.5 mm/yr, respectively [61]. While the CRm are generally 2 to 5 times higher in the present study than those reported by Li et al., the CRi values are comparable (Table 4). Furthermore, the CRi values in the present work are similar to those observed in the work of Cai et al. (AC Mg-1Zn, 0.5 mm/yr) [36], Chen et al. (AC Mg-2Zn, 1.95 mm/yr) [80] and Kubasek et al. (AC Mg-1Zn, 0.92 mm/yr) [46]. Therefore, a possible reason for the unusually high CRm observed in this study may lie in the markedly different textures exposed to corrosion media during mass loss tests. It is well known that rolling produces directionally dependent textures with different electrochemical properties in Mg alloys as reported by Song et al. [26], Song [27] and Xin et al. [28] for the AZ31 alloy. On the other hand, extrusion does not result in such severe texture anisotropy because shear forces are applied relatively evenly around the circumference of the ingot. Therefore, the different textures observed on the different surfaces of the RX alloys in the present study may have caused the unusually high mass loss corrosion rates that have not been observed elsewhere.

4.2. The Effect of Buffer System on Corrosion Kinetics

The anodic and cathodic activities of the samples was higher in HEPES, as demonstrated by the shifts in the polarisation curves (Figure 9). The simultaneous increase of both anode and cathode reactions is known as the negative difference effect (NDE) phenomenon, which is described in detail by Song and Atrens [71]. The decrease in cathodic activity observed for samples in NaHCO3/CO2 buffered media was likely due to the precipitation of CaP, and CaCO3 and MgCO3 insoluble salts on the surface, which have been identified as cathodic inhibitors [65]. The presence of these species was confirmed by FTIR (Figure 7). These results are in agreement with the observations of Naddaf Dezfuli et al., who found an increase in the anodic and cathodic activity of pure Mg when immersed in HEPES buffered Dulbecco’s Modified Eagle Medium (DMEM) as opposed to unbuffered DMEM [9].
The higher Ebreak, lower anodic and cathodic activity, and lower Icorr values observed during electrochemical testing suggest that the NaHCO3/CO2 buffer provides more corrosion resistance compared to HEPES for the tested surfaces. There was little difference in the results for samples immersed in the same buffer system. HEPES buffered samples all displayed Ecorr from −1681 ± 13 mV to −1698 ± 2.8 mV, while NaHCO3/CO2 buffered samples showed slightly more varied results, displaying Ecorr between −1627 ± 61 mV and −1708 ± 18 mV. Although the R40 sample immersed in NaHCO3/CO2 buffered media had the most negative Ecorr value, its Icorr was 4.5 times lower than that of R40 in HEPES buffered media. However, this was generally not the case in the mass loss tests, where there was relatively little difference in the corrosion rate of samples immersed in HEPES and NaHCO3/CO2-buffered media.
It is important to note that PDP scans only provide a snapshot of each sample’s corrosion activity, and as time goes on the corrosion kinetics are subject to change [58]. Therefore, the results from electrochemical tests seldom replicate those of the immersion tests [81]. Electrochemical data was only able to be collected from the surface that was parallel to the rolling direction due to dimensional restrictions of the corrosion cell equipment. Since the basal texture is more corrosion resistant than the prismatic texture, the electrochemical data collected is not representative of each sample’s overall corrosion behaviour. Corrosion rates calculated from the Tafel analysis were significantly lower than those obtained from 15 d mass loss experiments (Table 4). Studies that have compared Tafel and immersion testing corrosion rates for similar alloys have highlighted that electrochemical tests typically underestimate the corrosion rate of lean Mg alloys [82]. Furthermore, the derivation of a corrosion rate from the Tafel analysis assumes uniform corrosion across the sample surface [10], which is seldom the case for Mg alloys immersed in chloride-containing media. Although the samples immersed in NaHCO3/CO2-buffered media experience more uniform corrosion than those in HEPES-buffered EBSS, all samples in the current study were subject to a level of pitting corrosion. Therefore, the electrochemical data gathered herein is useful for comparing anode and cathode kinetics, but the data should be treated cautiously when it comes to the calculation of corrosion rate. The importance of utilising multiple corrosion testing methods to analyse the corrosion profile of a given alloy is highlighted by the contrasting results gathered from electrochemical and immersion tests. Regardless, the data obtained is a good indicator that the pH buffer system influenced the corrosion kinetics of the rolled samples as evidenced by the increase in Ebreak and lower Icorr for those samples immersed in NaHCO3/CO2 buffered media.

4.3. The Effect of Buffer System and pH on Corrosion Profile

The initiation of pitting corrosion for all specimens was observed as O-rich corrosion products extending into the base metal, consisting of MgO and Mg(OH)2. However, Mg(OH)2 is known to be susceptible to dissolution in a chloride-containing environment, which can lead to further propagation of the pits [12]. In the present work, the progression of pitting was observed to be faster for specimens immersed in HEPES-buffered EBSS compared to that in NaHCO3/CO2-buffered EBSS. Thus, the dissolution rate of the Mg/O-rich layers within the pits appears to be accelerated by the presence of HEPES, which is supported by the increase in anode and cathode kinetics presented in Figure 9.
The influence of pH on the formation of corrosion layers must be considered to better understand the immersion test results. A high pH has been found to encourage the formation of an insoluble salt layer, but HEPES is known to inhibit the formation of this layer to some extent through increasing the ionic strength of the media [9,10,11]. Naddaf Dezfuli et al. reported less CaP precipitation in HEPES-buffered DMEM than in DMEM without a buffer, believed to be caused by the low local pH maintained by HEPES [9]. In contrast, a high local pH was observed in the current work which would typically result in more CaP precipitation. Furthermore, Kirkland et al. found that HEPES can form complexes with the Mg cations thereby making less Mg available for the formation of protective layers [10]. However, the authors did not comment on the potential effects of pH on the corrosion of pure Mg, as pH was not recorded throughout the immersion duration.
Although the HEPES-buffered samples displayed higher pH levels in the current study, they displayed less insoluble salt precipitation than the NaHCO3/CO2 samples. Therefore, the results suggest that the effect of the HEPES buffer is stronger than that of the media pH in the case of dictating the precipitation of the corrosion layer. In the case of the NaHCO3/CO2-buffered samples, the pH was maintained closer to physiological levels but still encouraged the precipitation of insoluble salts. Although soluble hydroxides produced by the aqueous corrosion of Mg rapidly increase the local pH [83] and support the formation of CaP [84,85], the establishment of the passive corrosion layer is also influenced by the buffer system. The NaHCO3/CO2 buffer likely maintains a lower pH compared to HEPES because it favours the precipitation of the insoluble layer more than HEPES [9,10]. The insoluble layer assists in lowering the pH by limiting the exposure of media to new Mg-1Zn substrate and subsequent creation of more hydroxides due to chloride ingress through the unprotective Mg(OH)2 layer [86]. The difficulty of establishing the insoluble precipitate layer in HEPES buffered media is likely the reason that the pH of RX samples in HEPES rose to between 9.1 and 10.2. Several studies report a lower corrosion rate for Mg immersed in NaHCO3/CO2-buffered media than in HEPES-buffered media due to the precipitation of insoluble species in NaHCO3/CO2-buffered media [10,11,13].
The pH of RX samples in NaHCO3/CO2 buffered media experienced a more conservative increase to between 8.2 and 8.6, which may be due to the suppression of new corrosion and hydroxide formation by insoluble precipitates. The PDP results show a higher Ebreak and lower Icorr for the samples buffered by NaHCO3/CO2 which supports this hypothesis (Figure 9). This hypothesis is also supported by the EDS results (Figure 5 and Figure 6). The O-rich region extended past the end of the pits and into the base metal for specimens immersed in HEPES-buffered EBSS, which was not observed for specimens in NaHCO3/CO2 buffered EBSS. Moreover, the location of Ca and P deposition was different samples immersed in media with different buffer systems. In HEPES buffered samples the Ca and P was precipitated close the surface of the pits, whereas Ca and P were found both in the pitted region and on the surface in specimens immersed in NaHCO3/CO2 buffered EBSS. The high pH seen in HEPES-buffered EBSS may be a result of continuous formation of new Mg(OH)2 caused by a lack of protective Ca and P insoluble precipitates. This is in contrast to the observations of Naddaf Dezfuli et al. who observed a local pH in HEPES-buffered media close to physiological levels, which assisted in limiting the precipitation of insoluble species [9]. However, the pH was only measured for a period of up to 1 hr compared to 15 d in the current work. Moreover, the aforementioned study used AC pure Mg that likely had lower energy surfaces than the RX samples studied herein due to less grain boundary area and crystalline defects. Therefore, it is possible that the combination of a high energy surface and the inhibition of insoluble species precipitation caused by HEPES led to continuous formation and dissolution of hydroxides that raised the pH.
The results suggest that the formation of insoluble salts at the specimen surface is controlled by both environmental and microstructural characteristics. Although the HEPES buffer does not support the growth of insoluble species as well as the NaHCO3/CO2 buffer, the AC sample buffered in HEPES showed a strong peak for PO 4 3 at 1020 cm−1. The other HEPES buffered samples showed the least defined peaks for PO 4 3 , suggesting that the grain refinement of the samples may be somehow further supressing the formation of PO 4 3 for the HEPES buffered samples.
The FTIR results provide further evidence that cathodic inhibiting insoluble salts such as CaCO3 and MgCO3 were present on the surfaces of samples immersed in NaHCO3/CO2 buffer but not on the samples in HEPES-buffered EBSS. This is corroborated by the defined peaks at 875 cm−1 for R30, R40 and R50 immersed in NaHCO3/CO2 buffered media, which were not as visible for those samples in HEPES buffered media (Figure 7).

4.4. Considerations for the In Vitro Screening of Mg Alloys for Biodegradable Applications

Failing to characterise the texture and resulting corrosion profile of all surfaces on a specimen may give a false indication of corrosion resistance of the bulk material. This has important implications for designing orthopaedic implants because all surfaces of the device will be in contact with body fluids in vivo. Furthermore, it is evident that further development of biodegradable Mg implants should focus on alloying and processing procedures that limit texture evolution and may result in severe pitting due to micro-galvanic corrosion. EBSD or X-ray diffraction (XRD) should be utilized to examine the texture of the surfaces to be exposed to media, as precise electrochemical testing of all surfaces may not be possible after processing due to dimensional restrictions. In the current work, electrochemical results were only able to be collected from the rolled surface. The cross-sectional surface was found to have a markedly different texture than the rolled surface, which likely influenced the overall corrosion behaviour of the rolled samples in immersion tests. However, the corrosion kinetics of the cross-sectional surface were not able to be characterised due to dimensional limitations of the electrochemical cell. Researchers should consider these factors during experimental design so that the corrosion mechanisms can be fully understood.

5. Conclusions

The corrosion behaviour of Mg-1 wt. % Zn in EBSS is driven by a combination of microstructural characteristics including grain size and texture, and environmental factors including buffer system and pH. The combined effects of microstructural properties and corrosion conditions complicates the development of a representative in vitro test method and requires further elucidation for the future development of Mg-based biodegradable devices. The following conclusions have been made from the present study.
Despite grain refinement, rolling led to more severe corrosion than in the AC state regardless of buffer system, showing that the microstructure dictated the overall corrosion rate in immersion tests. Further work is needed to investigate the exact cause of this. Possible reasons include residual strain introduced by rolling and galvanic action between dissimilarly textured grains or even between the orthogonal faces of the specimen which displayed markedly different textures.
The total strain induced by the final rolling pass was 30%, 40% and 50% for R30, R40 and R50, respectively. Increasing the strain to 50% resulted in a decreased grain size compared 30 and 40%. In contrast to other studies of biodegradable Mg-Zn alloys, the reduction in grain size did not have a noticeable effect on the overall corrosion rate.
The buffer system dictated the corrosion kinetics and pitting morphology. Specimens buffered by HEPES were subject to more severe localized pitting corrosion due to its inability to support insoluble precipitate formation despite a pH exceeding 10 during the first 72 h of immersion. The CO2 buffer was able to maintain a near-physiological pH and provided an environment that supported the precipitation of insoluble precipitates following the formation of the O-rich layer, thereby limiting the severity of pitting corrosion.

Supplementary Materials

The following supporting information can be downloaded at: https://www.mdpi.com/article/10.3390/cryst12101491/s1, Figure S1: Scanning electron micrographs and corresponding elemental EDS maps taken from the transverse plane of R30 as a function of the buffer system and immersion time in EBSS. Figure S2: Scanning electron micrographs and corresponding elemental EDS maps taken from the transverse plane of R40 as a function of the buffer system and immersion time in EBSS.

Author Contributions

Conceptualization, R.N.W. and M.P.S.; methodology, R.N.W. and M.P.S.; formal analysis, R.N.W.; investigation, R.N.W.; writing—original draft preparation, R.N.W.; writing—review and editing, R.N.W. and M.P.S.; supervision, M.P.S. and G.D.; project administration, M.P.S.; funding acquisition, M.P.S. All authors have read and agreed to the published version of the manuscript.

Funding

This research received no external funding.

Data Availability Statement

No.

Acknowledgments

This work was kindly supported by the New Zealand Health Research Council (HRC). The authors also express their thanks to Matthew Barnett for his assistance in reviewing the manuscript.

Conflicts of Interest

The authors declare no conflict of interest.

References

  1. Staiger, M.P.; Pietak, A.M.; Huadmai, J.; Dias, G. Magnesium and its alloys as orthopedic biomaterials: A review. Biomaterials 2006, 27, 1728–1734. [Google Scholar] [CrossRef] [PubMed]
  2. Zeng, R.-C.; Dietzel, W.; Witte, F.; Hort, N.; Blawert, C. Progress and Challenge for Magnesium Alloys as Biomaterials. Adv. Eng. Mater. 2008, 10, B3–B14. [Google Scholar] [CrossRef]
  3. Windhagen, H.; Radtke, K.; Weizbauer, A.; Diekmann, J.; Noll, Y.; Kreimeyer, U.; Schavan, R.; Stukenborg-Colsman, C.; Waizy, H. Biodegradable magnesium-based screw clinically equivalent to titanium screw in hallux valgus surgery: Short term results of the first prospective, randomized, controlled clinical pilot study. BioMedical Eng. OnLine 2013, 12, 62. [Google Scholar] [CrossRef] [PubMed] [Green Version]
  4. Plaass, C.; Ettinger, S.; Sonnow, L.; Koenneker, S.; Noll, Y.; Weizbauer, A.; Reifenrath, J.; Claassen, L.; Daniilidis, K.; Stukenborg-Colsman, C.; et al. Early results using a biodegradable magnesium screw for modified chevron osteotomies. J. Orthop. Res. 2016, 34, 2207–2214. [Google Scholar] [CrossRef] [PubMed] [Green Version]
  5. Lee, J.-W.; Han, H.-S.; Han, K.-J.; Park, J.; Jeon, H.; Ok, M.-R.; Seok, H.-K.; Ahn, J.-P.; Lee, K.E.; Lee, D.-H.; et al. Long-term clinical study and multiscale analysis of in vivo biodegradation mechanism of Mg alloy. Proc. Natl. Acad. Sci. USA 2016, 113, 716–721. [Google Scholar] [CrossRef] [PubMed] [Green Version]
  6. Sanchez, A.H.M.; Luthringer, B.J.; Feyerabend, F.; Willumeit, R. Mg and Mg alloys: How comparable are in vitro and in vivo corrosion rates? A review. Acta Biomater. 2015, 13, 16–31. [Google Scholar] [CrossRef] [PubMed] [Green Version]
  7. Staiger, M.P.; Feyerabend, F.; Willumeit, R.; Sfeir, C.; Zheng, Y.; Virtanen, S.; Mueller, W.-D.; Atrens, A.; Peuster, M.; Kumta, P.; et al. Summary of the panel discussions at the 2nd Symposium on Biodegradable Metals, Maratea, Italy, 2010. Mater. Sci. Eng. B 2011, 176, 1596–1599. [Google Scholar] [CrossRef]
  8. Gonzalez, J.; Hou, R.Q.; Nidadavolu, E.P.S.; Willumeit-Römer, R.; Feyerabend, F. Magnesium degradation under phys-iological conditions – Best practice. Bioact. Mater. 2018, 3, 174–185. [Google Scholar] [CrossRef] [PubMed]
  9. Dezfuli, S.N.; Huan, Z.; Mol, J.; Leeflang, M.; Chang, J.; Zhou, J. Influence of HEPES buffer on the local pH and formation of surface layer during in vitro degradation tests of magnesium in DMEM. Prog. Nat. Sci. 2014, 24, 531–538. [Google Scholar] [CrossRef] [Green Version]
  10. Kirkland, N.; Waterman, J.; Birbilis, N.; Dias, G.; Woodfield, T.B.; Hartshorn, R.M.; Staiger, M.P. Buffer-regulated biocorrosion of pure magnesium. J. Mater. Sci. Mater. Med. 2012, 23, 283–291. (In English) [Google Scholar] [CrossRef] [PubMed]
  11. Kannan, M.B.; Khakbaz, H.; Yamamoto, A. Understanding the influence of HEPES buffer concentration on the biodeg-radation of pure magnesium: An electrochemical study. Mater. Chem. Phys. 2017, 197, 47–56. [Google Scholar] [CrossRef]
  12. Törne, K.; Örnberg, A.; Weissenrieder, J. The influence of buffer system and biological fluids on the degradation of magnesium. J. Biomed. Mater. Res. Part B Appl. Biomater. 2016, 105, 1490–1502. [Google Scholar] [CrossRef] [PubMed]
  13. Yamamoto, A.; Hiromoto, S. Effect of inorganic salts, amino acids and proteins on the degradation of pure magnesium in vitro. Mater. Sci. Eng. C 2009, 29, 1559–1568. [Google Scholar] [CrossRef]
  14. Schinhammer, M.; Hofstetter, J.; Wegmann, C.; Moszner, F.; Löffler, J.F.; Uggowitzer, P.J. On the Immersion Testing of Degradable Implant Materials in Simulated Body Fluid: Active pH Regulation Using CO2. Adv. Eng. Mater. 2013, 15, 434–441. [Google Scholar] [CrossRef]
  15. Walker, J.; Shadanbaz, S.; Kirkland, N.T.; Stace, E.; Woodfield, T.; Staiger, M.P.; Dias, G.J. Magnesium alloys: Predicting in vivo corrosion with in vitro immersion testing. J. Biomed. Mater. Res. Part B Appl. Biomater. 2012, 100B, 1134–1141. [Google Scholar] [CrossRef] [PubMed]
  16. Ralston, K.D.; Birbilis, N. Effect of Grain Size on Corrosion: A Review. Corrosion 2010, 66, 075005. [Google Scholar] [CrossRef]
  17. Hoog, C.O.; Birbilis, N.; Estrin, Y. Corrosion of Pure Mg as a Function of Grain Size and Processing Route. Adv. Eng. Mater. 2008, 10, 579–582. [Google Scholar] [CrossRef]
  18. Hamu, G.B.; Eliezer, D.; Wagner, L. The relation between severe plastic deformation microstructure and corrosion be-havior of AZ31 magnesium alloy. J. Alloys Compd. 2009, 468, 222–229. [Google Scholar] [CrossRef]
  19. Wang, H.; Estrin, Y.; Fu, H.; Song, G.-L.; Zúberová, Z. The Effect of Pre-Processing and Grain Structure on the Bio-Corrosion and Fatigue Resistance of Magnesium Alloy AZ31. Adv. Eng. Mater. 2007, 9, 967–972. [Google Scholar] [CrossRef] [Green Version]
  20. Song, D.; Ma, A.; Jiang, J.; Lin, P.; Yang, D.; Fan, J. Corrosion behavior of equal-channel-angular-pressed pure magnesium in NaCl aqueous solution. Corros. Sci. 2010, 52, 481–490. [Google Scholar] [CrossRef]
  21. Witecka, A.; Bogucka, A.; Yamamoto, A.; Mathis, K.; Krajňák, T.; Jaroszewicz, J.; Swieszkowski, W. In vitro degradation of ZM21 magnesium alloy in simulated body fluids. Mater. Sci. Eng. C 2016, 65, 59–69. [Google Scholar] [CrossRef]
  22. Saikrishna, N.; Reddy, G.P.K.; Munirathinam, B.; Sunil, B.R. Influence of bimodal grain size distribution on the corrosion behavior of friction stir processed biodegradable AZ31 magnesium alloy. J. Magnes. Alloy. 2016, 4, 68–76. [Google Scholar] [CrossRef] [Green Version]
  23. Aung, N.N.; Zhou, W. Effect of grain size and twins on corrosion behaviour of AZ31B magnesium alloy. Corros. Sci. 2010, 52, 589–594. [Google Scholar] [CrossRef]
  24. Birbilis, N.; Ralston, K.D.; Virtanen, S.; Fraser, H.L.; Davies, C.H.J. Grain character influences on corrosion of ECAPed pure magnesium. Corros. Eng. Sci. Technol. 2010, 45, 224–230. [Google Scholar] [CrossRef]
  25. Chen, J.; Chen, G.; Yan, H.; Su, B.; Gong, X.; Zhou, B. Correlation Between Microstructure and Corrosion Resistance of Magnesium Alloys Prepared by High Strain Rate Rolling. J. Mater. Eng. Perform. 2017, 26, 4748–4759. [Google Scholar] [CrossRef]
  26. Song, G.-L.; Mishra, R.; Xu, Z. Crystallographic orientation and electrochemical activity of AZ31 Mg alloy. Electrochem. Commun. 2010, 12, 1009–1012. [Google Scholar] [CrossRef]
  27. Song, G.-L. The Effect of Texture on the Corrosion Behavior of AZ31 Mg Alloy. JOM 2012, 64, 671–679. [Google Scholar] [CrossRef]
  28. Xin, R.; Li, B.; Li, L.; Liu, Q. Influence of texture on corrosion rate of AZ31 Mg alloy in 3.5wt.% NaCl. Mater. Des. 2011, 32, 4548–4552. [Google Scholar] [CrossRef]
  29. Xin, R.; Luo, Y.; Zuo, A.; Gao, J.; Liu, Q. Texture effect on corrosion behavior of AZ31 Mg alloy in simulated physiological environment. Mater. Lett. 2012, 72, 1–4. [Google Scholar] [CrossRef]
  30. Hagihara, K.; Okubo, M.; Yamasaki, M.; Nakano, T. Crystal-orientation-dependent corrosion behaviour of single crystals of a pure Mg and Mg-Al and Mg-Cu solid solutions. Corros. Sci. 2016, 109, 68–85. [Google Scholar] [CrossRef]
  31. Wellinghausen, N.; Kirchner, H.; Rink, L. The immunobiology of zinc. Immunol. Today 1997, 18, 519–521. [Google Scholar] [CrossRef]
  32. Russell, R.M.; Cox, M.E.; Solomons, N. Zinc and the Special Senses. Ann. Intern. Med. 1983, 99, 227–239. [Google Scholar] [CrossRef]
  33. Tapiero, H.; Tew, K.D. Trace elements in human physiology and pathology: Zinc and metallothioneins. Biomed. Pharmacother. 2003, 57, 399–411. [Google Scholar] [CrossRef]
  34. Yin, D.-S.; Zhang, E.-L.; Zeng, S.-Y. Effect of Zn on mechanical property and corrosion property of extruded Mg-Zn-Mn alloy. Trans. Nonferrous Met. Soc. China 2008, 18, 763–768. [Google Scholar] [CrossRef]
  35. Gu, X.; Zheng, Y.; Cheng, Y.; Zhong, S.; Xi, T. In vitro corrosion and biocompatibility of binary magnesium alloys. Biomaterials 2009, 30, 484–498. [Google Scholar] [CrossRef]
  36. Cai, S.; Lei, T.; Li, N.; Feng, F. Effects of Zn on microstructure, mechanical properties and corrosion behavior of Mg–Zn alloys. Mater. Sci. Eng. C 2012, 32, 2570–2577. [Google Scholar] [CrossRef]
  37. Koç, E.; Kannan, M.B.; Ünal, M.; Candan, E. Influence of zinc on the microstructure, mechanical properties and in vitro corrosion behavior of magnesium–zinc binary alloys. J. Alloys Compd. 2015, 648, 291–296. [Google Scholar] [CrossRef]
  38. Kubasek, J.; Vojtech, D.; Pospisilova, I. Structural and corrosion characterization of biodegradable Mg-Zn alloy castings. Kov. Mater. 2012, 50, 415–424. [Google Scholar]
  39. Ha, H.-Y.; Kang, J.-Y.; Yang, J.; Yim, C.D.; You, B.S. Limitations in the use of the potentiodynamic polarisation curves to investigate the effect of Zn on the corrosion behaviour of as-extruded Mg–Zn binary alloy. Corros. Sci. 2013, 75, 426–433. [Google Scholar] [CrossRef]
  40. Peng, Q.; Li, X.; Ma, N.; Liu, R.; Zhang, H. Effects of backward extrusion on mechanical and degradation properties of Mg–Zn biomaterial. J. Mech. Behav. Biomed. Mater. 2012, 10, 128–137. [Google Scholar] [CrossRef]
  41. Shi, Z.; Hofstetter, J.; Cao, F.; Uggowitzer, P.J.; Dargusch, M.S.; Atrens, A. Corrosion and stress corrosion cracking of ul-tra-high-purity Mg5Zn. Corros. Sci. 2015, 93, 330–335. [Google Scholar] [CrossRef]
  42. Cao, F.; Shi, Z.; Song, G.-L.; Liu, M.; Atrens, A. Corrosion behaviour in salt spray and in 3.5% NaCl solution saturated with Mg(OH)2 of as-cast and solution heat-treated binary Mg–X alloys: X = Mn, Sn, Ca, Zn, Al, Zr, Si, Sr. Corros. Sci. 2013, 76, 60–97. [Google Scholar] [CrossRef]
  43. He, Y.; Chen, D.; Tao, H.; Zhang, Y.; Jiang, Y.; Zhang, X.; Zhang, S. Biocompatibility of magnesium-zinc alloy in biodegradable orthopedic implants. Int. J. Mol. Med. 2011, 28, 343–348. [Google Scholar] [CrossRef] [Green Version]
  44. He, Y.; Tao, H.; Zhang, Y.; Jiang, Y.; Zhang, S.; Zhao, C.; Li, J.; Zhang, B.; Song, Y.; Zhang, X. Biocompatibility of bio-Mg-Zn alloy within bone with heart, liver, kidney and spleen. Chin. Sci. Bull. 2019, 54, 484–491. (In English) [Google Scholar] [CrossRef] [Green Version]
  45. Hradilová, M.; Vojtěch, D.; Kubásek, J.; Čapek, J.; Vlach, M. Structural and mechanical characteristics of Mg–4Zn and Mg–4Zn–0.4Ca alloys after different thermal and mechanical processing routes. Mater. Sci. Eng. A 2013, 586, 284–291. [Google Scholar] [CrossRef]
  46. Kubásek, J.; Vojtěch, D. Structural characteristics and corrosion behavior of biodegradable Mg–Zn, Mg–Zn–Gd alloys. J. Mater. Sci. Mater. Med. 2013, 24, 1615–1626. (In English) [Google Scholar] [CrossRef]
  47. Jia, H.; Feng, X.; Yang, Y. Influence of solution treatment on microstructure, mechanical and corrosion properties of Mg4Zn alloy. J. Magnes. Alloy. 2015, 3, 247–252. [Google Scholar] [CrossRef] [Green Version]
  48. Liu, X.-B.; Shan, D.-Y.; Song, Y.-W.; Han, E.-H. Effects of heat treatment on corrosion behaviors of Mg-3Zn magnesium alloy. Trans. Nonferrous Met. Soc. China 2010, 20, 1345–1350. [Google Scholar] [CrossRef]
  49. Lu, Y.; Bradshaw, A.R.; Chiu, Y.L.; Jones, I.P. The role of precipitates in the bio-corrosion performance of Mg–3Zn in simulated body fluid. J. Alloys Compd. 2014, 614, 345–352. [Google Scholar] [CrossRef]
  50. Shi, Z.; Song, G.-L.; Atrens, A. Corrosion resistance of anodised single-phase Mg alloys. Surf. Coat. Technol. 2006, 201, 492–503. [Google Scholar] [CrossRef]
  51. Song, G. Control of biodegradation of biocompatable magnesium alloys. Corros. Sci. 2007, 49, 1696–1701. [Google Scholar] [CrossRef]
  52. Vojtěch, D.; Kubásek, J. Structure, mechanical and corrosion properties of magnesium alloys for medical applications. Acta Met. Slovaca Conf. 2013, 3, 82–89. [Google Scholar] [CrossRef] [Green Version]
  53. Yan, J.; Chen, Y.; Yuan, Q.; Yu, S.; Qiu, W.; Yang, C.; Wang, Z.; Gong, J.; Ai, K.; Zheng, Q.; et al. Comparison of the effects of Mg–6Zn and titanium on intestinal tract in vivo. J. Mater. Sci. Mater. Med. 2013, 24, 1515–1525. [Google Scholar] [CrossRef]
  54. Zhang, S.; Zhang, S.; Li, J.; Song, Y.; Zhao, C.; Zhang, X.; Xie, C.; Zhang, Y.; Tao, H.; He, Y.; et al. In vitro degradation, hemolysis and MC3T3-E1 cell adhesion of biodegradable Mg–Zn alloy. Mater. Sci. Eng. C 2009, 29, 1907–1912. [Google Scholar] [CrossRef]
  55. Zhang, S.; Zhang, X.; Zhao, C.; Li, J.; Song, Y.; Xie, C.; Tao, H.; Zhang, Y.; He, Y.; Jiang, Y.; et al. Research on an Mg–Zn alloy as a degradable biomaterial. Acta Biomater. 2010, 6, 626–640. [Google Scholar] [CrossRef]
  56. Randle, V. Grain Boundary Geometry: Measurement. In Encyclopedia of Materials: Science and Technology, 2nd ed.; Buschow, K.H.J., Cahn, R.W., Flemings, M.C., Ilschner, B., Kramer, E.J., Mahajan, S., Veyssière, P., Eds.; Elsevier: Oxford, UK, 2001; pp. 3618–3622. [Google Scholar]
  57. Nidadavolu, E.P.S.; Feyerabend, F.; Ebel, T.; Willumeit-Römer, R.; Dahms, M. On the Determination of Magnesium Degradation Rates under Physiological Conditions. Materials 2016, 9, 627. [Google Scholar] [CrossRef] [Green Version]
  58. Kirkland, N.; Birbilis, N.; Staiger, M. Assessing the corrosion of biodegradable magnesium implants: A critical review of current methodologies and their limitations. Acta Biomater. 2012, 8, 925–936. [Google Scholar] [CrossRef]
  59. Mehta, Y.; Trivedi, S.; Chandra, K.; Mishra, P.S. ASTM Standard G102-89, “Standard Practice for Calculation of Corrosion Rates and Related Information from Electrochemical Measurements.” Annual Book of ASTM Standards, ASTM International, West Conshohocken, Vol. 3.02, 2006. J. Miner. Mater. Charact. Eng. 2012, 11, 9. [Google Scholar]
  60. Song, Y.; Han, E.-H.; Shan, D.; Yim, C.D.; You, B.S. The effect of Zn concentration on the corrosion behavior of Mg–xZn alloys. Corros. Sci. 2012, 65, 322–330. [Google Scholar] [CrossRef]
  61. Li, H.; Peng, Q.; Li, X.; Li, K.; Han, Z.; Fang, D. Microstructures, mechanical and cytocompatibility of degradable Mg–Zn based orthopedic biomaterials. Mater. Des. 2014, 58, 43–51. [Google Scholar] [CrossRef]
  62. Gray-Munro, J.; Strong, M. A study on the interfacial chemistry of magnesium hydroxide surfaces in aqueous phosphate solutions: Influence of Ca2+, Cl− and protein. J. Colloid Interface Sci. 2013, 393, 421–428. [Google Scholar] [CrossRef]
  63. Rey, C.; Collins, B.; Goehl, T.; Dickson, I.R.; Glimcher, M.J. The carbonate environment in bone mineral: A resolution-enhanced fourier transform infrared spectroscopy study. Calcif. Tissue Res. 1989, 45, 157–164. [Google Scholar] [CrossRef]
  64. Chang, J.-W.; Fu, P.-H.; Guo, X.-W.; Peng, L.-M.; Ding, W.-J. The effects of heat treatment and zirconium on the corrosion behaviour of Mg–3Nd–0.2Zn–0.4Zr (wt.%) alloy. Corros. Sci. 2007, 49, 2612–2627. [Google Scholar] [CrossRef]
  65. Roberge, P.R. Handbook of Corrosion Engineering (no. Book, Whole); McGraw-Hill: New York, NY, USA, 2000. [Google Scholar]
  66. Alvarez-Lopez, M.; Pereda, M.D.; Del Valle, J.A.; Fernandez-Lorenzo, M.; Garcia-Alonso, M.C.; Ruano, O.A.; Escudero, M.L. Corrosion behaviour of AZ31 magnesium alloy with different grain sizes in simulated biological fluids. Acta Biomater. 2010, 6, 1763–1771. [Google Scholar] [CrossRef] [Green Version]
  67. Lu, Y.; Bradshaw, A.R.; Chiu, Y.L.; Jones, I.P. Effects of secondary phase and grain size on the corrosion of biodegradable Mg–Zn–Ca alloys. Mater. Sci. Eng. C 2015, 48, 480–486. [Google Scholar] [CrossRef]
  68. Kutniy, K.; Papirov, I.; Tikhonovsky, M.; Pikalov, A.; Sivtzov, S.; Pirozhenko, L.; Shokurov, V.; Shkuropatenko, V. Influence of grain size on mechanical and corrosion properties of magnesium alloy for medical implants. Mater. Werkst. 2009, 40, 242–246. [Google Scholar] [CrossRef]
  69. Zheng, Y.; Li, Y.; Chen, J.; Zou, Z. Effects of tensile and compressive deformation on corrosion behaviour of a Mg–Zn alloy. Corros. Sci. 2015, 90, 445–450. [Google Scholar] [CrossRef]
  70. Atrens, A.; Johnston, S.; Shi, Z.; Dargusch, M.S. Viewpoint - Understanding Mg corrosion in the body for biodegradable medical implants. Scr. Mater. 2018, 154, 92–100. [Google Scholar] [CrossRef]
  71. Song, G.; Atrens, A. Understanding Magnesium Corrosion—A Framework for Improved Alloy Performance. Adv. Eng. Mater. 2003, 5, 837–858. [Google Scholar] [CrossRef]
  72. Atrens, A.; Liu, M.; Abidin, N.I.Z. Corrosion mechanism applicable to biodegradable magnesium implants. Mater. Sci. Eng. B 2011, 176, 1609–1636. [Google Scholar] [CrossRef]
  73. Song, G.-L.; Xu, Z. Crystal orientation and electrochemical corrosion of polycrystalline Mg. Corros. Sci. 2012, 63, 100–112. [Google Scholar] [CrossRef]
  74. Liu, M.; Qiu, D.; Zhao, M.-C.; Song, G.-L.; Atrens, A. The effect of crystallographic orientation on the active corrosion of pure magnesium. Scr. Mater. 2008, 58, 421–424. [Google Scholar] [CrossRef]
  75. Jia, H.; Feng, X.; Yang, Y. Effect of crystal orientation on corrosion behavior of directionally solidified Mg-4 wt% Zn alloy. J. Mater. Sci. Technol. 2018, 34, 1229–1235. [Google Scholar] [CrossRef]
  76. He, J.; Jiang, B.; Xu, J.; Zhang, J.; Yu, X.; Liu, B.; Pan, F. Effect of texture symmetry on mechanical performance and corrosion resistance of magnesium alloy sheet. J. Alloys Compd. 2017, 723, 213–224. [Google Scholar] [CrossRef]
  77. Wang, B.J.; Xu, D.K.; Dong, J.H.; Ke, W. Effect of the crystallographic orientation and twinning on the corrosion resistance of an as-extruded Mg–3Al–1Zn (wt.%) bar. Scr. Mater. 2014, 88, 5–8. [Google Scholar] [CrossRef]
  78. Arya, C.; Vassie, P. Influence of cathode-to-anode area ratio and separation distance on galvanic corrosion currents of steel in concrete containing chlorides. Cem. Concr. Res. 1995, 25, 989–998. [Google Scholar] [CrossRef]
  79. Wang, Z.; Wang, Y.; Wang, C. Area Ratio of Cathode/Anode Effect on the Galvanic Corrosion of High Potential Difference Coupling in Seawater. IOP Conf. Ser. Mater. Sci. Eng. 2018, 322, 022046. [Google Scholar] [CrossRef]
  80. Chen, S.; Guan, S.; Chen, B.; Li, W.; Wang, J.; Wang, L.; Zhu, S.; Hu, J. Corrosion behavior of TiO2 films on Mg–Zn alloy in simulated body fluid. Appl. Surf. Sci. 2011, 257, 4464–4467. [Google Scholar] [CrossRef]
  81. Shi, Z.; Liu, M.; Atrens, A. Measurement of the corrosion rate of magnesium alloys using Tafel extrapolation. Corros. Sci. 2010, 52, 579–588. [Google Scholar] [CrossRef]
  82. Pardo, A.; Feliu, S.; Merino, M.C.; Arrabal, R.; Matykina, E. Electrochemical Estimation of the Corrosion Rate of Magnesium/Aluminium Alloys. Int. J. Corros. 2009, 2010, 1–8. [Google Scholar] [CrossRef]
  83. Atrens, A.; Song, G.-L.; Cao, F.; Shi, Z.; Bowen, P.K. Advances in Mg corrosion and research suggestions. J. Magnes. Alloy. 2013, 1, 177–200. [Google Scholar] [CrossRef] [Green Version]
  84. Yang, L.; Zhang, E. Biocorrosion behavior of magnesium alloy in different simulated fluids for biomedical application. Mater. Sci. Eng. C 2009, 29, 1691–1696. [Google Scholar] [CrossRef]
  85. Ng, W.F.; Chiu, K.Y.; Cheng, F.T. Effect of pH on the in vitro corrosion rate of magnesium degradable implant material. Mater. Sci. Eng. C 2010, 30, 898–903. [Google Scholar] [CrossRef]
  86. Krämer, M.; Schilling, M.; Eifler, R.; Hering, B.; Reifenrath, J.; Besdo, S.; Windhagen, H.; Willbold, E.; Weizbauer, A. Corrosion behavior, biocompatibility and biomechanical stability of a prototype magnesium-based bio-degradable intramedullary nailing system. Mater. Sci. Eng. C 2016, 59, 129–135. [Google Scholar] [CrossRef]
Figure 1. Representative inverse pole figure (IPF) maps of AC and rolled samples reflecting the relationship between the crystal plane normals and the surface normal: (A) Schematic of map locations with respect to the RD, (B) AC, (C) R30 parallel to the RD, (D) R30 normal to the RD, (E) R40 parallel to the RD, (F) R40 normal to the RD, (G) R50 parallel to the RD, (H) R50 normal to the RD.
Crystals 12 01491 g001
Figure 2. Photographs of the as-corroded surfaces of AC and RX as a function of immersion time and buffer system in EBSS.
Crystals 12 01491 g002
Figure 3. Photographs of the corroded surfaces of (A) AC, (B) R30, (C) R40 and (D) R50 following immersion testing after 5, 10 and 15 days in HEPES-buffered or NaHCO3/CO2-buffered (CO2) EBSS. Corrosion products were removed from the surfaces with chromic acid.
Crystals 12 01491 g003
Figure 4. Mass loss derived corrosion rate results for AC and RX samples after 5, 10 and 15 d immersion in NaHCO3/CO2 and HEPES buffered EBSS. Error bars indicate 95% confidence intervals.
Crystals 12 01491 g004
Figure 5. Scanning electron micrographs and corresponding elemental EDS maps taken from the cross-section (transverse plane) of AC as a function of the buffer system and immersion time in EBSS.
Crystals 12 01491 g005
Figure 6. Scanning electron micrographs and corresponding elemental EDS maps taken from the cross-section (transverse plane) of R50 as a function of the buffer system and immersion time in EBSS.
Crystals 12 01491 g006
Figure 7. FTIR spectra of corrosion products collected from the surface of specimens immersed in EBSS for 15 d.
Crystals 12 01491 g007
Figure 8. Average pH of EBSS as a function of the immersion time and buffer system for AC and RX samples buffered with HEPES (left) and NaHCO3/CO2 (right). The pH stability of the buffered EBSS systems without immersed samples was also verified (blanks).
Crystals 12 01491 g008
Figure 9. PDP curves of Mg-1Zn samples immersed in EBSS buffered with either HEPES or NaHCO3/CO2.
Crystals 12 01491 g009
Table 1. Chemical composition (wt. %) of the as-cast binary Mg-Zn alloy.
MgCaZnMnFeCuNiPbSn
Bal<0.0020.99 ± 0.09<0.002<0.002<0.002<0.001<0.002<0.002
Table 2. Rolling schedule for the investigated samples.
Sample (RX)Plate Thickness (mm)Reduction per Pass (%)Total Reduction (%)
InitialAfter 1st PassAfter 2nd PassAfter 3rd PassAfter 4th Pass
R30139.16.44.53.13076
R40137.84.72.8-4078.3
R50136.53.3--5075
Table 3. Grain size and percentage recrystallisation of Mg-1 wt. % Zn as a function of the reduction per pass.
SampleGrain Size (µm)Recrystallisation Parallel
to RD (%)
Recrystallisation Normal
to RD (%)
AC500–700--
R3010.6 ± 5.38050
R4012.0 ± 6.89540
R506.6 ± 3.38565
Table 4. Electrochemical data from polarisation tests and 15 d mass loss corrosion rates (CRm) from immersion tests.
SampleBufferEcorr (mV)Icorr
(µA·cm−2)
Icorr(HEPES):Icorr
(CO2)
CRi
(mm/yr)
CRm
(mm/yr)
ACNaHCO3/CO2−1626 ± 6118 ± 54.20.43.4
HEPES−1686 ± 776 ± 3 1.72.8
R30NaHCO3/CO2−1653 ± 625 ± 23.30.615.8
HEPES−1698 ± 382 ± 6 1.912.8
R40NaHCO3/CO2−1708 ± 1816 ± 14.50.414.3
HEPES−1694 ± 1272 ± 11 1.68.7
R50NaHCO3/CO2−1669 ± 1113 ± 17.20.311.0
HEPES−1681 ± 1293 ± 8 2.111.7
Publisher’s Note: MDPI stays neutral with regard to jurisdictional claims in published maps and institutional affiliations.

