Article

Achieving High Tensile Strength of Heat-Resistant Ni-Fe-Based Alloy by Controlling Microstructure Stability for Power Plant Application

Department of Materials Design Innovation Engineering, Graduate School of Engineering, Nagoya University, Furo-Cho, Chikusa-Ku, Nagoya 464-8603, Aichi, Japan
Crystals 2022, 12(10), 1433; https://doi.org/10.3390/cryst12101433
Submission received: 10 September 2022 / Revised: 5 October 2022 / Accepted: 7 October 2022 / Published: 11 October 2022
(This article belongs to the Special Issue Micro-Structure and Mechanical Properties of Alloys)

Abstract

:
A new, wrought Ni-Fe-based alloy with excellent creep rupture life has been developed for 700 °C-class advanced ultra-supercritical (A-USC) steam turbine rotor application. In this study, its tensile deformation behaviors and related microstructure evolution were investigated. Tensile tests were carried out at room temperature, 700 °C, and 750 °C. The results show that the Ni-Fe-based alloy has excellent yield strength at 700 °C, which is higher than that of some other Ni-based/Ni-Fe-based alloys. The fracture surface characteristics indicate trans-granular and intergranular fracture modes at room temperature, 700 °C, and 750 °C. However, the intergranular fraction mode became dominant above 700 °C. Dynamic recrystallization occurred at 700 °C and 750 °C with increasing average misorientation angles. The volume fraction of the γ′ precipitate was around 20%, and the average size of the γ′ precipitates was around 30 μm, which had no noticeable change after the tensile tests. The predominant deformation mechanisms were planar slip at room temperature, bypassing of the γ′ precipitates by the Orowan mechanism, and dislocation shearing at 700 °C and 750 °C. The tensile properties, fracture characteristics, and deformation mechanisms have been well-correlated. The results are helpful in providing experimental evidence for the development and optimization of high-temperature alloys for 700 °C-class A-USC applications.

1. Introduction

Advanced ultra-supercritical (A-USC) technology with a thermal efficiency of around 55% has been developed to improve the thermal efficiency, electricity-producing efficiency, and combustion utilization of biomass fuels and to alleviate the global-warming problem. Increasing the steam temperature and pressure can effectively improve the efficiency of coal-fired power plants [1,2]. Therefore, in ongoing research and development, the 700 °C-class A-USC power plants are being designed and expected to operate at 700 °C/37.5 MPa unlike current-generation USC plants, which operate around 600 °C/24 MPa [3,4]. Special requirements have been proposed for the materials used in the hot sections according to the operating conditions in the coal-fired power plants; i.e., for the tubes in the boiler, the materials must satisfy a 100,000 h creep strength greater than 100 MPa at 750 °C and 200,000 h coal-ash corrosion resistance of less than 2 mm metal loss [5,6]. In addition, the high-temperature and high-pressure steam can be produced in the boiler tubes and then transferred to the steam turbines, which can convert the thermal energy into mechanical energy and further drive the electrical generator to produce electricity. The steam turbine rotors play a significant role in the energy conversion process. However, in current USC power plants, conventional rotor materials are made of ferritic steel and austenitic steel, which are not suitable for application in 700 °C-class A-USC rotors since they cannot satisfy the requirement of the temperature capacity and strength [7,8]. Generally, Ni-based alloys have been considered as a promising candidate for the most severe sections in A-USC power plants due to their good long-term creep strength and corrosion resistance. However, the high content of Co (10–20 wt%) and Mo + W (6–8%) addition increases the cost of the raw materials. Moreover, the workability of Ni-based alloy is not suitable for making complex-shaped components. Therefore, the development of new materials and optimization/improvement of current in-service materials for the stream turbine rotors are the critical factors for achieving 700 °C-class A-USC technology. Ni-Fe-based alloys with a high amount of Fe addition can reduce the raw material cost and improve the workability of complex-shaped components. According to the service requirement, several Ni-Fe-based alloys have been developed for 700 °C-class A-USC steam turbine rotor application [8,9,10,11]. The primary concerns with Ni-Fe-based superalloys are the insufficient mechanical properties at elevated temperatures.
Our previous research has reported a new kind of Ni-Fe-based alloy for 700 °C-class A-USC steam turbine rotor application [4]. It displayed a much better creep rupture life than the Ni-Fe-based alloys FENIX700 [8] and Alloy 706 [9] and even the Ni-based candidate alloy LTES700 [10,11]. The primary strengthening mechanism is a result of the homogeneous precipitation of the γ phase from the γ matrix. Some strength can also be derived from the precipitation of MC carbide in the grain interiors and M23C6 carbides at the grain boundaries. In addition, this Ni-Fe-based alloy contains 35–40 wt% Fe and no Co addition. It has a much lower raw material cost and better hot workability. To fully understand the properties of this promising candidate Ni-Fe-based alloy, this study aims to carry out a fundamental investigation of the tensile properties and predominant tensile deformation mechanism in terms of microstructure evolution, strengthening mechanism, and fracture mechanism. These microstructure characteristics and mechanisms could provide significant evidence for further optimization.

2. Materials and Methods

The nominal chemical composition of this advanced wrought Ni-Fe-based alloy is, in wt%, 35–40 Fe, 15–20 Cr, 0.3–1.0 Mo, 2.5–3.5 (Ti + Al), 0.1–0.3 (C + B + P + Si), and the balance Ni. This Ni-Fe-based alloy cast ingot was prepared via vacuum induction melting and then homogenized at 1200 °C for 24 h. Then, the ingot was hot-forged and rolled at 1200 °C, and finally processed into a 10-mm-thick plate. The tensile specimens (4 mm in gage diameter and 30 mm in length) used in this study were all machined from the heat-treated plates along the longitudinal direction before heat treatment. Solution heat treatment was carried out at 1100 °C for 1 h, followed by air cooling. Aging heat treatment was conducted at 750 °C for 8 h, followed by furnace cooling with a cooling rate of 50 °C/h to 650 °C and then holding at 650 °C for 16 h with subsequent air cooling. Tensile tests were performed on a Shimadzu test machine at an initial strain rate of 2.0 × 10⁻⁴ s−1 up to about 3% deformation; the strain rate was then increased to 5.0 × 10⁻³ s−1 until the specimen fractured. Tensile tests were conducted at 22 °C, 700 °C, and 750 °C to characterize the deformation behaviors. The temperature range from 700 °C to 750 °C was considered to evaluate the tensile property for 700 °C A-USC applications. After tensile tests, the deformed microstructure and fracture surfaces were observed using optical microscopy (OM) and scanning electron microscopy (SEM, JEOL JSM-7001F, Japan). Ductility (elongation and reduction in area) was obtained from the measurements of gage section length and the minimum gage diameter before and after the fracture. For deformed microstructure analysis, slices were cut out close to the tensile specimens’ fracture surfaces. Crystal orientation, grain size, and misorientation angle were analyzed using electron backscatter diffraction (EBSD) in the SEM. Transmission electron microscopy (TEM) samples with a diameter of 3 mm and a thickness of 50 μm were prepared by a standard electro-polishing technique using a twin-jet electro-polisher. Electro-polishing was carried out at −15 °C with a voltage of 40 V, using a solution of 45 vol% acetic acid, 45 vol% 2n-butoxyethanol, and 10% perchloric acid. TEM investigations were conducted on a JEOL JEM-2100 Plus TEM operated at 200 kV.

3. Results

3.1. Thermodynamic Calculation

Figure 1 shows the calculated equilibrium phase diagram using Thermo-Calc software, which describes the amount of all phases as a function of temperature. This Ni-Fe-based alloy has an fcc-based matrix, γ′ precipitate as the main strengthening phase, MC carbide, M23C6 carbide, and an α-Cr phase. The volume fraction of the main strengthening γ′ phase is around 20%. The volume fractions of all the precipitates slightly decrease with the increasing temperature. The calculated process involved a thermodynamic state without regard to the non-equilibrium and near-equilibrium processes such as the solute distribution and precipitation kinetics, so the thermodynamic calculation results may not fully represent the microstructural characteristics. More details of the microstructure evolution were analyzed by experiment and are shown in the following sections.

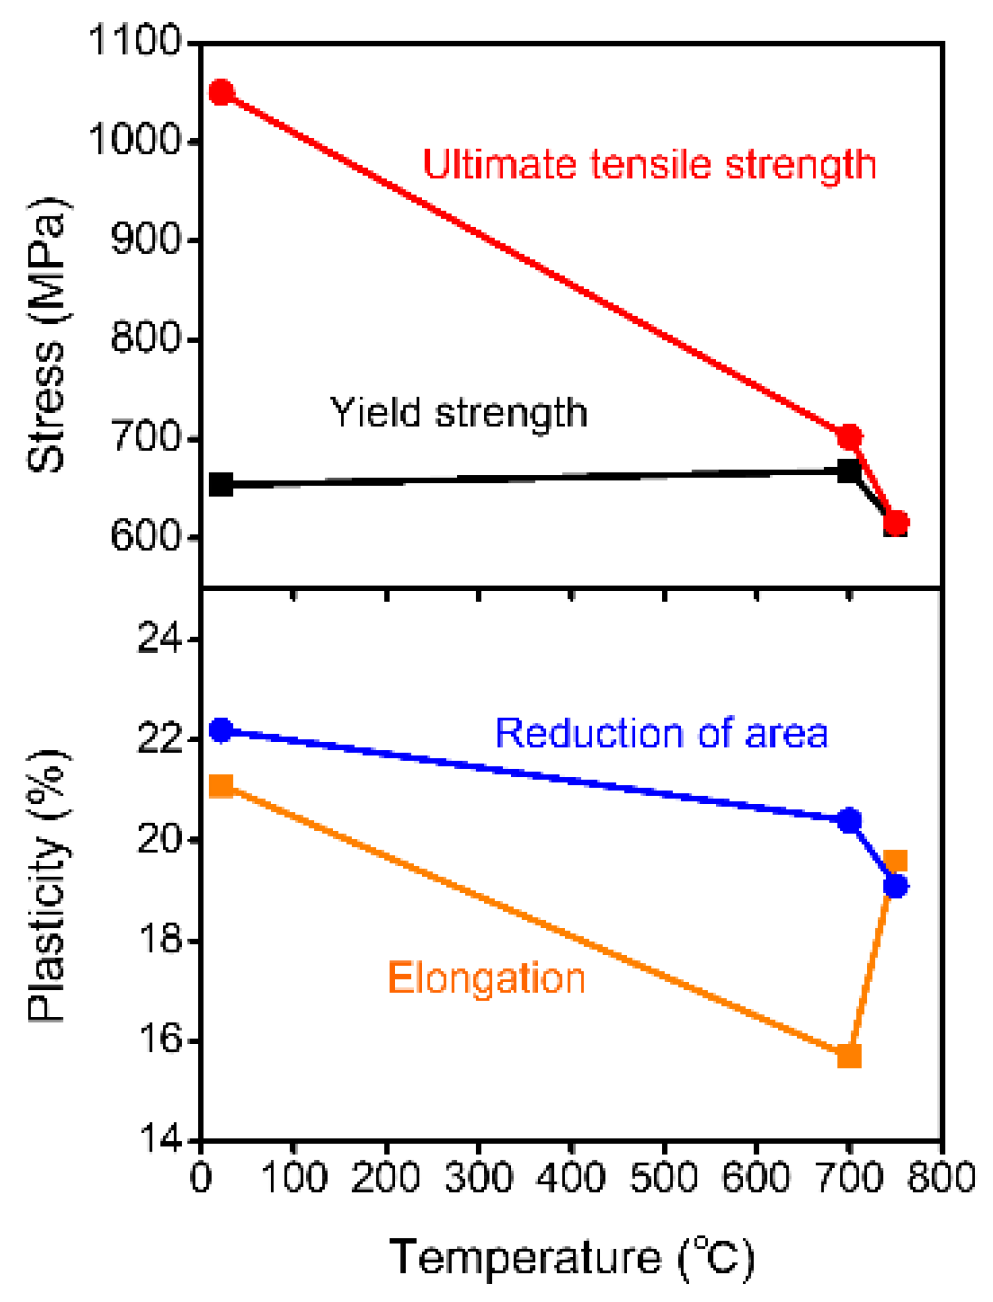
3.2. Tensile Properties

Figure 2 shows the tensile properties as a function of temperature in terms of ultimate tensile strength, yield strength, reduction of area, and elongation. Ultimate tensile strength decreased from room temperature to 700 °C and then drastically decreased at 750 °C. Yield strength increased gradually from room temperature to 700 °C and then decreased steeply. The reduction of area decreased gradually from room temperature to 700 °C and further decreased drastically at 750 °C. The elongation decreased with the increasing temperature from room temperature to 700 °C but continued to increase drastically at 750 °C.

3.3. Fracture Surface Characterization

The fracture surfaces after tensile tests were investigated to identify the fracture characteristics at different testing temperatures. Figure 3a1,a3 show the fracture characteristics of the cross-section surface and lateral surface at room temperature, respectively. Figure 3a2,a4 show the magnified view on the corresponding fracture surface of Figure 3a1,a3, respectively. At room temperature, failure occurred by an intergranular mode combined with a trans-granular mode. Those typical ductile fracture dimples represent the trans-granular mode. Microcracks along the grain boundary could be the factor causing the intergranular fracture. No crack was observed from the lateral surface in Figure 3a3. That is to say, the fracture started from the inside of the specimen, not from the lateral surface. Slip bands can be easily observed from the lateral surface in Figure 3a4. Figure 3b1,b3 show the fracture characteristics of the cross-section surface and lateral surface at 700 °C, respectively. From the magnified view in Figure 3b2, it can be seen that the trans-granular fracture mode became the dominant mode but combined with intergranular fracture mode. In addition, a few microcracks can be observed in Figure 3b3,b4, indicating an intergranular fracture mode. Figure 3c1,c3 show the fracture characteristics of the cross-section surface and lateral surface at 750 °C, respectively. Clearly, intergranular fracture mode became dominant due to the many microcracks formed along the grain boundaries during plastic deformation. In Figure 3c2, the number of typical ductile fracture dimples decreased. Moreover, the number of microcracks increased along the grain boundaries from the lateral surface view in Figure 3c3,c4.

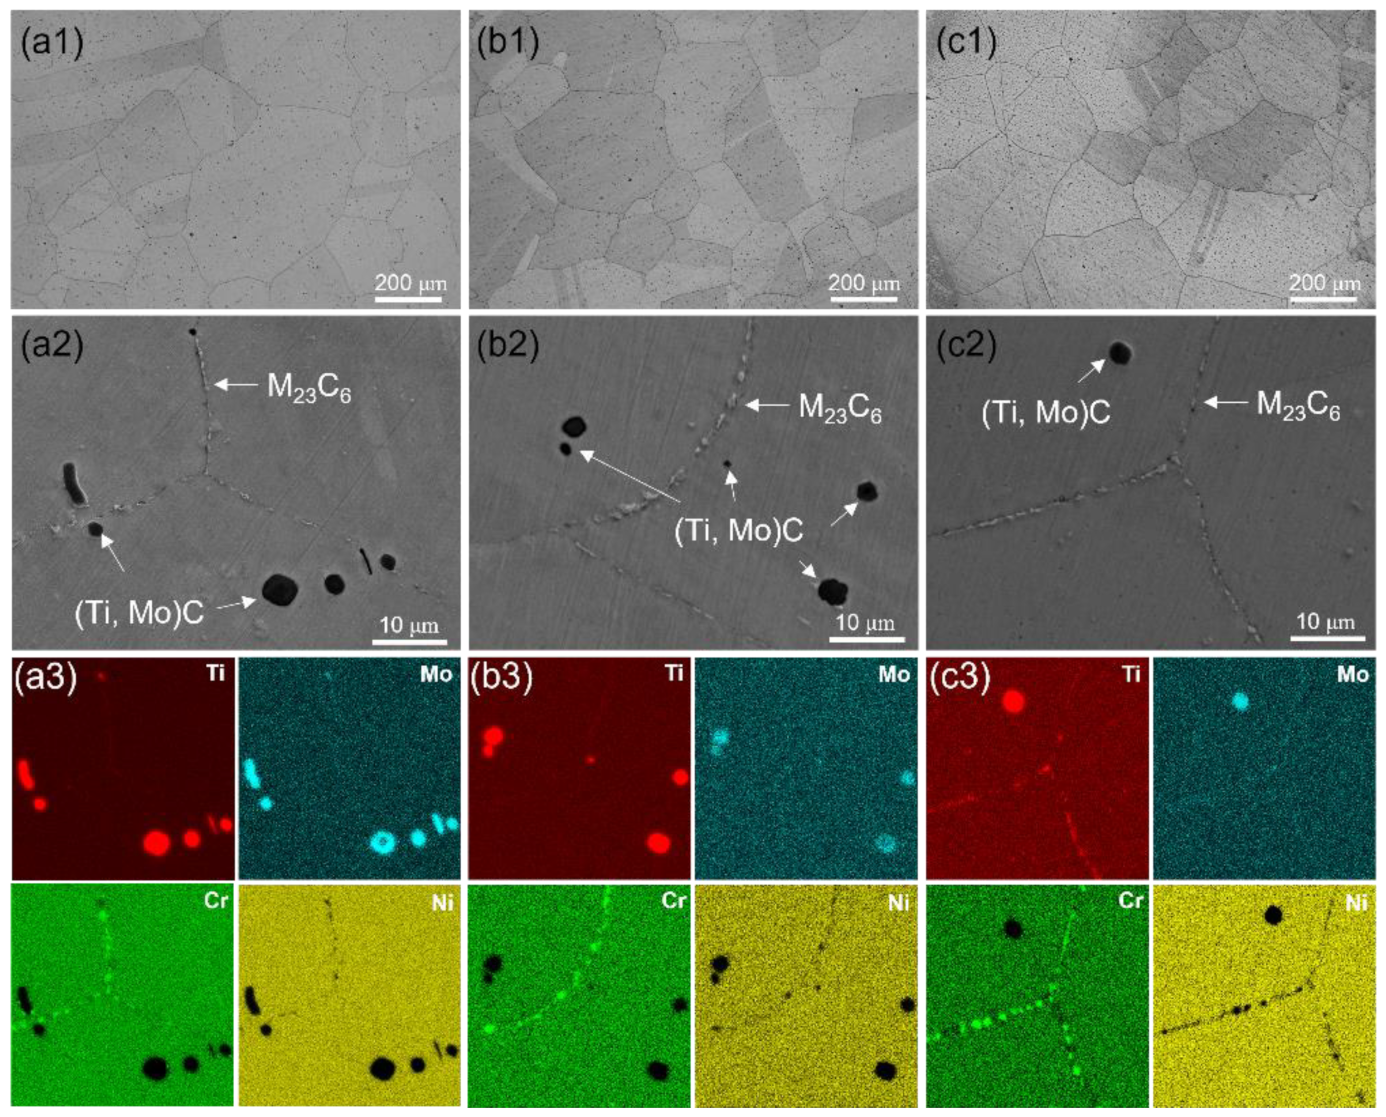
3.4. Microstructure Evolution

Figure 4a1,b1,c1 show the optical microscopy microstructure after tensile deformation at room temperature, 700 °C, and 750 °C, respectively. Figure 4a2,b2,c2 show the uniform precipitates formed along grain boundaries and the bulk precipitates formed in the grain interiors at room temperature, 700 °C, and 750 °C, respectively. Figure 4a3,b3,c3 show the corresponding EDS maps of typical elements Ti, Mo, Cr, and Ni to identify the types of precipitates. The grain boundary precipitates are M23C6 carbides, and the precipitates in the grain interiors are (Ti, Mo)C carbides.
Figure 5a1,b1,c1 show the EBSD maps of the regions close to the fracture surfaces at room temperature, 700 °C, and 750 °C, respectively. Figure 5a2,b2,c2 show the grain size data obtained from the corresponding EBSD maps and displayed a similar average grain size of around 240 μm. Figure 5a3,b3,c3 show the corresponding histograms of the fraction of grain boundaries as a function of grain boundary misorientation angle. The misorientation angle below 15° was measured as the low-angle grain boundary (LAGB), and the angle above 15° was estimated as the high-angle grain boundary (HAGB). The average grain boundary misorientation angles were 17.2°, 32°, and 36.5° at room temperature, 700 °C, and 750 °C, respectively. It increased gradually with the increasing tensile test temperatures.
Figure 6a–d show the dark-field TEM images of the γ′ precipitates before tensile deformation and after tensile fracture at room temperature, 700 °C, and 750 °C, respectively. The γ′ precipitates are distributed homogeneously in the matrix, and there are no notable changes in the size and morphology of the γ′ precipitates. Figure 7 shows the precipitate average size and volume fraction evolution before and after the tensile tests at room temperature, 700 °C, and 750 °C. The average size of the γ′ precipitates slightly increased and totaled around 30 ± 2 μm. The volume fraction of γ′ precipitates decreased slightly and was around 20 ± 2%, consistent with the thermodynamic calculation results.
Figure 8a1,a2 show the dislocation configuration in the specimen after tensile fracture at room temperature. Well-defined slip bands were distributed in the grain interior, and at least two sets of slip systems were operational. Dislocation pairs and dislocation loops can be observed. Figure 8b1,b2 show the TEM bright-field and dark-field images of dislocation configuration in the specimen after tensile fracture at 700 °C, respectively. Clearly, well-defined slip bands cannot be observed. Some dislocations bowed out γ′ precipitates and left dislocation loops around them, which is the Orowan mechanism. There were still some dislocations that passed through the γ′ precipitates by shearing and left the stacking fault inside the γ′ precipitates, which is the dislocation-shearing mechanism. Figure 8c1,c2 show the TEM bright-field and dark-field images of dislocation configurations in the specimen after tensile fracture at 750 °C, respectively. The well-defined slip bands cannot be observed. Plenty of stacking faults can be observed in the γ′ precipitates. In addition, dislocation loops can be observed around some γ′ precipitates. Therefore, the Orowan and dislocation-shearing mechanisms occurred at 700 °C and 750 °C.
Figure 9a–c show the grain boundary structures in the specimens after tensile fracture at room temperature, 700 °C, and 750 °C, respectively. In general, the larger grain grows at the expense of smaller grains, keeping the constant volume. The driving force for grain growth is the minimization of the grain boundary energy considering grain boundary curvature and grain angle. Grain growth and recrystallization in terms of grain boundary migration led to the production of straight grain boundary segments. In addition, carbides provided points for dislocation pile up during plastic deformation, which generates back stress, resulting in a reduction in the sliding rate of the grain boundary, as shown in Figure 9b. In addition, the pile-up of dislocations against grain boundaries could lead to localized high-intensity stress concentrations for micro-crack initiation and propagation along the grain boundary.

4. Discussion

To evaluate the yield strength of this experimental alloy, Figure 10 shows the yield strength as a function of temperature of various Ni-based/Ni-Fe-based alloys (e.g., Haynes 282, Inconel 740, Nimonic 263, GH2984). The experimental alloy displays the highest yield strength at 700 °C. It is widely reported that the yield strength of precipitation-hardened Ni-base superalloys is controlled by the volume fraction of the γ′ precipitates. The yield strength of these alloys would decrease with increasing temperature when the γ′ volume fraction is below 12% [12,13]. According to the experimental observation, such a feature is not expected to occur in the experimental alloy. Note that the volume fractions of the γ′ precipitates vary in those alloys, with 19.3% in Haynes 282 alloy, 14.6% in Inconel 740 alloy, 12% in Nimonic 263, and 6% in GH2984 alloy at around 760 °C. In contrast, the volume fractions of the γ′ precipitates in the experimental Ni-Fe-based alloy are around 19% at 700 °C and 17.5% at 750 °C. Therefore, the yield strength of the experimental alloy is temperature-independent. In this case, the strengthening effect from the γ′ precipitates could be the dominant strengthening mechanism. The yield strength is not only determined by the volume fraction of the γ′ precipitates but also by some other factors, e.g., the composition effect. In addition, no Co element was added to this experimental Ni-Fe-based alloy in order to lower the raw material cost based on the alloy design strategy. Generally, the Co element addition can effectively reduce the stacking fault energy (SFE). However, Cr, Ti, and Mo elements could also reduce the SFE. Materials with lower SFE display wider stacking faults and have more difficulties for cross-slip, which can be elucidated by the straight slip lines.
During the tensile deformation, the deformation behavior of the experimental Ni-Fe-based alloy strongly depends on the temperature. At room temperature, well-defined slip bands were observed, indicating that most dislocations moved within at least two slip systems. Dislocation pairs bypass through the γ′ precipitates to minimize the antiphase boundary area created by the a/2<110> displacement of the superlattice. The dislocation loops around some γ′ precipitates indicate that the Orowan mechanism also occurred during tensile deformation at room temperature. When the tensile temperature increases to 700 °C, slip bands cannot be observed. It means the movement of dislocation is not confined to the slip bands. Extensive dislocation activities, including the bowing-out and looping process (Orowan mechanism) and the dislocation shearing of the γ′ precipitate were observed, leaving stacking faults in them (dislocation shearing mechanism) at this temperature. Hence, some γ′ precipitates acted as strong dislocation barriers and could pin the dislocation around them, which is the Orowan mechanism. Localized interfacial stress concentration could make the dislocation travel through the γ′ precipitates and create additional precipitate/matrix interfacial areas, finally increasing the interfacial energy, which is chemical strengthening. Some γ′ precipitates acted as weak dislocation barriers and the dislocation could shear them and leave stacking faults inside, which is the dislocation shearing mechanism. Similarly, at 750 °C, both Orowan and dislocation shearing mechanisms can be observed. The precipitation strengthening mechanism depends on the size of the precipitation particles. At a small size, dislocation shearing will be dominant, while dislocation bowing will be dominant at a large size. This means the size of the γ′ precipitates did not change significantly during tensile testing at 700 °C and 750 °C. For the interaction between precipitates and dislocations, there exists the critical size of precipitates for the transition from Orowan looping to precipitate shearing. According to the commonly used equations [14,15], the critical size of the γ′ precipitates can be calculated as follows:
For Orowan looping,
τ o = 0.9 + ln 2 π r / b 3 / 2 ln L / b 1 / 2 K b L π / 2 r
For precipitate shearing,
τ s = γ A P B 2 b A 1 γ A P B r f T L 1 / 2 + A 2 f × 1 + S L η S L
where K = G b 2 / 2 π 1 ν is the pre-logarithmic line tension factor of a straight edge dislocation. τ o and τ s are the critical resolved shear stress for Orowan looping and precipitate shearing, respectively. S L and η S L represent one empirical constant and the normalized particle depth in the theory of Schwarz and Labusch [16], r is the mean precipitate radius, b is the Burgers vector, T L is the dislocation line tension, and A 1 and A 2 are fitting coefficients. Taking γ A P B = 0.12 Jm−2 [17], b = 0.25 nm, f = 0.2, and G = 60 GPa [18], the theoretical critical resolved shear stress as a function of the γ′ precipitates’ size can be obtained. The critical γ′ precipitate size for dislocation transition from shearing to bowing is close to 30 nm, consistent with the experimental result. In addition, at 750 °C, the EBSD data show that the average misorientation angle increases from room temperature. The continuous increase of the average misorientation angle during dynamic recrystallization results from the migration of sub-grain boundaries and the absorption of dislocations into grain boundaries. Thus, the rapid reduction of strength above 700 °C could be partly attributed to the onset of dynamic recovery and/or recrystallization. A similar dynamic recovery and recrystallization softening mechanism and its influence on tensile strength have been reported in other Ni-based superalloys [19,20].
The fracture behaviors of this Ni-Fe-based alloy exhibited a mixed trans-granular ductile fracture and intergranular fracture mode from room temperature to 750 °C. According to the microcracks along the grain boundaries from the lateral surface view in Figure 3b3,c3, it can be proposed that the intergranular fracture mode became dominant above 700 °C, especially at 750 °C. Dislocation interactions with the grain boundary carbides could cause stress concentration at the interfaces, further leading to micro-void formation or microcrack initiation and propagation along grain boundaries, which is consistent with the crack observed in the grain boundaries in Figure 3c2. At 750 °C, dynamic recovery of deformation dislocation becomes strong, and dynamic recrystallization of γ matrix retards the microcrack growth, thereby enhancing the fracture ductility [20,21].

5. Conclusions

Tensile tests were carried out from room temperature to 750 °C on one promising Ni-Fe-based alloy to evaluate its comprehensive performance for the 700 °C-class A-USC steam turbine rotor application. The major conclusions based on the experimental findings in terms of the tensile deformation behaviors and microstructure evolution are given below:
(1)
The Ni-Fe-based alloy with a volume fraction of γ′ precipitates around 20% displayed good yield strength around 700 MPa at 700 °C.
(2)
A mixed trans-granular and intergranular fracture mode was observed at room temperature, 700 °C, and 750 °C. Intergranular fracture mode became dominant above 700 °C.
(3)
The predominant deformation behaviors in the grain interiors were planar slip and γ′ precipitate shearing by dislocation pairs at room temperature, Orowan, and dislocation shearing mechanisms at 700 °C and 750 °C.
(4)
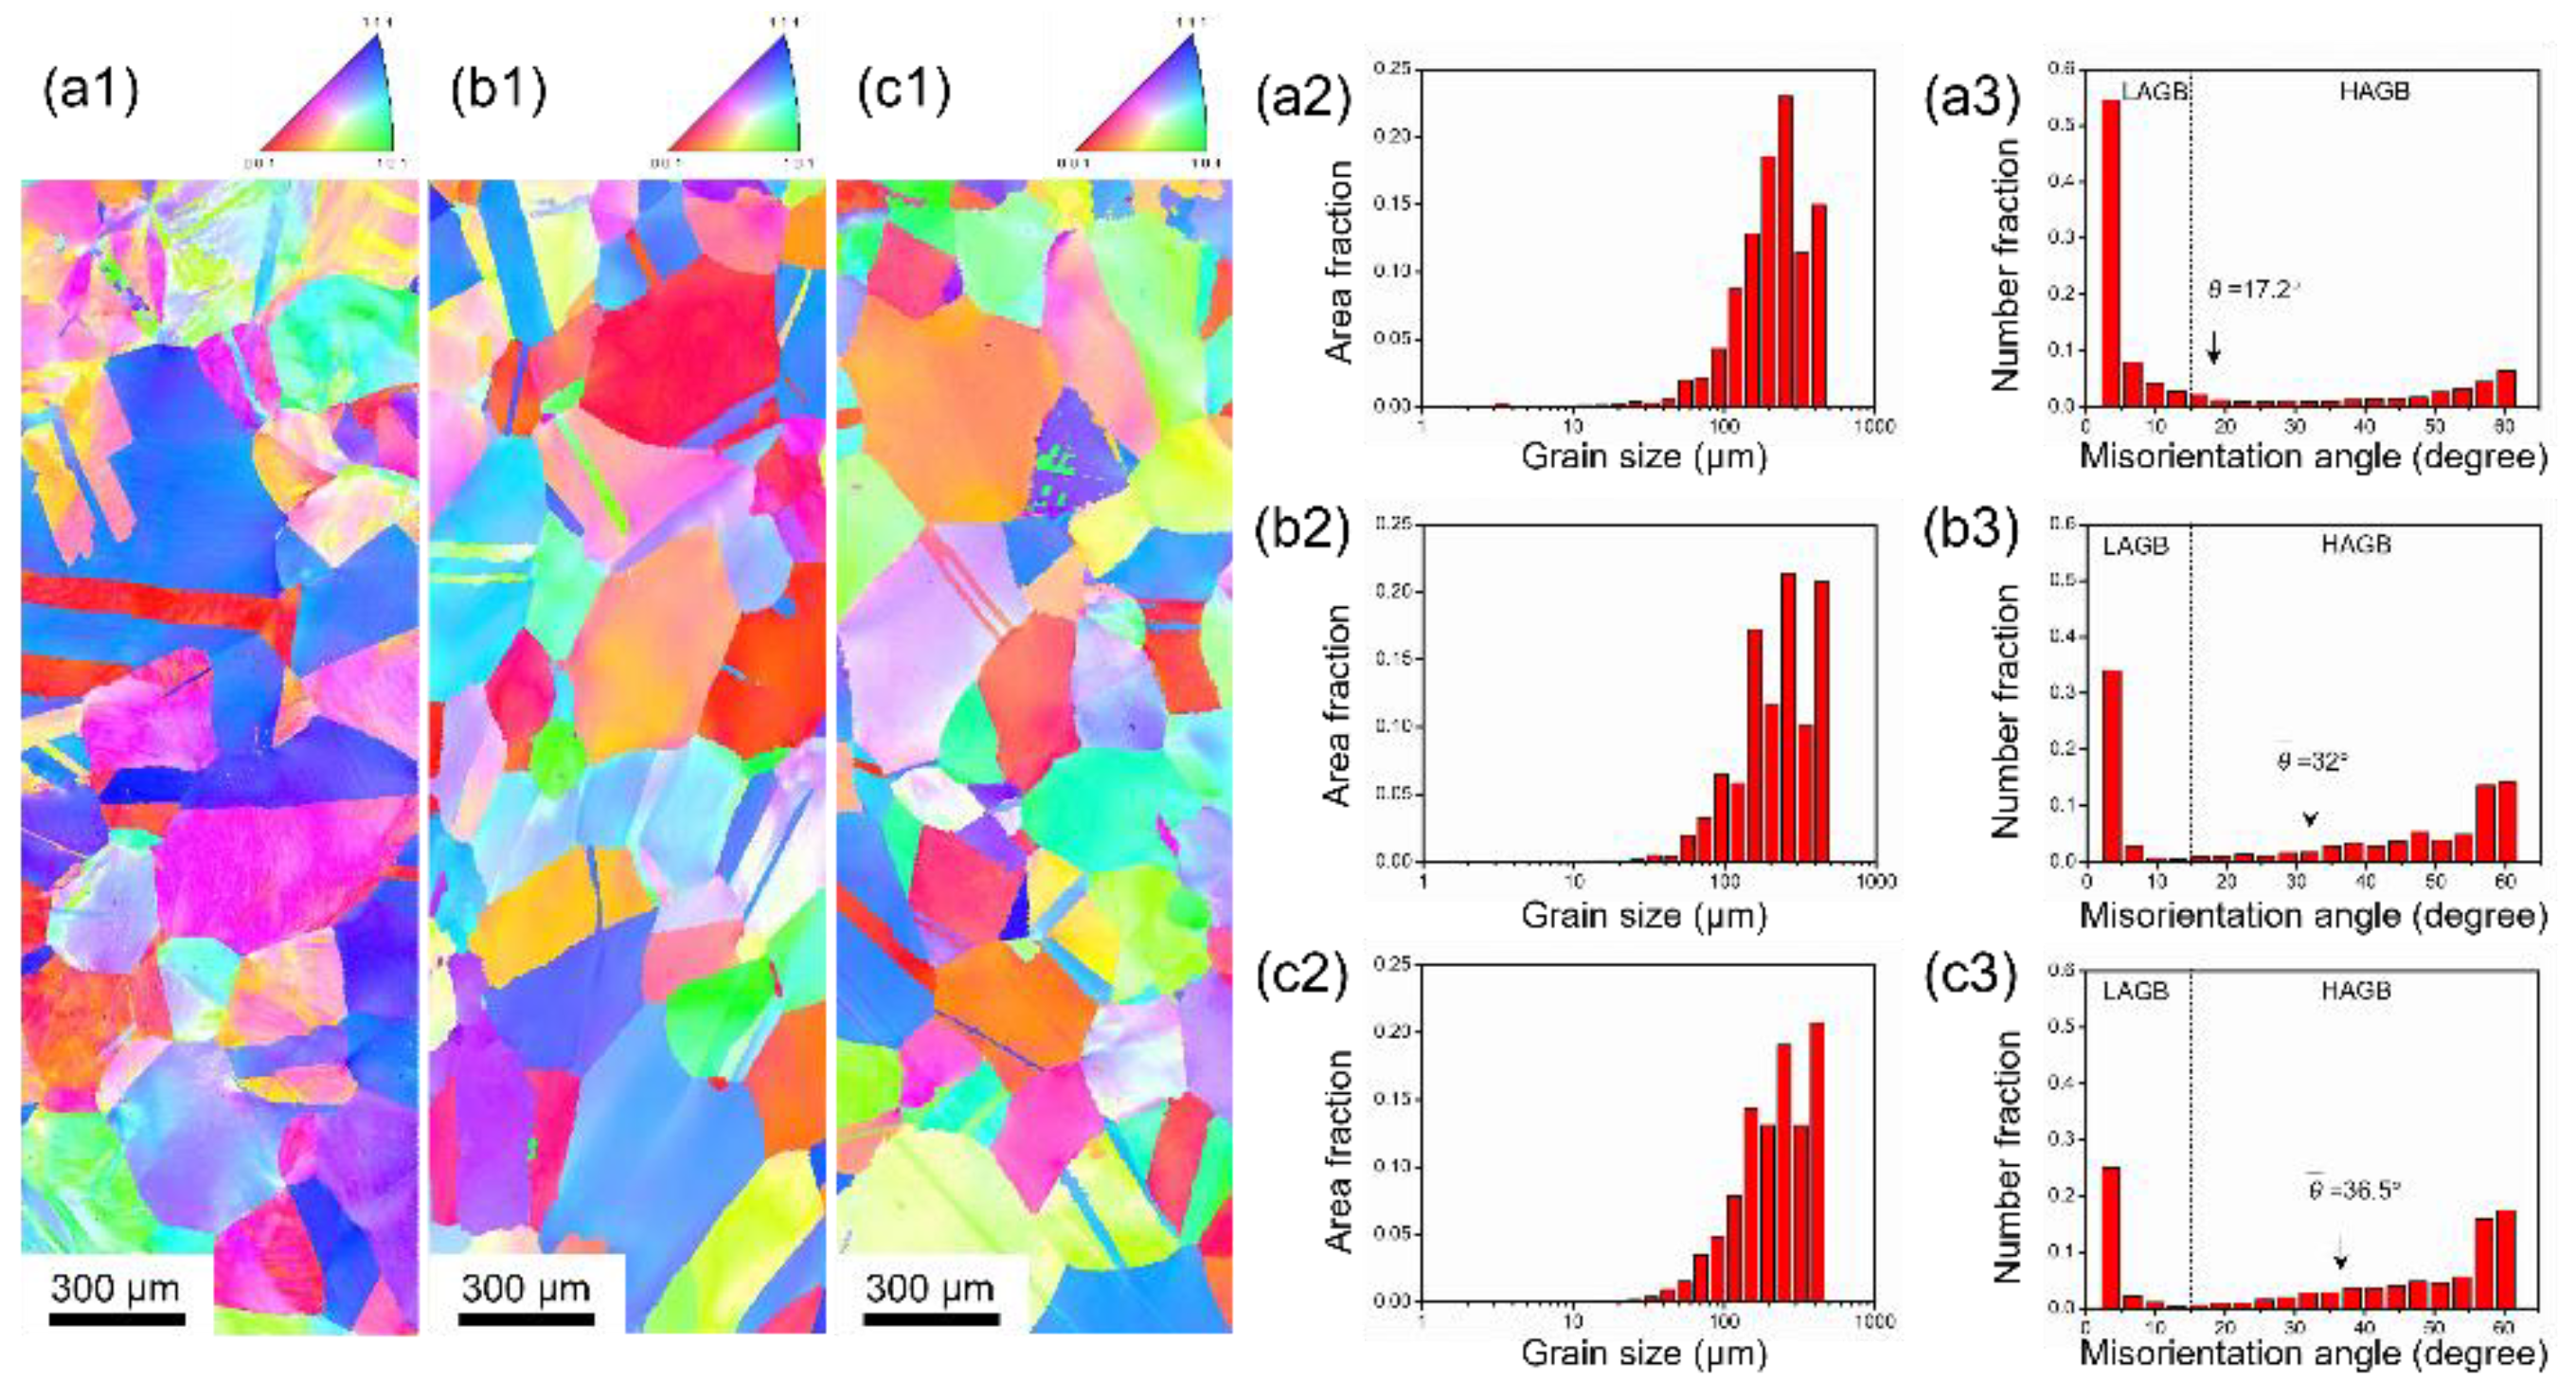
Dynamic recrystallization occurred above 700 °C with increasing average misorientation angles combined with the sub-grain boundary migration and dislocation absorption into grain boundaries.

Funding

This research was funded by the Ministry of Education, Culture, Sports, Science, and Technology, Japan, grant number 20K15057.

Institutional Review Board Statement

Not applicable.

Informed Consent Statement

Not applicable.

Data Availability Statement

The data presented in this study are available upon request from the author.

Conflicts of Interest

The author declares no conflict of interest. The funding agency had no influence on the design of the study; the collection, analysis or interpretation of data; the writing of the manuscript; or the decision to publish the results.

References

  1. Weitzel, P.S. Steam generator for advanced ultra supercritical power plants 700 °C to 760 °C. In Proceedings of the ASME 2011 Power Conference Collocated with JSME ICOPE 2011, Denver, CO, USA, 12–14 July 2011; pp. 281–291. [Google Scholar]
  2. Fukuda, Y. Development of advanced ultra supercritical fossil power plants in Japan: Materials and high temperature corrosion properties. Mater. Sci. Forum 2011, 696, 236–241. [Google Scholar] [CrossRef]
  3. Sun, F.; Gu, Y.F.; Yan, J.B.; Zhong, Z.H.; Yuyama, M. Phenomenological and microstructural analysis of intermediate temperatures creep in a Ni-Fe-based alloy for advanced ultra-supercritical fossil power plants. Acta Mater. 2016, 102, 70–78. [Google Scholar] [CrossRef]
  4. Sun, F.; Gu, Y.F.; Yan, J.B.; Zhong, Z.H.; Yuyama, M. Creep deformation and rupture mechanism of an advanced wrought Ni-Fe-based superalloy for 700 °C class A-USC steam turbine rotor application. J. Alloys Compd. 2016, 687, 389–401. [Google Scholar] [CrossRef]
  5. Blum, P. Preliminary considerations for the design of a pulverized coal-fired steam boiler with ultra-super advanced steam parameters. Advanced (700 °C) PF Power Plant. 1997, EC Contact No. SF/1001/97/DK.
  6. Smith, G.D.; Sizek, H.W. Introduction of an advanced superheater alloy for coal-fired boilers. In Proceedings of the NACE Corrosion 2000, Houston TX NACE Paper 00256, Orlando, FL, USA, 26–31 March 2000. [Google Scholar]
  7. Saito, E.; Nishinoto, S.; Endo, H.; Yamamoto, R.; Kawasaki, K.; Sato, J. Development of 700 °C Class Steam Turbine Technology. Mitsubishi Heavy Ind. Tech. Rev. 2017, 54, 10–15. [Google Scholar]
  8. Imano, S.; Doi, H.; Kajikawa, K. Modification of alloy 706 for high-temperature steam turbine rotor application. In Proceedings of the Superalloys 718, 625, 706 and Derivatives, Pittsburgh, PA, USA, 2–5 October 2005. [Google Scholar]
  9. Schike, P.W.; Schwant, R.C. Alloy 706 use, process optimization, and future directions for GE gas turbine rotor materials. In Proceedings of the Superalloys 718, 625, 706 and Various Derivatives, Pittsburgh, PA, USA, 17–20 June 2001. [Google Scholar]
  10. Yamamoto, R.; Kadoya, Y.; Nakano, T.; Tanaka, Y.; Magoshi, R.; Ueta, S.; Noda, T. Development of Ni-based superalloy for advanced 700 °C-class steam turbine. In Proceedings of the Fifth International Conference on Advances in Materials Technology for Fossil Power Plants, Marco Island, FL, USA, 3–5 October 2007. [Google Scholar]
  11. Yamamoto, R.; Kadoya, Y.; Nishinoto, S.; Tanaka, Y.; Okajima, T.; Ishikawa, K.; Uno, K. Development and trial manufacturing of Ni-based superalloy LTES700R for advanced 700 °C class steam turbines. In Proceedings of the Seventh International Conference on Advances in Materials Technology for Fossil Power Plants, Waikoloa, HI, USA, 22–25 October 2013. [Google Scholar]
  12. Grant, B.M.B.; Francis, E.M.; Fonseca, J.Q.; Daymond, M.R.; Preuss, M. Deformation behaviour of an advanced nickel-based superalloy studied by neutron diffraction and electron microscopy. Acta Mater. 2012, 60, 6829–6841. [Google Scholar] [CrossRef]
  13. Reedhill, R.E.; Abbaschian, R. Physical Metallurgy Principles, 3rd ed.; Brooks/Cole Publication: Boston, MA, USA, 1994; pp. 181–183. [Google Scholar]
  14. Heilmaier, M.; Leetz, U.; Reppich, B. Order strengthening in the cast nickel-based superalloy IN 100 at room temperature. Mater. Sci. Eng. A 2001, 319–321, 375–378. [Google Scholar] [CrossRef]
  15. Kocks, U.F. Theory of an obstacle-controlled yield strength: Report after an international workshop. Mater. Sci. Eng. 1977, 27, 291–298. [Google Scholar] [CrossRef]
  16. Schwarz, R.B.; Labusch, R. Dynamic simulation of solution hardening. J. Appl. Phys. 1978, 49, 5174. [Google Scholar] [CrossRef]
  17. Dollar, M.; Bernstein, I.M. The Effect of Temperature on the Deformation Structure of Single Crystal Nickel Base Superalloys. In Proceedings of the 6th International Symposium on Superalloys, The Metallurgical Society, Warrendale, PA, USA, 18–22 September 1988. [Google Scholar]
  18. Yuan, Y.; Zhong, Z.H.; Yu, Z.S.; Yin, H.F.; Dang, Y.Y.; Zhao, X.B.; Yang, Z.; Lu, J.T.; Yan, J.B.; Gu, Y.F. Microstructural evolution and compressive deformation of a new Ni–Fe base superalloy after long term thermal exposure at 700 °C. Mater. Sci. Eng. A 2014, 619, 364–369. [Google Scholar] [CrossRef]
  19. Gopinath, K.; Gogia, A.K.; Kamat, S.V.; Balamuralikrishnan, R.; Ramamurty, U. Tensile Properties of Ni-Based Superalloy 720Li: Temperature and Strain Rate Effects. Metall. Mater. Trans. A 2008, 39, 2340–2350. [Google Scholar] [CrossRef]
  20. Rao, K.B.S.; Seetharaman, V.; Mannan, S.L.; Rodriguez, P. Precipitation, deformation and fracture behaviour of a thermomechanically processed nimonic PE 16 superalloy. J. Nucl. Mater. 1981, 102, 7–16. [Google Scholar] [CrossRef]
  21. Shapiro, E.; Dieter, G.E. High temperature-high strain rate fracture of Inconel 600. Metall. Trans. 1970, 1, 1711–1719. [Google Scholar] [CrossRef]
Figure 1. The calculated equilibrium phase diagram of the Ni-Fe-based alloy using Thermo-Calc software.
Crystals 12 01433 g001
Figure 2. Tensile properties as a function of temperature in terms of ultimate tensile strength, yield strength, reduction of area, and elongation of the Ni-Fe-based alloy.
Crystals 12 01433 g002
Figure 3. SEM images of the fracture surface after tensile tests of the Ni-Fe-based alloys at (a) room temperature, (b) 700 °C, and (c) 750 °C: (a1,b1,c1) low magnification of cross-section surfaces, (a2,b2,c2) corresponding high magnification of local region in (a1,b1,c1), (a3,b3,c3) low magnification of lateral surfaces, (a4,b4,c4) corresponding high magnification of local region in (a3,b3,c3).
Crystals 12 01433 g003
Figure 4. (a1,b1,c1) Optical microscopy images of the microstructure after tensile deformation at room temperature, 700 °C, and 750 °C, respectively, (a2,b2,c2) corresponding SEM images of the microstructure, (a3,b3,c3) SEM-EDS maps of Ti, Mo, Cr, Ni of the entire region in (a2,b2,c2), respectively.
Crystals 12 01433 g004
Figure 5. (a1,b1,c1) The EBSD maps of the regions close to the fracture surfaces at room temperature, 700 °C, and 750 °C, respectively, (a2,b2,c2) corresponding grain size distribution behavior, (a3,b3,c3) corresponding grain boundary misorientation angle distribution behavior.
Crystals 12 01433 g005
Figure 6. TEM dark fields of the γ′ precipitates (a) before tensile deformation and after tensile fracture at (b) room temperature, (c) 700 °C, and (d) 750 °C, respectively.
Crystals 12 01433 g006
Figure 7. The γ′ precipitate average size and volume fraction evolution before and after the tensile tests at room temperature, 700 °C, and 750 °C.
Crystals 12 01433 g007
Figure 8. TEM bright-field images of (a1) low magnification and (a2) high magnification of dislocation configurations after tensile deformation at room temperature, (b1,c1) dislocation configurations after tensile deformation at 700 °C and 750 °C, respectively. (b2,c2) Corresponding TEM dark-field images.
Crystals 12 01433 g008
Figure 9. TEM bright-field image of grain boundary structure after tensile fracture at (a) room temperature, (b) 700 °C, and (c) 750 °C.
Crystals 12 01433 g009
Figure 10. The yield strength as a function of temperature of various Ni-based/Ni-Fe-based alloys.
Crystals 12 01433 g010
Publisher’s Note: MDPI stays neutral with regard to jurisdictional claims in published maps and institutional affiliations.

