Article

Vapour Diffusion Sitting Drop Method to Induce Nucleation of Calcium Phosphate on Exfoliated Graphene and Graphene Oxide Flakes

by
Francisco Javier Acebedo-Martínez
,
Raquel Fernández-Penas
,
Cristóbal Verdugo-Escamilla
,
Duane Choquesillo-Lazarte
and
Jaime Gómez-Morales
*
Laboratorio de Estudios Cristalográficos, IACT (CSIC-UGR), Avenida de las Palmeras 4, E-18100 Armilla, Granada, Spain
*
Author to whom correspondence should be addressed.
Crystals 2021, 11(7), 767; https://doi.org/10.3390/cryst11070767
Submission received: 2 June 2021 / Revised: 23 June 2021 / Accepted: 28 June 2021 / Published: 30 June 2021

Abstract

:
The preparation of graphene/apatite and graphene oxide/apatite hybrid nanocomposites has recently attracted great attention in the biomaterial community. The sitting drop vapor diffusion technique has been assessed as a preparative method for such nanocomposites in this work. The technique has been employed to induce heterogeneous nucleation and growth of calcium phosphate in the presence of exfoliated graphene and commercial graphene oxide flakes, both labeled with L-Alanine. Exfoliated multilayered graphene flakes were produced by sonication-assisted liquid-phase exfoliation of graphite. In both composites, the apatite nanocrystals displayed similar size and shape, but different labile and B-type carbonation contributions. Graphene and graphene oxide flakes also influenced the carbonation degree of the apatite, which was almost half that measured for the apatite blank, as well as the aggregation state of their composites. In this regard, those composites with graphene oxide formed larger aggregates because of their wider size distribution, with a high-volume percentage of nanosheets (of about 4 nm length). Overall, the method is very useful to prepare small amounts of nanocomposite with high reproducibility.

1. Introduction

In the last decades, heterogeneous nucleation and growth of calcium phosphates (hereafter CaP) on metallic supports (namely Ti and its alloys) has been a focus of intense research because of the necessity of fabricating CaP coated metallic implants for load bearing applications in the orthopedic and dental fields [1,2,3,4,5]. Comparatively, the interest on deposition of CaP on non-metallic supports, i.e., inorganic substrates and polymers, aimed to prepare implants, hybrid composites or scaffolds for applications in bone tissue engineering is more recent. In this regard, the deposition of nanocrystalline apatite (nAp) on graphene nanosheets and its derivatives to produce graphene/apatite hybrid nanocomposites, combining the bioactive properties of the nAp with the mechanical strength of graphene, has attracted much attention in the biomaterial field, with the first studies published in 2009 [6].
Synthetic nAp mimicking the apatitic constituent of bone and teeth exhibit excellent bioactivity and biocompatibility, lack of toxicity or inflammatory and immunity responses, and a relatively high bioresorbability. Comparing to stoichiometric hydroxyapatite [HA, Ca10(PO4)6(OH)2], which is the more stable and insoluble CaP, nAp is nonstoichiometric -Ca2+ and -OH deficient, incorporates carbonate ions in its crystal structure, provides a huge surface/volume ratio derived from its nanodimensions and thus, a higher solubility [7].
Graphene is a single layer of carbon atoms with sp2 hybridization bound by highly stable covalent bonds [8]. Graphene displays exceptional features such as zero-effective mass, excellent thermal conductivity, extreme stiffness, fracture toughness, no gas permeability, high mobility of charge carriers, and optical transparency [9]. It is worth highlighting the investigations of Hone and coworkers [10], who measured the mechanical properties of single-layer graphene by nanoindentation, and considered graphene as ‘the strongest material ever measured´. In addition, graphene and its derivatives, such as graphene oxide (GO) and reduced graphene oxide (rGO), have shown a good biocompatibility, which is a requirement for its biomedical applications [11]. Because of its peculiar properties, graphene is an ideal candidate as reinforcement material of CaPs nanocomposites [12].
Different preparation methods of hybrid graphene/apatite nanocomposites and their derivatives nanomaterials have been proposed along this decade of research including in situ synthesis, biomimetic mineralization, hydrothermal synthesis and chemical vapour deposition. Other methods, such as electrophoretic deposition, electrochemical deposition and thermal spray have been proposed to coat Ti-based orthopedic implants with graphene/apatite composites, improving the adhesion to the metal-composite interfaces [6].
Our laboratory has developed a biomimetic route, based on the vapour diffusion sitting drop micro-method (hereafter SDVD) [13], which has been used to induce the heterogeneous nucleation and growth of CaP films on mica sheets [14] and exfoliated multilayer graphene (G) [15]. The obtained nAps by this method are Ca- and OH- deficient and, in addition, are doped with CO32− ions. The average formula can be written as Ca(5−x)OH(1−x)(PO4)(3−x)(CO3)x, with 0 ≤ x ≤ 1. The G flakes were prepared by the sonication assisted liquid-phase exfoliation technique of graphite (LPE [16]) using lysozyme, L-tryptophan, N-acetyl-D-glucosamine and chitosan as dispersing surfactants. The LPE technique produced multilayer flakes. The SDVD method is performed in a closed environmental microreactor called crystallization mushroom, which is composed of a crystallization chamber in the upper part, and a gas generation chamber on the lowest side containing NH4HCO3 [13,14,15]. We deposit 12 aqueous Ca2+- and HPO42−-bearing droplets arranged circularly in the crystallization chamber. The deposition of CaP in these droplets takes place by diffusion of CO2 and NH3 gases (produced in situ by decomposition of NH4HCO3) through the droplets, where the substrates are found dipped. When using chitosan-G as heteronucleant, the nAp/chitosan-G composites were more homogeneous than with the other biomolecule-G flakes.
In this work, our aim is to assess the SDVD route as a preparative method of G/nAp and GO/nAp nanocomposites. L-alanine (L-Ala) is the biomolecule used as dispersing surfactant to assist LPE of graphite, and for the equilibration of GO suspensions by sonication. L-Ala, a non-essential aminoacid with an isoelectric point (i.e., p.) close to neutrality (L-Ala, i.e., p. = 6.00), is expected to not alter significantly the pH profile of the droplets, and then their aqueous speciation and CaP saturation indices, but to stimulate the biocompatibility of the resulted composite [17]. We have analyzed the following aspects of the crystallization process in detail: (i) the evolution of aqueous speciation and CaP supersaturation triggered by the diffusion of CO2 and NH3 inside the Ca/acetate/phosphate bearing droplets of the mushroom, (ii) the morphological, structural and spectroscopic characteristics of the precipitated solids, and (iii) the particle size distribution (PSD) and ζ-potential of their aqueous suspensions. Finally, we have compared SDVD with previous G/nAp preparation techniques to highlight the benefits of this method, and provided a plausible formation mechanism of the nanocomposites.

2. Materials and Methods

2.1. Preparation of G and GO Suspensions in Presence of L-Ala

The G flakes were prepared by LPE using L-Ala as dispersing surfactant. 20 mL glass vials containing 10 mL of suspensions prepared by mixing 100 mg of graphite powder (purity 99.99%, Sigma-Aldrich, St. Louis, MO, USA) and 1.78 mg of L-Ala (purity 99%, Sigma-Aldrich, St. Louis, MO, USA) in ultrapure water ((Milli-Q, Millipore, Burlington, MA, USA), were sonicated in an ice bath for 5 h. The suspensions were centrifuged at 3500 rpm for 5 min and the supernatant was again sonicated for 1 h and centrifuged for 5 min. After centrifugation, the supernatant was carefully removed with a micropipette. The pH of graphite suspensions prior LPE was 5.23, and after sonication, the pH of as-prepared G-Ala suspensions was 6.24. These samples were stored at 4 °C prior the mineralization experiments. They were stable for more than 1 week.
The GO-Ala suspensions (10 mL) were prepared by mixing 1 mL of GO (purity 99.99%, Sigma-Aldrich, St. Louis, MO, USA) with 1.78 mg of L-Ala, and sonicated for 30 min. The pH of GO suspensions was 1.73, and after sonication in presence of L-Ala, it raised to 3.15.

2.2. Precipitation Method

Precipitation experiments were carried out by SDVD method implemented in a crystallization mushroom (Triana Sc. & Tech, S.L., Armilla, Spain) at 20 °C. The setup is composed of two cylindrical glass chambers and a glass cover. The crystallization (upper) and gas generation chambers (lower) are connected through a hole of 6 mm diameter to allow vapour diffusion. The glass cover and the crystallization chamber were sealed with silicon grease. Each mushroom hosted 12 droplets of 40 µL in the crystallization chamber. Droplets were prepared by mixing 20 µL of either G or GO suspensions plus 50 mM Ca(CH3COO)2 with 20 µL of 30 mM (NH4)2HPO4, whereas the gas generation chamber contained 3 mL of a 40 mM NH4HCO3. Control droplets without G or GO flakes were included in each mushroom. Trials lasted 21 days. At the end of the experiments, the mushrooms were opened, and each droplet was collected and transferred to an eppendorf. After centrifugation for 15 min and 10,000 r.p.m the supernatant was collected and the pellet was washed with 1 mL of ultrapure water. Again, centrifugation was used to retire the supernatant. Two washes were performed. The final pellet was left to dry at ambient temperature for 1 day. The average pH of the droplets after nAp mineralization was 8.40 for those containing G and 7.50 for those containing commercial GO.

2.3. Characterization Methods

Ionic solutions inside the crystallization mushroom were modeled with speciation software Visual MINTEQ 3.1 [18]. Characterization of precipitates was carried out by X-ray diffraction (XRD), Fourier transform infrared spectroscopy (FTIR/ATR), Raman microspectroscopy, electron microscopies (SEM and TEM), dynamic light scattering (DLS) and electrophoretic mobility (ζ-potential).
XRD patterns were acquired with a Bruker D8 Advance Series II Vario diffractometer (Bruker AXS, Karlsruhe, Germany) equipped with a Ge (111) primary monochromator and a LynxEye fast silicon strip detector. Generator operating conditions were 40 kV and 40 mA, using Cu Kα radiation. Measurements were performed in transmission geometry between Mylar foils with the beam focalized in the detector.
Fourier transform infrared spectra (FTIR) were recorded in transmittance mode within the wavelength range from 4000 cm1 to 400 cm1 using a Perkin-Elmer Spectrum One FTIR spectrometer (Perkin Elmer, Shelton, USA). Pellets with ~1 wt% sample in anhydrous KBr were prepared and pressed with a hydraulic pump at 10 tons. Pure KBr pellets were used to record the background. Deconvolution of the peak in the wavelength range from 850–890 cm1 attributed to the υ2CO3 vibration mode was done with Magic Plot Student 2.9.3. Software (Magicplot Systems, LLC, Saint Petersburg, Russia).
Raman spectra were recorded with a LabRAMHR spectrometer (Jobin–Yvon, Horiba, Tokyo, Japan). The excitation line was provided by a diode laser emitting at a wavelength of 532 nm while a Peltier cooled charge–couple device (CCD) (1064 6 256 pixels) was used as detector.
TEM observations were performed with a TEM Libra 120 Plus instrument at 80 kV (Carl Zeiss, Jena, Germany) provided of Microanalysis by Electron Energy Loss Spectroscopy (EELS). Prior to observation, samples were dispersed in absolute ethanol (≥99.8% v/v) and deposited on copper microgrids coated with FORMVAR carbon film. FESEM observations were done with a GEMINI LEO 1500 model Instrument (Zeiss, Jena, Germany). Samples were deposited on conventional supports, and then they were carbon–sputtered prior the observation.
Crystal size distribution (CSD) and electrophoretic mobility (ζ-potential) were analyzed with a Zetasizer Nano ZS analyzer (Malvern Instruments Ltd., Malvern, UK) in aqueous suspensions (~0.5 mg/ mL, 25 °C) contained in disposable polystyrene cuvettes. For ζ-potential versus pH measurements, the MPT-2 autotitrator (Malvern Instruments Ltd., Malvern, UK) was employed to adjust the pH of the suspensions. Diluted HCl and NaOH solutions (0.25 and 0.1 M, respectively) were used as titration agents without any additional electrolyte.

3. Results

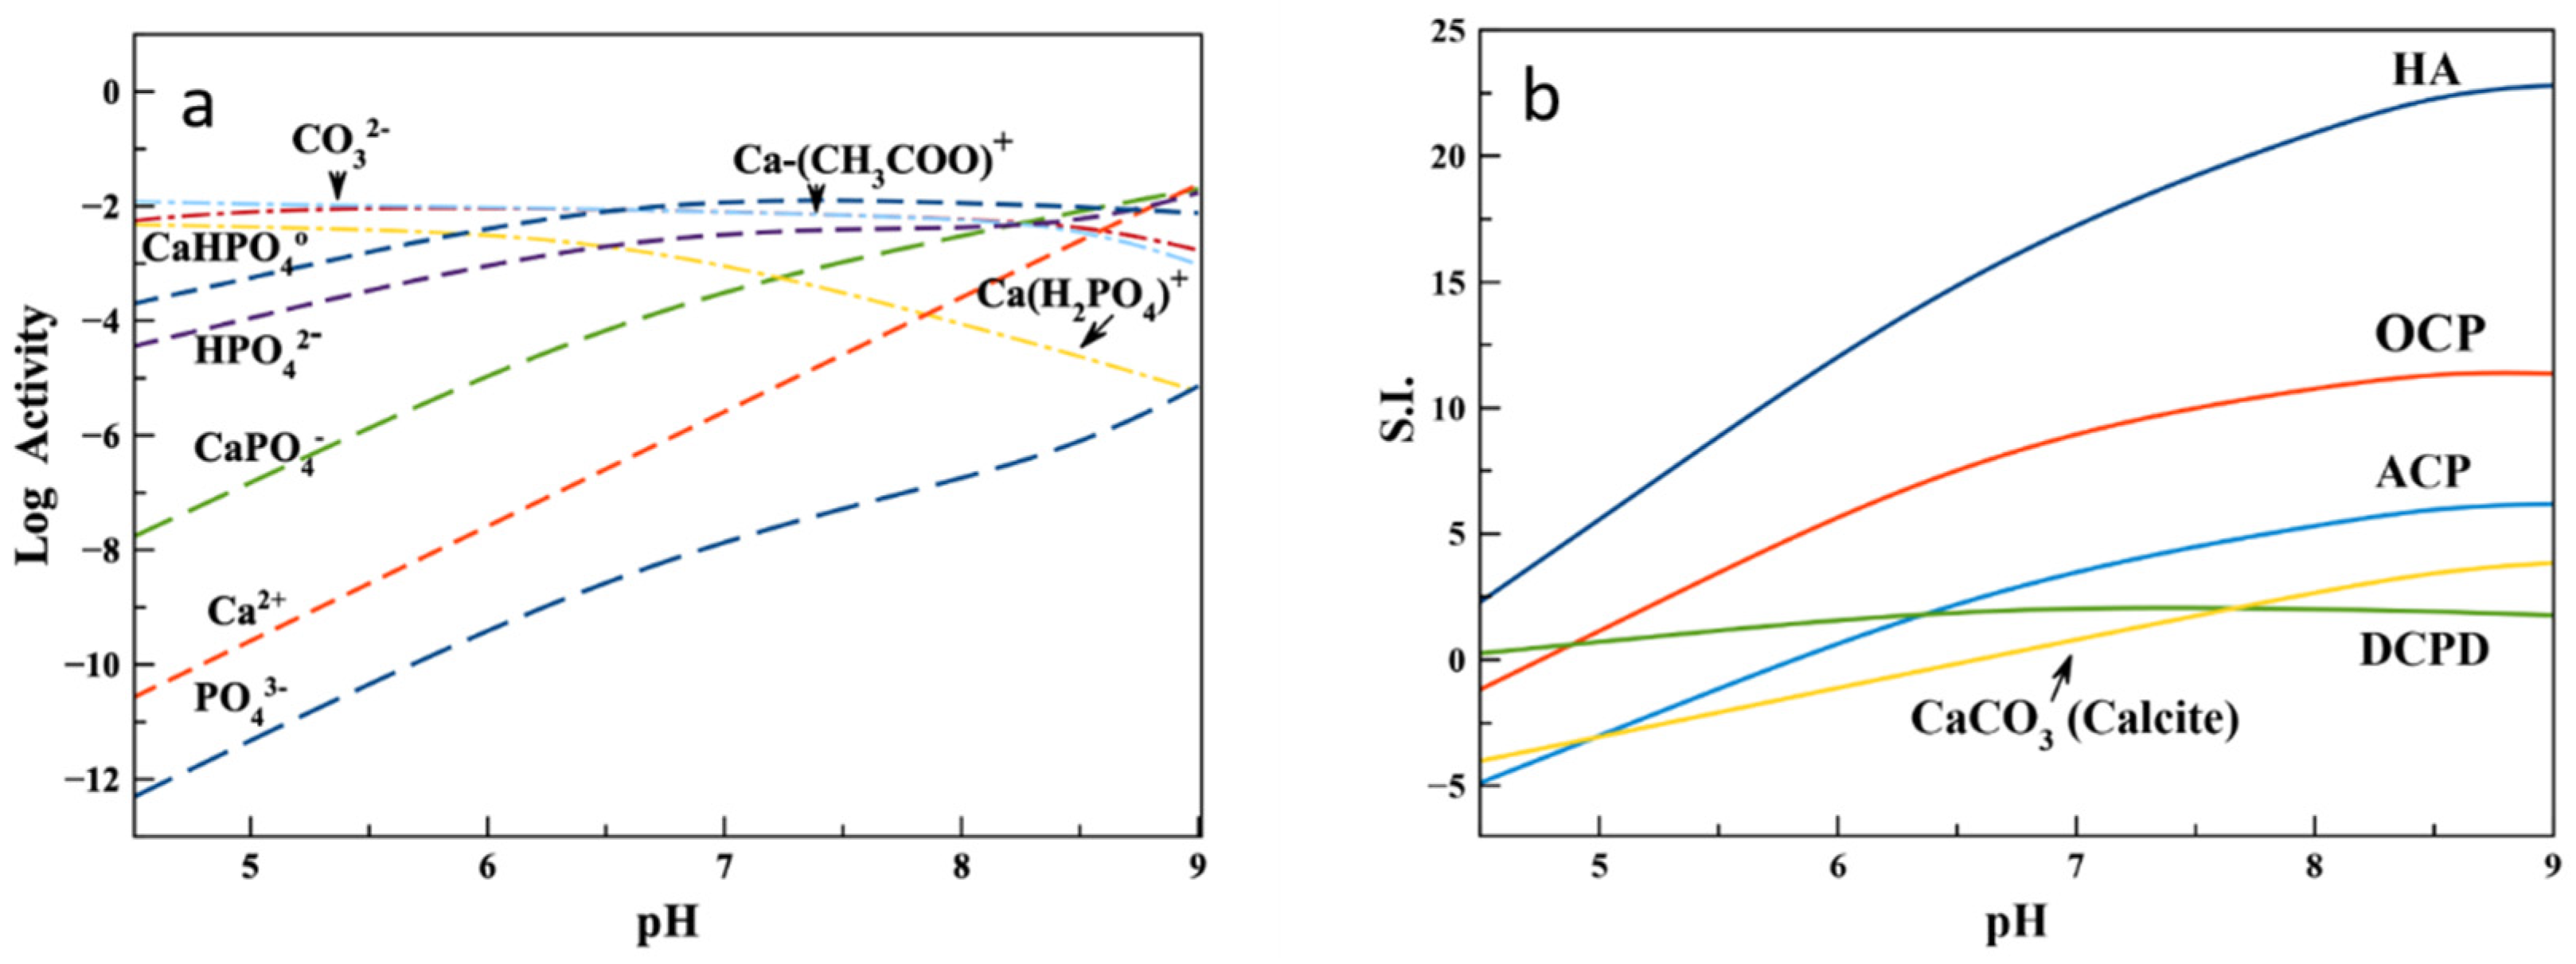
3.1. Ionic Speciation and Evolution of Saturation Indices Respect to Main CaP Phases

Our target is to assess the SDVD method as a tool to prepare G/nAp and GO/nAp nanocomposites by inducing CaP heterogeneous nucleation on G and GO flakes. Firstly, we have studied the progression of the ionic speciation and supersaturation in such a system.
Figure 1a shows the evolution with pH of the activities of main aqueous species, namely calcium, acetate, phosphate, and ionic and neutral pairs, determined by using Visual MINTEQ 3.1 software [18]. For the sake of simplicity, the activity of L-Ala was not considered in the calculations, and activities of carbonate species (except that of CO32−) and ammonium are not plotted. It is shown a slight decrease in the activity of Ca(CH3COO)+ with pH whereas the activity of Ca2+ rises suddenly, which indicates that the free increase of pH allows the destabilization of the complex, and leads to Ca2+ delivery into the solution. In addition, it is observed a decrease in the activity of Ca(H2PO4)+ ion pair with pH, whereas the activity of both CaPO4 and CaHPO40 pairs increase with it.
It should be noted that soluble CaPO4 pairs were proposed as the growth units on apatite precipitation in the nineties [19]. However, for a long time, there was some consensus around the Posner´cluster, a spherical aggregate of composition Ca9(PO4)6 with a diameter of ca. 9.5 Å, as the structural building unit of the amorphous calcium phosphate (ACP) [20], the precursor phase of apatite [21]. More recent investigations revealed that soluble aggregates of [Ca(HPO4)3]4− species act as pre-nucleation clusters and, after taking up Ca2+ from the solution they form insoluble post-nucleation clusters of [Ca2(HPO4)3]2− that precipitate as ACP [22]. Because of the ability of ACP to quickly transform into Ap (more stable phase) in aqueous media, ACP coated with citrate and doped with fluoride ions delays its conversion, and has been proposed as a potent dental remineralizing agent [23].
Figure 1b shows the progressive supersaturation (S.I. > 1) of the aqueous phase either with respect to HA above pH 4.5, OCP above pH 5, or ACP above pH 6. However, it remains slightly supersaturated with respect to DCPD in the whole pH interval. It is also shown that S.I. increases with pH in the order ACP < OCP < HA while it decreases for DCPD, whose stability interval is located at the acidic pH range. Thus, according to Ostwald’s rule of stages, the precipitation sequence at pH > 6 is first the ACP, then OCP, and finally HA. The probability of CaCO3 (calcite) precipitation in the whole pH range is negligible.
In a previous reference additive-free-sheets-free SDVD essay (blank) the pH value increased slowly from 5.4 to reach a plateau of pH 8.2 after 7 days [13]. The OCP phase was observed after 1 day of vapour diffusion, and the nAp after 7 days, being the OCP to nAp transformation almost complete. There were no observations at shorter times. In the present work, we decided to extend the experimental time to 21 days. The pH variations when using G-Ala and GO-Ala were from 6.24 to 8.40 and from 3.15 to 7.50, respectively.

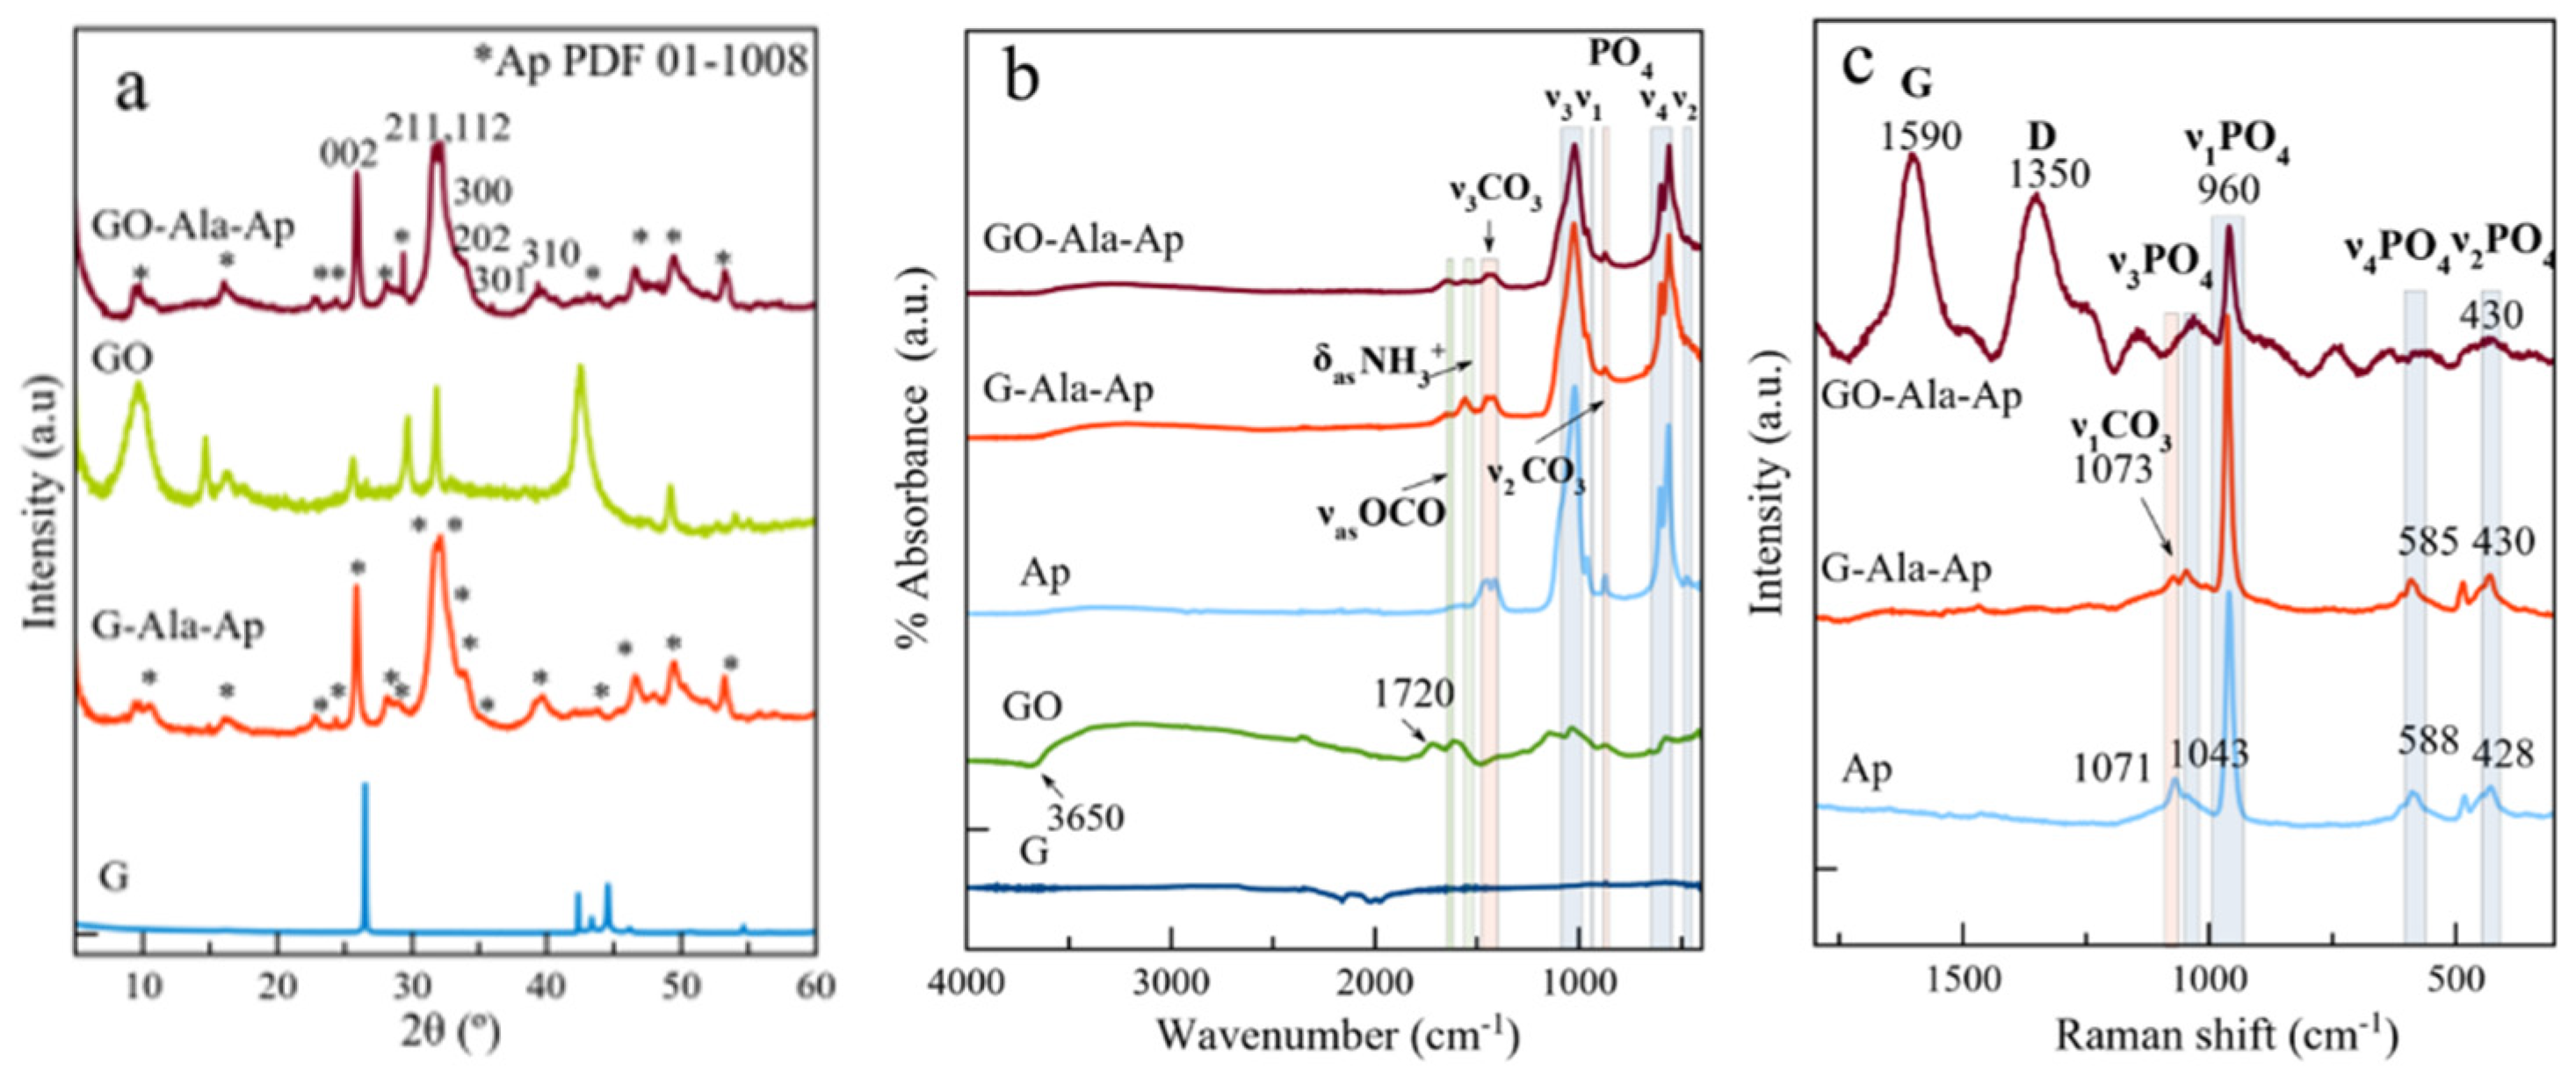
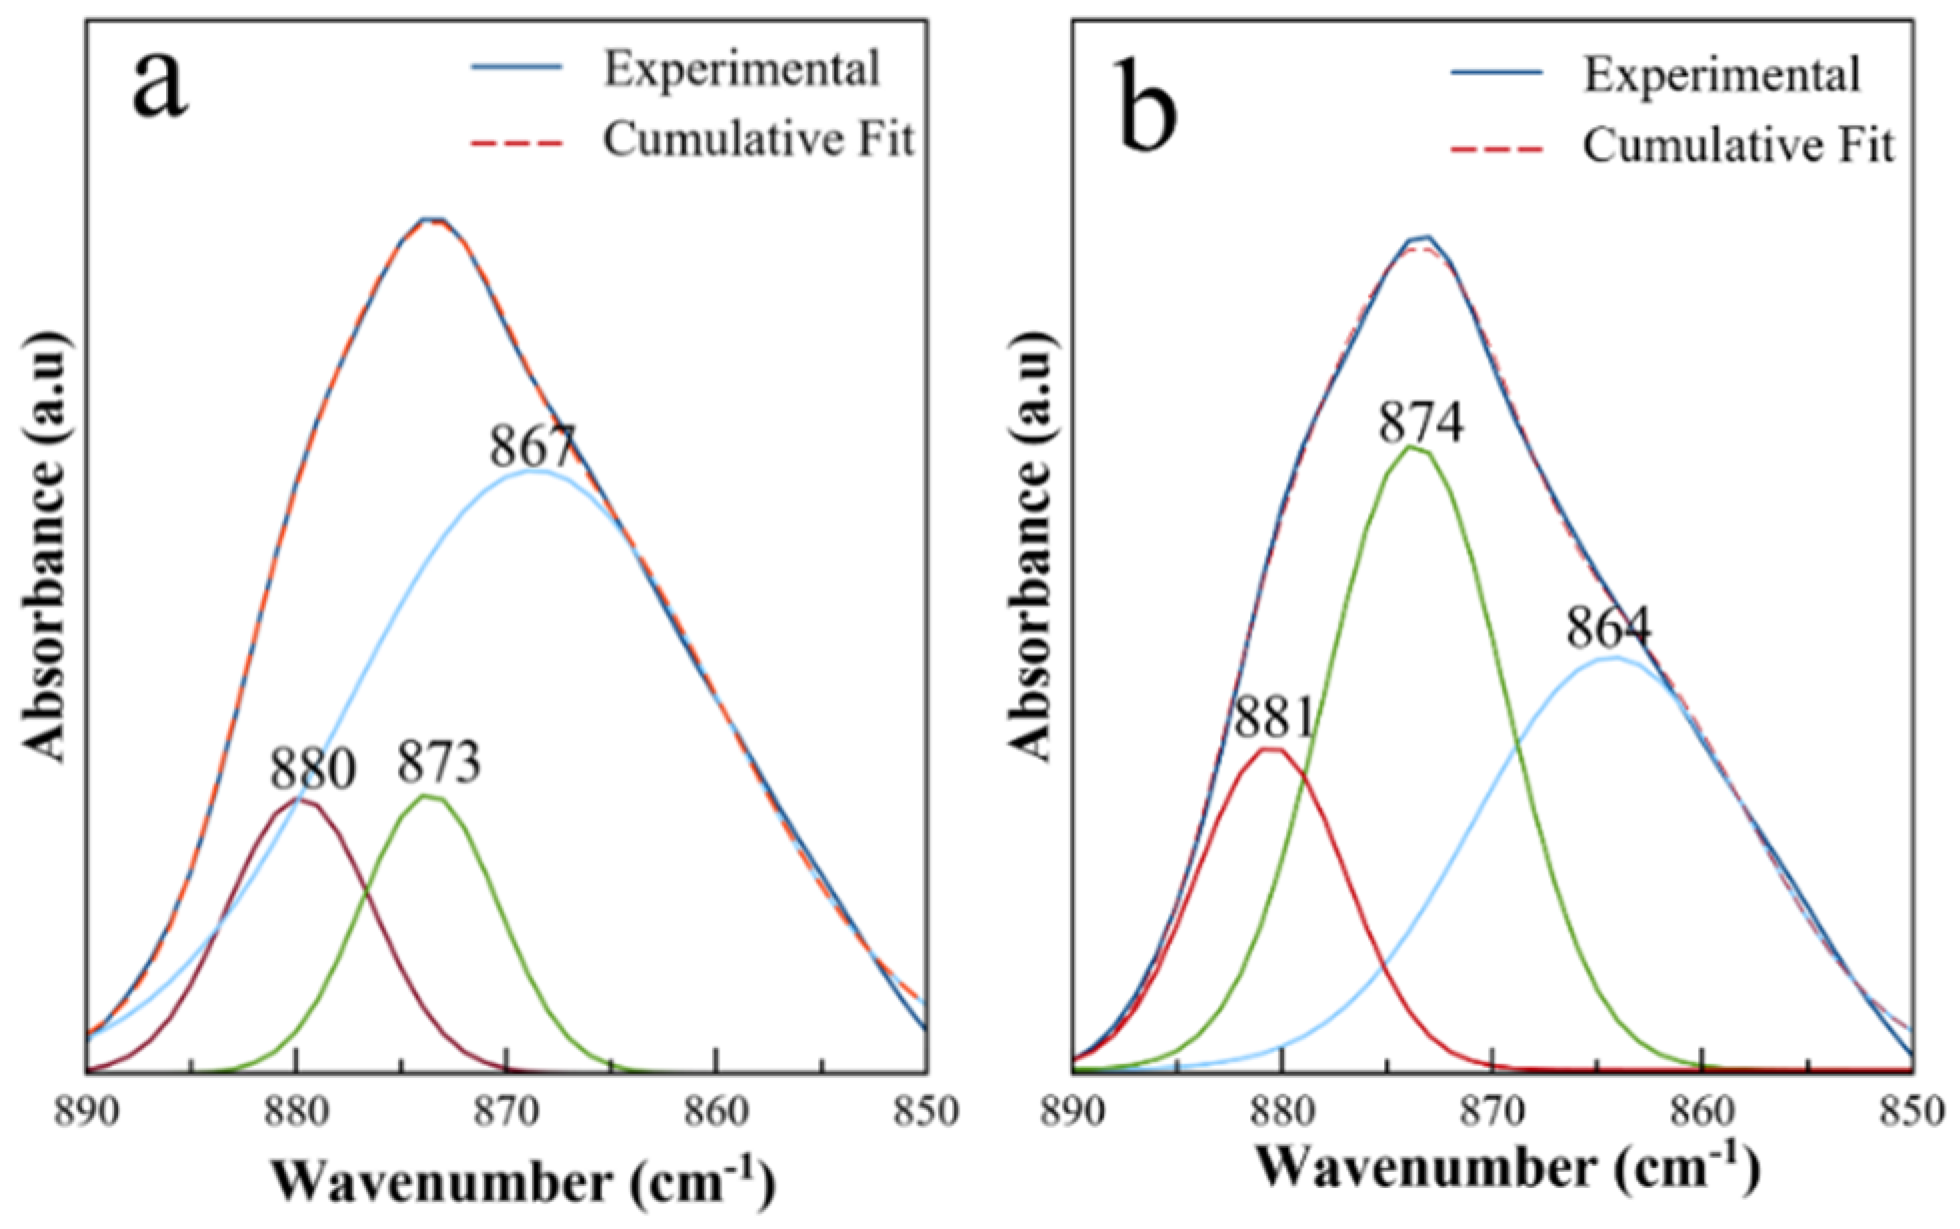
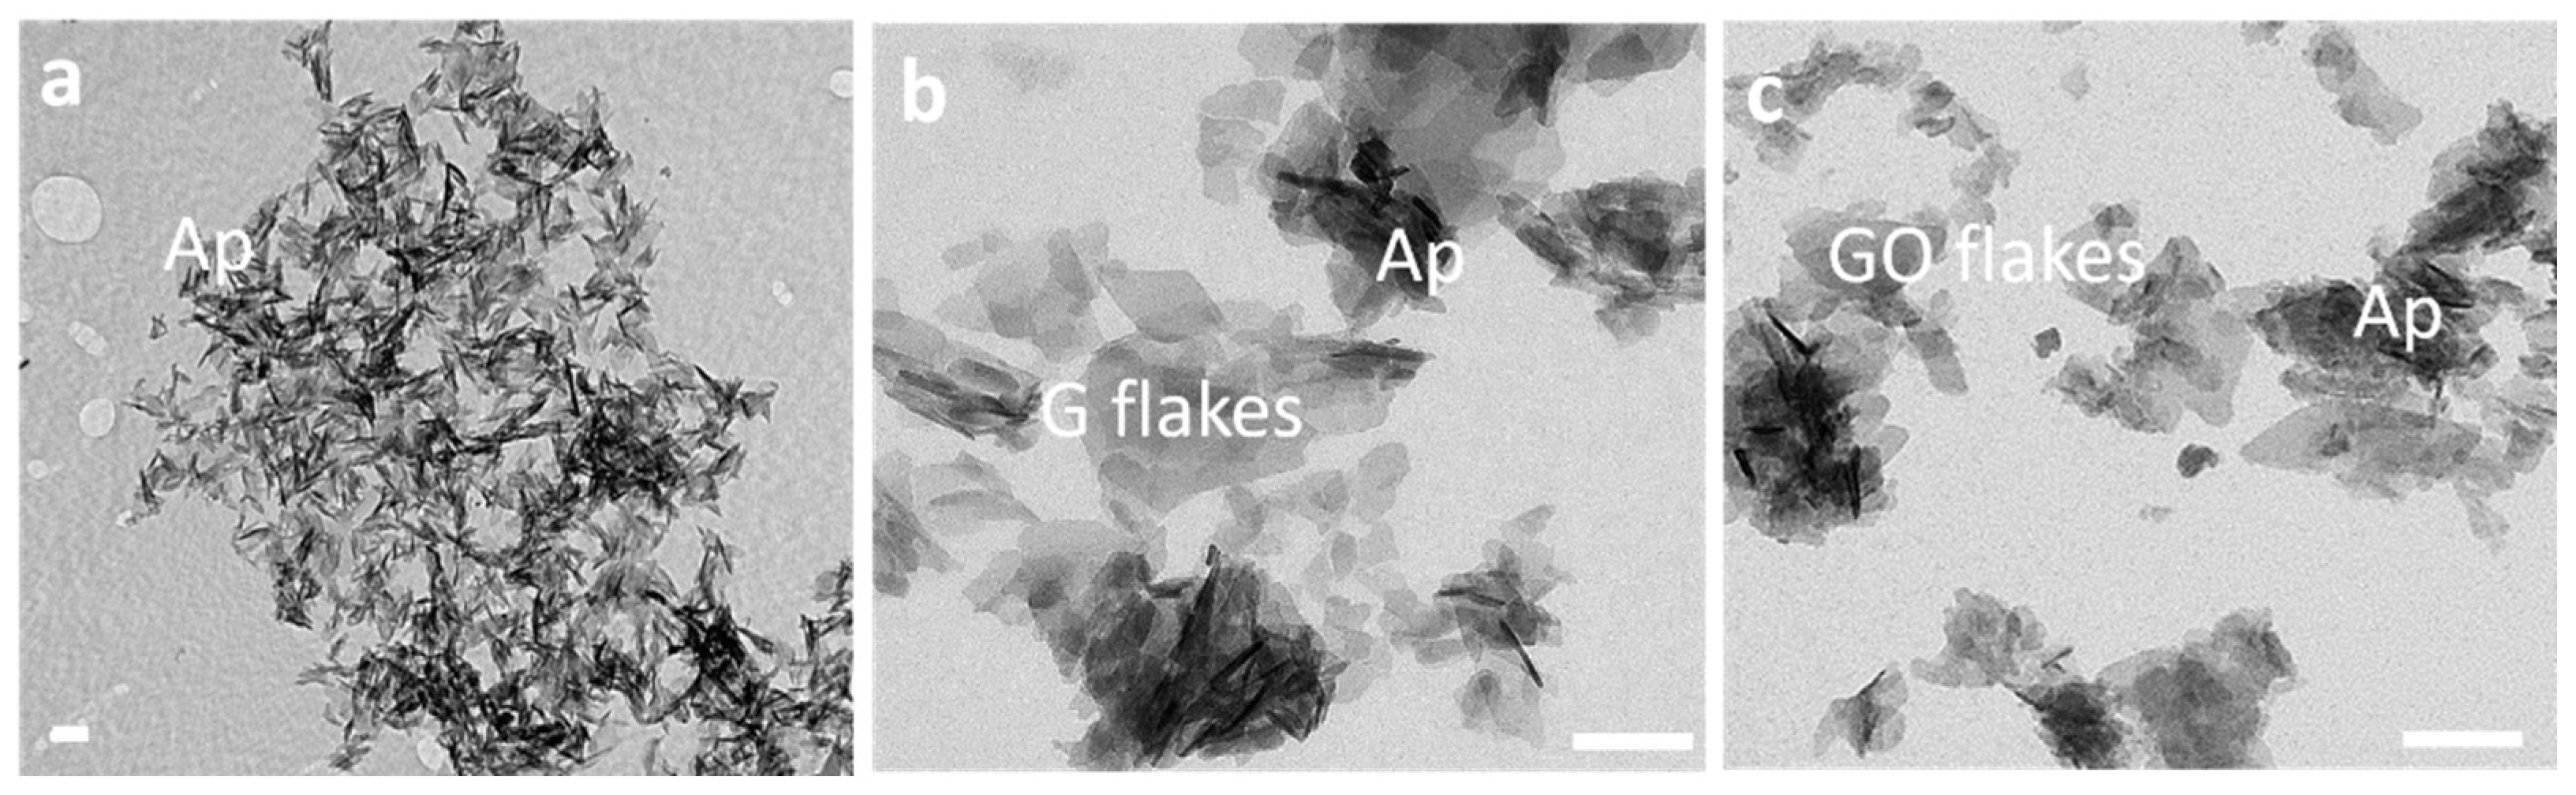
3.2. Structural, Morphological and Spectroscopic Features of Precipitated Solids

The XRD patterns of precipitated solids after 3 weeks using both supports (Figure 2a) shows the characteristic reflections of the apatite phase (PDF 01-1008) whose peaks are located at 2θ = 25.87° corresponding to the (002) plane, the triplet at 31.77°, 32.19° and 32.90° (planes (211), (112) and (300)) respectively, the reflections at 33.9°, 35.48° and 39.81° (planes (202), (301) and 310)) and other minor peaks in the 2θ range from 40–55°. There are no remarkable differences between both precipitates. The reflections of G and GO are hidden by those of nAp, as the latter is the majority phase of the composite. The broadness of the unsolved reflection between 31° and 33° is characteristic of nAp [7,13,24]. The presence of additional CaP phases as octacalcium phosphate (OCP, Ca8H2(PO4)6·5H2O, PDF 44-0778) and brushite (DCPD, ASTM 11-295) is ruled out because of the absence of the main reflections at 4.8°, plane (100) of OCP, and at 11.6°, plane (020) of DCPD.
Figure 2b shows FTIR spectra of either G-Ala, GO-Ala, Ap (blank), and both G-Ala-Ap and GO-Ala-Ap composites prepared by VDSD. The significant peaks are shown in Table 1. The FTIR spectrum of G do not show any significant feature, however the GO shows a broad peak around 3650 cm−1 in the high frequency zone attributed to the stretching mode of O-H bond, and the C=O stretching, appearing at 1720 cm−1 in pristine GO, which characterize carboxylic groups. The main band at 1000–1100 cm−1 corresponds to the asymmetric stretching mode of PO43− groups (υ3PO4) while the small band at ~958–960 cm−1 is ascribed to the symmetric stretching (υ1PO4). The less intense bands at ~608 and 564 cm−1 are due to the bending mode of PO43− groups (υ4PO4), while that at ~470 cm−1 corresponds to the υ2PO4 vibration mode. The presence of carbonate (CO32−) signals is attested by vibrational υ3CO3 mode, with maxima around ~1414 cm−1 and 1473 cm−1, and the υ2CO3 mode with a small peak around 875 cm−1.
The overall degree of carbonation of the nAp can be assessed from the intensity of carbonate bands relative to those of phosphate using the area ratio rCO3/PO4 between the υ3CO3 and the υ1υ3PO4 contributions [25]. Following this method, overall carbonation degrees of 3.3 ± 0.3, 1.40 ± 0.2, and 1.78 ± 0.2 were estimated for Ap (blank), G-Ala-Ap, and GO-Ala-Ap, respectively. The heteronucleant surfaces strongly influence carbonate incorporation to the apatite nanoparticles of the composites leading to carbonation degrees of around one-half of that estimated for the Ap (blank). Bands at 1620 cm−1 are assigned to antisymmetric stretching as -OCO- and that at 1590 cm−1 to antisymmetric deformation δasNH3+ of L-Ala, characteristic of the zwitterionic form [CH3CH(NH3+)COO] [26].
The complementary spectroscopic characterization by Raman spectroscopy (Figure 2c) shows that spectral features of apatite arise at 958–962 cm−11PO4), 430 cm−12PO4), 585–588 cm−14PO4), and 1043 cm−13PO4), while those of CO31CO3) are found at around 1069–1071 cm−1 [27]. No clear spectroscopic signals of G could be observed, i.e., the characteristic D, G, and 2D signals of the graphene flakes at around 1330, 1560, and 2670 cm−1, respectively [28]. However, the GO-Ala-Ap spectrum displays two bands at 1350 and 1590 cm−1 respectively, which could be due to D and G bands, because of a higher mass percentage of GO respect to apatite.
Detailed analysis of the deconvoluted υ2CO3 peak of the FTIR spectra of Ap precipitated in the presence of G-Ala (Figure 3a) and GO-Ala (Figure 3b) revealed the chemical environments of the carbonate species within the apatite phase [29,30]. We found three major contributions at ~880 cm−1 (equal intensity in both spectra), ~873 (low intensity in G-Ala-Ap, main contribution in GO-Ala-Ap), 867–864 cm−1 (main contribution in G-Ala-Ap). These bands correspond to A-type (CO32− ions replacing -OH), B-type (CO32− ions replacing -PO43−), and labile (surface CO32− species entrapped in the non-apatitic hydrated layer of the apatite). A-type substitutions were similar in both samples, while labile CO32− species and B-type substitution were found predominant in the nAp particles of the G-Ala-Ap and GO-Ala-Ap samples, respectively.
TEM images of the nanocomposites show a polydisperse population of isolated flakes with an irregular shape, along with nAp needles deposited on some flakes (Figure 4b,c). The nAp particles display a thin hexagonal shape with their long axis parallel to the c crystallographic axis. They are similar to those shown in the reference sample (Figure 4a). In both images no clump of crystals outside the flake surfaces was found. The length of the exfoliated G flakes, measured in the TEM images, roughly oscillated between 30 and 350 nm (Figure 4b), whereas in GO flakes it fell in the range from 30 nm to 150 nm (Figure 4c). Bigger flakes were found when inspected the samples under scanning electron microscopy (see Supporting Information, Figure S1). The average length (L) and width (W) of nAp bonded to G and GO were L= 58 ± 6 nm, W= 6 ± 1nm (Figure 4b), and L = 49 ± 13 nm, W= 5 ± 1 nm (Figure 4c), respectively.
The presence of graphite with incipient exfoliation coexisting with G flakes was, nevertheless, observed with SEM. This trouble indicated that exfoliation by LPE was uncompleted (not shown), and was the reason by which the XRD pattern of the exfoliated G sample (Figure 2a), containing residues of graphite, was almost similar to that of graphite.

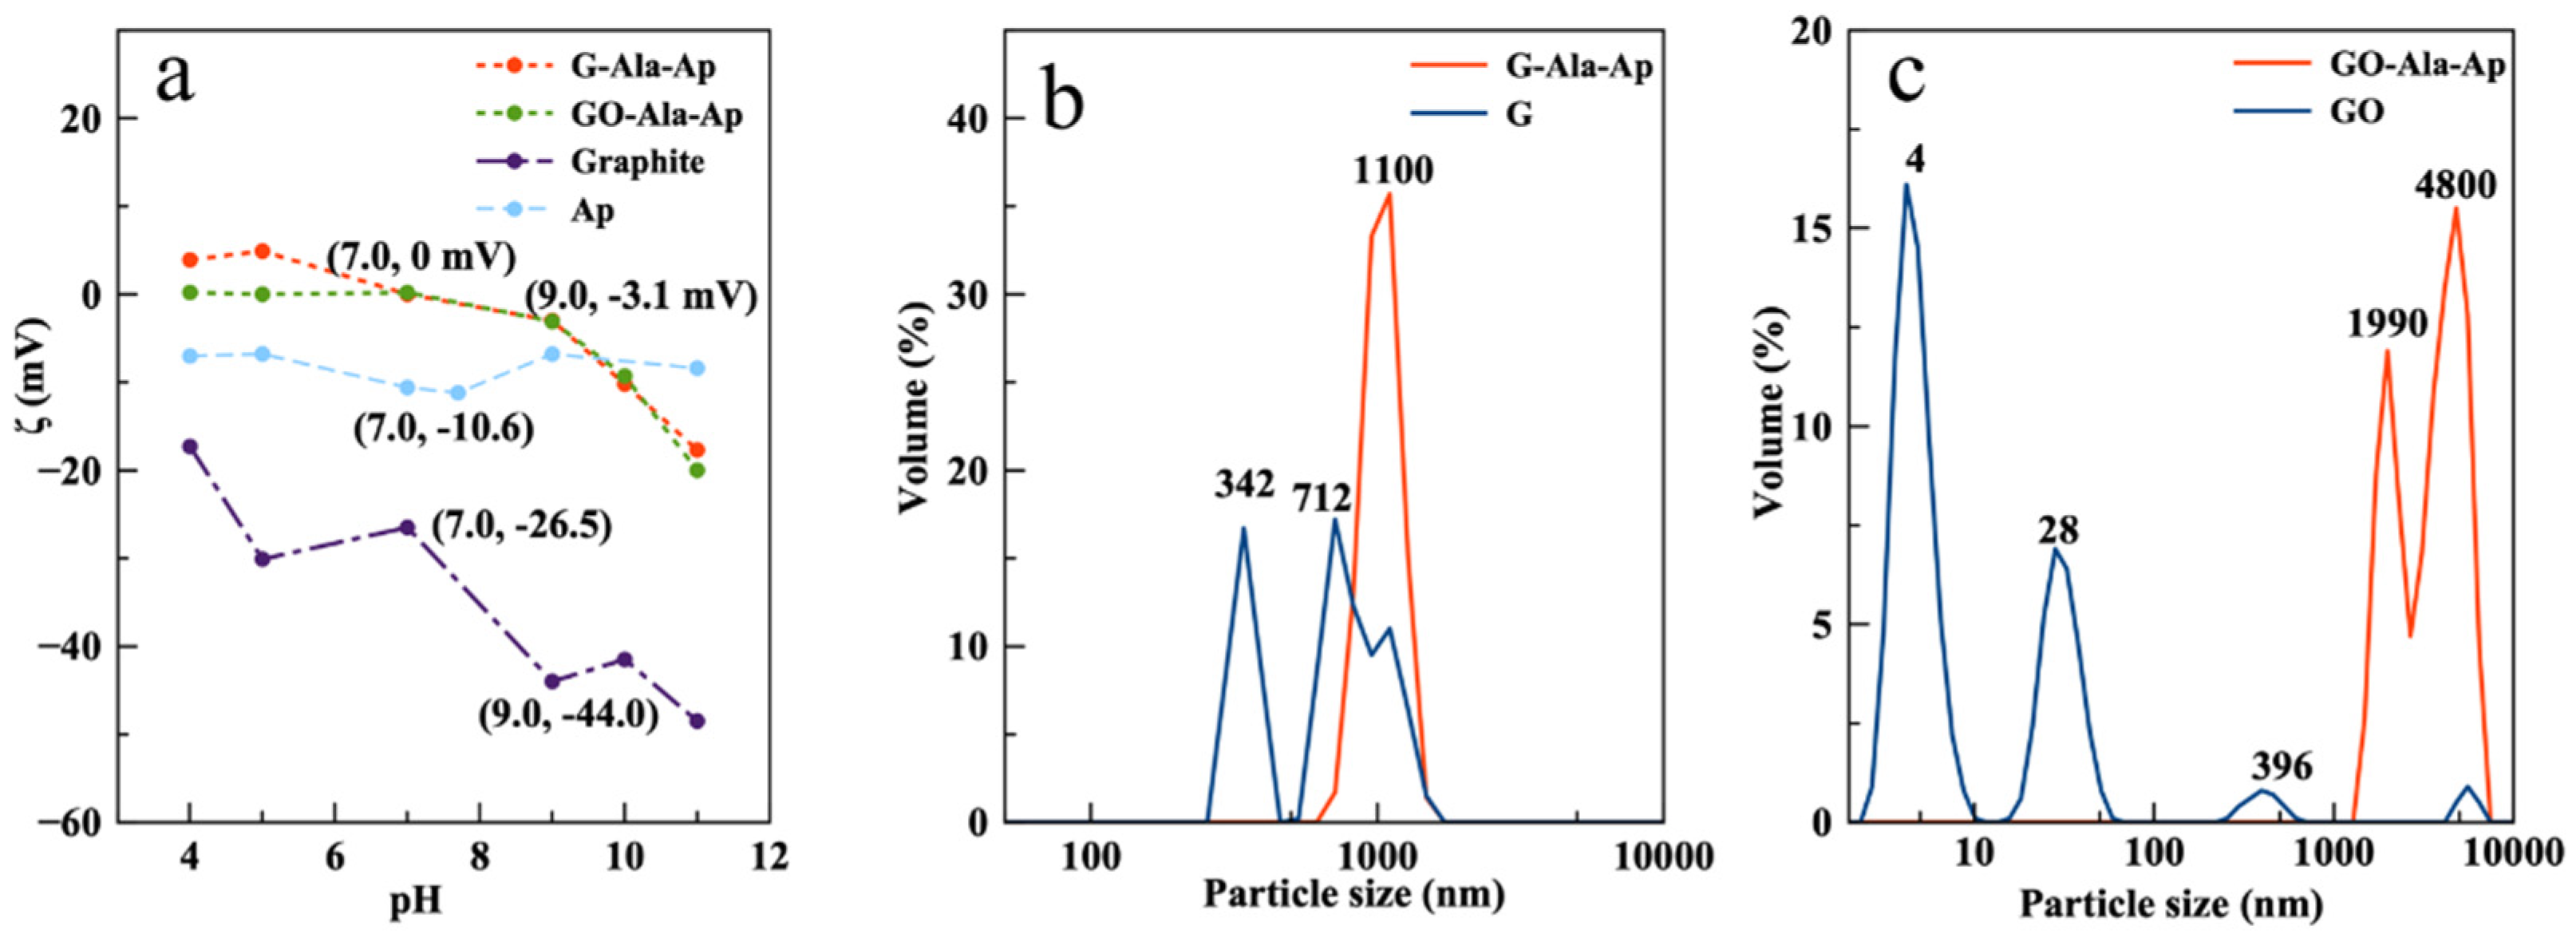
3.3. ζ-Potential and Particle Size Distribution

The analysis of the electrophoretic mobility (i.e., ζ-potential) of pristine graphite particles vs pH allows us to gain insights into the stability of its aqueous suspensions, which is necessary for exfoliation by sonication, as well as about the induced nucleation ability of CaP of its surface.
The tendency of the colloid to disperse or aggregate is related to the size and surface charge of the particles, the latter related to the sign and absolute value of the ζ-potential. As higher is the ζ-potential in absolute value, higher is the stability of the suspension. In this regard, the decrease of ζ-potential with pH (Figure 5a) reveals the high stability of aqueous graphite suspensions, after an initial period of wetting by agitating the particles in distilled water and sonication. After LPE and SDVD crystallization the pH raised to 8.4 and ζ-potential tended to 0, leading to aggregation of the G-Ala-Ap composite. The same trend was found after nucleation of nAp on GO flakes. Comparing PSD of GO and G, it was observed the wider PSD of GO with averages sizes centered around 4, 28, 396, and 5560 nm, the latter being representative of a small group of flakes, as that shown in Figure S1b. In G, the PSD was centered at 342 and 712 nm, being those sizes representative of the G flakes, as shown in Figure S1a. After Ap nucleation and growth, the G-Ala-Ap composites displayed PSD centered at 1100 nm, and the GO-Ala-Ap at 1990 and 4800 nm. Comparing the average sizes of G, GO, and nAp with those of their composites a trend of the composites to aggregate is inferred. This tendency is higher for GO-Ala-Ap than for G-Ala-Ap.

4. Discussion

The VDSD method allowed us to prepare G-Ala-Ap and GO-Ala-Ap composites by nucleation of CaP on exfoliated G and commercial GO. The method was implemented in a crystallization mushroom, a multi-droplet device with useful functionalities: (i) it allows to prepare several samples under different conditions in the same trial, (ii) enables in situ observation and monitoring of the precipitation by optical microscopy and microspectroscopy [27], and (iii) the amount of additive (i.e., biomolecules) needed for the study is very small. Other methods reported in the literature to produce this type of composites such as hydrothermal synthesis, chemical vapor deposition, biomimetic mineralization, or in situ synthesis [6] yield larger quantities of sample. These methodologies present, however, some disadvantages such as only a condition per trial is permitted, the impossibility of monitoring the precipitation process by microscopic characterization, and the relatively high consumption of ´tailored additives´. Thus, considering the features of VDSD, this method can be very useful to prepare small amounts of sample.
Notable differences in the average size and homogeneity of G-Ala-Ap and GO-Ala-Ap composites were found in spite of the average length and width of the nAp crystals coating their surfaces were similar. Only small differences were observed concerning their carbonation degree and the different contribution of labile and B-type carbonation. The differences in size and homogeneity of the composites were found to be due to the trend of GO-Ala-Ap composite to form larger aggregates. Considering that both G and GO neutralize surface charge after Ap deposition (the ζ-potential tended to zero), even when starting from a different functionalization with L-Ala (pH 6.24 and 3.15, respectively), the tendency of GO to form larger aggregates might be due to its wider PSD compared to G. In the formation of those aggregates the smaller GO flakes are the mainly involved. The LPE technique thus yielded multilayer G flakes with a narrower PSD than commercial GO flakes, even assuming that exfoliation was not successfully completed.
The difference in L-Ala functionalization of G and GO flakes is due to the hydrophobic/hydrophilic character of their surfaces and the different sonication times to which they were exposed. Exfoliation of graphite required a minimum of 5 h, being the function of the dispersing biomolecule to intercalate between G layers, preventing G from re-aggregation [31] and to label the flakes surfaces
Due to the zwitterionic character of L-Ala ([CH3CH(NH3+)COO]; i.e., p. = 6.0), within the pH interval at which the exfoliation took place, between 5.23 and 6.24, the aminoacid remained with net charge (z+ + z) close to 0. As it behaved as a nonpolar aminoacid, the bonding to the more hydrophobic G surface could have taken place by Van der Waals interactions. This type of interactions was also involved in the adsorption of L/D-Ala on carbon nanotubes [32].
In GO flakes, instead, the hydrophilicity of their surfaces resulted from the distribution of oxygen-containing functional groups such as epoxides (C-O-C), hydroxyl (-OH), carboxylic acids (-COOH), and other carbonyls (C=O) groups [33]. The pH of the aqueous suspension was 1.73. The functionalization with L-Ala (pH interval from 1.73 to 3.15) must have taken place through hydrogen bonding between -COOH groups of the L-Ala and the oxygenated groups of GO at the surface, rather than through electrostatic interactions of -NH3+ groups with the carboxylates present at the edge the GO sheets [34], since the latter ones were protonated at these pHs. The interaction GO/L-Ala is very weak comparing to that with aminoacids with cationic, polar, or aromatic groups [35].
In both cases, the labeling with the biomolecule must favor the stability of the suspensions, and the interaction at the solid-solution interface between the flakes and the early formed CaP. In particular, the -COO- groups of the anchored L-Ala, at pH above 6 point toward the solution, thus providing electrostatic repulsion of the flakes between themselves and acting as nucleators of CaP, by anchoring Ca2+ ions from the surrounding supersaturated solution.
On the other hand, the findings in TEM images suggest the role of the functionalized G and GO in surface-induced nucleation, diminishing the energy barrier for nucleation, thus favoring the heterogeneous nucleation and the growth of the apatite [36]. The presence of the flakes in the supersaturated solution can also explain from a thermodynamic point of view why the apatite particles displayed nanosized dimensions. The decrease of Gibbs free energy in the system can take place either by the growth of the nuclei or by primary aggregation of the early nanosized units. If the second mechanism is active, the template may interact with the primary particles, stabilizing them and minimizing their tendency to aggregation, thus favoring the formation of nanocrystals, rather than larger crystals [13].

5. Conclusions

The preparation of G-Ala-Ap and GO-Ala-Ap composites by surface induced nucleation of CaP on exfoliated G and commercial GO employing the SDVD method has been analyzed and compared. In both composites, nanocrystalline apatite particles were found coating the flakes. The nanocrystals displayed similar shape and size, but different contributions of labile and B-type carbonation. G and GO flakes also influenced the carbonation degree of the apatitic part of the composites, which is almost half that measured for the nAp blank. DLS measurements revealed the tendency of GO-Ala-Ap composites to form larger aggregates compared to those G-Ala-Ap. This finding was related to the wider size distribution of GO sheets and the presence of a high-volume percentage of GO nanosheets of about 4 nm length. Labeling of G and GO surfaces with L-Ala was dominated by Van der Waals and H-bond interactions, respectively. The method allows the preparation of small amounts of nanocomposite with high reproducibility.

Supplementary Materials

The following are available online at https://www.mdpi.com/article/10.3390/cryst11070767/s1, Figure S1. (a) SEM image showing pristine graphite and G flakes prepared by sonication assisted liquid phase exfoliation of graphite in presence of Ala, and (b) SEM micrograph showing a commercial GO flake.

Author Contributions

Conceptualization, J.G.-M.; Investigation, F.J.A.-M., D.C.-L., R.F.-P., J.G.-M., and C.V.-E.; Methodology, J.G.-M., F.J.A.-M., R.F.-P.; Supervision, J.G.-M.; Writing—original draft preparation, J.G.-M.; writing—review and editing, J.G.-M.; funding acquisition, J.G.-M. and D.C.-L. All authors have read and agreed to the published version of the manuscript.

Funding

This research was funded by Spanish Research Agency of the Spanish Ministry of Science and Innovation, cofounded with FEDER (UE): “Bioscaffold project” grant number PGC2018-102047-B-I00 (MCIU/AEI/FEDER, UE).

Acknowledgments

The Research Team belong to “Crystallization Factory: Thematic Network for the Advancement of Applied Crystallography” (Ref. RED2018-102574-T, MCIU/AEI). The Scientific Instrumentation Centre of the University of Granada is acknowledged for technical assistance in SEM and TEM.

Conflicts of Interest

The authors declare no conflict of interest. The funding sponsors had no role in the design of the study; in the collection, analyses, or interpretation of data; in the writing of the manuscript, and in the decision to publish the results.

References

  1. De Groot, K.; Geesink, R.; Klein, C.P.A.T.; Serekian, P. Plasma sprayed coatings of hydroxylapatite. J. Biomed. Mater. Res. 1987, 21, 1375–1381. [Google Scholar] [CrossRef]
  2. Lucas, L.C.; Lacefield, W.R.; Ong, J.L.; Whitehead, R.Y. Calcium phosphate coatings for medical and dental implants. Colloids Surf. A Physicochem. Eng. Asp. 1993, 77, 141–147. [Google Scholar] [CrossRef]
  3. De Grootl, K.; Wolke, J.G.C.; Jansen, J.A. Calcium phosphate coatings for medical implants. Proc. Inst. Mech. Eng. Part H J. Eng. Med. 1998, 212, 137–147. [Google Scholar] [CrossRef]
  4. Gómez-Morales, J.; Rodríguez-Clemente, R.; Armas, B.; Combescure, C.; Berjoan, R.; Cubo, J.; Martínez, E.; García-Carmona, J.; Garelik, S.; Murtra, J. Controlled nucleation and growth of thin hydroxyapatite layers on titanium implants by using induction heating technique. Langmuir 2004, 20, 5174–5178. [Google Scholar] [CrossRef]
  5. Surmenev, R.A.; Surmeneva, M.A.; Ivanova, A.A. Significance of calcium phosphate coatings for the enhancement of new bone osteogenesis—A review. Acta Biomater. 2014, 10, 557–579. [Google Scholar] [CrossRef] [PubMed]
  6. Li, M.; Xiong, P.; Yan, F.; Li, S.; Ren, C.; Yin, Z.; Li, A.; Li, H.; Ji, X.; Zheng, Y.; et al. An overview of graphene-based hydroxyapatite composites for orthopedic applications. Bioact. Mater. 2018, 3, 1–18. [Google Scholar] [CrossRef]
  7. Gómez-Morales, J.; Iafisco, M.; Delgado-López, J.M.; Sarda, S.; Drouet, C. Progress on the preparation of nanocrystalline apatites and surface characterization: Overview of fundamental and applied aspects. Prog. Cryst. Growth Charact. Mater. 2013, 59, 1–46. [Google Scholar] [CrossRef] [Green Version]
  8. Duplock, E.J.; Scheffler, M.; Lindan, P.J.D. Hallmark of perfect graphene. Phys. Rev. Lett. 2004, 92, 225502. [Google Scholar] [CrossRef] [PubMed] [Green Version]
  9. Geim, A.K.; Novoselov, K.S. The rise of graphene. Nat. Mater. 2007, 6, 183–191. [Google Scholar] [CrossRef] [PubMed]
  10. Lee, C.; Wei, X.; Kysar, J.W.; Hone, J. Measurement of the elastic properties and intrinsic strength of monolayer graphene. Science 2008, 321, 385–388. [Google Scholar] [CrossRef]
  11. Yang, K.; Gong, H.; Shi, X.; Wan, J.; Zhang, Y.; Liu, Z. In vivo biodistribution and toxicology of functionalized nano-graphene oxide in mice after oral and intraperitoneal administration. Biomaterials 2013, 34, 2787–2795. [Google Scholar] [CrossRef]
  12. Sheehy, D.E.; Schmalian, J. Optical transparency of graphene as determined by the fine-structure constant. Phys. Rev. B Condens. Matter Mater. Phys. 2009, 80, 193411. [Google Scholar] [CrossRef] [Green Version]
  13. Iafisco, M.; Gómez-Morales, J.; Hernández-Hernández, M.A.; García-Ruiz, J.M.; Roveri, N. Biomimetic carbonate-hydroxyapatite nanocrystals prepared by vapor diffusion. Adv. Eng. Mater. 2010, 12, 218–223. [Google Scholar] [CrossRef]
  14. Gómez-Morales, J.; Verdugo-Escamilla, C.; Gavira, J.A. Bioinspired Calcium Phosphate Coated Mica Sheets by Vapor Diffusion and Its Effects on Lysozyme Assembly and Crystallization. Cryst. Growth Des. 2016, 16, 5150–5158. [Google Scholar] [CrossRef]
  15. Gómez-Morales, J.; González-Ramírez, L.A.; Verdugo-Escamilla, C.; Penas, R.F.; Oltolina, F.; Prat, M.; Falini, G. Induced nucleation of biomimetic nanoapatites on exfoliated graphene biomolecule flakes by vapor diffusion in microdroplets. Crystals 2019, 9, 341. [Google Scholar] [CrossRef] [Green Version]
  16. Ciesielski, A.; Samorì, P. Graphene via sonication assisted liquid-phase exfoliation. Chem. Soc. Rev. 2014, 43, 381–398. [Google Scholar] [CrossRef]
  17. Dai, Z.; Li, Y.; Lu, W.; Jiang, D.; Li, H.; Yan, Y.; Lv, G.; Yang, A. In vivo biocompatibility of new nano-calcium-deficient hydroxyapatite/poly-amino acid complex biomaterials. Int. J. Nanomed. 2015, 10, 6303–6316. [Google Scholar] [CrossRef] [PubMed] [Green Version]
  18. Gustafsson, J.P. Visual MINTEQ 3.1, Freeware Chemical Equilibrium Model. Available online: https://vminteq.lwr.kth.se/ (accessed on 23 May 2021).
  19. Lazić, S. Microcrystalline hydroxyapatite formation from alkaline solutions. J. Cryst. Growth 1995, 147, 147–154. [Google Scholar] [CrossRef]
  20. Betts, F.; Posner, A.S. An X-ray radial distribution study of amorphous calcium phosphate. Mater. Res. Bull. 1974, 9, 353–360. [Google Scholar] [CrossRef]
  21. Boskey, A.L.; Posner, A.S. Conversion of amorphous calcium phosphate to microcrystalline hydroxyapatite. A pH-dependent, solution-mediated, solid-solid conversion. J. Phys. Chem. 1973, 77, 2313–2317. [Google Scholar] [CrossRef]
  22. Habraken, W.J.E.M.; Tao, J.; Brylka, L.J.; Friedrich, H.; Bertinetti, L.; Schenk, A.S.; Verch, A.; Dmitrovic, V.; Bomans, P.H.H.; Frederik, P.M.; et al. Ion-association complexes unite classical and non-classical theories for the biomimetic nucleation of calcium phosphate. Nat. Commun. 2013, 4. [Google Scholar] [CrossRef] [Green Version]
  23. Iafisco, M.; Degli Esposti, L.; Ramírez-Rodríguez, G.B.; Carella, F.; Gómez-Morales, J.; Ionescu, A.C.; Brambilla, E.; Tampieri, A.; Delgado-López, J.M. Fluoride-doped amorphous calcium phosphate nanoparticles as a promising biomimetic material for dental remineralization. Sci. Rep. 2018, 8. [Google Scholar] [CrossRef]
  24. Martínez-Casado, F.J.; Iafisco, M.; Delgado-López, J.M.; Martínez-Benito, C.; Ruiz-Pérez, C.; Colangelo, D.; Oltolina, F.; Prat, M.; Gómez-Morales, J. Bioinspired Citrate−Apatite Nanocrystals Doped with Divalent Transition Metal Ions. Cryst. Growth Des. 2016, 16, 145–153. [Google Scholar] [CrossRef]
  25. Grunenwald, A.; Keyser, C.; Sautereau, A.M.; Crubézy, E.; Ludes, B.; Drouet, C. Revisiting carbonate quantification in apatite (bio)minerals: A validated FTIR methodology. J. Archaeol. Sci. 2014, 49, 134–141. [Google Scholar] [CrossRef] [Green Version]
  26. Garcia, A.R.; De Barros, R.B.; Lourenço, J.P.; Ilharco, L.M. The infrared spectrum of solid L-alanine: Influence of pH-induced structural changes. J. Phys. Chem. A 2008, 112, 8280–8287. [Google Scholar] [CrossRef] [PubMed]
  27. Ramírez-Rodríguez, G.B.; Delgado-López, J.M.; Gómez-Morales, J. Evolution of calcium phosphate precipitation in hanging drop vapor diffusion by in situ Raman microspectroscopy. CrystEngComm 2013, 15, 2206–2212. [Google Scholar] [CrossRef]
  28. Hao, Y.; Wang, Y.; Wang, L.; Ni, Z.; Wang, Z.; Wang, R.; Koo, C.K.; Shen, Z.; Thong, J.T.L. Probing layer number and stacking order of few-layer graphene by Raman Spectroscopy. Small 2010, 6, 195–200. [Google Scholar] [CrossRef] [PubMed]
  29. Rey, C.; Combes, C.; Drouet, C.; Cazalbou, S.; Grossin, D.; Brouillet, F.; Sarda, S. Surface properties of biomimetic nanocrystalline apatites; applications in biomaterials. Prog. Cryst. Growth Charact. Mater. 2014, 60, 63–73. [Google Scholar] [CrossRef] [Green Version]
  30. Gómez-Morales, J.; Verdugo-Escamilla, C.; Fernández-Penas, R.; Parra-Milla, C.M.; Drouet, C.; Maue-Bosc, F.; Oltolina, F.; Prat, M.; Fernández-Sánchez, J.F. Luminescent biomimetic citrate-coated europium-doped carbonated apatite nanoparticles for use in bioimaging: Physico-chemistry and cytocompatibility. RSC Adv. 2018, 8, 2385–2397. [Google Scholar] [CrossRef] [Green Version]
  31. Guardia, L.; Fernández-Merino, M.J.; Paredes, J.I.; Solís-Fernández, P.; Villar-Rodil, S.; Martínez-Alonso, A.; Tascón, J.M.D. High-throughput production of pristine graphene in an aqueous dispersion assisted by non-ionic surfactants. Carbon 2011, 49, 1653–1662. [Google Scholar] [CrossRef]
  32. Butyrskaya, E.; Zapryagaev, S.; Izmailova, E.; Nechaeva, L. Sorption Interactions between l/d-Alanine and Carbon Nanotubes in Aqueous Solutions. J. Phys. Chem. C 2017, 121, 20524–20531. [Google Scholar] [CrossRef]
  33. Aliyev, E.; Filiz, V.; Khan, M.M.; Lee, Y.J.; Abetz, C.; Abetz, V. Structural characterization of graphene oxide: Surface functional groups and fractionated oxidative debris. Nanomaterials 2019, 9, 1180. [Google Scholar] [CrossRef] [Green Version]
  34. Shih, C.J.; Lin, S.; Sharma, R.; Strano, M.S.; Blankschtein, D. Understanding the pH-dependent behavior of graphene oxide aqueous solutions: A comparative experimental and molecular dynamics simulation study. Langmuir 2012, 28, 235–241. [Google Scholar] [CrossRef] [PubMed]
  35. Pandit, S.; De, M. Interaction of amino acids and graphene oxide: Trends in thermodynamic properties. J. Phys. Chem. C 2017, 121, 600–608. [Google Scholar] [CrossRef]
  36. Liu, Y.; Huang, J.; Li, H. Synthesis of hydroxyapatite-reduced graphite oxide nanocomposites for biomedical applications: Oriented nucleation and epitaxial growth of hydroxyapatite. J. Mater. Chem. B 2013, 1, 1826–1834. [Google Scholar] [CrossRef]
Figure 1. (a) Activity of aqueous species against pH. (b) Evolution of saturation indices respect to the main CaP phases (ACP, DCPD, OCP, and HA) and CaCO3 (calcite).
Crystals 11 00767 g001
Figure 2. (a) XRD patterns of G, GO, G-Ala-Ap, GO-Ala-Ap, and Ap (blank). (b) FTIR spectra of G, GO, Ap (blank), G-Ala-Ap and GO-Ala-Ap, and (c) Raman spectra of Ap (blank), G-Ala-Ap and GO-Ala-Ap.
Crystals 11 00767 g002
Figure 3. Detailed FTIR analysis of the υ2CO3 region for Ap precipitated in the presence of (a) G-Ala and (b) GO-Ala.
Crystals 11 00767 g003
Figure 4. TEM micrographs of (a) Ap, (b) G-Ala-Ap, and (c) GO-Ala-Ap samples prepared by SDVD method. The scale bar is 100 nm.
Crystals 11 00767 g004
Figure 5. (a) ζ-potential versus pH of aqueous suspensions of pristine graphite, and of Ap, G-Ala-Ap and GO-Ala-Ap composites prepared by SDVD method. (b) Particle size distribution of exfoliated G (blue) and of G-Ala-Ap composites (red). (c) Particle size distribution of GO (blue) and of GO-Ala-Ap composite (red).
Crystals 11 00767 g005
Table 1. Characteristic FTIR bands of the obtained nanocomposites.
FTIR BandWavenumber
Graphene Oxide
O−H stretching3650 cm−1
C=O stretching1720 cm−1
PO43−
υ3PO4 asymmetric stretching1000–1100 cm−1
υ1PO4 symmetric stretching958–960 cm−1
υ2PO4 symmetric bending470 cm−1
υ4PO4 asymmetric bending608 and 564 cm−1
CO32−
υ3CO31414 cm−1 and 1473 cm−1
υ2CO3875 cm−1
L-Ala
-OCO- antisymmetric stretch1620 cm−1
-NH3+ antisymmetric deformation1590 cm−1
Publisher’s Note: MDPI stays neutral with regard to jurisdictional claims in published maps and institutional affiliations.

