
Interactions between Cationic Dye Toluidine Blue and Fibrous Clay Minerals


Abstract
:1. Introduction
2. Materials and Methods
2.1. Materials
2.2. Interactions between TB and Minerals in Solution
2.3. Instrumental Analyses
2.4. Molecular Dynamic Simulation
3. Results and Discussion
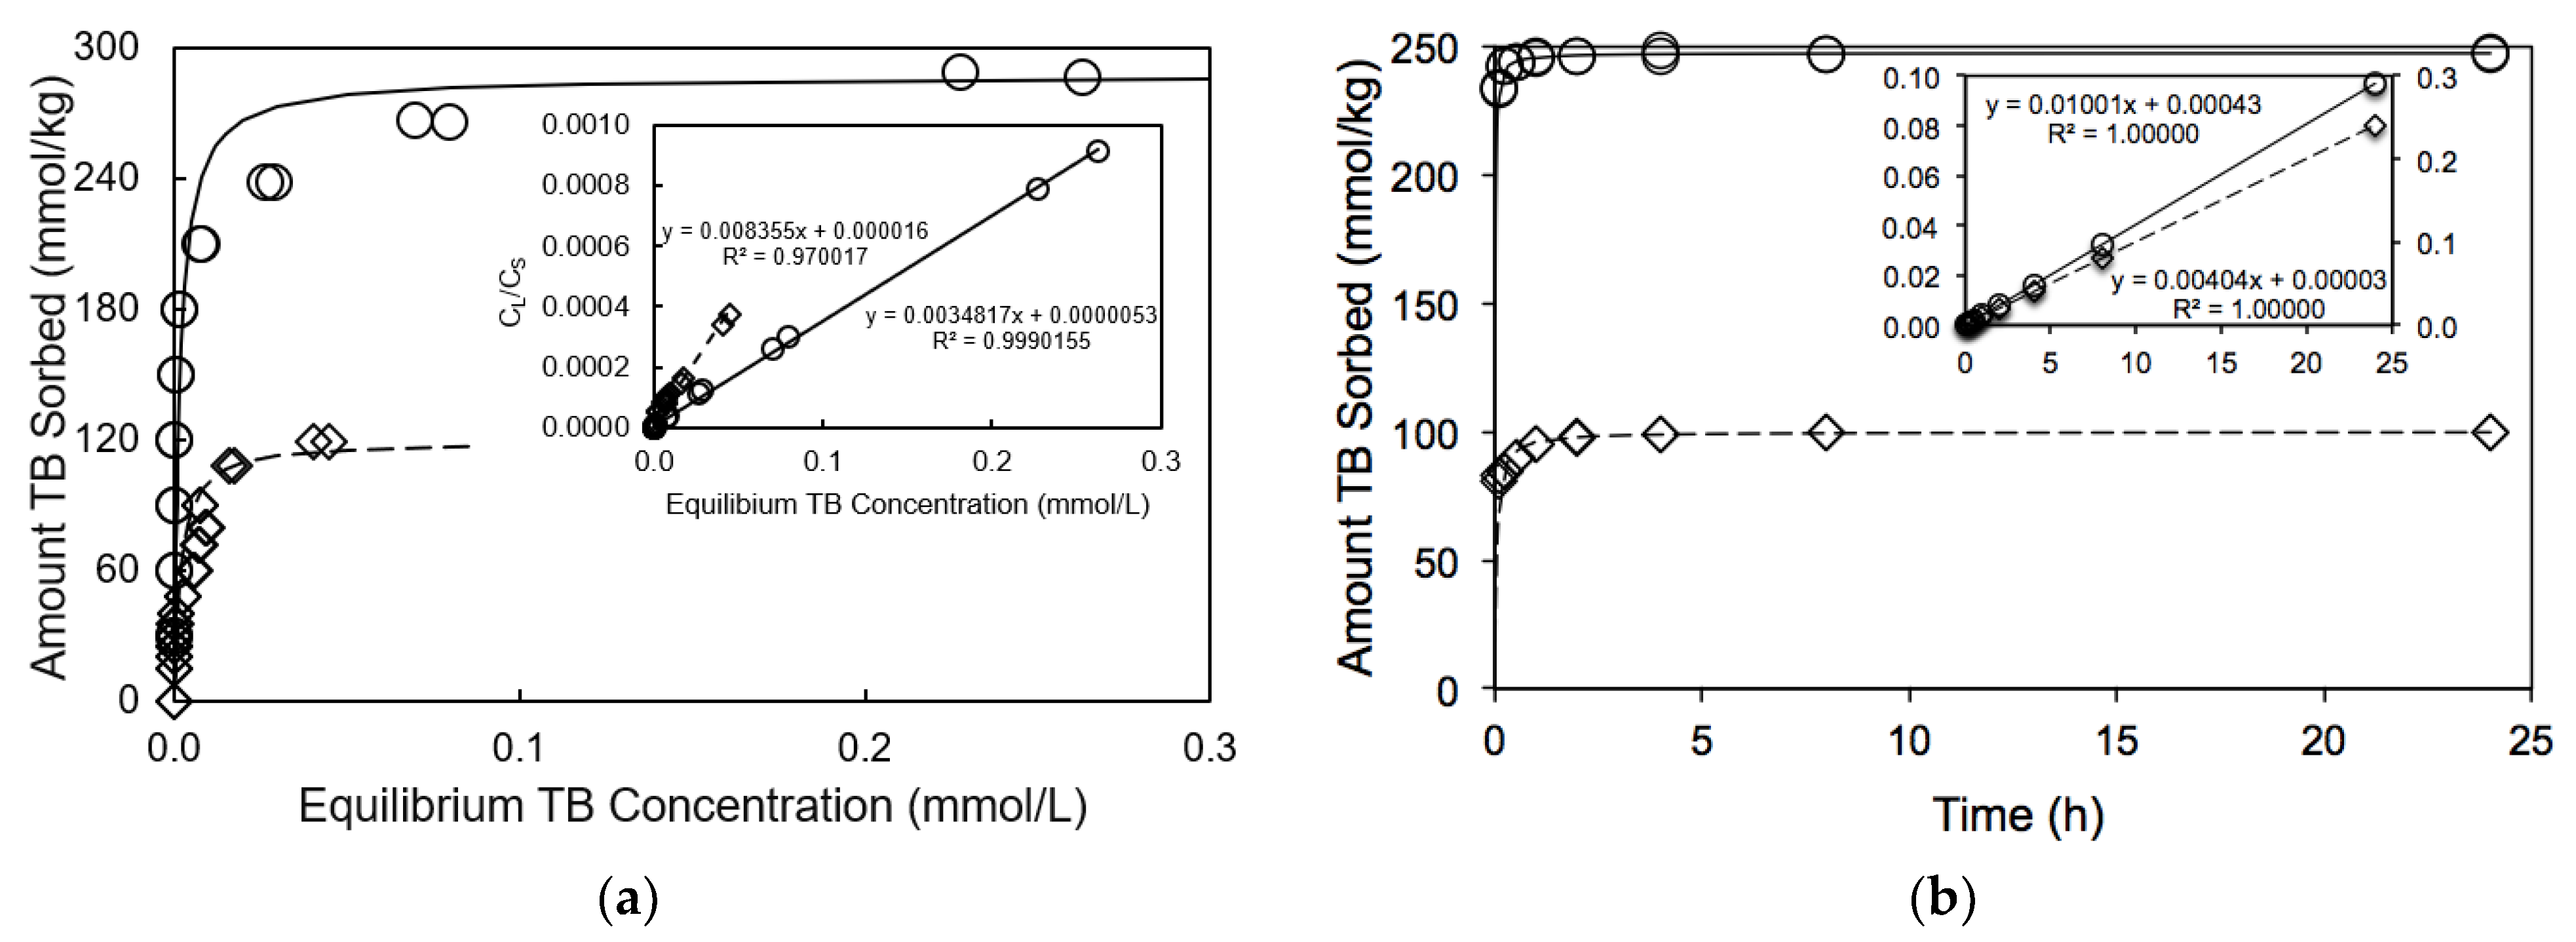
3.1. Isotherms Study of TB Interactions with Both Minerals
3.2. Kinetics of TB Interaction with Fibrous Clay Minerals
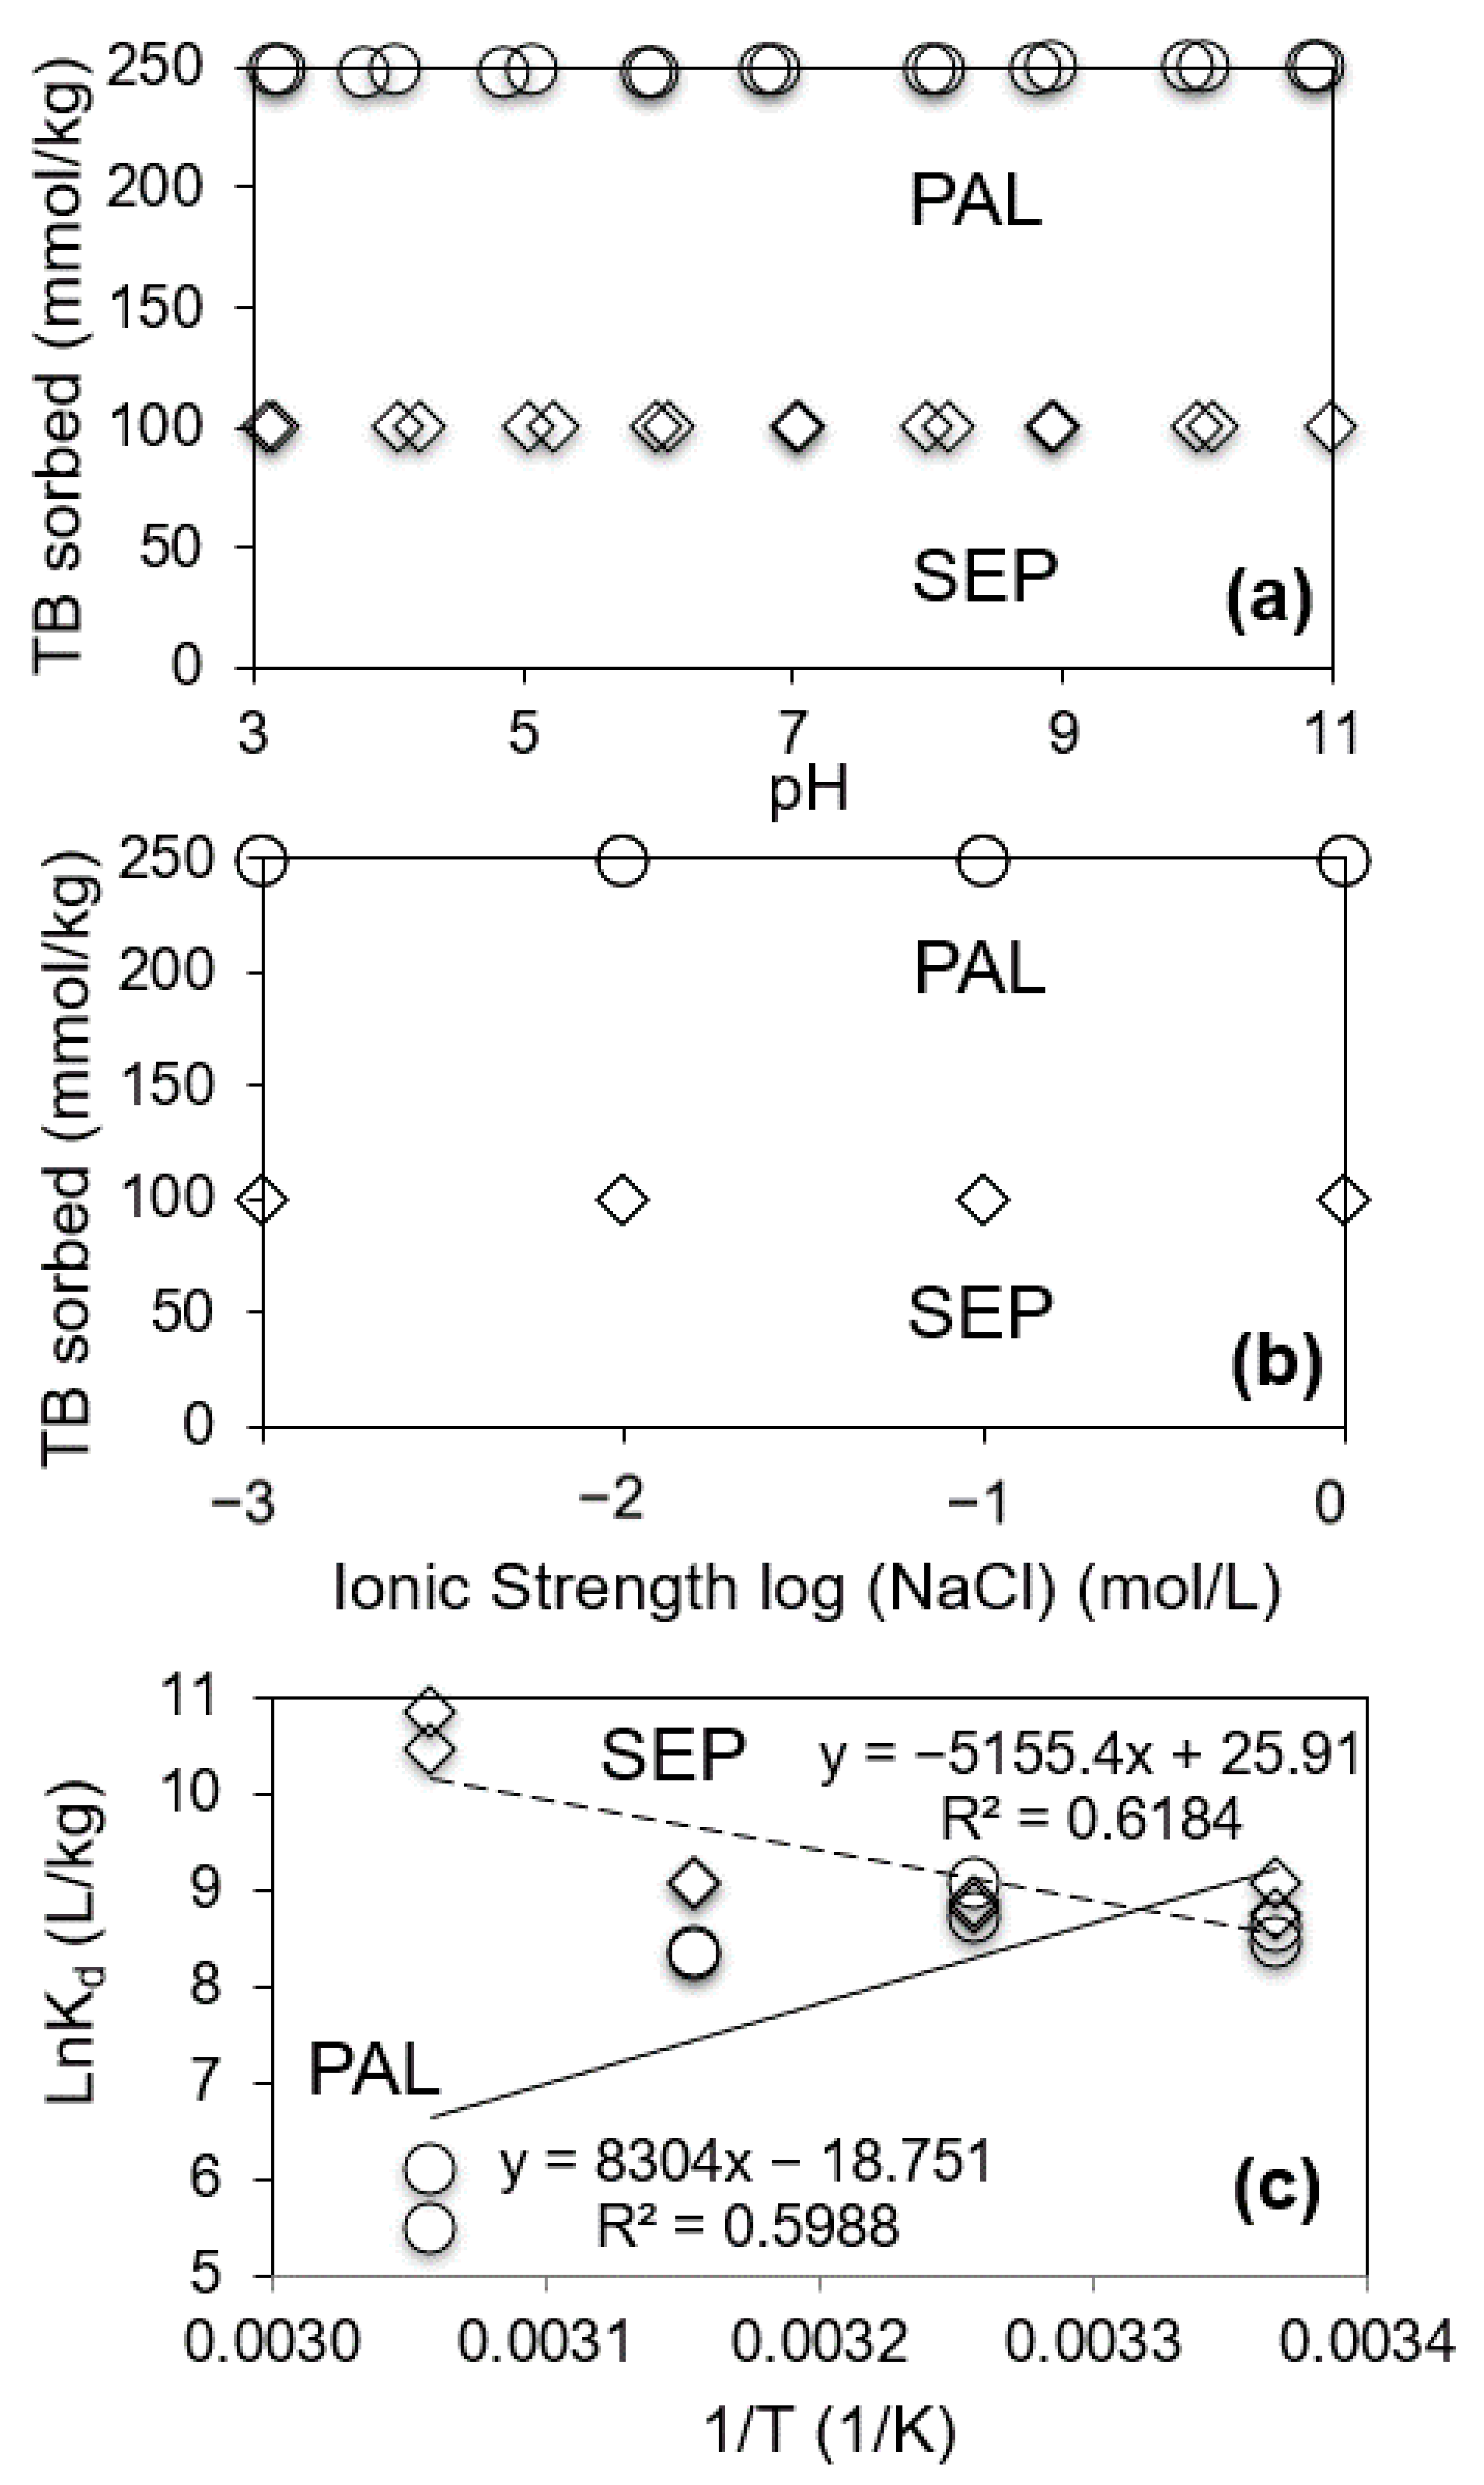
3.3. Effects of Equilibrium Solution pH, Ionic Strength and Temperature on TB Sorption
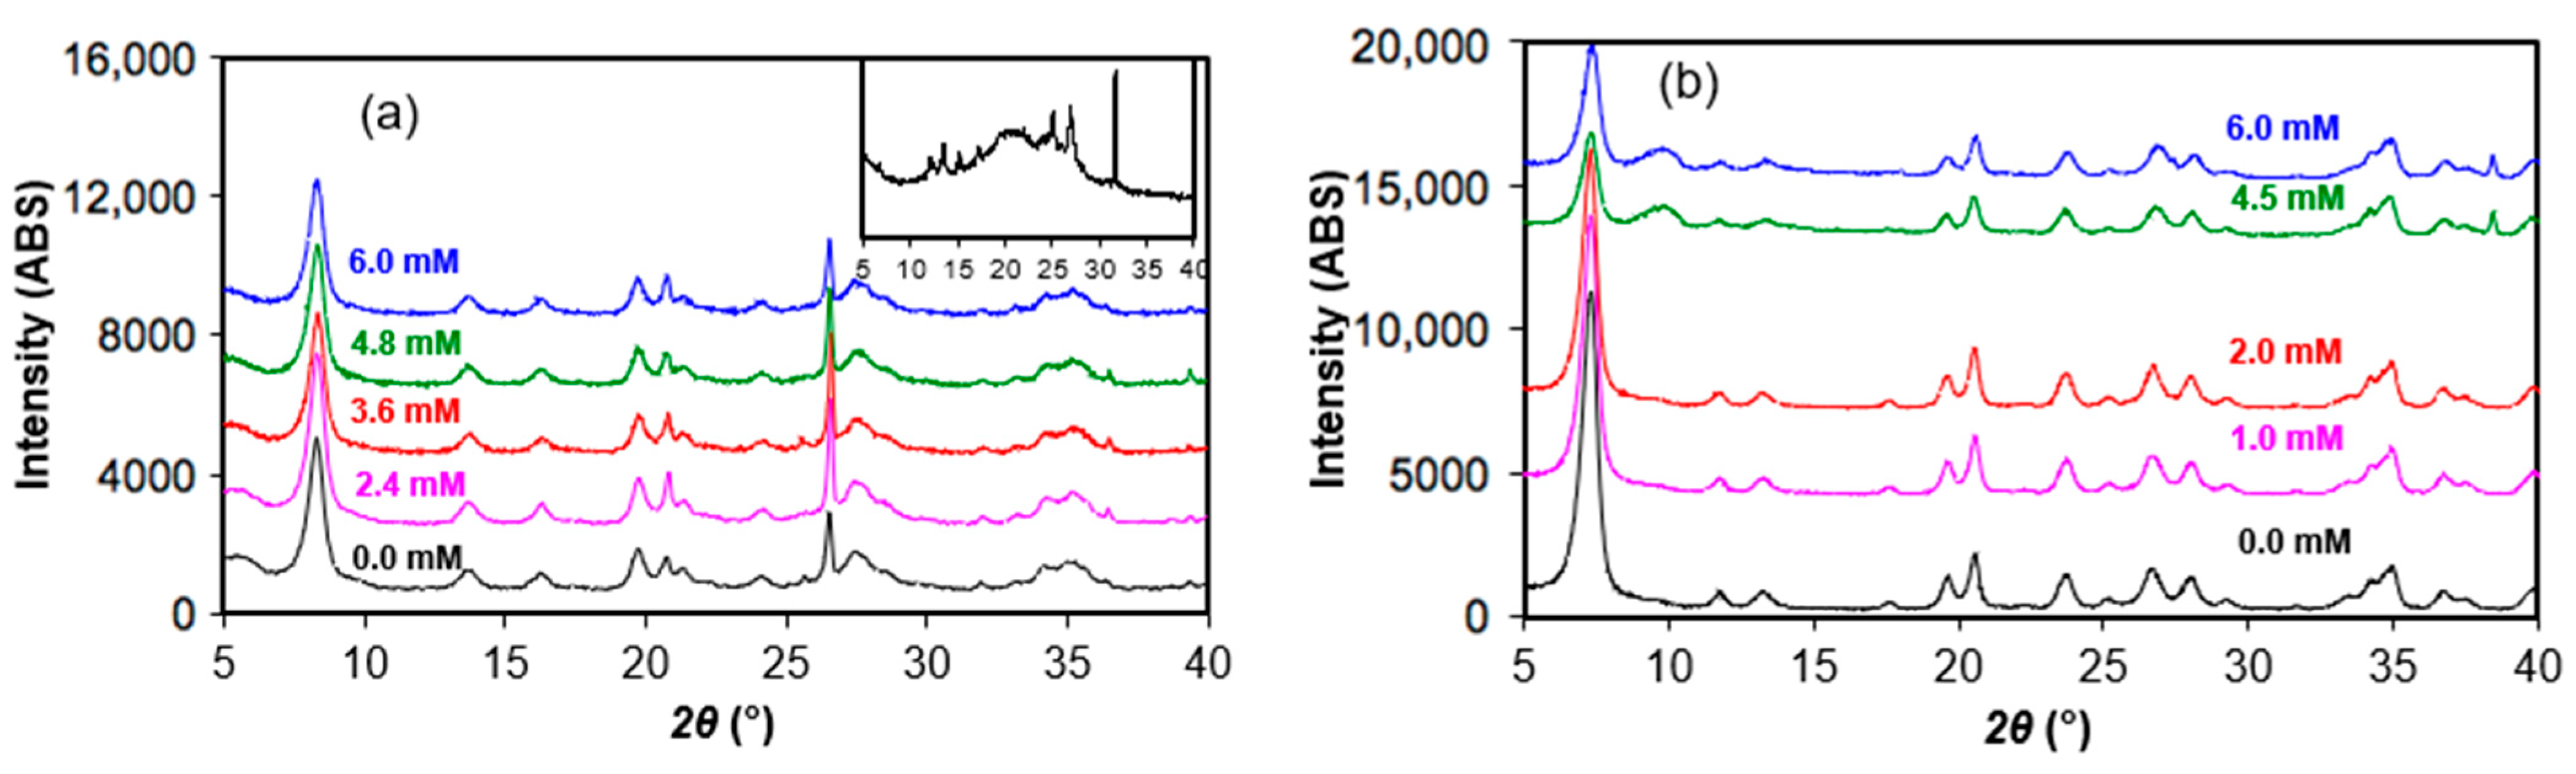
3.4. XRD Analyses
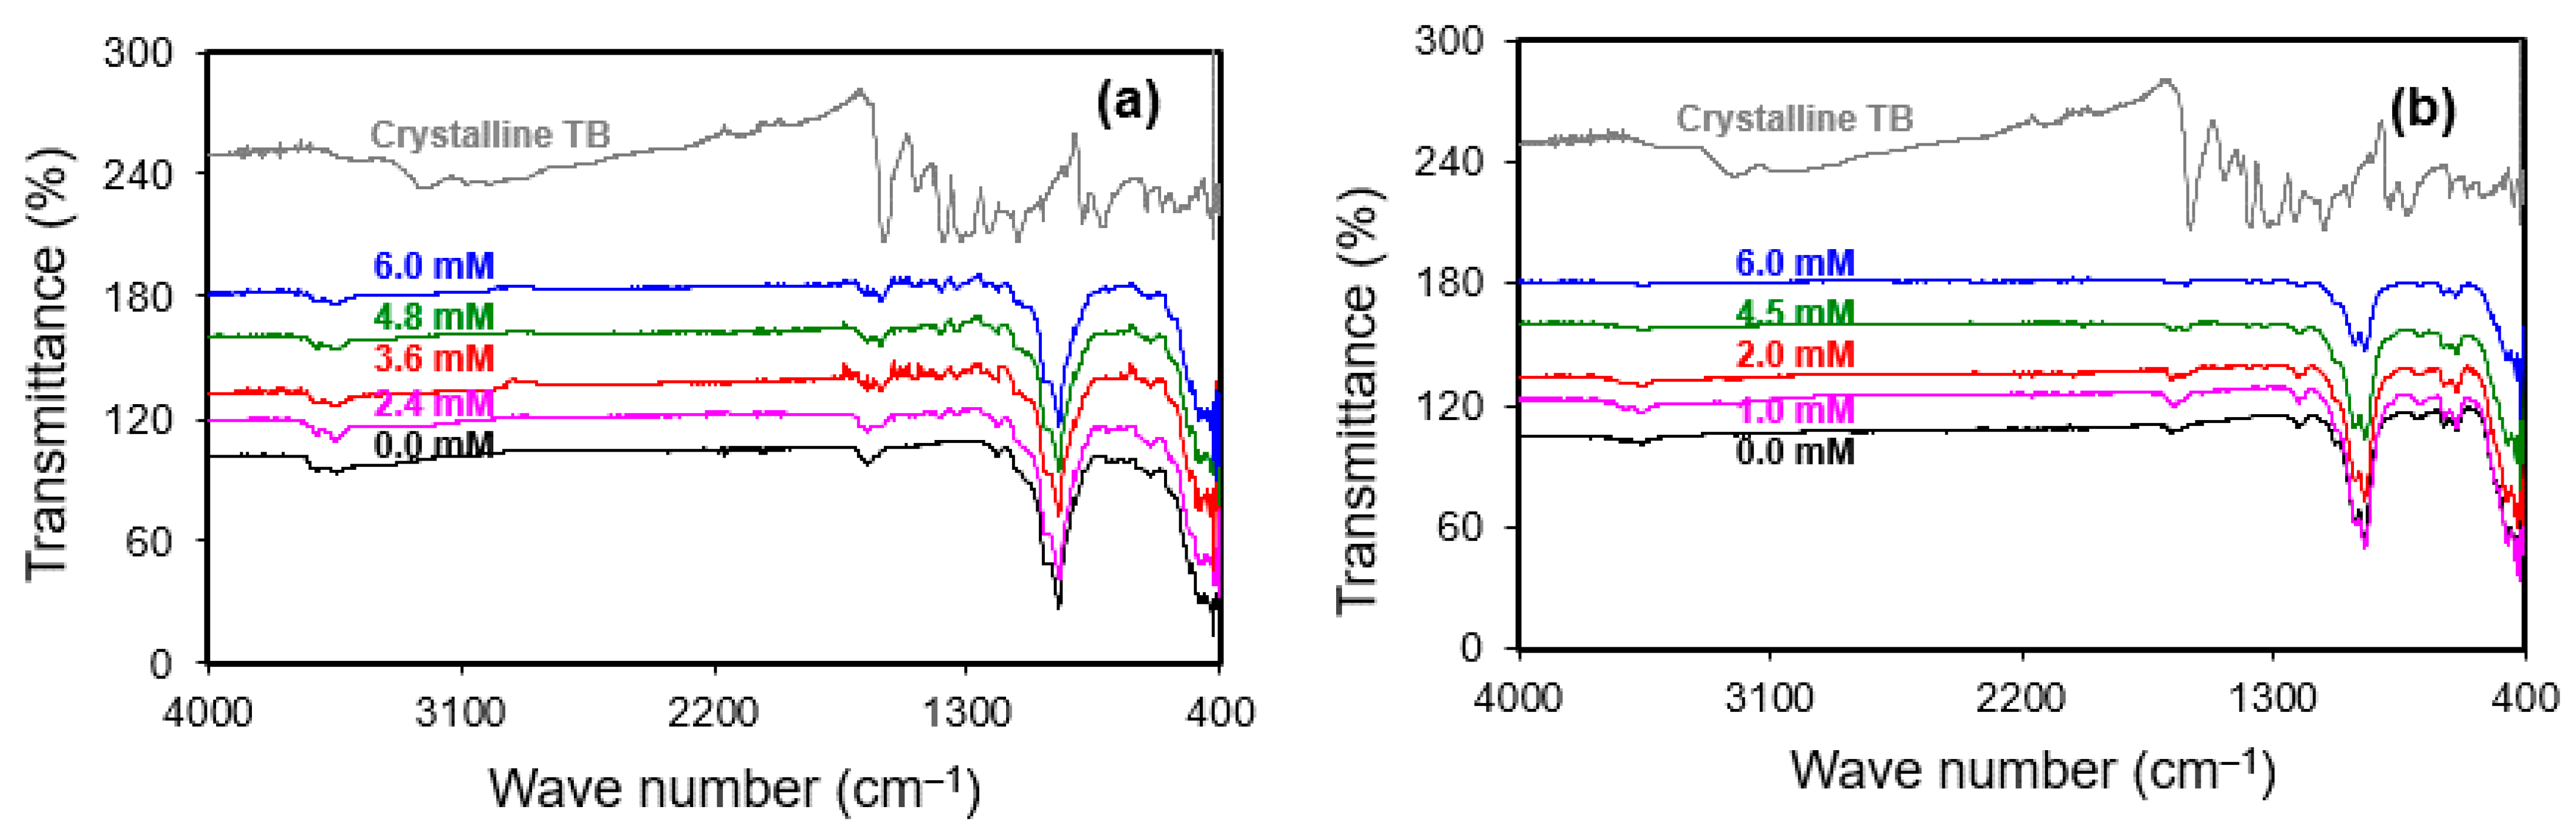
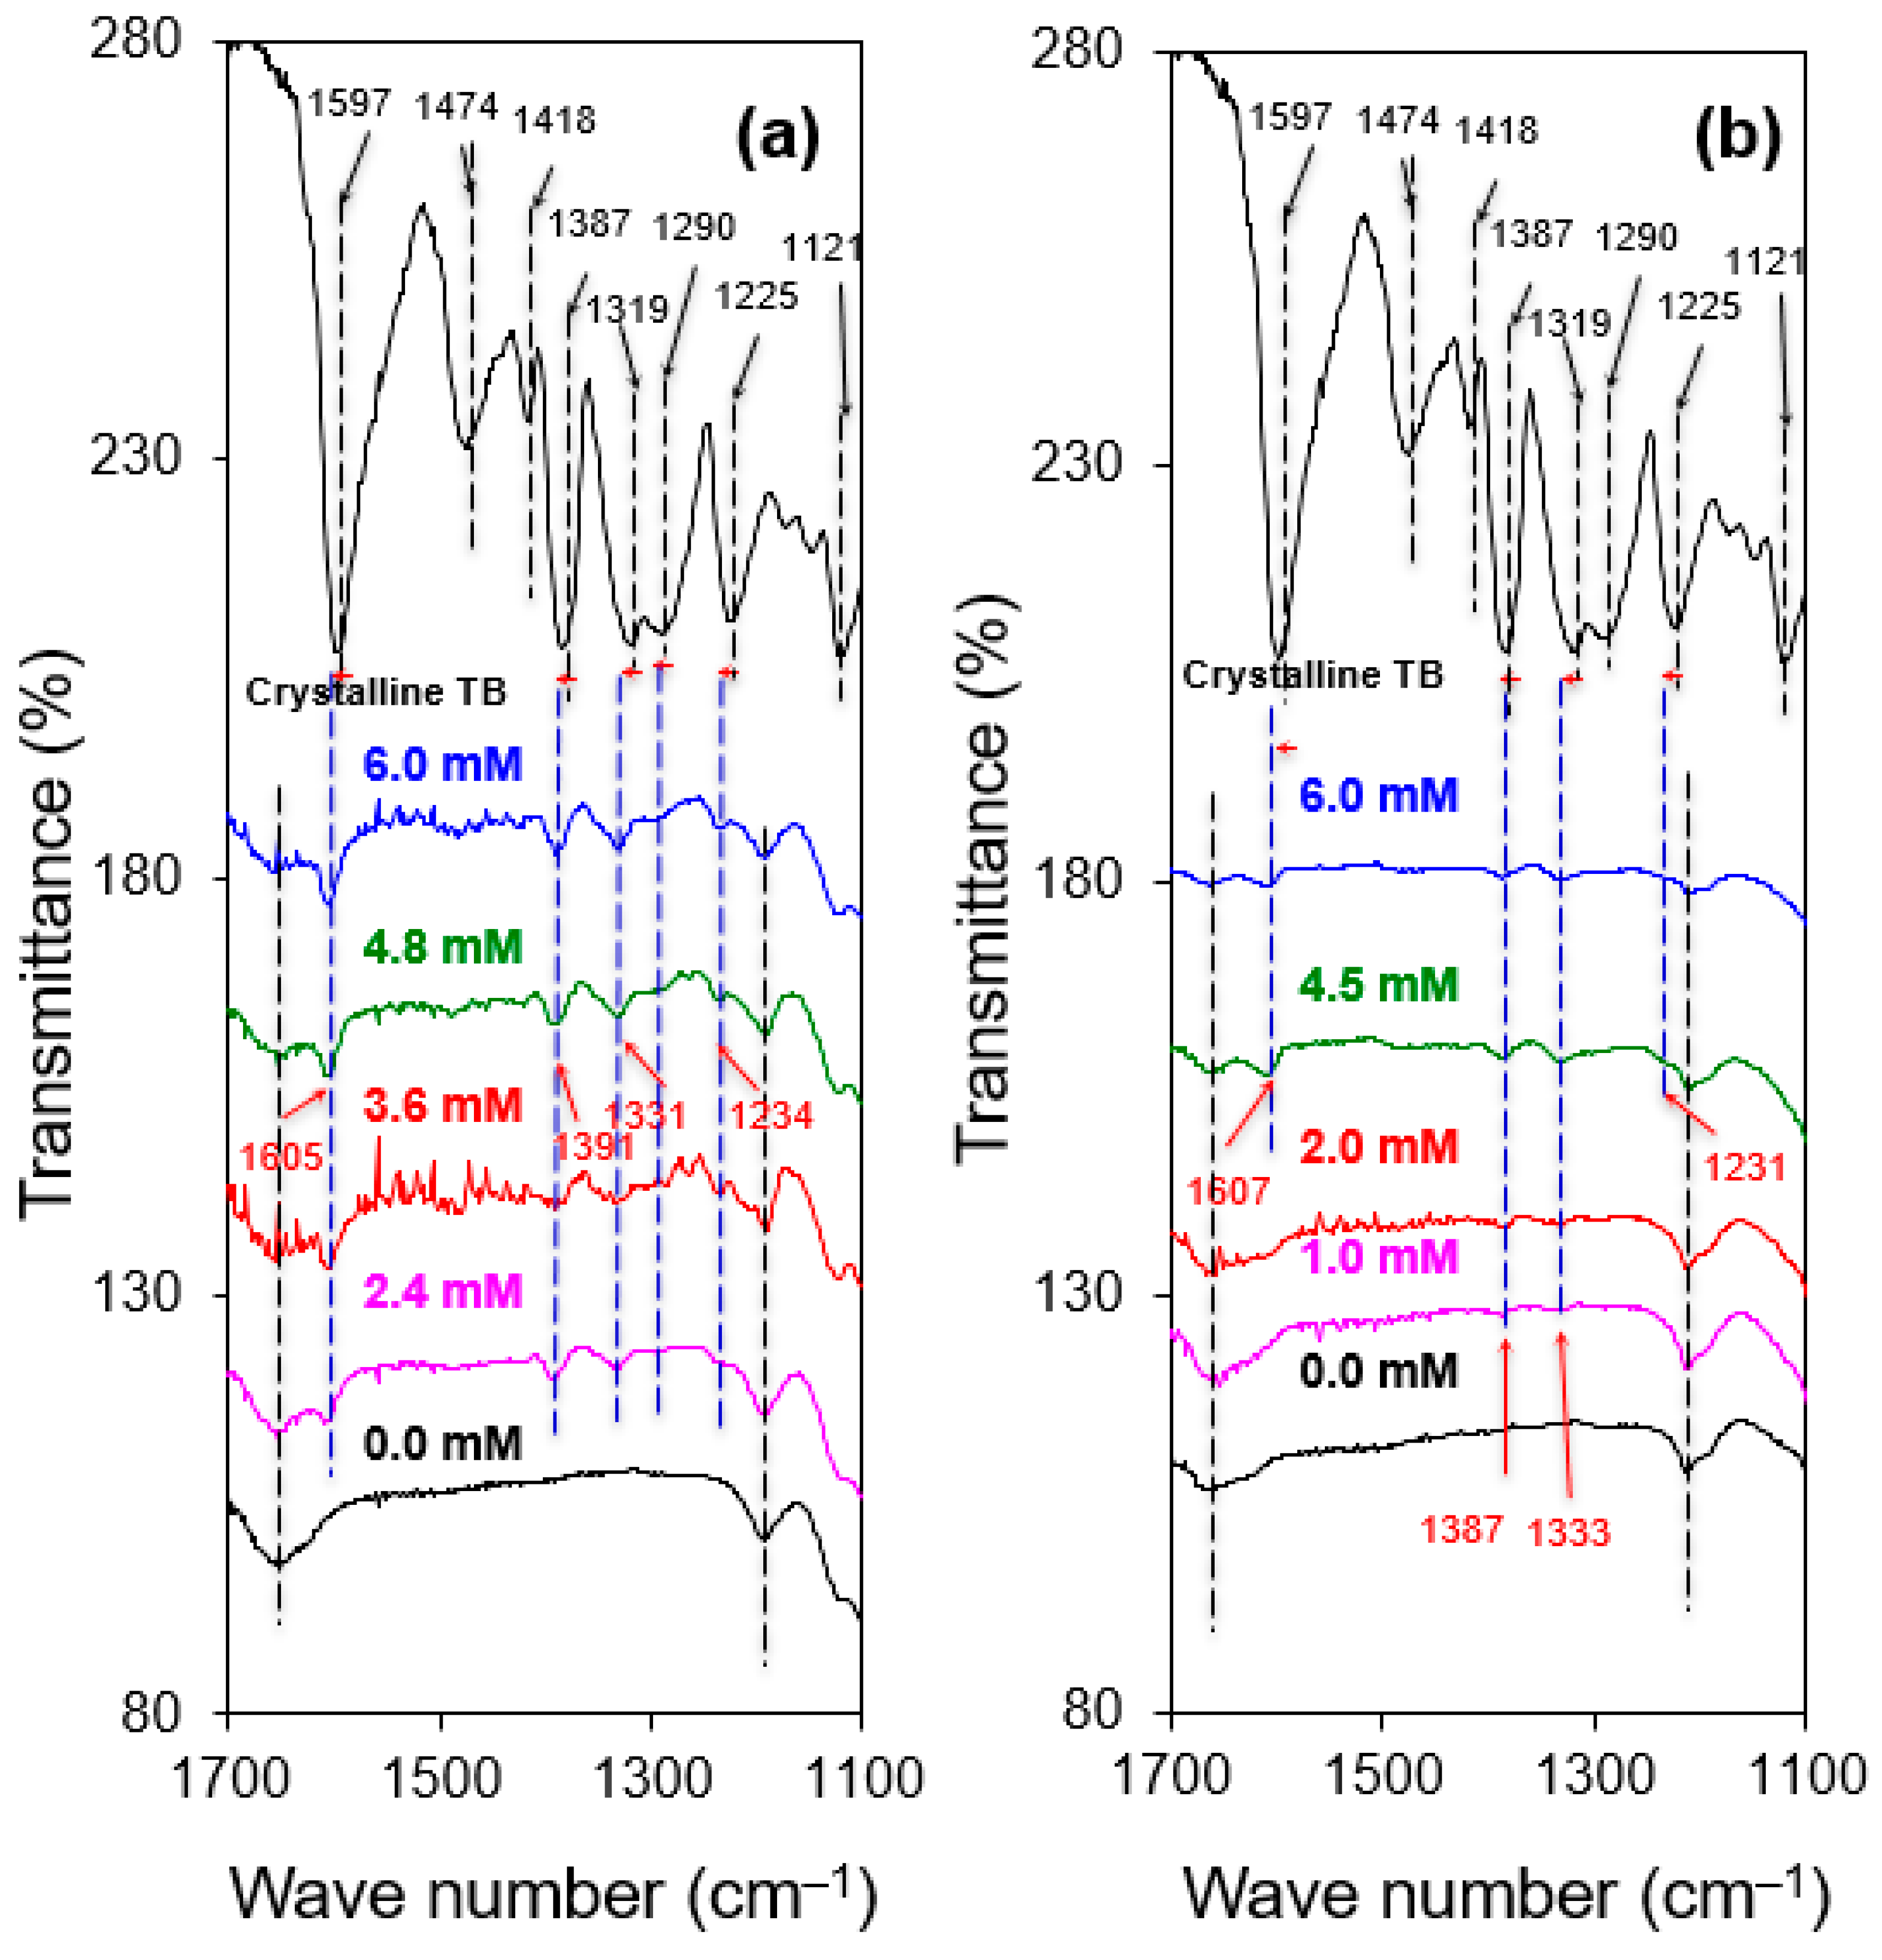
3.5. FTIR Analyses
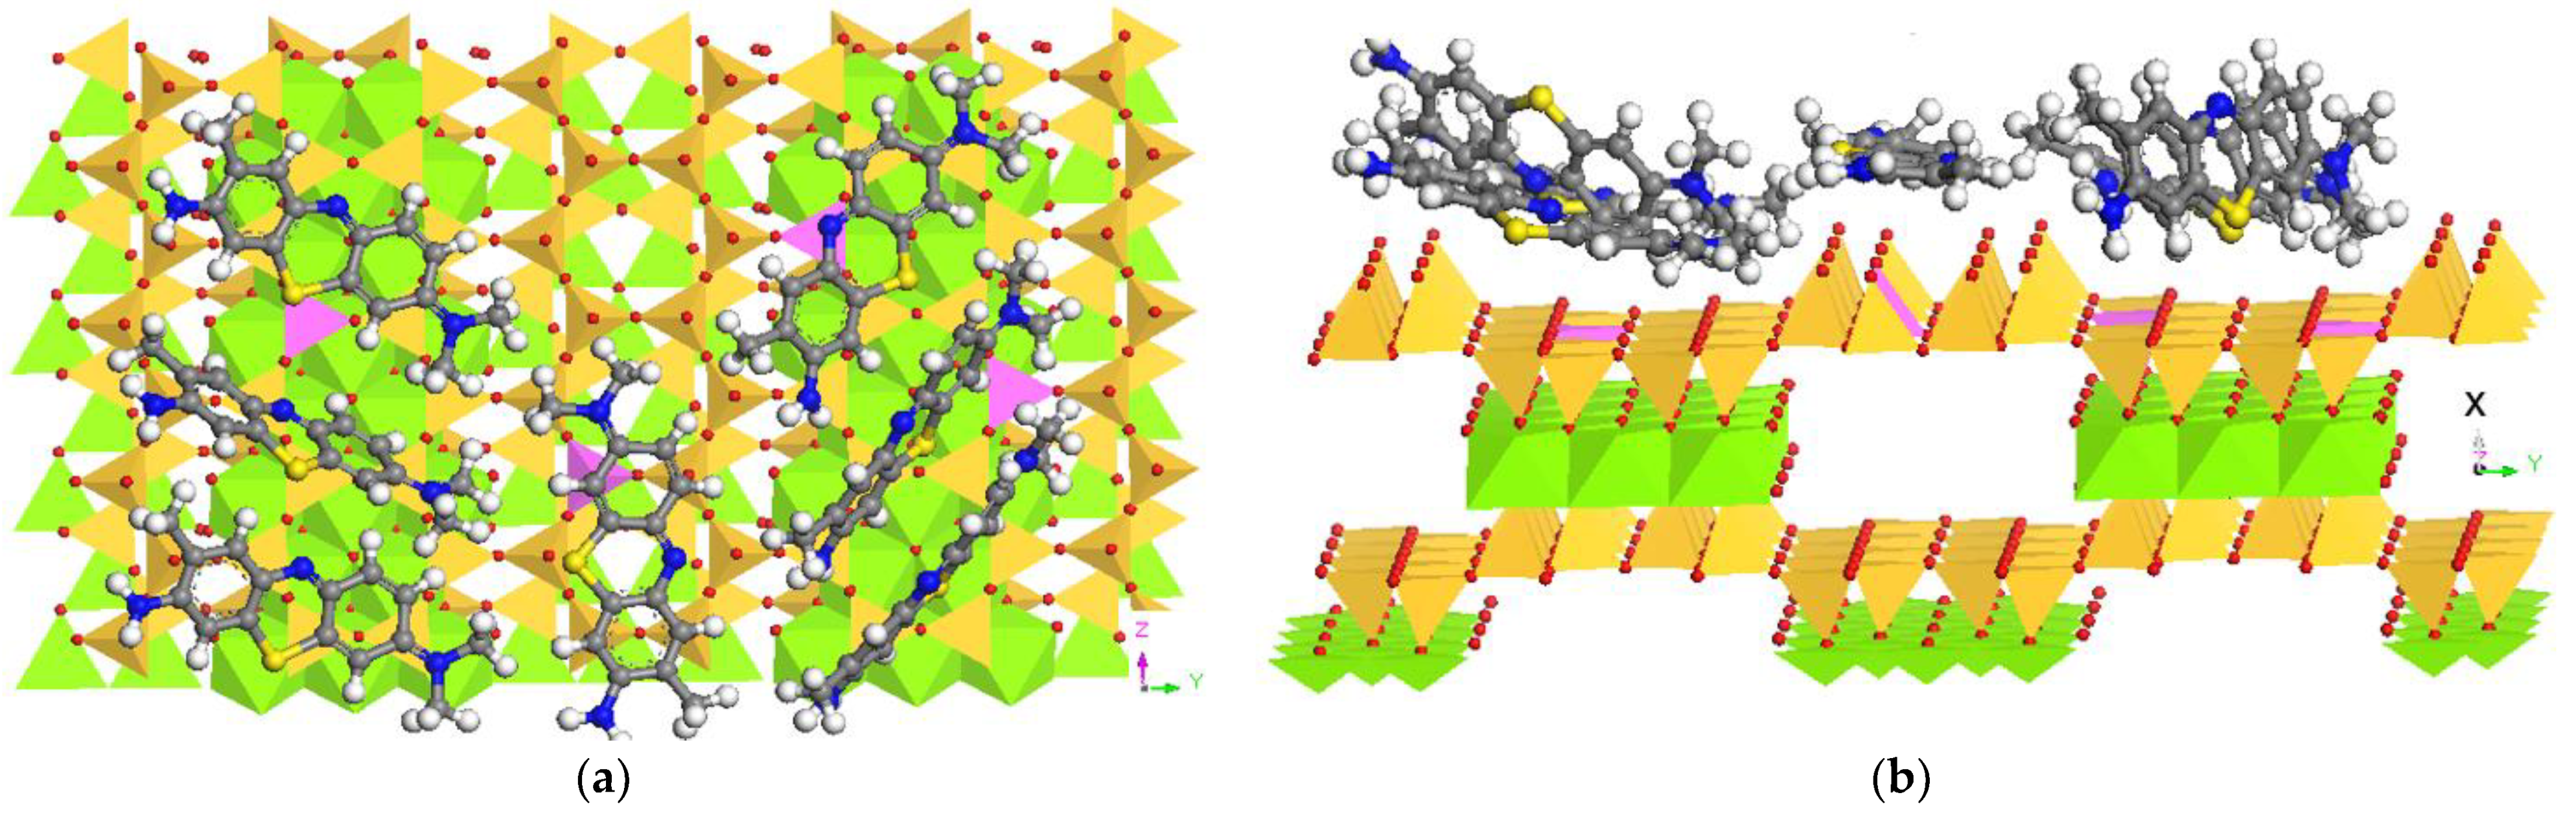
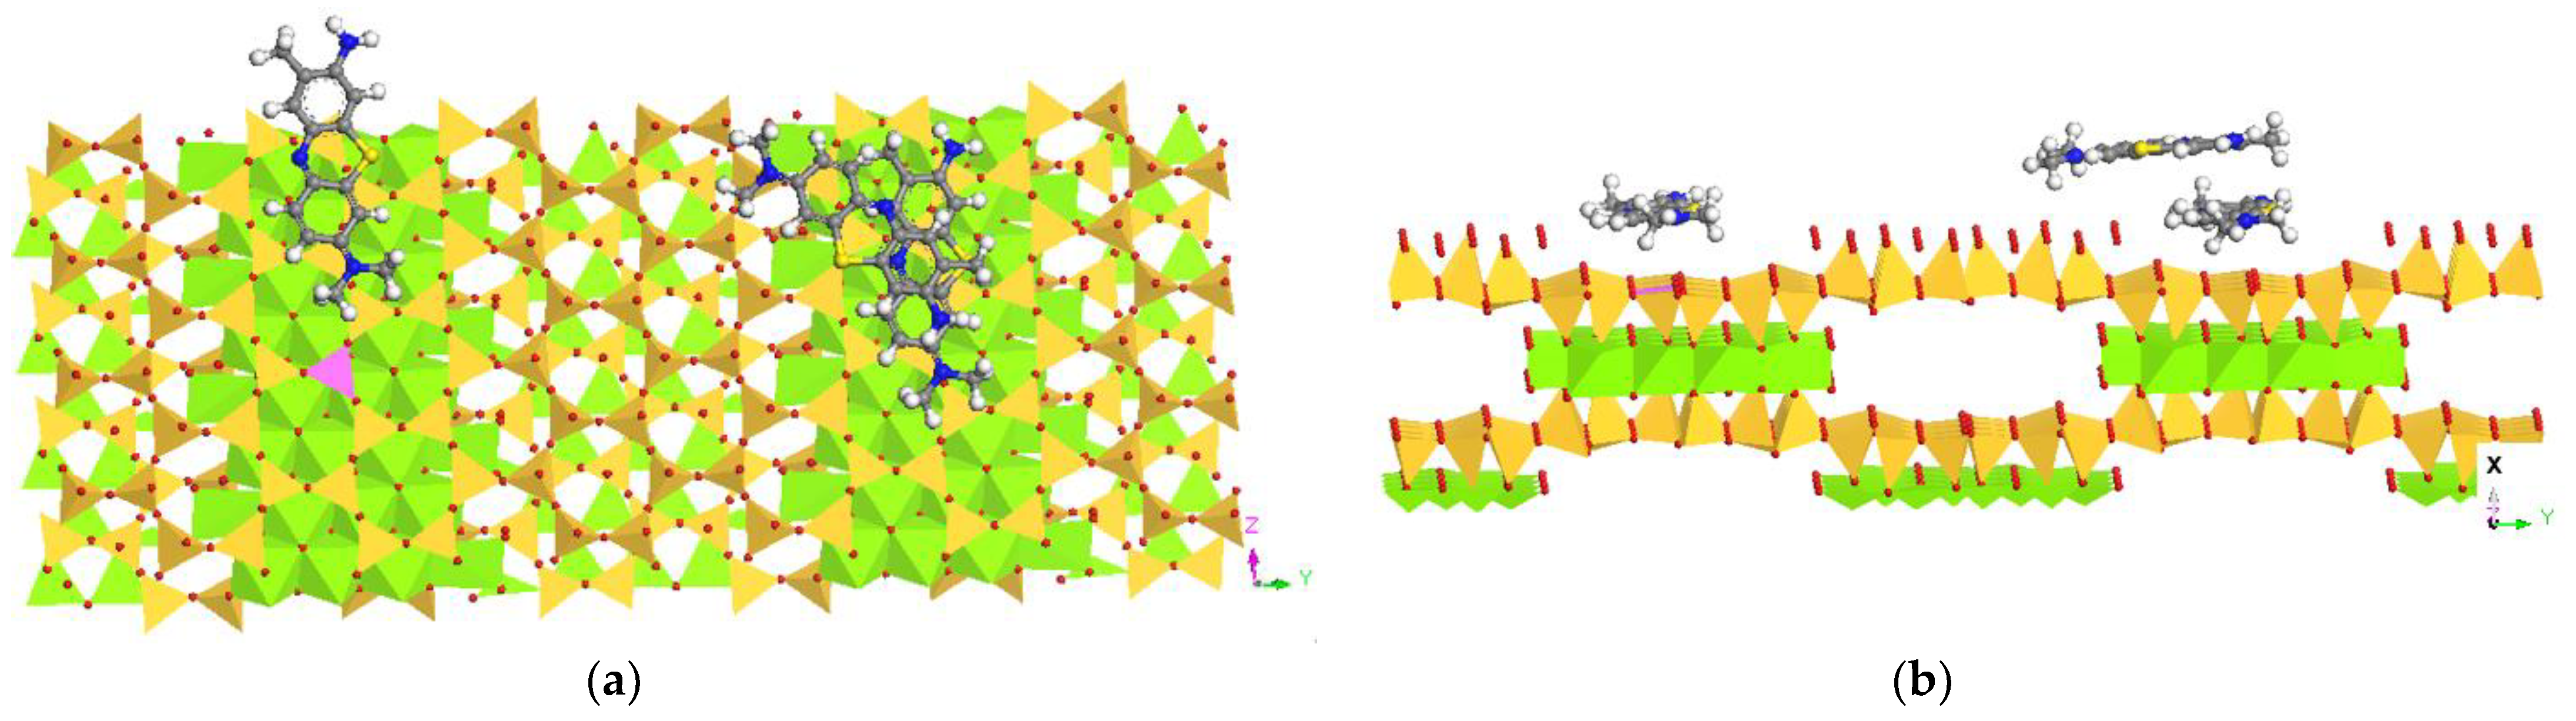
3.6. Molecular Dynamic Simulation
3.7. Discussions
4. Conclusions
Supplementary Materials
Author Contributions
Funding
Institutional Review Board Statement
Informed Consent Statement
Data Availability Statement
Conflicts of Interest
References
- Shanker, U.; Rani, M.; Jassal, V. Degradation of hazardous organic dyes in water by nanomaterials. Environ. Chem. Lett. 2017, 15, 623–642. [Google Scholar] [CrossRef]
- Cao, X.L.; Yan, Y.N.; Zhou, F.Y.; Sun, S.P. Tailoring nanofiltration membranes for effective removing dye intermediates in complex dye-wastewater. J. Membr. Sci. 2020, 595, 117476. [Google Scholar] [CrossRef]
- Singh, S.N. (Ed.) Microbial Degradation of Synthetic Dyes in Wastewaters; Springer: Berlin, Germany, 2014. [Google Scholar]
- Al-Futaisi, A.; Jamrah, A.; Al-Hanai, R. Aspects of cationic dye molecule adsorption to palygorskite. Desalination 2007, 214, 327–342. [Google Scholar] [CrossRef]
- Chen, H.; Zhao, J.; Zhong, A.; Jin, Y. Removal capacity and adsorption mechanism of heat-treated palygorskite clay for methylene blue. Chem. Eng. J. 2011, 174, 143–150. [Google Scholar] [CrossRef]
- Taha, D.N.; Samaka, I.A.S.; Mohammed, L.A. Adsorptive removal of dye from industrial effluents using natural Iraqi palygorskite clay as low-cost adsorbent. J. Asian Sci. Res. 2013, 3, 945–955. [Google Scholar]
- Zhang, Z.; Wang, W.; Wang, A. Highly effective removal of methylene blue using functionalized attapulgite via hydrothermal process. J. Environ. Sci. 2015, 33, 106–115. [Google Scholar] [CrossRef]
- Zhang, Y.; Wang, W.; Zhang, J.; Liu, P.; Wang, A. A comparative study about adsorption of natural palygorskite for methylene blue. Chem. Eng. J. 2015, 262, 390–398. [Google Scholar] [CrossRef]
- Sieren, B.; Baker, J.; Wang, X.; Rozzoni, S.J.; Carlson, K.; McBain, A.; Kerstan, D.; Allen, L.; Liao, L.; Li, Z. Sorptive Removal of Color Dye Safranin O by Fibrous Clay Minerals and Zeolites. Adv. Mater. Sci. Eng. 2020, 2, 1–12. [Google Scholar] [CrossRef]
- Borden, D.; Giese, R.F. Baseline studies of the clay minerals society source clays: Cation exchange capacity measurements by the ammonia-electrode method. Clays Clay Miner. 2001, 49, 444–445. [Google Scholar] [CrossRef]
- Rodriguez, A.; Ovejero, G.; Mestanza, M.; Garcia, J. Removal of dyes from wastewaters by adsorption on sepiolite and pansil. Ind. Eng. Chem. Res. 2010, 49, 3207–3216. [Google Scholar] [CrossRef]
- Fayazi, M.; Afzali, D.; Taher, M.A.; Mostafavi, A.; Gupta, V.K. Removal of Safranin dye from aqueous solution using magnetic mesoporous clay: Optimization study. J. Mol. Liq. 2015, 212, 675–685. [Google Scholar] [CrossRef]
- Li, Z.; Willms, C.A.; Kniola, K. Removal of anionic contaminants using surfactant-modified palygorskite and sepiolite. Clays Clay Miner. 2003, 51, 445–451. [Google Scholar] [CrossRef]
- Sridharan, G.; Shankar, A.A. Toluidine blue: A review of its chemistry and clinical utility. J. Oral Maxillofac. Pathol. 2012, 16, 251–255. [Google Scholar] [CrossRef] [Green Version]
- Alpat, S.K.; Özbayrak, Ö.; Alpat, Ş.; Akçay, H. The adsorption kinetics and removal of cationic dye, Toluidine Blue O, from aqueous solution with Turkish zeolite. J. Hazard. Mater. 2008, 151, 213–220. [Google Scholar] [CrossRef]
- Hisarli, G. The effects of acid and alkali modification on the adsorption performance of fuller’s earth for basic dye. J. Colloid. Inter. Sci. 2005, 281, 18–26. [Google Scholar] [CrossRef] [PubMed]
- Rauf, M.A.; Qadri, S.M.; Ashraf, S.; Al-Mansoori, K.M. Adsorption studies of Toluidine Blue from aqueous solutions onto gypsum. Chem. Eng. J. 2009, 150, 90–95. [Google Scholar] [CrossRef]
- Fosso-Kankeu, E.; Potgieter, J.; Waanders, F.B. Removal of malachite green and toluidine blue dyes from aqueous solution using a clay-biochar composite of bentonite and sweet sorghum bagasse. Int. J. Appl. Eng. Res. 2019, 14, 1324–1333. [Google Scholar]
- Haouti, R.E.; Ouachtak, H.; Guerdaoui, A.E.; Amedlous, A.; Amaterz, E.; Haounati, R.; Addi, A.A.; Akbal, F.; Alem, N.E.; Taha, M.L. Cationic dyes adsorption by Na-Montmorillonite Nano Clay: Experimental study combined with a theoretical investigation using DFT-based descriptors and molecular dynamics simulations. J. Mol. Liq. 2019, 290, 111139. [Google Scholar] [CrossRef]
- Xu, W.; Chen, Y.; Zhang, W.; Li, B. Fabrication of graphene oxide/bentonite composites with excellent adsorption performances for toluidine blue removal from aqueous solution. Adv. Powder Technol. 2019, 30, 493–501. [Google Scholar] [CrossRef]
- Salim, H.A.M.; Salih, S.A.M. Photodegradation study of Toluidine Blue dye in aqueous solution using magnesium oxide as a photocatalyst. Int. J. Chem. 2015, 7, 143. [Google Scholar] [CrossRef] [Green Version]
- Dogan, A.U.; Dogan, M.; Onal, M.; Sarikaya, Y.; Aburub, A.; Wurster, D.E. Baseline studies of the clay minerals society source clays: Specific surface area by the Brunauer Emmett Teller (BET) method. Clays Clay Miner. 2006, 54, 62–66. [Google Scholar] [CrossRef]
- Yang, R.; Li, D.; Li, A.; Yang, H. Adsorption properties and mechanisms of palygorskite for removal of various ionic dyes from water. Appl. Clay Sci. 2018, 151, 20–28. [Google Scholar] [CrossRef]
- Peinemann, N.; Helmy, A.K. Cation exchange capacities of safranin, toluidine and alizarin complexes with montmorillonite. Soil Sci. 1999, 164, 650–654. [Google Scholar] [CrossRef]
- Liu, M.; Shi, G.; Zhang, L.; Zhao, G.; Jin, L. Electrode modified with toluidine blue-doped silica nanoparticles, and its use for enhanced amperometric sensing of hemoglobin. Anal. Bioanal. Chem. 2008, 391, 1951–1959. [Google Scholar] [CrossRef]
- Ovchinnikov, O.V.; Chernykh, S.V.; Smirnov, M.S.; Alpatova, D.V.; Vorob’Eva, R.P.; Latyshev, A.N.; Evlev, A.B.; Utekhin, A.N.; Lukin, A.N. Analysis of interaction between the organic dye methylene blue and the surface of AgCl (I) microcrystals. J. Appl. Spectrosc. 2017, 74, 809–816. [Google Scholar] [CrossRef]
- Van Damme, H.; Crespan, M.; Cruz, M.I.; Fripiat, J.J. Adsorption of safranine by Na+, Ni2+ and Fe3+ montmorillonites. Clays Clay Miner. 1977, 25, 19–25. [Google Scholar] [CrossRef]
- Baasov, T.; Friedman, N.; Sheves, M. Factors affecting the C=N stretching in protonated retinal Schiff base: A model study for bacteriorhodopsin and visual pigments. Biochemistry 1987, 26, 3210–3217. [Google Scholar] [CrossRef]
- Nasher, M.A.; Youssif, M.I.; El-Ghamaz, N.A.; Zeyada, H.M. Linear and nonlinear optical properties of irradiated Toluidine Blue thin films. Optik 2019, 178, 532–543. [Google Scholar] [CrossRef]
- Shariatmadari, H.; Mermut, A.R.; Benke, M.B. Sorption of selected cationic and neutral organic molecules on palygorskite and sepiolite. Clays Clay Miner. 1999, 47, 44–53. [Google Scholar] [CrossRef]
- Rytwo, G.; Nir, S.; Margulies, L.; Casal, B.; Merino, J.; Ruiz-Hitzky, E.; Serratosa, J.M. Adsorption of monovalent organic cations on sepiolite: Experimental results and model calculations. Clays Clay Miner. 1998, 46, 340–348. [Google Scholar] [CrossRef]
- Rytwo, G.; Serban, C.; Nir, S.; Margulies, L. Use of methylene blue and crystal violet for determination of exchangeable cations in montmorillonite. Clays Clay Miner. 1991, 39, 551–555. [Google Scholar] [CrossRef]
- Gilani, A.G.; Dezhampanah, H.; Poormohammadi-Ahandani, Z. A comparative spectroscopic study of thiourea effect on the photophysical and molecular association behavior of various phenothiazine dyes. Spectrochim. Acta Part A Mol. Biomol. Spectrosc. 2017, 179, 132–143. [Google Scholar] [CrossRef] [PubMed]
- Matassa, R.; Sadun, C.; D’Ilario, L.; Martinelli, A.; Caminiti, R. Supramolecular organization of toluidine blue dye in solid amorphous phases. J. Phys. Chem. B 2007, 111, 1994–1999. [Google Scholar] [CrossRef] [PubMed]
- Florence, N.; Naorem, H. Dimerization of methylene blue in aqueous and mixed aqueous organic solvent: A spectroscopic study. J. Mol. Liq. 2014, 198, 255–258. [Google Scholar] [CrossRef]


| Minerals | ∆G(kJ/mol) | ∆H(kJ/mol) | ∆S (kJ/mol-K) | |||
|---|---|---|---|---|---|---|
| 296 K | 306 K | 316 K | 326 K | |||
| SEP | −20.9 | −23.1 | −25.2 | −27.4 | 42.9 | 0.2 |
| PAL | −22.6 | −21.0 | −19.5 | −17.9 | −69.0 | −0.2 |
Publisher’s Note: MDPI stays neutral with regard to jurisdictional claims in published maps and institutional affiliations. |
© 2021 by the authors. Licensee MDPI, Basel, Switzerland. This article is an open access article distributed under the terms and conditions of the Creative Commons Attribution (CC BY) license (https://creativecommons.org/licenses/by/4.0/).
Share and Cite
Wu, Q.; Carlson, K.; Cheng, Q.; Wang, X.; Li, Z. Interactions between Cationic Dye Toluidine Blue and Fibrous Clay Minerals. Crystals 2021, 11, 708. https://doi.org/10.3390/cryst11060708
Wu Q, Carlson K, Cheng Q, Wang X, Li Z. Interactions between Cationic Dye Toluidine Blue and Fibrous Clay Minerals. Crystals. 2021; 11(6):708. https://doi.org/10.3390/cryst11060708
Chicago/Turabian StyleWu, Qingfeng, Kristen Carlson, Qi Cheng, Xisen Wang, and Zhaohui Li. 2021. "Interactions between Cationic Dye Toluidine Blue and Fibrous Clay Minerals" Crystals 11, no. 6: 708. https://doi.org/10.3390/cryst11060708