
Interactions of Ruddlesden-Popper Phases and Migration-Induced Field-Stabilized Polar Phase in Strontium Titanate

 , , ,
, , ,
Abstract
:1. Introduction
1.1. Defects in Strontium Titanate
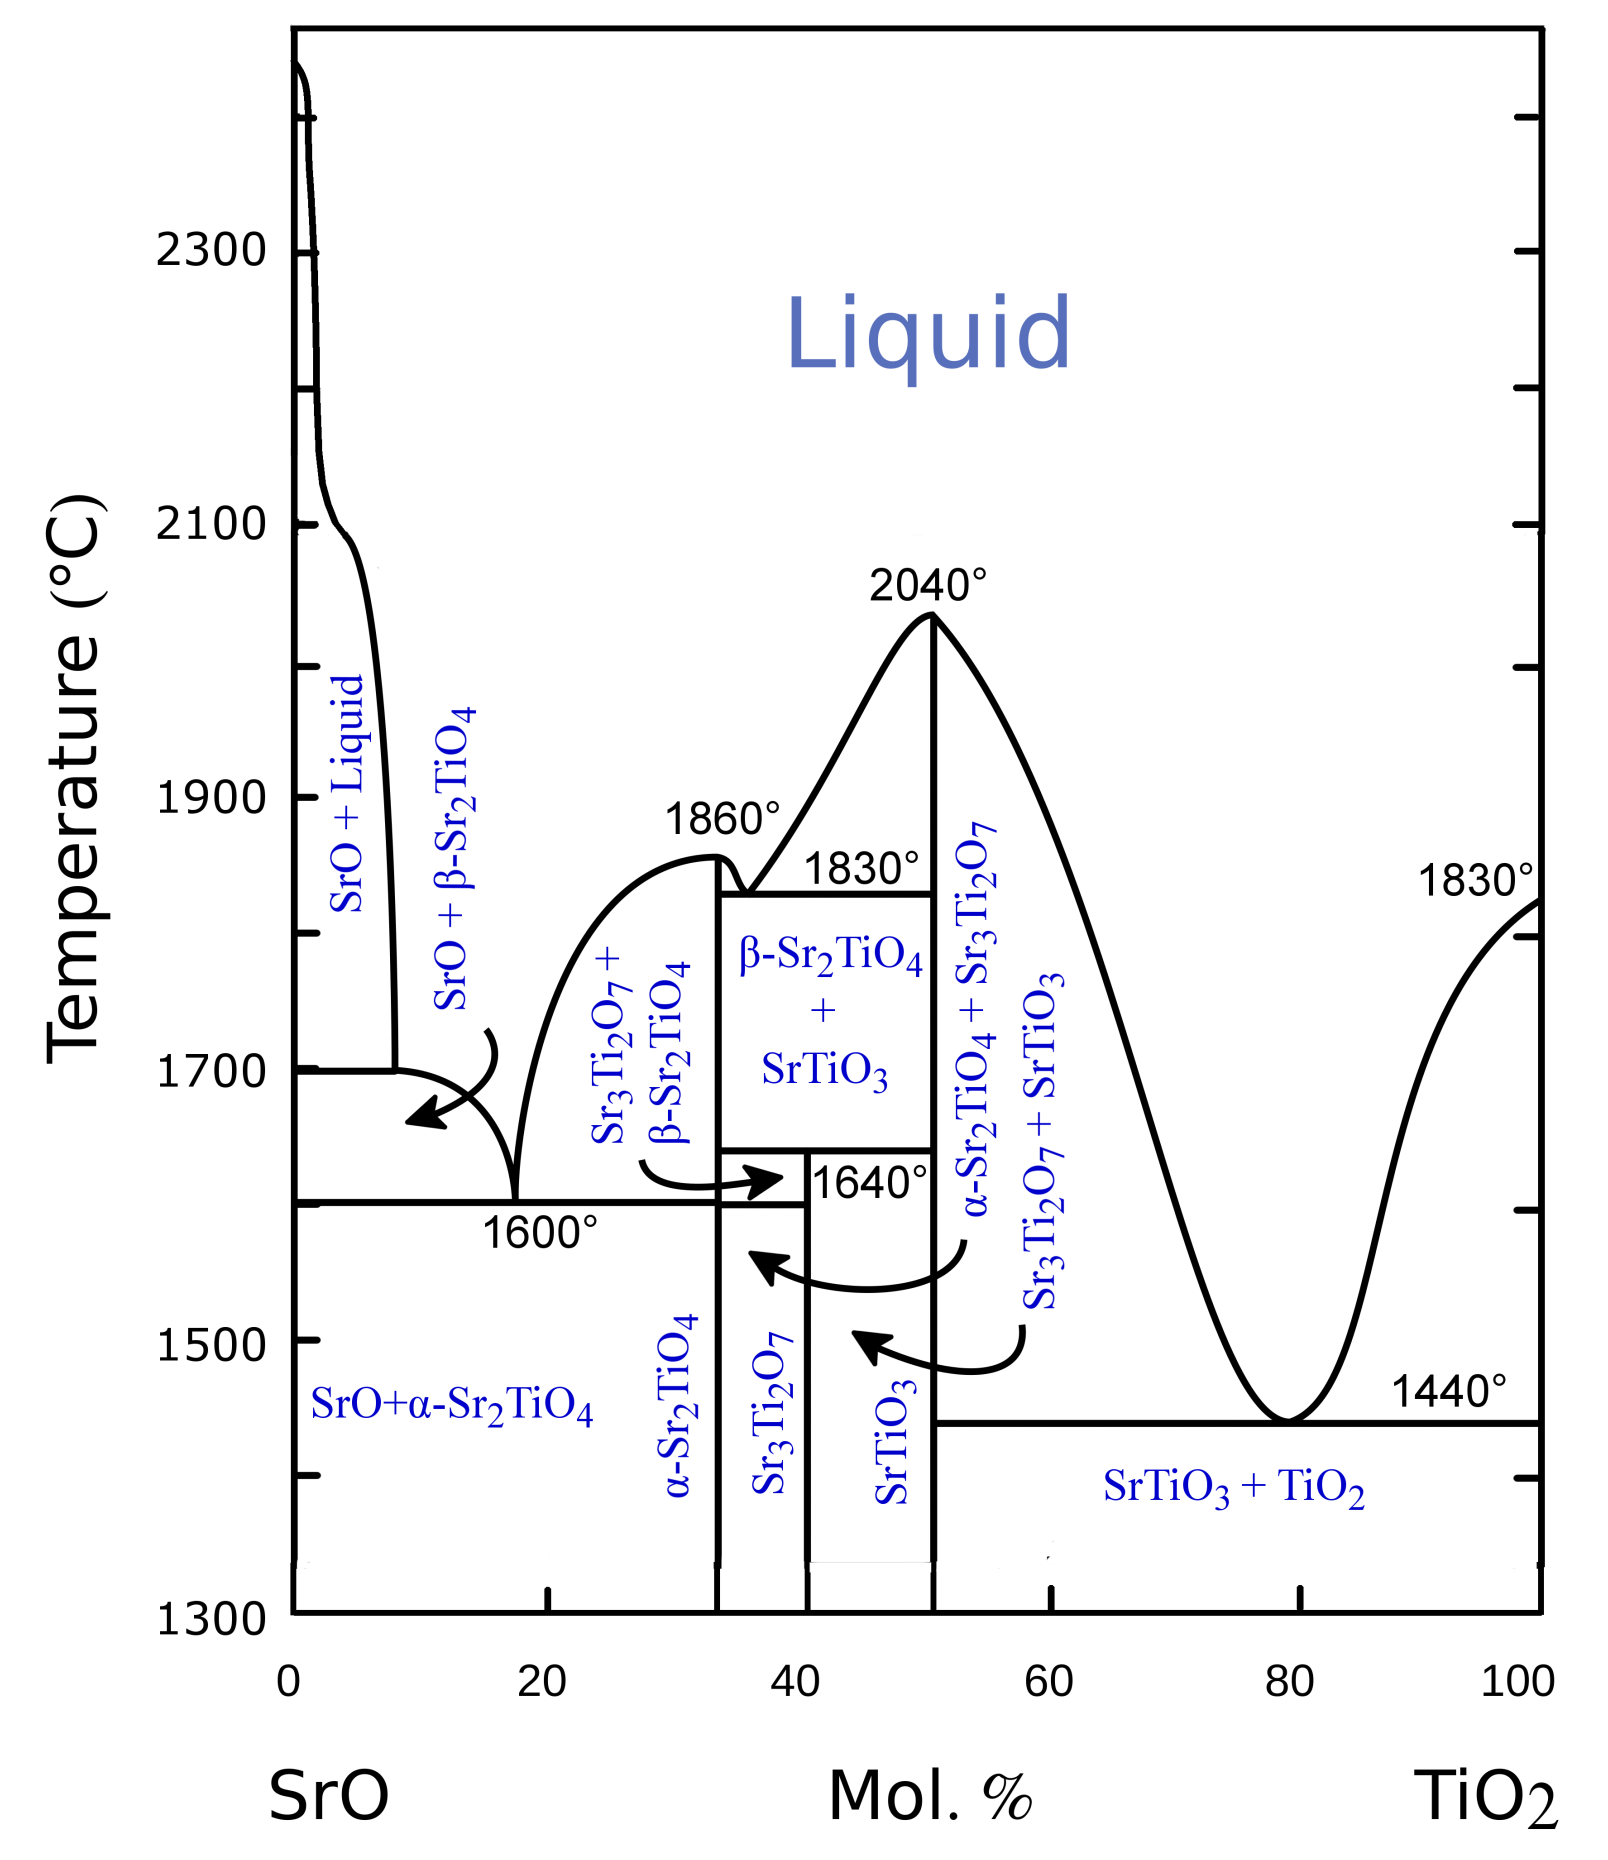
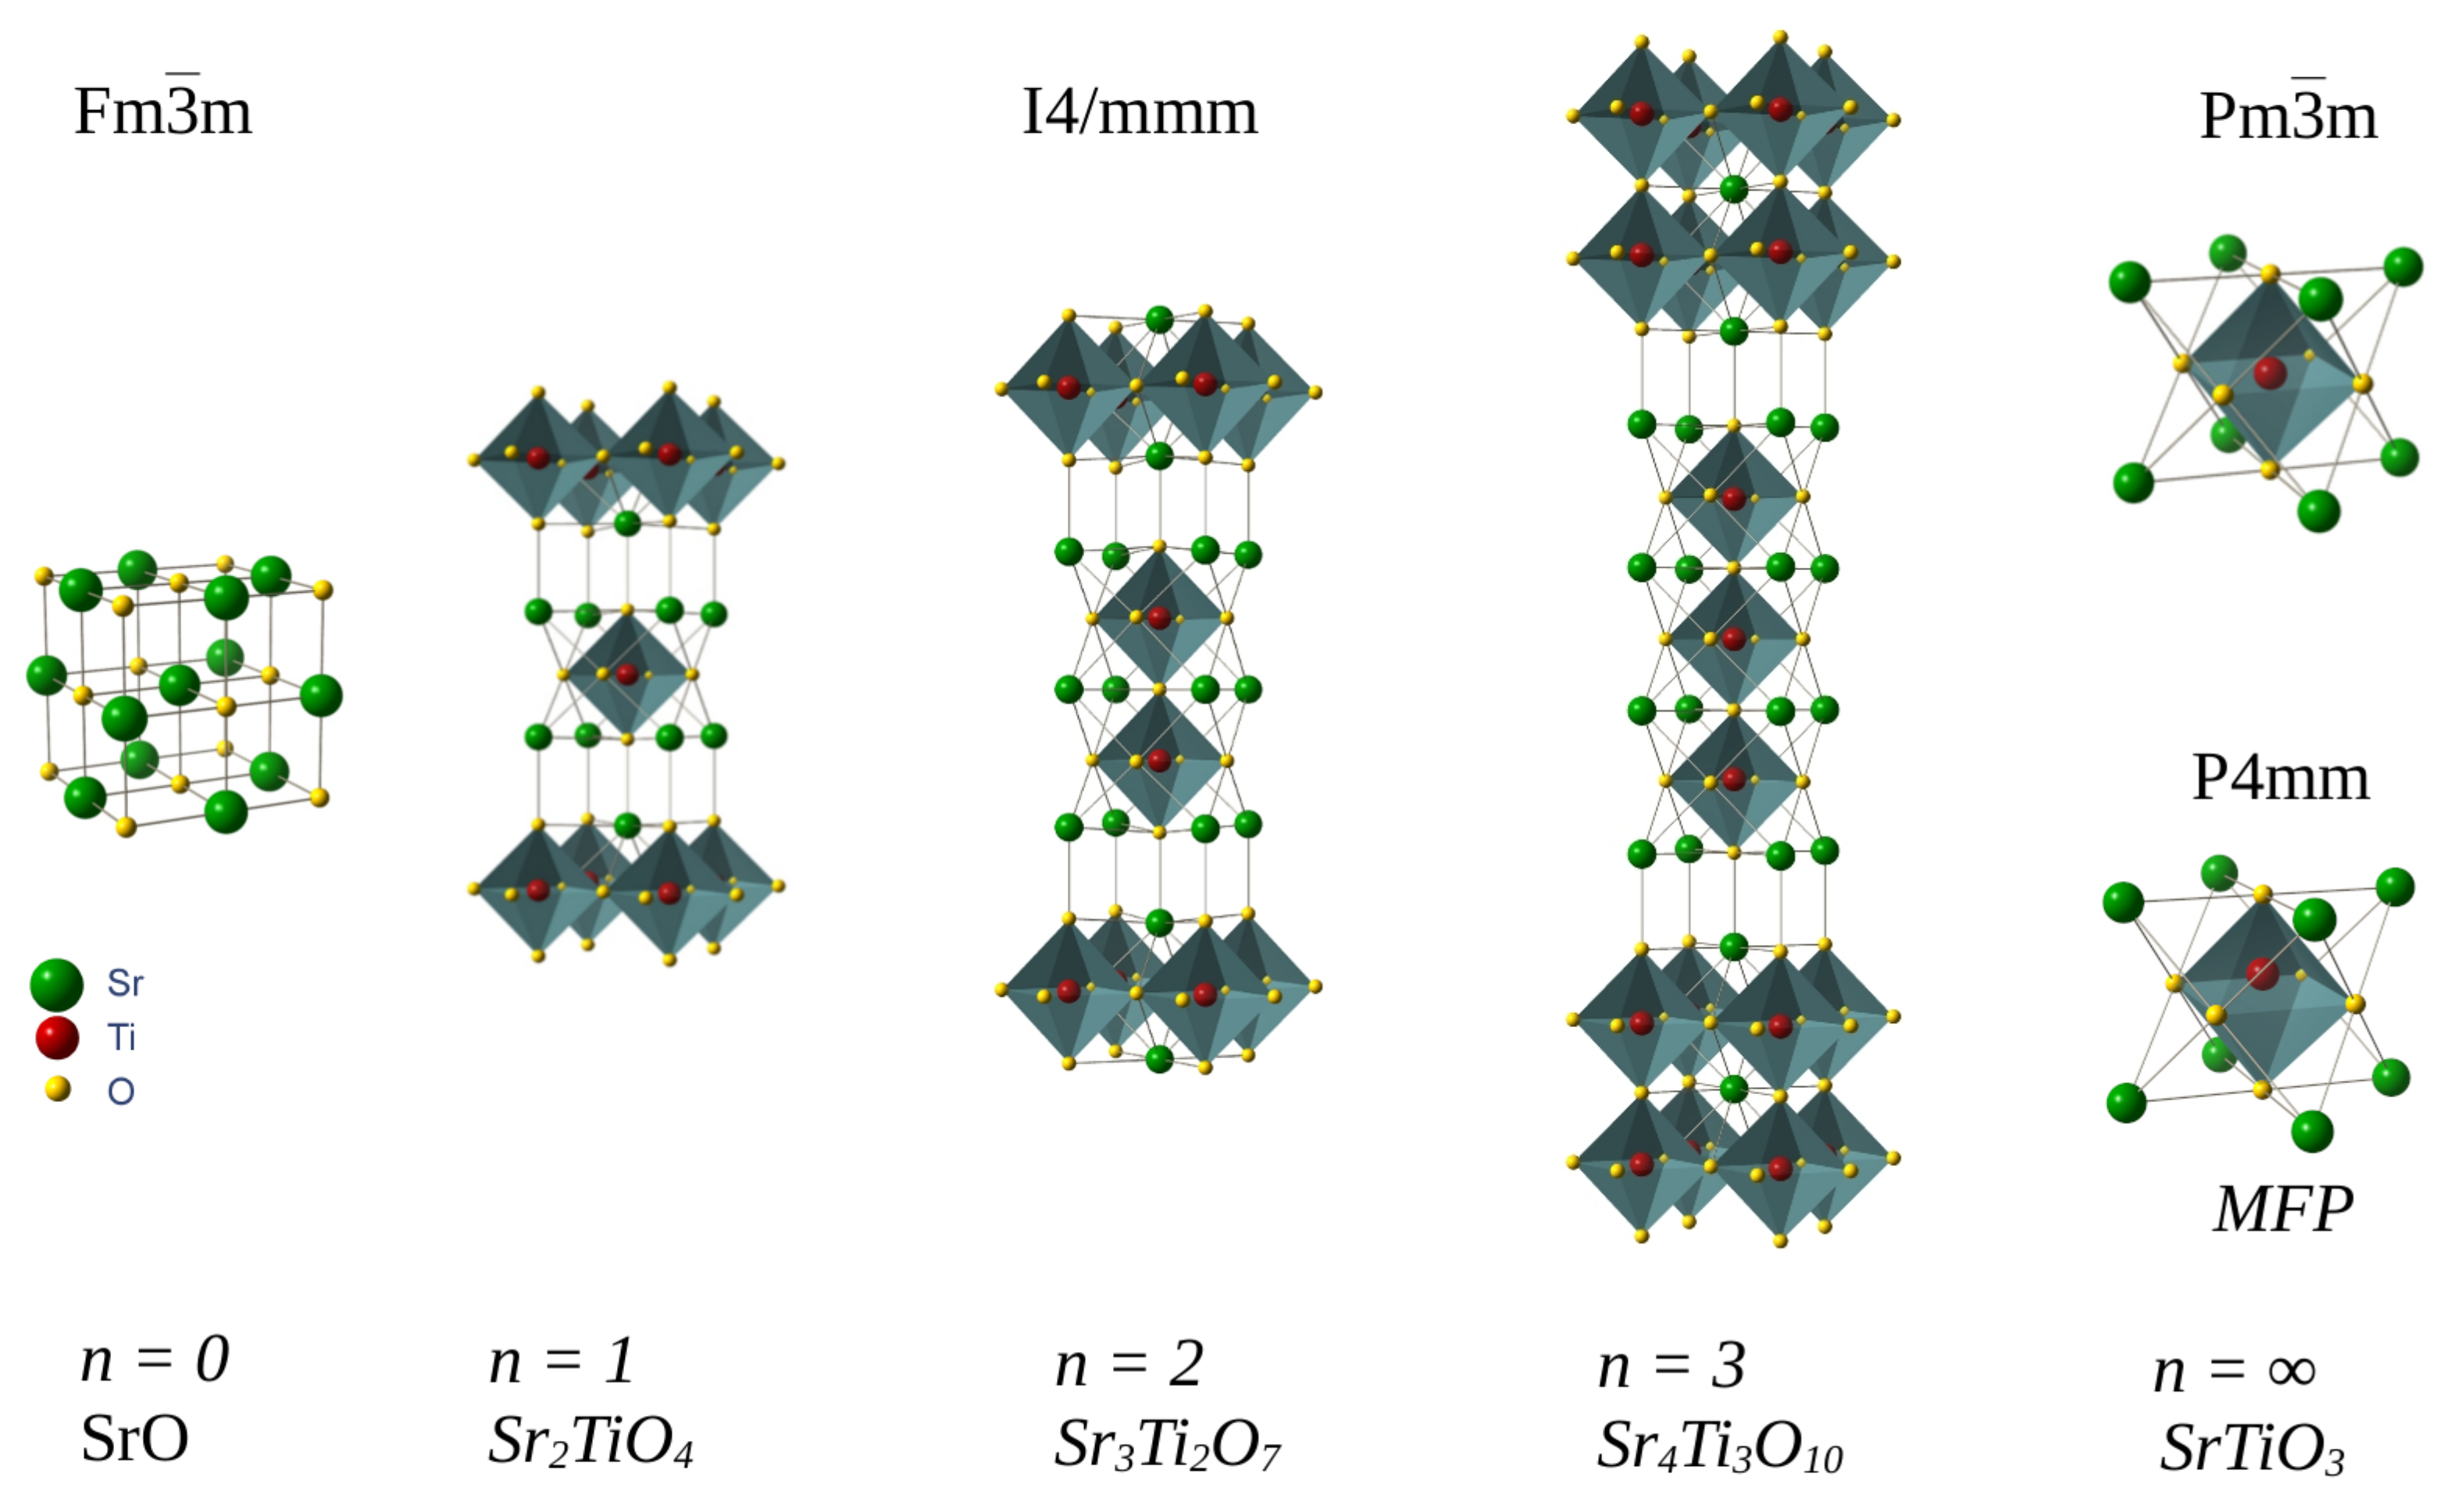
1.2. Ruddlesden-Popper Phases
1.3. Migration-Induced Field-Stabilized Polar Phase
2. Motivation and Aims
3. Method
4. Results
4.1. The Macroscopic Point of View
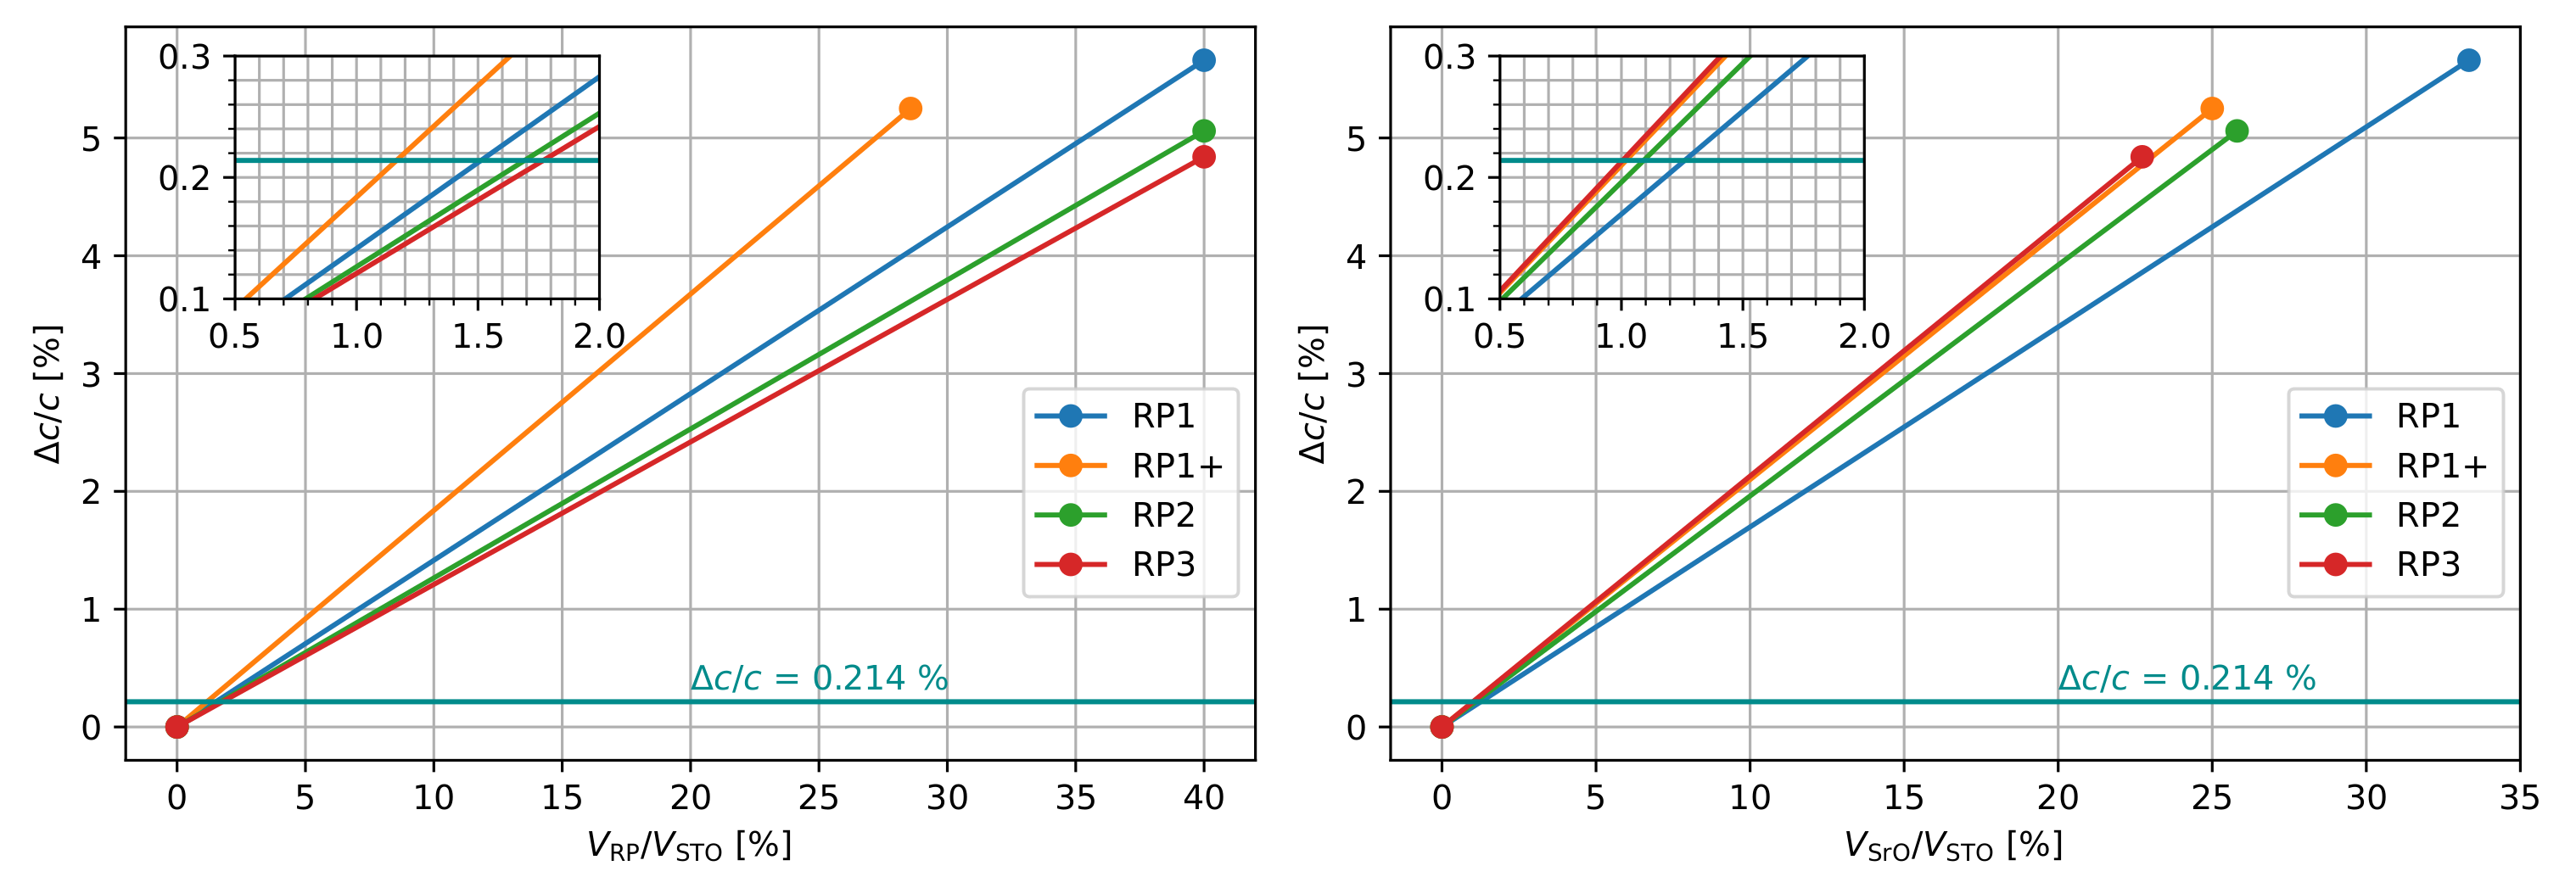
The c-Parameter
4.2. Distortions of TiO6 Octahedra
4.3. The Microscopic Point of View
4.3.1. Sr-Sr-Distances
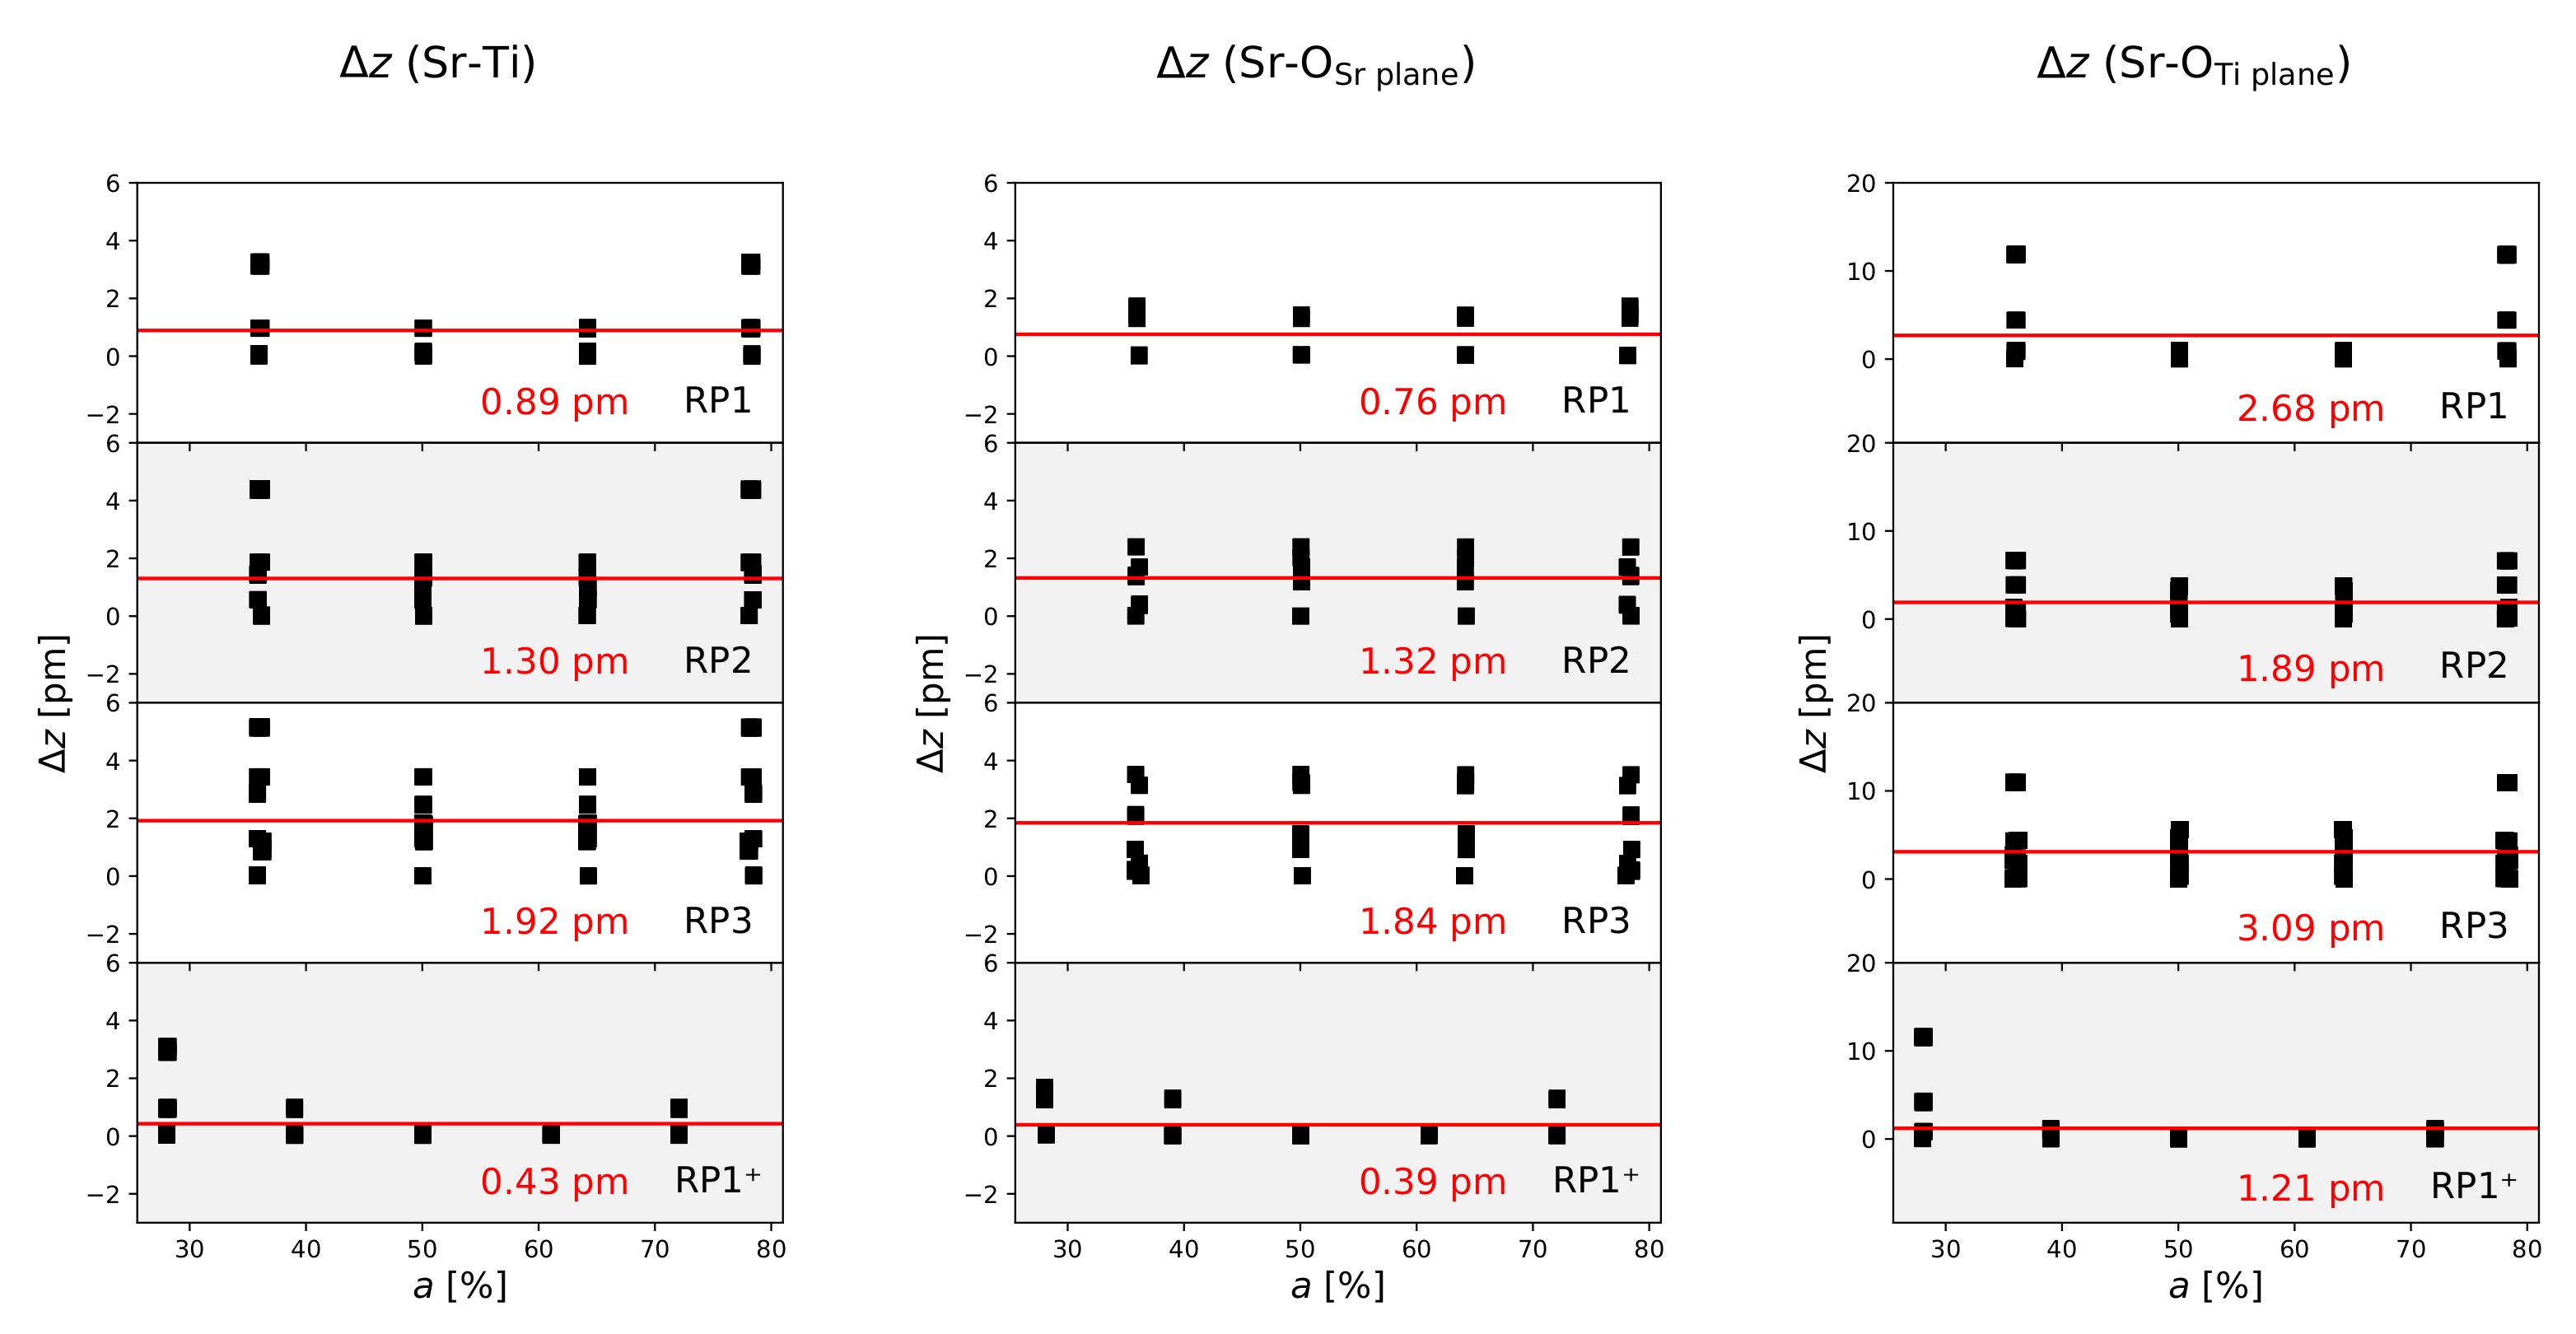
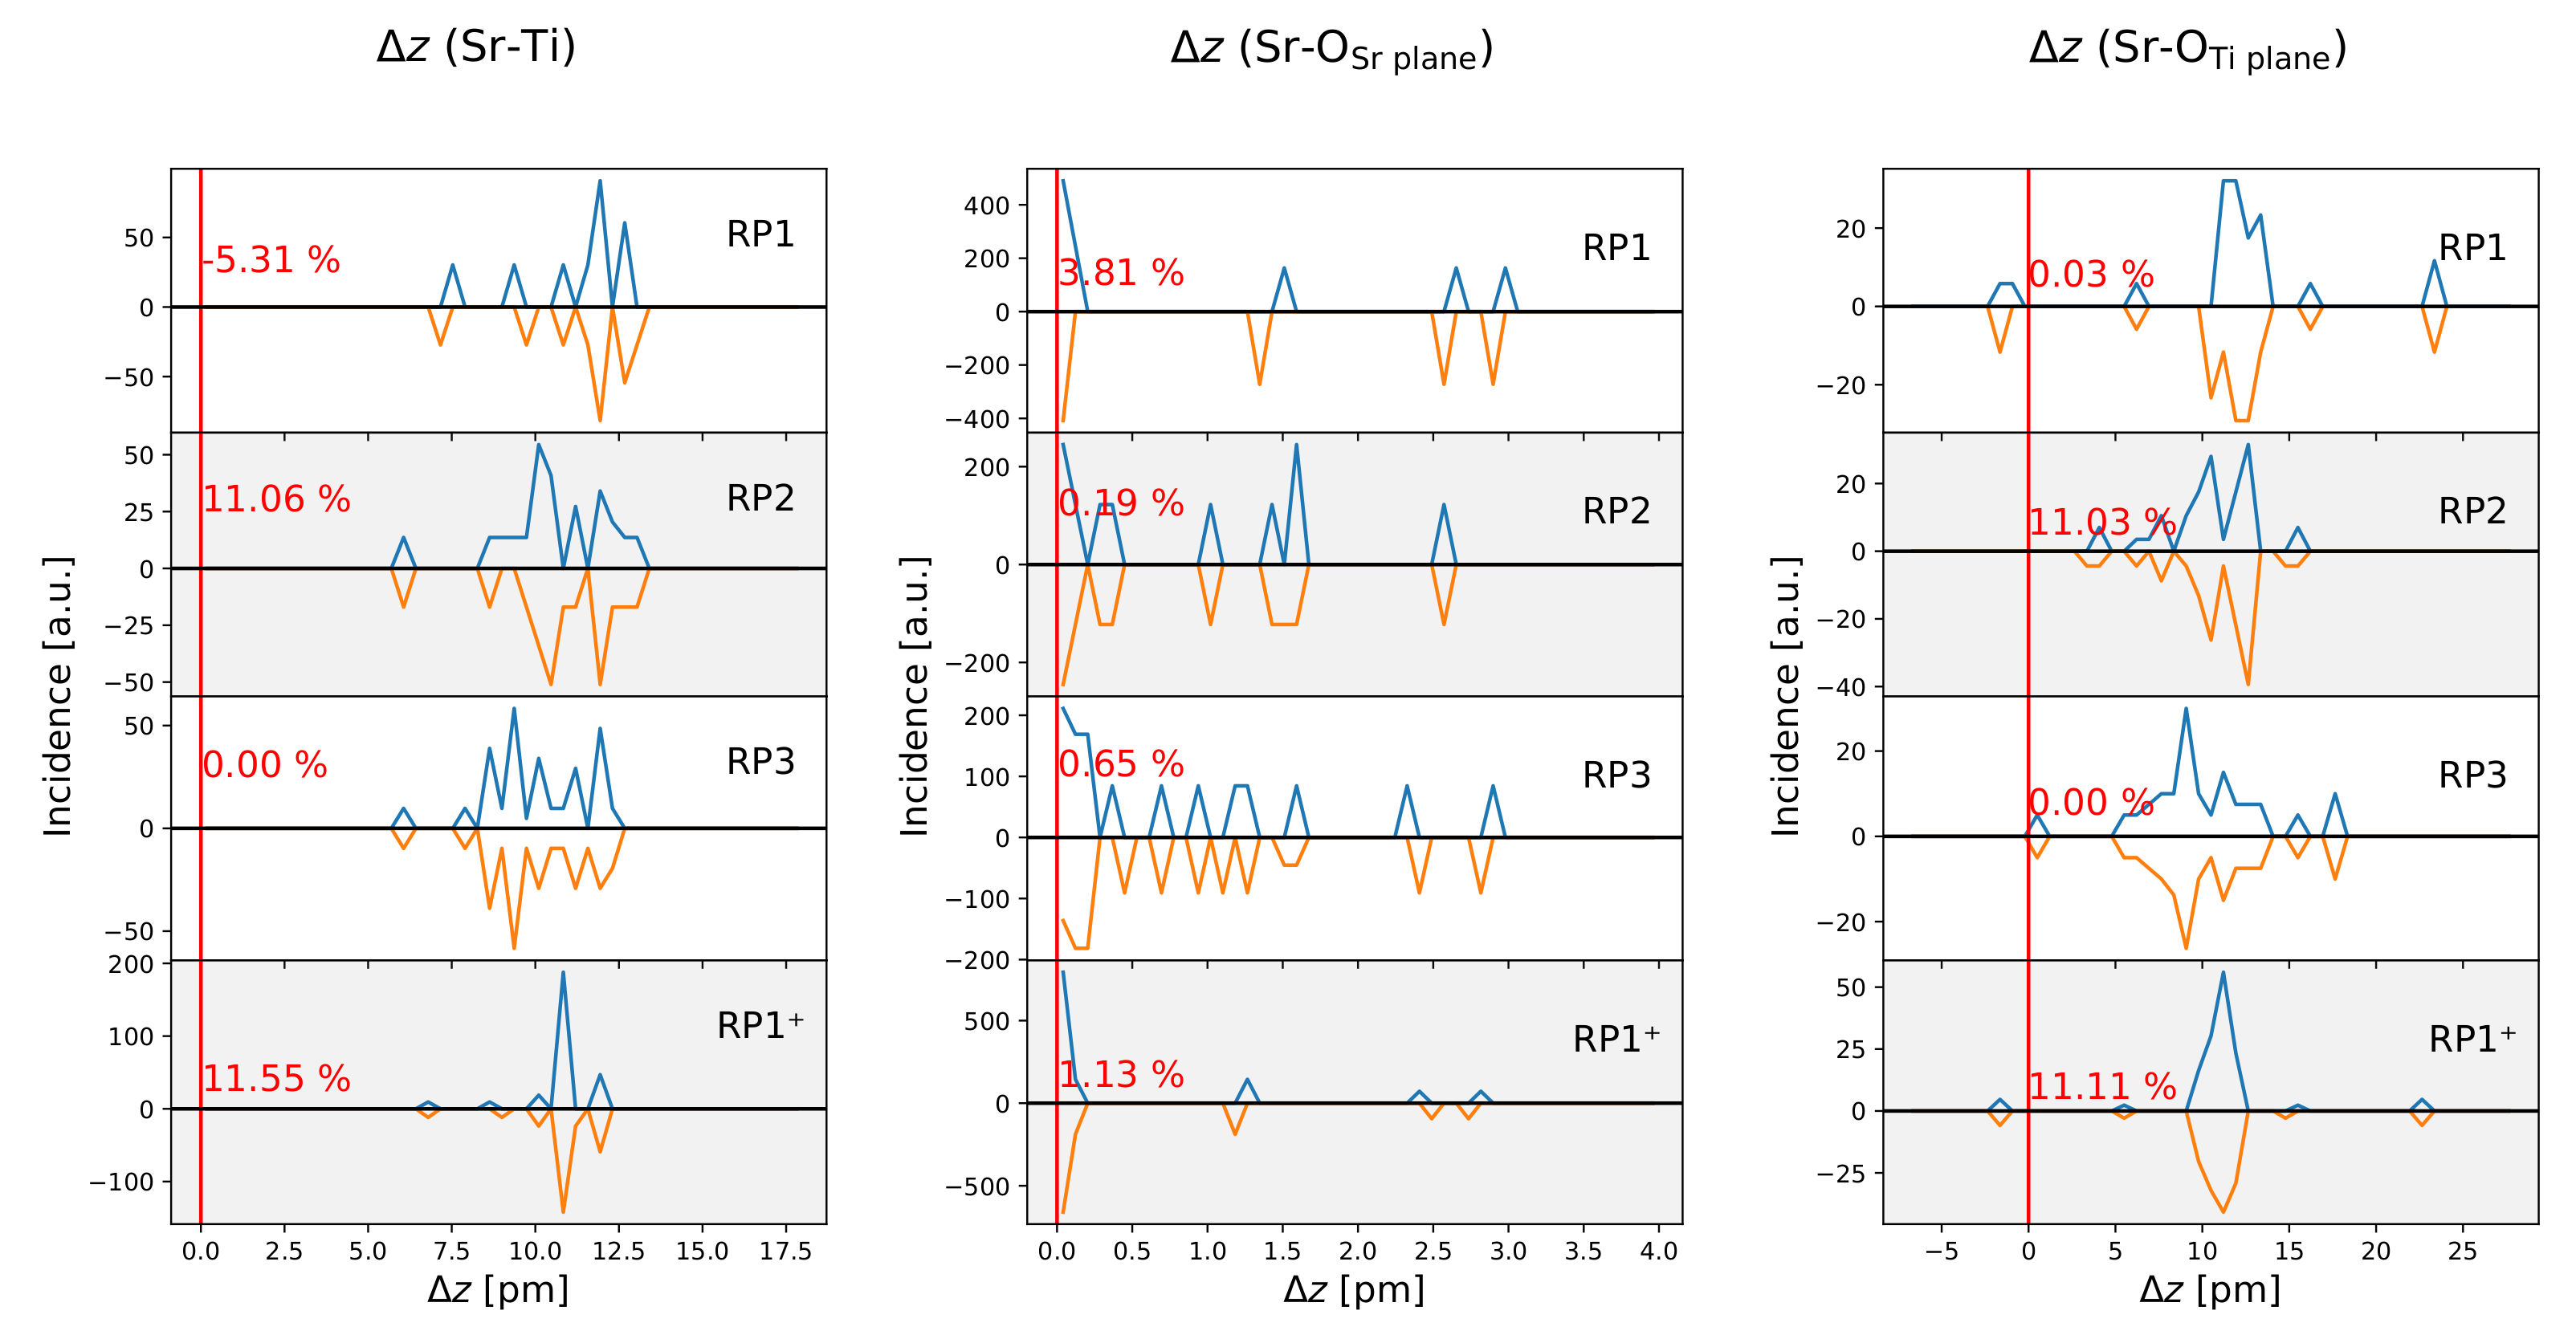
4.3.2. Breaking the Symmetry
4.4. The Energy Point of View
4.4.1. Energies of Formation and Defect Energies
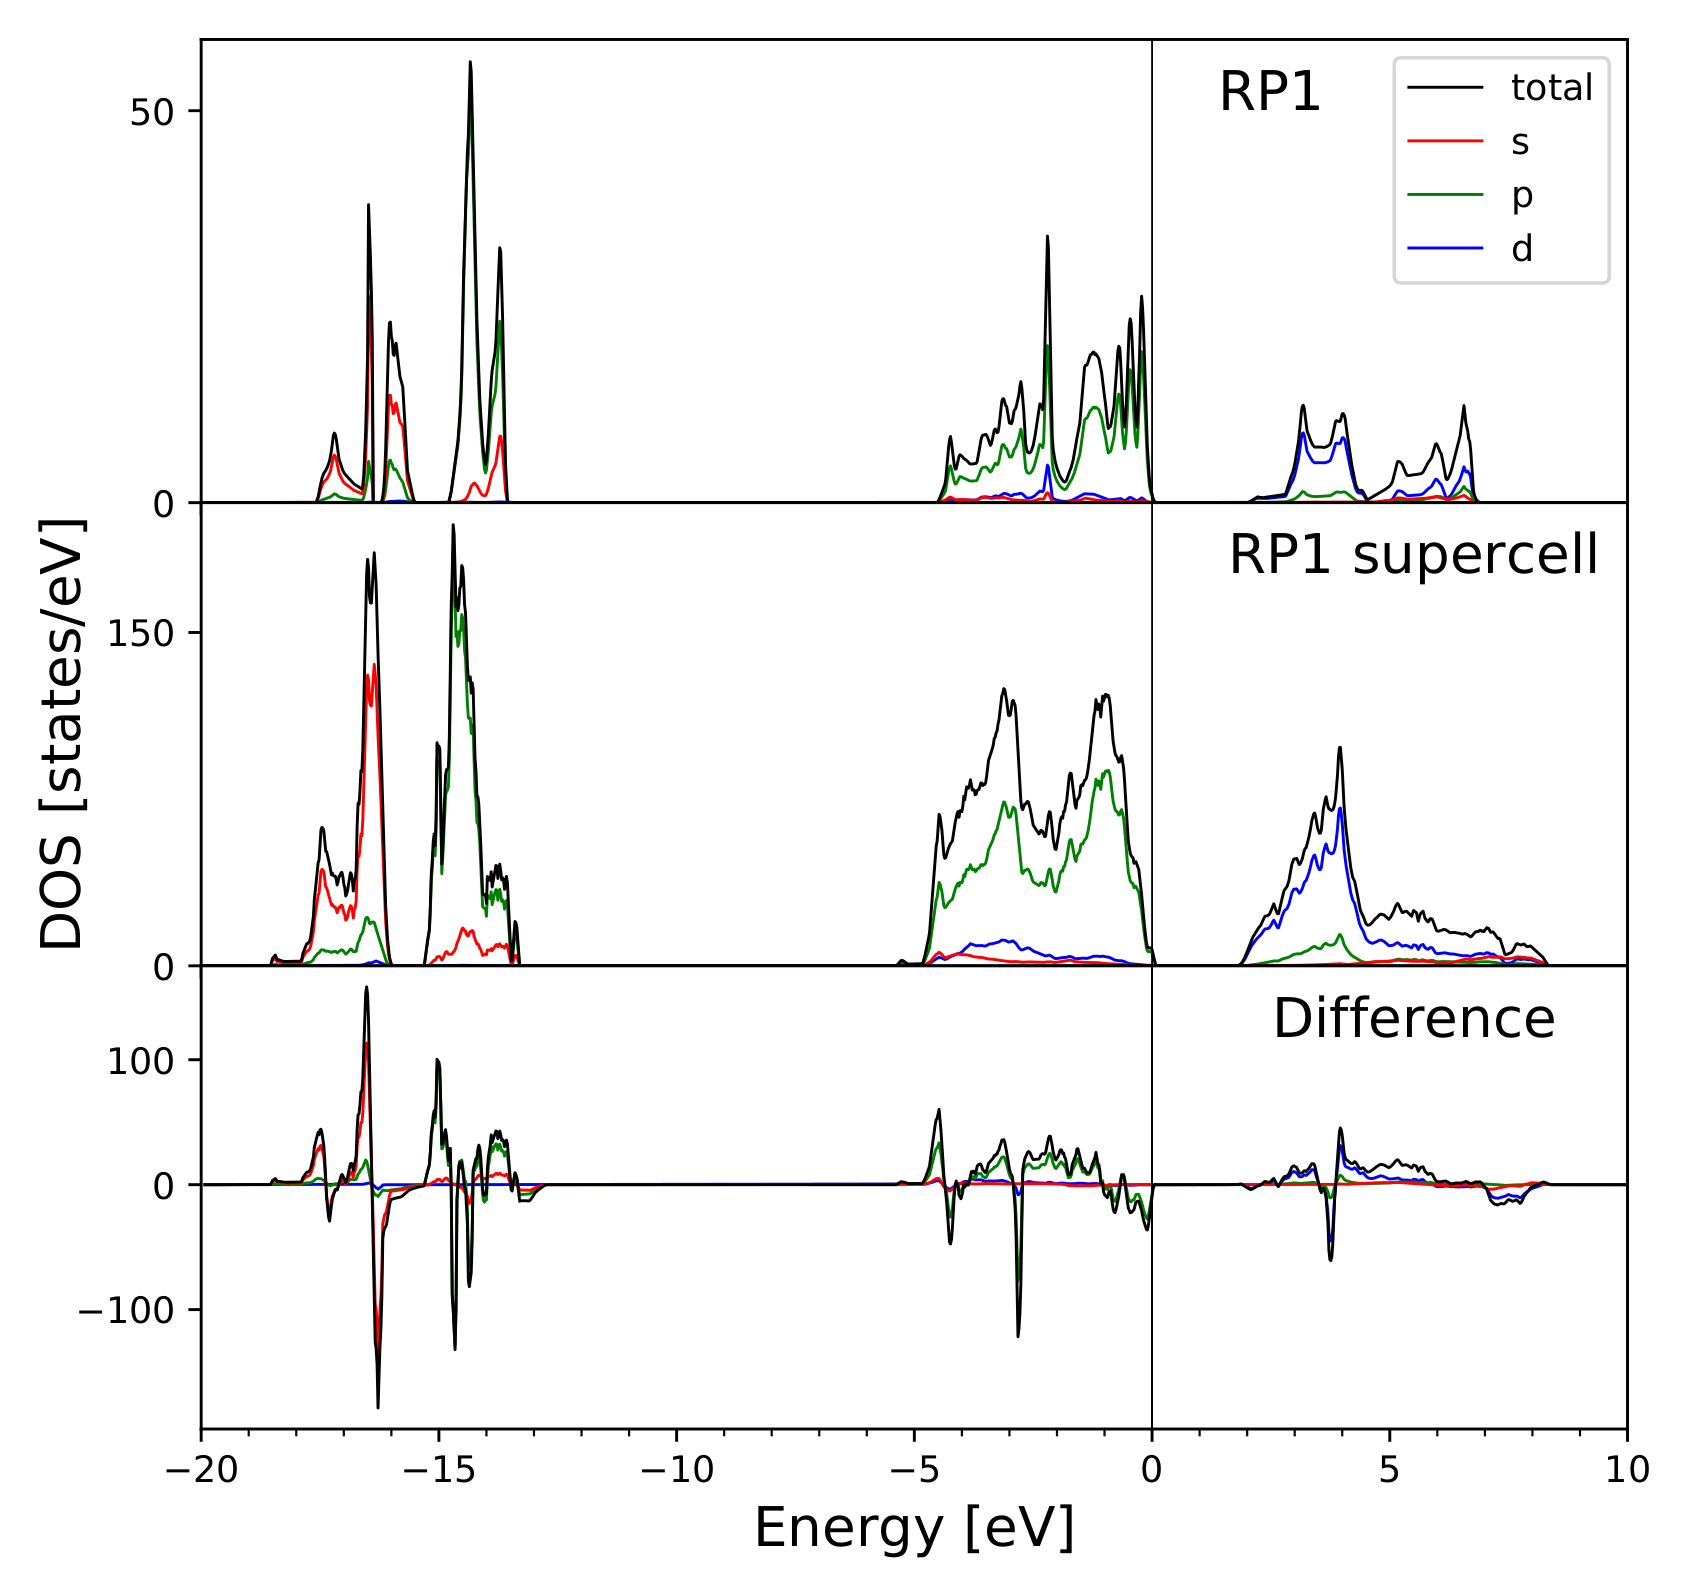
4.4.2. Density of States
5. Conclusions and Outlook
Author Contributions
Acknowledgments
Conflicts of Interest
References
- Antons, A.; Neaton, J.B.; Rabe, K.M.; Vanderbilt, D. Tunability of the dielectric response of epitaxially strained SrTiO3 from first principles. Phys. Rev. B 2005, 71, 116. [Google Scholar] [CrossRef] [Green Version]
- Hui, S.; Petric, A. Electrical Properties of Yttrium-Doped Strontium Titanate under Reducing Conditions. J. Electrochem. Soc. 2002, 149, J1. [Google Scholar] [CrossRef]
- Waser, R. Bulk Conductivity and Defect Chemistry of Acceptor-Doped Strontium Titanate in the Quenched State. J. Am. Ceram. Soc. 1991, 74, 1934–1940. [Google Scholar] [CrossRef]
- Kulagin, N.A.; Dojcilovic, J.; Popovic, D. Valence State Stability in SrTiO3 Doped with ME/RE-Ions. In Physics of Laser Crystals; Krupa, J.C., Kulagin, N.A., Eds.; Number volume 126 in NATO Science Series. Series II, Mathematics, Physics and Chemistry; Kluwer Academic Publishers in cooperation with NATO Scientific Affairs Division: Bruxelles, Belgium, 2003; Volume 126, pp. 187–199. [Google Scholar] [CrossRef]
- Hao, J.H.; Luo, Z.; Gao, J. Effects of substrate on the dielectric and tunable properties of epitaxial SrTiO3 thin films. J. Appl. Phys. 2006, 100, 114107. [Google Scholar] [CrossRef] [Green Version]
- Fong, D.D.; Stephenson, G.B.; Streiffer, S.K.; Eastman, J.A.; Auciello, O.; Fuoss, P.H.; Thompson, C. Ferroelectricity in ultrathin perovskite films. Science 2004, 304, 1650–1653. [Google Scholar] [CrossRef]
- Kohlstedt, H.; Pertsev, N.A.; Rodríguez Contreras, J.; Waser, R. Theoretical current-voltage characteristics of ferroelectric tunnel junctions. Phys. Rev. B 2005, 72, 1623. [Google Scholar] [CrossRef] [Green Version]
- Kwo, J.; Hsieh, T.C.; Fleming, R.M.; Hong, M.; Liou, S.H.; Davidson, B.A.; Feldman, L.C. Structural and superconducting properties of orientation-ordered Y1Ba2Cu3O7-x films prepared by molecular-beam epitaxy. Phys. Rev. B 1987, 36, 4039–4042. [Google Scholar] [CrossRef] [Green Version]
- Mitsugi, F.; Ikegami, T.; Ebihara, K.; Narayan, J.; Grishin, A.M. Colossal magnetoresistive and ferroelectric thin films deposited by excimer laser induced plasma. Sci. Technol. Adv. Mater. 2001, 2, 525–531. [Google Scholar] [CrossRef]
- Zschornak, M.; Gemming, S.; Gutmann, E.; Weißbach, T.; Stöcker, H.; Leisegang, T.; Riedl, T.; Tränkner, M.; Gemming, T.; Meyer, D.C. Surface modeling and chemical solution deposition of SrO(SrTiO3)n Ruddlesden–Popper phases. Acta Mater. 2010, 58, 4650–4659. [Google Scholar] [CrossRef]
- Szot, K.; Speier, W.; Bihlmayer, G.; Waser, R. Switching the electrical resistance of individual dislocations in single-crystalline SrTiO3. Nat. Mater. 2006, 5, 312–320. [Google Scholar] [CrossRef]
- Sawa, A. Resistive switching in transition metal oxides. Mater. Today 2008, 11, 28–36. [Google Scholar] [CrossRef]
- Waser, R.; Dittmann, R.; Staikov, G.; Szot, K. Redox-Based Resistive Switching Memories - Nanoionic Mechanisms, Prospects, and Challenges. Adv. Mater. 2009, 21, 2632–2663. [Google Scholar] [CrossRef]
- Zschornak, M.; Hanzig, J.; Stöcker, H.; Leisegang, T.; Gemming, S.; Meyer, D. Structural transformation of the SrTiO3 surface region due to electric fields at ambient temperature. In Switching Effects in Transition Metal Oxides; Roleder, K., Speier, W., Szot, K., Eds.; Wydawnictwo Naukowe PWN: Warszawa, Poland, 2021. [Google Scholar]
- Janousch, M.; Meijer, G.I.; Staub, U.; Delley, B.; Karg, S.F.; Andreasson, B.P. Role of Oxygen Vacancies in Cr-Doped SrTiO3 for Resistance-Change Memory. Adv. Mater. 2007, 19, 2232–2235. [Google Scholar] [CrossRef] [Green Version]
- Beck, A.; Bednorz, J.G.; Gerber, C.; Rossel, C.; Widmer, D. Reproducible switching effect in thin oxide films for memory applications. Appl. Phys. Lett. 2000, 77, 139–141. [Google Scholar] [CrossRef]
- Hamaguchi, M.; Aoyama, K.; Asanuma, S.; Uesu, Y.; Katsufuji, T. Electric-field-induced resistance switching universally observed in transition-metal-oxide thin films. Appl. Phys. Lett. 2006, 88, 142508. [Google Scholar] [CrossRef]
- Liu, S.Q.; Wu, N.J.; Ignatiev, A. Electric-pulse-induced reversible resistance change effect in magnetoresistive films. Appl. Phys. Lett. 2000, 76, 2749–2751. [Google Scholar] [CrossRef]
- Baikalov, A.; Wang, Y.Q.; Shen, B.; Lorenz, B.; Tsui, S.; Sun, Y.Y.; Xue, Y.Y.; Chu, C.W. Field-driven hysteretic and reversible resistive switch at the Ag–Pr0.7Ca0.3MnO3 interface. Appl. Phys. Lett. 2003, 83, 957–959. [Google Scholar] [CrossRef] [Green Version]
- Watanabe, Y.; Bednorz, J.G.; Bietsch, A.; Gerber, C.; Widmer, D.; Beck, A.; Wind, S.J. Current-driven insulator–conductor transition and nonvolatile memory in chromium-doped SrTiO3 single crystals. Appl. Phys. Lett. 2001, 78, 3738–3740. [Google Scholar] [CrossRef]
- Alvarado, S.F.; La Mattina, F.; Bednorz, J.G. Electroluminescence in SrTiO3:Cr single-crystal nonvolatile memory cells. Appl. Phys. A 2007, 89, 85–89. [Google Scholar] [CrossRef] [Green Version]
- Hanzig, J.; Zschornak, M.; Hanzig, F.; Mehner, E.; Stöcker, H.; Abendroth, B.; Röder, C.; Talkenberger, A.; Schreiber, G.; Rafaja, D.; et al. Migration-induced field-stabilized polar phase in strontium titanate single crystals at room temperature. Phys. Rev. B 2013, 88, 43. [Google Scholar] [CrossRef]
- Hanzig, J.; Zschornak, M.; Nentwich, M.; Hanzig, F.; Gemming, S.; Leisegang, T.; Meyer, D.C. Strontium titanate: An all-in-one rechargeable energy storage material. J. Power Sources 2014, 267, 700–705. [Google Scholar] [CrossRef]
- Hanzig, J.; Mehner, E.; Jachalke, S.; Hanzig, F.; Zschornak, M.; Richter, C.; Leisegang, T.; Stöcker, H.; Meyer, D.C. Dielectric to pyroelectric phase transition induced by defect migration. New J. Phys. 2015, 17, 023036. [Google Scholar] [CrossRef] [Green Version]
- Khanbabaee, B.; Mehner, E.; Richter, C.; Hanzig, J.; Zschornak, M.; Pietsch, U.; Stöcker, H.; Leisegang, T.; Meyer, D.C.; Gorfman, S. Large piezoelectricity in electric-field modified single crystals of SrTiO3. Appl. Phys. Lett. 2016, 109, 222901. [Google Scholar] [CrossRef]
- Richter, C.; Zschornak, M.; Novikov, D.; Mehner, E.; Nentwich, M.; Hanzig, J.; Gorfman, S.; Meyer, D.C. Picometer polar atomic displacements in strontium titanate determined by resonant X-ray diffraction. Nat. Commun. 2018, 9, 178. [Google Scholar] [CrossRef] [PubMed] [Green Version]
- Leisegang, T.; Stöcker, H.; Levin, A.A.; Weissbach, T.; Zschornak, M.; Gutmann, E.; Rickers, K.; Gemming, S.; Meyer, D.C. Switching Ti valence in SrTiO3 by a dc electric field. Phys. Rev. Lett. 2009, 102, 087601. [Google Scholar] [CrossRef] [PubMed] [Green Version]
- Stöcker, H.; Zschornak, M.; Leisegang, T.; Shakhverdova, I.; Gemming, S.; Meyer, D.C. Electric field mediated switching of mechanical properties of strontium titanate at room temperature. Cryst. Res. Technol. 2010, 45, 13–17. [Google Scholar] [CrossRef]
- Jia, C.L.; Houben, L.; Urban, K. Atom vacancies at a screw dislocation core in SrTiO3. Philos. Mag. Lett. 2006, 86, 683–690. [Google Scholar] [CrossRef]
- Brunner, D. Low-temperature plasticity and flow-stress behaviour of strontium titanate single crystals. Acta Mater. 2006, 54, 4999–5011. [Google Scholar] [CrossRef]
- Hutt, S.; Köstlmeier, S.; Elsässer, C. Density functional study of the Σ3 (111)[11¯0] symmetrical tilt grain boundary in SrTiO3. J. Phys. Condens. Matter 2001, 13, 3949–3960. [Google Scholar] [CrossRef]
- Astala, R.; Bristowe, P.D. A computational study of twist boundary structures in strontium titanate. J. Phys. Condens. Matter 2002, 14, 13635–13641. [Google Scholar] [CrossRef]
- Zhang, Z.; Sigle, W.; Phillipp, F.; Rühle, M. Direct atom-resolved imaging of oxides and their grain boundaries. Science 2003, 302, 846–849. [Google Scholar] [CrossRef]
- Zhang, Z.; Sigle, W.; de Souza, R.A.; Kurtz, W.; Maier, J.; Rühle, M. Comparative studies of microstructure and impedance of small-angle symmetrical and asymmetrical grain boundaries in SrTiO3. Acta Mater. 2005, 53, 5007–5015. [Google Scholar] [CrossRef]
- Lee, S.B.; Lee, J.H.; Cho, Y.H.; Kim, D.Y.; Sigle, W.; Phillipp, F.; van Aken, P.A. Grain-boundary plane orientation dependence of electrical barriers at Σ5 boundaries in SrTiO3. Acta Mater. 2008, 56, 4993–4997. [Google Scholar] [CrossRef]
- Benedek, N.A.; Chua, A.L.S.; Elsässer, C.; Sutton, A.P.; Finnis, M.W. Interatomic potentials for strontium titanate. Phys. Rev. B 2008, 78, 1639. [Google Scholar] [CrossRef]
- Andersson, S.; Collén, B.; Kuylenstierna, U.; Magnéli, A.; Pestmalis, H.; Åsbrink, S. Phase Analysis Studies on the Titanium-Oxygen System. Acta Chem. Scand. 1957, 11, 1641–1652. [Google Scholar] [CrossRef] [Green Version]
- Ruddlesden, S.N.; Popper, P. The compound Sr3Ti2O7 and its structure. Acta Crystallogr. 1958, 11, 54–55. [Google Scholar] [CrossRef] [Green Version]
- Moos, R.; Hardtl, K.H. Defect Chemistry of Donor-Doped and Undoped Strontium Titanate Ceramics between 1000° and 1400 °C. J. Am. Ceram. Soc. 1997, 80, 2549–2562. [Google Scholar] [CrossRef]
- Uedono, A.; Shimayama, K.; Kiyohara, M.; Chen, Z.Q.; Yamabe, K. Study of oxygen vacancies in SrTiO3 by positron annihilation. J. Appl. Phys. 2002, 92, 2697–2702. [Google Scholar] [CrossRef]
- Neagu, D.; Irvine, J.T.S. Enhancing Electronic Conductivity in Strontium Titanates through Correlated A and B-Site Doping. Chem. Mater. 2011, 23, 1607–1617. [Google Scholar] [CrossRef]
- Marrocchelli, D.; Sun, L.; Yildiz, B. Dislocations in SrTiO3. J. Am. Chem. Soc. 2015, 137, 4735–4748. [Google Scholar] [CrossRef] [PubMed]
- Stöber, M.; Cherkouk, C.; Leisegang, T.; Schelter, M.; Zosel, J.; Walter, J.; Hanzig, J.; Zschornak, M.; Prucnal, S.; Böttger, R.; et al. Oxygen Exchange Kinetics of SrTiO3 Single Crystals. Cryst. Res. Technol. 2018, 53, 1800004. [Google Scholar] [CrossRef]
- Paladino, A.E. Oxidation Kinetics of Single-Crystal SrTiO3. J. Am. Ceram. Soc. 1965, 48, 476–478. [Google Scholar] [CrossRef]
- Pasierb, P.; Komornicki, S.; Rekas, M. Comparison of the chemical diffusion of undoped and Nb-doped SrTiO3. J. Phys. Chem. Solids 1999, 60, 1835–1844. [Google Scholar] [CrossRef]
- Meyer, R.; Waser, R. Advances in point defect chemistry. J. Eur. Ceram. Soc. 2001, 21, 1743–1747. [Google Scholar] [CrossRef]
- Zhang, L.; Liu, B.; Zhuang, H.; Kent, P.; Cooper, V.R.; Ganesh, P.; Xu, H. Oxygen vacancy diffusion in bulk SrTiO3 from density functional theory calculations. Comput. Mater. Sci. 2016, 118, 309–315. [Google Scholar] [CrossRef] [Green Version]
- Akhtar, M.J.; Akhtar, Z.U.N.; Jackson, R.A.; Catlow, C.R.A. Computer Simulation Studies of Strontium Titanate. J. Am. Ceram. Soc. 1995, 78, 421–428. [Google Scholar] [CrossRef]
- Hanzig, J.; Zschornak, M.; Mehner, E.; Hanzig, F.; Münchgesang, W.; Leisegang, T.; Stöcker, H.; Meyer, D.C. The anisotropy of oxygen vacancy migration in SrTiO3. J. Physics. Condens. Matter Inst. Phys. J. 2016, 28, 225001. [Google Scholar] [CrossRef] [PubMed]
- Kröger, F.; Vink, H. Relations between the concentrations of imperfections in crystalline solids. Solid State Phys. 1956, 3, 307–435. [Google Scholar] [CrossRef]
- Rodenbücher, C.; Meuffels, P.; Speier, W.; Ermrich, M.; Wrana, D.; Krok, F.; Szot, K. Stability and Decomposition of Perovskite-Type Titanates upon High-Temperature Reduction. Phys. Status Solidi (Rrl) Rapid Res. Lett. 2017, 11, 1700222. [Google Scholar] [CrossRef]
- De Souza, R.A. Oxygen Diffusion in SrTiO3 and Related Perovskite Oxides. Adv. Funct. Mater. 2015, 25, 6326–6342. [Google Scholar] [CrossRef]
- Jia, C.L.; Thust, A.; Urban, K. Atomic-Scale Analysis of the Oxygen Configuration at a SrTiO3 Dislocation Core. Phys. Rev. Lett. 2005, 95, 225506. [Google Scholar] [CrossRef] [Green Version]
- Jin, L.; Guo, X.; Jia, C. TEM study of <110> -type 35.26° dislocations specially induced by polishing of SrTiO3 single crystals. Ultramicroscopy 2013, 134, 77–85. [Google Scholar] [CrossRef]
- Szot, K.; Rodenbücher, C.; Bihlmayer, G.; Speier, W.; Ishikawa, R.; Shibata, N.; Ikuhara, Y. Influence of Dislocations in Transition Metal Oxides on Selected Physical and Chemical Properties. Crystals 2018, 8, 241. [Google Scholar] [CrossRef] [Green Version]
- Wang, R.; Zhu, Y.; Shapiro, S.M. Structural Defects and the Origin of the Second Length Scale in SrTiO3. Phys. Rev. Lett. 1998, 80, 2370–2373. [Google Scholar] [CrossRef]
- Szot, K.; Bihlmayer, G.; Speier, W. Chapter Four-Nature of the Resistive Switching Phenomena in TiO2 and SrTiO3: Origin of the Reversible Insulator–Metal Transition. Solid State Phys. 2014, 65, 353–559. [Google Scholar] [CrossRef]
- Rhodes, W.H.; Kingery, W.D. Dislocation Dependence of Cationic Diffusion in SrTiO3. J. Am. Ceram. Soc. 1966, 49, 521–526. [Google Scholar] [CrossRef]
- Walsh, A.; Catlow, C.R.A.; Smith, A.G.H.; Sokol, A.A.; Woodley, S.M. Strontium migration assisted by oxygen vacancies in SrTiO3 from classical and quantum mechanical simulations. Phys. Rev. B 2011, 83, 220301. [Google Scholar] [CrossRef] [Green Version]
- Szot, K.; Speier, W.; Breuer, U.; Meyer, R.; Szade, J.; Waser, R. Formation of micro-crystals on the (100) surface of SrTiO3 at elevated temperatures. Surf. Sci. 2000, 460, 112–128. [Google Scholar] [CrossRef]
- Bobeth, M.; Farag, N.; Levin, A.A.; Meyer, D.C.; Pompe, W.; Romanov, A.E. Reversible Electric Field-Induced Structure Changes in the Near-Surface Region of Strontium Titanate. J. Ceram. Soc. Jpn. 2006, 114, 1029–1037. [Google Scholar] [CrossRef] [Green Version]
- Udayakumar, K.R.; Cormack, A.N. Structural Aspects of Phase Equilibria in the Strontium-Titanium-Oxygen System. J. Am. Ceram. Soc. 1988, 71, C469–C471. [Google Scholar] [CrossRef]
- Zschornak, M. Defect-Induced Local Electronic Structure Modifications within the System SrO-SrTiO3-TiO2. Ph.D. Thesis, TU Bergakademie Freiberg, Freiberg, Germany, 2015. [Google Scholar]
- Jacob, K.; Rajitha, G. Thermodynamic properties of strontium titanates: Sr2TiO4, Sr3Ti2O7, Sr4Ti3O10, and SrTiO3. J. Chem. Thermodyn. 2011, 43, 51–57. [Google Scholar] [CrossRef]
- Udayakumar, K.R.; Cormack, A.N. Non-stoichiometry in alkaline earth excess alkaline earth titanates. J. Phys. Chem. Solids 1989, 50, 55–60. [Google Scholar] [CrossRef]
- Ropp, R.C. Encyclopedia of the Alkaline Earth Compounds; Elsevier: Hoboken, NJ, USA, 2013. [Google Scholar]
- Gutmann, E.; Levin, A.A.; Reibold, M.; Müller, J.; Paufler, P.; Meyer, D.C. Oriented growth of Srn+1TinO3n+1 Ruddlesden–Popper phases in chemical solution deposited thin films. J. Solid State Chem. 2006, 179, 1864–1869. [Google Scholar] [CrossRef]
- Haeni, J.H.; Irvin, P.; Chang, W.; Uecker, R.; Reiche, P.; Li, Y.L.; Choudhury, S.; Tian, W.; Hawley, M.E.; Craigo, B.; et al. Room-temperature ferroelectricity in strained SrTiO3. Nature 2004, 430, 758–761. [Google Scholar] [CrossRef] [Green Version]
- Perdew, J.P. Density functional theory and the band gap problem. Int. J. Quantum Chem. 1985, 28, 497–523. [Google Scholar] [CrossRef]
- Riedl, T.; Gemming, T.; Weissbach, T.; Seifert, G.; Gutmann, E.; Zschornak, M.; Meyer, D.; Gemming, S. ELNES study of chemical solution deposited SrO(SrTiO3)n Ruddlesden–Popper films: Experiment and simulation. Ultramicroscopy 2009, 1100, 26–32. [Google Scholar] [CrossRef]
- Zschornak, M.; Richter, C.; Nentwich, M.; Stöcker, H.; Gemming, S.; Meyer, D.C. Probing a crystal’s short-range structure and local orbitals by Resonant X-ray Diffraction methods. Cryst. Res. Technol. 2014, 49, 43–54. [Google Scholar] [CrossRef]
- Stöcker, H.; Zschornak, M.; Richter, C.; Hanzig, J.; Hanzig, F.; Hinze, A.; Potzger, K.; Gemming, S.; Meyer, D.C. Surface-near modifications of SrTiO3 local symmetry due to nitrogen implantation investigated by grazing incidence XANES. Scr. Mater. 2014, 86, 1–4. [Google Scholar] [CrossRef]


| c [Å] | [Å] | /c [%] | |
|---|---|---|---|
| RP1 | 12.23 | 0.69 | 5.66 |
| 12.17 | 0.64 | 5.25 | |
| RP2 | 20.25 | 1.03 | 5.06 |
| RP3 | 28.28 | 1.37 | 4.84 |
| / | / | |
|---|---|---|
| RP1 | 1.5 | 1.3 |
| 1.2 | 1.0 | |
| RP2 | 1.7 | 1.1 |
| RP3 | 1.8 | 1.0 |
| Sr-Ti [pm] | Sr-OSr [pm] | Sr-OTi [pm] | |
|---|---|---|---|
| RP1 | 0.89 | 0.76 | 2.68 |
| 0.43 | 0.39 | 1.21 | |
| RP2 | 1.30 | 1.32 | 1.89 |
| RP3 | 1.92 | 1.84 | 3.09 |
| exp. value [26] | 1.34 | 3.67 | 3.80 |
| [%] | [%] | [%] | |
|---|---|---|---|
| RP1 | −2.24 | 6.00 | 3.64 |
| −1.72 | 5.33 | 3.52 | |
| RP2 | −2.37 | 4.53 | 2.05 |
| RP3 | −2.42 | 4.14 | 1.62 |
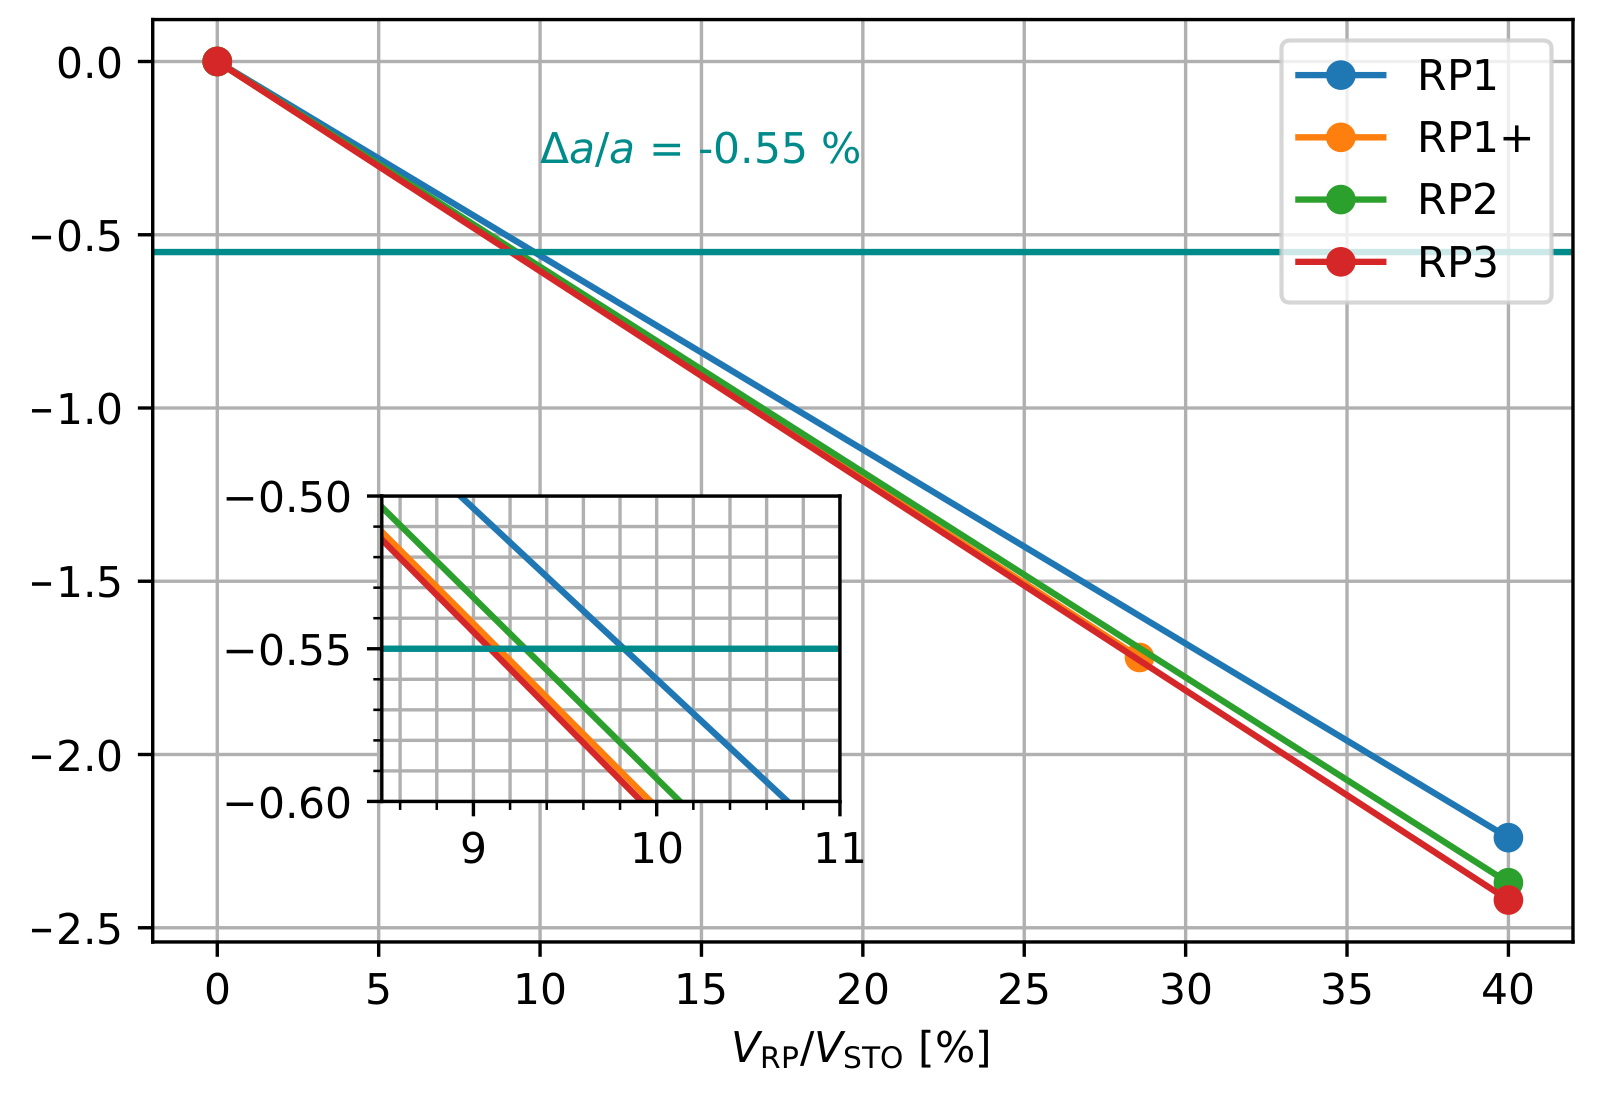
| / [%] | |
|---|---|
| RP1 | 9.9 |
| 9.1 | |
| RP2 | 9.2 |
| RP3 | 9.1 |
| [eV] | [eV] | Per Atom SF [meV] | [meV/Å] | [meV] | [meV/Å] | [meV] | |
|---|---|---|---|---|---|---|---|
| SrO | −16.780 | - | - | - | - | - | - |
| SrTiO3 | −43.001 | - | - | - | - | - | - |
| RP1 | −873.085 | 1.613 | 67.2 | 17.2 | 254 | 8.58 | 127 |
| −1131.183 | 1.533 | 63.9 | 16.4 | 242 | 8.19 | 121 | |
| RP2 | −1465.763 | 1.523 | 47.6 | 9.78 | 145 | 4.89 | 72.3 |
| RP3 | −2058.132 | 1.733 | 43.3 | 7.97 | 118 | 3.98 | 58.9 |
| / [%] | ||||||
|---|---|---|---|---|---|---|
| # | Range [eV] | Character | RP1 | RP2 | RP3 | |
| 1 | −18 to −16 | O 2s | 36 | 36 | 42 | 43 |
| 2 | −16 to −13 | Sr 4p | 16 | 21 | 12 | 14 |
| 3 | −5 to 0 | O 2p, Ti 3d | 14 | 14 | 15 | 15 |
| 4 | 2 to 8 | Ti 3d | 21 | 22 | 21 | 22 |
Publisher’s Note: MDPI stays neutral with regard to jurisdictional claims in published maps and institutional affiliations. |
© 2021 by the authors. Licensee MDPI, Basel, Switzerland. This article is an open access article distributed under the terms and conditions of the Creative Commons Attribution (CC BY) license (https://creativecommons.org/licenses/by/4.0/).
Share and Cite
Ludt, C.; Ovchinnikova, E.; Kulikov, A.; Novikov, D.; Gemming, S.; Meyer, D.C.; Zschornak, M. Interactions of Ruddlesden-Popper Phases and Migration-Induced Field-Stabilized Polar Phase in Strontium Titanate. Crystals 2021, 11, 693. https://doi.org/10.3390/cryst11060693
Ludt C, Ovchinnikova E, Kulikov A, Novikov D, Gemming S, Meyer DC, Zschornak M. Interactions of Ruddlesden-Popper Phases and Migration-Induced Field-Stabilized Polar Phase in Strontium Titanate. Crystals. 2021; 11(6):693. https://doi.org/10.3390/cryst11060693
Chicago/Turabian StyleLudt, Christian, Elena Ovchinnikova, Anton Kulikov, Dmitri Novikov, Sibylle Gemming, Dirk C. Meyer, and Matthias Zschornak. 2021. "Interactions of Ruddlesden-Popper Phases and Migration-Induced Field-Stabilized Polar Phase in Strontium Titanate" Crystals 11, no. 6: 693. https://doi.org/10.3390/cryst11060693