
Structural and Magnetic Properties Study of Fe2O3/NiO/Ni2FeO4 Nanocomposites


Abstract
:1. Introduction
2. Experimental Details
3. Results and Discussion
4. Conclusions
Author Contributions
Funding
Acknowledgments
Conflicts of Interest
References
- Wen, X.; Wang, S.; Ding, Y.; Wang, Z.L.; Yang, S. Controlled Growth of Large-Area, Uniform, Vertically Aligned Arrays of α-Fe2O3Nanobelts and Nanowires. J. Phys. Chem. B 2005, 109, 215–220. [Google Scholar] [CrossRef]
- Tadic, M.; Kusigerski, V.; Markovic, D.; Milosevic, I.; Spasojevic, V. High concentration of hematite nanoparticles in a silica ma-trix: Structural and magnetic properties. J. Magn. Magn. Mater. 2009, 321, 12–16. [Google Scholar] [CrossRef]
- Singh, H.; Yadav, K. Synthesis and study of structural, dielectric, magnetic and magnetoelectric characterization of BiFeO3–NiFe2O4 nanocomposites prepared by chemical solution method. J. Alloys Compd. 2014, 585, 805–810. [Google Scholar] [CrossRef]
- Vuini-Vasi, M.; Antic, B.; Kremenovic, A.; Nikolic, A.S.; Stoiljkovic, M.; Bibic, N.; Spasojevic, V.; Colomban, P. Zn,Ni fer-rite/NiO nanocomposite powder obtained from acetylacetonato complexes. Nanotechnology 2006, 17, 4877–4884. [Google Scholar]
- Remya, K.P.; Rajalakshmi, R.; Ponpandian, N. Development of BiFeO3/MnFe2O4 ferrite nanocomposites with enhanced magnetic and electrical properties. Nanoscale Adv. 2020, 2, 2968–2976. [Google Scholar] [CrossRef]
- Teja, A.S.; Koh, P.-Y. Synthesis, properties, and applications of magnetic iron oxide nanoparticles. Prog. Cryst. Growth Charact. Mater. 2009, 55, 22–25. [Google Scholar] [CrossRef]
- Bansal, M.; Aghamkar, P.; Ahlawat, D.S. Structural properties of CoFe2O4:SiO2 nanocomposites prepared by sol-gel method and co-precipitation method: A comparative study. Int. J. Sci. Technol. Manag. 2015, 4, 871–877. [Google Scholar]
- Mélinon, P.; Begin-Colin, S.; Duvail, J.L.; Gauffre, F.; Boime, N.H.; Ledoux, G.; Plain, J.; Reiss, P.; Silly, F.; Warot-Fonrose, B. Engineered inorganic core/shell nanoparticles. Phys. Rep. 2014, 543, 163–197. [Google Scholar] [CrossRef] [Green Version]
- Hao, P.; Du, J. Mechanical properties of bio-mimetic energy-absorbing materials under impact loading. J. Mater. Sci. 2018, 53, 3189–3197. [Google Scholar] [CrossRef]
- Castro, T.J.; da Silva, S.W.; Nakagomi, F.; Moura, N.S.; Franco, A., Jr.; Morais, P.C. Structural and magnetic properties of ZnO-CoFe2O4 nanocomposites. J. Magn. Magn. Mater. 2015, 389, 27–33. [Google Scholar] [CrossRef]
- Gharagozlou, M. Study on the influence of annealing temperature and ferrite content on the structural and magnetic proper-ties of x(NiFe2O4)/(100 − x)SiO2 nanocomposites. J. Alloys Compd. 2010, 495, 217–223. [Google Scholar] [CrossRef]
- Kumar, A.; Hussain, I.; Kumar, S.; Koo, B.H. Structural, optical properties and the origin of spin functionality in the Co modi-fied TiO2 nanoparticles. Vacuum 2021, 183, 109870. [Google Scholar] [CrossRef]
- Chaudhuri, A.; Mandal, M.; Mandal, K. Preparation and study of NiFe2O4/SiO2 core–shell nanocomposites. J. Alloys Compd. 2009, 487, 698–702. [Google Scholar] [CrossRef]
- Praveena, K.; Sadhana, K.; Murthy, S.R. Structural and magnetic properties of NiCuZn ferrite/SiO2 nanocomposites. J. Magn. Magn. Mater. 2011, 323, 2122–2128. [Google Scholar] [CrossRef]
- Dippong, T.; Deac, I.G.; Cadar, O.; Levei, E.A.; Diamandescu, L.; Borodi, G. Effect of Zn content on structural, morphological and magnetic behavior of ZnxCo1-xFe2O4/SiO2 nanocomposites. J. Alloys Compd. 2019, 792, 432–443. [Google Scholar] [CrossRef]
- Shekofteh-Gohari, M.; Habibi-Yangjeh, A.; Abitorabi, M.; Rouhi, A. Magnetically separable nanocomposites based on ZnO and their applications in photocatalytic processes: A review. Crit. Rev. Environ. Sci. Technol. 2018, 48, 806–857. [Google Scholar] [CrossRef]
- Hamed, A.S.; Ali, I.; El Ghazaly, M.; Al-Abyad, M.; Hassan, H. Nanocomposites of ZnO mixed with different Ni-ferrite contents: Structural and magnetic properties. Phys. B Condens. Matter 2021, 607, 412861. [Google Scholar] [CrossRef]
- Galizia, P.; Algueró, M.; Bernier, N.; Gambacorti, N.; Aza, E.; Lappas, A.; Venet, M.; Galassi, C. Magnetoelectric dual-particulate composites with wasp-waisted magnetic response for broadband energy harvesting. J. Alloys Compd. 2019, 783, 237–245. [Google Scholar] [CrossRef]
- El-Khawas, E.H.; Azab, A.A.; Mansour, A.M. Structural, magnetic and dielectric properties of reduced graphene ox-ide/La0.9Bi0.1FeO3 nanocomposites. Mater. Chem. Phys. 2020, 241, 122335. [Google Scholar] [CrossRef]
- Mishra, A.; Sharma, V.; Mohanty, T.; Kuanr, B.K. Microstructural and magnetic properties of rGO/MnFe2O4 nanocomposites; relaxation dynamics. J. Alloys Compd. 2019, 790, 983–991. [Google Scholar] [CrossRef]
- Parsons, P.; Duncan, K.; Giri, A.K.; Xiao, J.Q.; Karna, S.P. Electromagnetic properties of NiZn ferrite nanoparticles and their polymer composites. J. Appl. Phys. 2014, 115, 173905. [Google Scholar] [CrossRef]
- Huang, X.; Zhang, J.; Wang, W.; Sang, T.; Song, B.; Zhu, H.; Rao, W.; Wong, C. Effect of pH value on electromagnetic loss proper-ties of Co-Zn ferrite prepared via coprecipitation method. J. Magn. Magn. Mater. 2016, 405, 36–41. [Google Scholar] [CrossRef]
- Peddis, D.; Cannas, C.; Musinu, A.; Ardu, A.; Orrù, F.; Fiorani, D.; Laureti, S.; Rinaldi, D.; Muscas, G.; Concas, G.; et al. Beyond the Effect of Particle Size: Influence of CoFe2O4 Nanoparticle Arrangements on Magnetic Properties. Chem. Mater. 2013, 25, 2005–2013. [Google Scholar] [CrossRef]
- Rinaldi-Montes, N.; Gorria, P.; Martínez-Blanco, D.; Fuertes, A.B.; Puente-Orench, I.; Olivi, L.; Blanco, J.A. Size effects on the Néel temperature of antiferromagnetic NiO nanoparticles. AIP Adv. 2016, 6, 056104. [Google Scholar] [CrossRef] [Green Version]
- Tadic, M.; Panjan, M.; Damnjanovic, V.; Milosevic, I. Magnetic properties of hematite (α-Fe2O3) nanoparticles prepared by hy-drothermal synthesis method. Appl. Surf. Sci. 2014, 320, 183–187. [Google Scholar] [CrossRef]
- Wang, W.; Ding, Z.; Zhao, X.; Wu, S.; Li, F.; Yue, M.; Liu, J.P. Microstructure and magnetic properties of MFe2O4 (M = Co, Ni, and Mn) ferrite nanocrystals prepared using colloid mill and hydrothermal method. J. Appl. Phys. 2015, 117, 17A328. [Google Scholar] [CrossRef] [Green Version]
- Mallesh, S.; Sunny, A.; Vasundhara, M.; Srinivas, V. Structure and magnetic properties of ZnO coated MnZn ferrite nanoparti-cles. J. Magn. Magn. Mater. 2016, 418, 112–117. [Google Scholar] [CrossRef]
- Wu, K.; Chang, Y.; Chen, H.; Yang, C.; Horng, D. Variable temperature electron paramagnetic resonance studies of the NiZn ferrite/SiO2 nanocomposite. J. Magn. Magn. Mater. 2004, 278, 156–163. [Google Scholar] [CrossRef]
- Mansour, H.; Letifi, H.; Bargougui, R.; De Almeida-Didry, S.; Negulescu, B.; Autret-Lambert, C.; Gadri, A.; Ammar, S. Structural, optical, magnetic and electrical properties of hematite (α-Fe2O3) nanoparticles synthesized by two methods: Polyol and precipitation. Appl. Phys. A 2017, 123, 787. [Google Scholar] [CrossRef]
- Mrabet, C.; Ben Amor, M.; Boukhachem, A.; Amlouk, M.; Manoubi, T. Physical properties of La-doped NiO sprayed thin films for optoelectronic and sensor applications. Ceram. Int. 2016, 42, 5963–5978. [Google Scholar] [CrossRef]
- Ortiz-Quiñonez, J.L.; Pal, U.; Villanueva, M.S. Structural, Magnetic, and Catalytic Evaluation of Spinel Co, Ni, and Co–Ni Ferrite Nanoparticles Fabricated by Low-Temperature Solution Combustion Process. ACS Omega 2018, 3, 14986–15001. [Google Scholar] [CrossRef] [PubMed]
- Bruvera1, I.J.; Zélis, P.M.; Calatayud, M.P.; Goya, G.F.; Sánchez, F.H. Determination of the blocking tempera-ture of magnetic nanoparticles: The good, the bad, and the ugly. J. Appl. Phys. 2015, 118, 184304. [Google Scholar] [CrossRef]
- Bhowmik, R.N.; Saravanan, A. Surface magnetism, Morin transition, and magnetic dynamics in antiferromagnetic α-Fe2O3 (hematite) nanograins. J. Appl. Phys. 2010, 107, 053916. [Google Scholar] [CrossRef]
- Mitra, S.; Das, S.; Basu, S.; Sahu, P.; Mandal, K. Shape- and field-dependent Morin transitions in structured α-Fe2O3. J. Magn. Magn. Mater. 2009, 321, 2925–2931. [Google Scholar] [CrossRef]
- Szafraniak-Wiza, I.; Andrzejewski, B.; Hilczer, B. Magnetic Properties of Bismuth Ferrite Nanopowder Obtained by Mechanochemical Synthesis. Acta Phys. Pol. A 2014, 126, 1029–1031. [Google Scholar] [CrossRef]
- Rana, R.; Pandey, P.; Singh, R.P.; Rana, D.S. Positive exchange-bias and giant vertical hysteretic shift in La0.3Sr0.7FeO3/SrRuO3 bilayers. Sci. Rep. 2014, 4, 4138. [Google Scholar] [CrossRef] [PubMed]
- Testa-Anta, M.; Murias, B.R.; Salgueiriño, V. Spin Frustration Drives Exchange Bias Sign Crossover in CoFe2O4-Cr2O3 Nanocom-posites. Adv. Funct. Mater. 2019, 29, 1900030. [Google Scholar] [CrossRef]
- Artus, M.; Ammar, S.; Sicard, L.; Piquemal, J.-Y.; Herbst, F.; Vaulay, M.-J.; Fiévet, F.; Richard, V. Synthesis and Magnetic Properties of Ferrimagnetic CoFe2O4 Nanoparticles Embedded in an Antiferromagnetic NiO Matrix. Chem. Mater. 2008, 20, 4861–4872. [Google Scholar] [CrossRef]
- Liu, X.H.; Cui, W.B.; Lv, X.K.; Liu, W.; Zhao, X.G.; Li, D.; Zhang, Z.D. Exchange bias and phase transformation in α-Fe2O3+NiO nanocomposites. J. Appl. Phys. 2008, 103, 103906. [Google Scholar] [CrossRef]
- He, X.-M.; Zhang, C.-W.; Guo, F.-F.; Yan, S.-M.; Li, Y.-T.; Liu, L.-Q.; Zhang, H.-G.; Du, Y.-W.; Zhong, W. Exchange-biased hybrid γ-Fe2O3/NiO core-shell nanostructures: Three-step synthesis, microstructure, and magnetic properties. Phys. Chem. Chem. Phys. 2019, 21, 11967–11976. [Google Scholar] [CrossRef]


| Reagents | Fe2O3 | NiO | Ni2FeO4 |
| FeCl3.6H2O | 0.25 M | — | 0.2 M |
| NiCl2.6H2O | — | — | 0.4 M |
| Ni(NO3)2.6H2O | — | 0.5 M | 3 M |
| NaOH | — | 0.5 M | — |
| NH4OH | 5 mL | — | — |
| D-I water (mL) | 150 | 150 | 150 |
| Nanocomposites | |||
| Sample label | Fe2O3 (mol) | NiO (mol) | Ni2FeO4 (mol) |
| FNN-221 | 2 | 2 | 1 |
| FNN-211 | 2 | 1 | 1 |
| Parameters | FNN-221 | FNN-211 |
| Unit cell parameters (Å) | Fe2O3 (R-3c): a = 5.034 ± 0.00045; c = 13.7368 ± 0.00178; Biso O1 = 0.50000; Biso Fe1 = 0.50000 | Fe2O3 (R-3c): a = 5.029 ± 0.00030; c = 13.7300 ± 0.00119; Biso O1 = 0.150000; Biso Fe1 = 0.10000 |
| NiO (Fm-3m): a = b = c = 4.1760 ± 0.00012; Biso O1 = 0.50000; Biso Ni1 = 0.50000 | NiO (Fm-3m): a = b = c = 4.1742 ± 0.00012; Biso O1 = 0.500000; Biso Ni1 = 0.50000 | |
| Ni2FeO4 (Fd-3m): a = b = c = 8.3275 ± 0.00199; Biso O1 = 0.50000; Biso Fe1 = 0.50000; Biso Ni1 = 0.50000 | Ni2FeO4 (Fd-3m): a = b = c = 8.3428 ± 0.00210; Biso O1 = 0.500000; Biso Fe1 = 0.50000; Biso Ni1 = 0.50000 | |
| Rexp | 12.49 | 14.28 |
| Rp | 18.82 | 17.85 |
| Rwp | 17.93 | 17.39 |
| χ2 | 2.06 | 1.84 |
| Nanocomposites | ||
| FNN-221 | FNN-211 | |
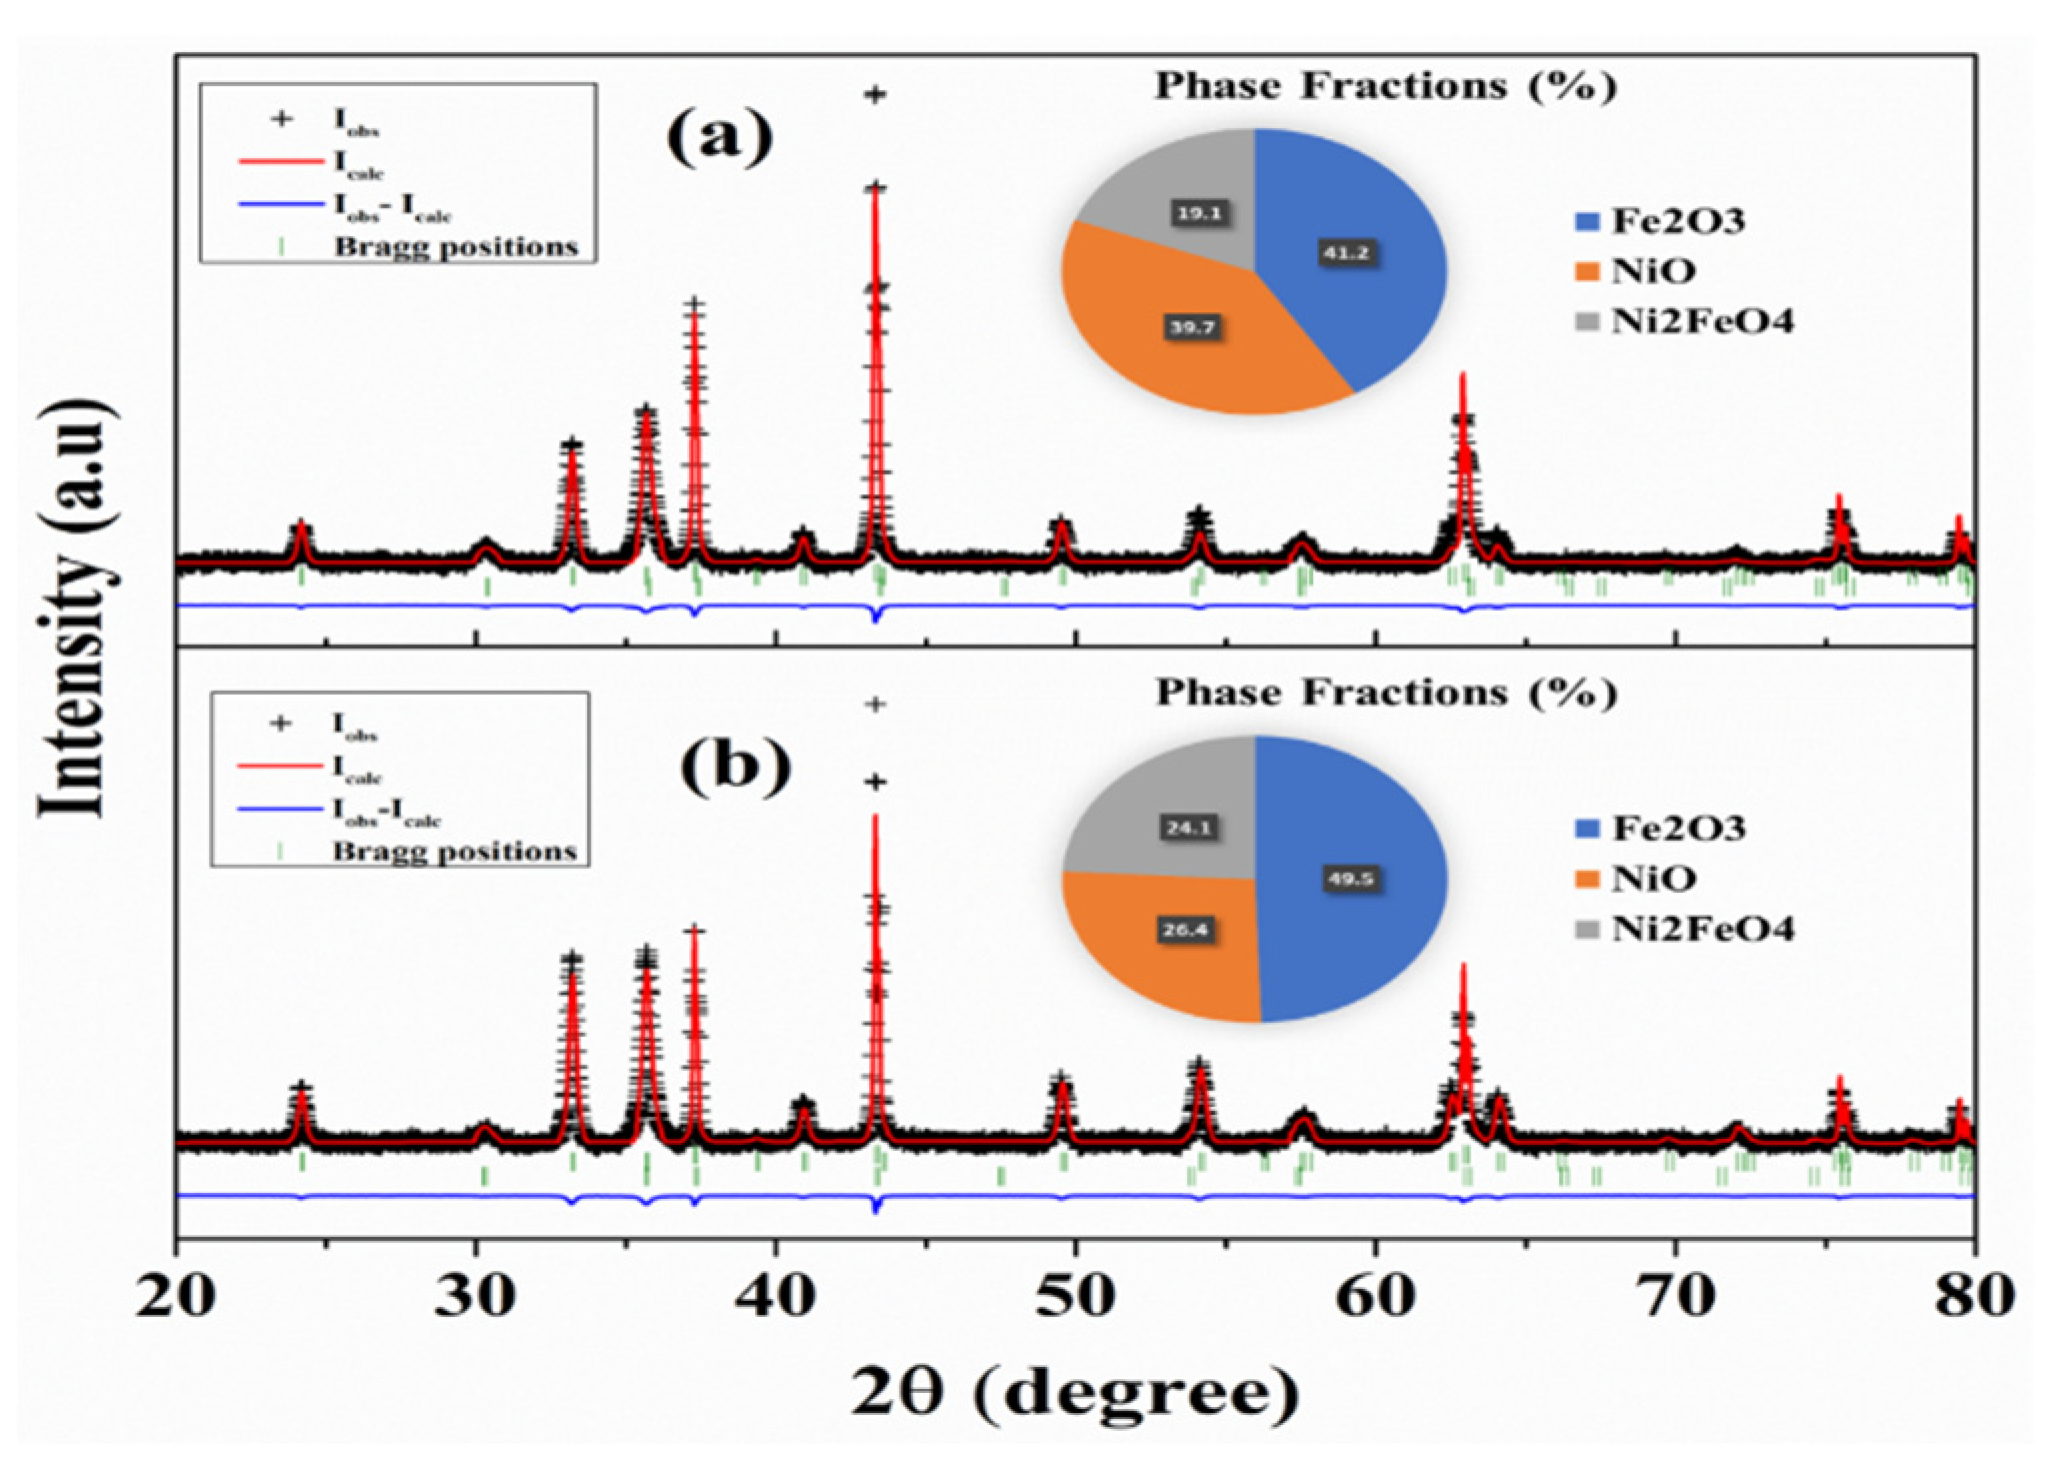
| Phase fraction (Rietveld refinement) | Fe2O3: 41.2% ± 0.39; NiO: 39.7% ± 0.14; Ni2FeO4: 19.1% ± 0.51 | Fe2O3: 49.5% ± 0.62; NiO: 26.4% ± 0.17; Ni2FeO4: 24.1% ± 0.33 |
| crystallite size (nm) Scherrer’s formula | Fe2O3: 58.4 NiO: 292.1 Ni2FeO4: 51.6 | |
| crystallite size (nm) Rietveld method | Fe2O3: 49 NiO: 286.3 Ni2FeO4: 48.4 | |
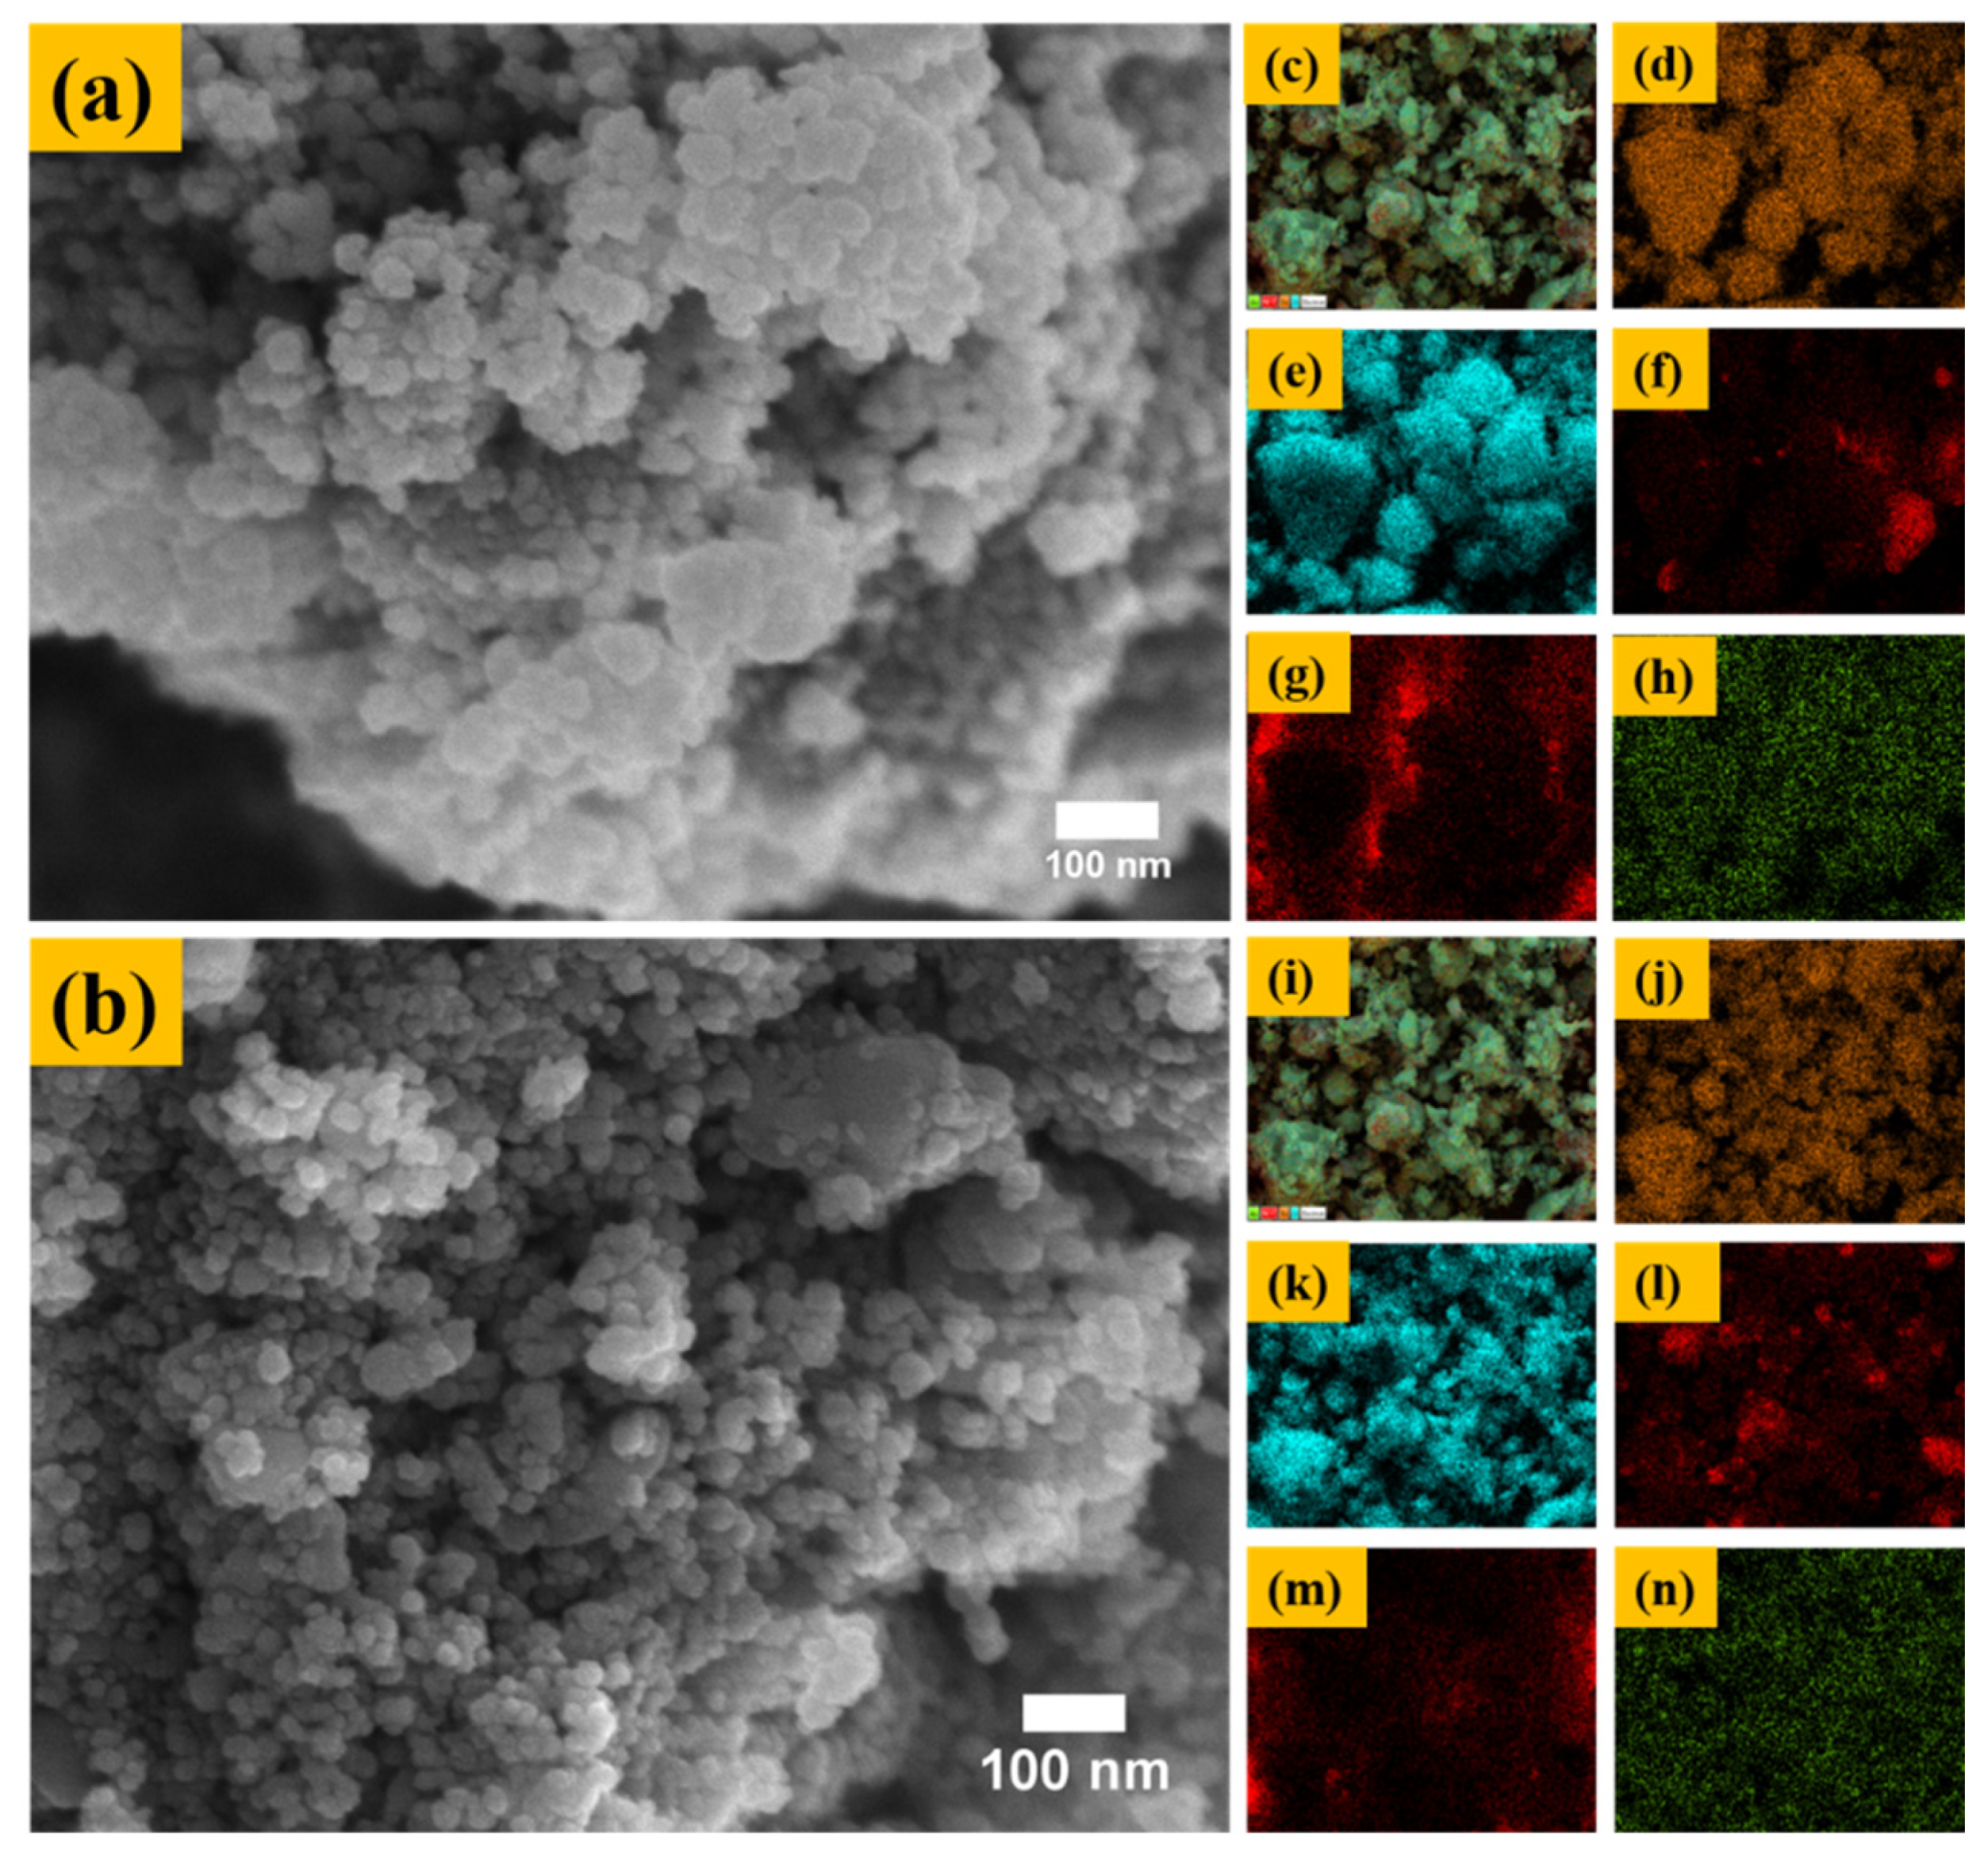
| Element analysis (EDX) |  |  |
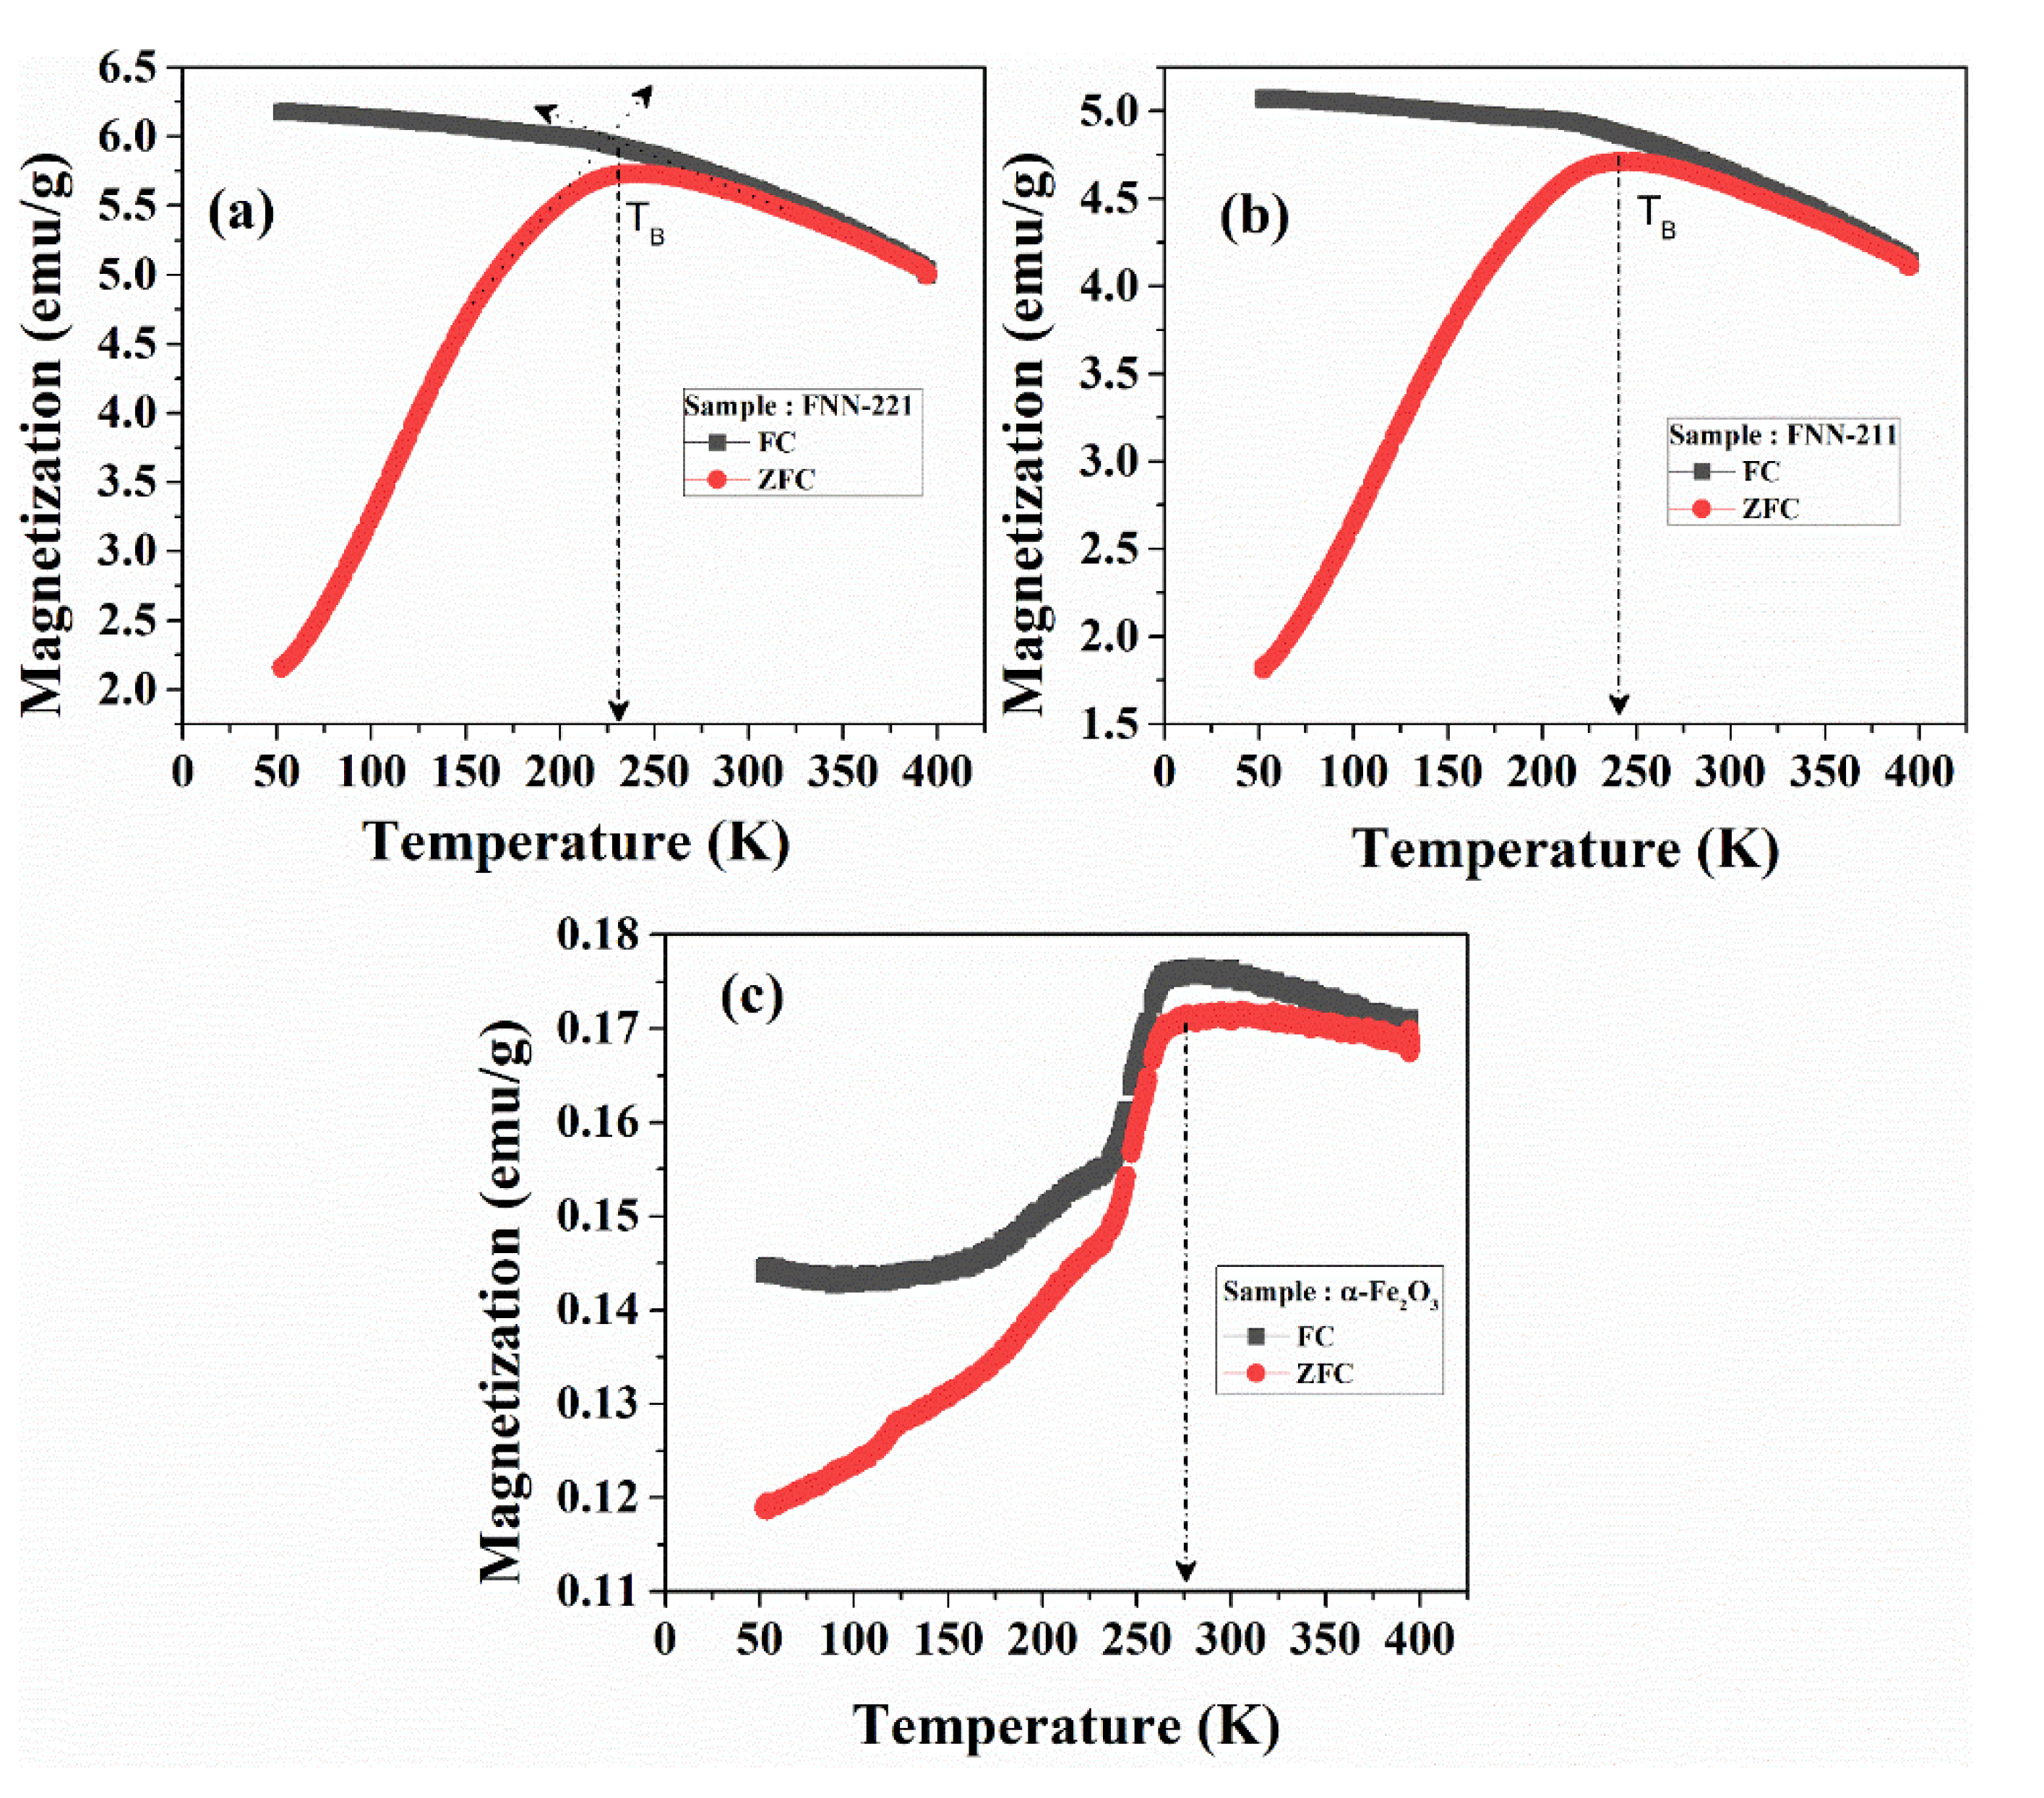
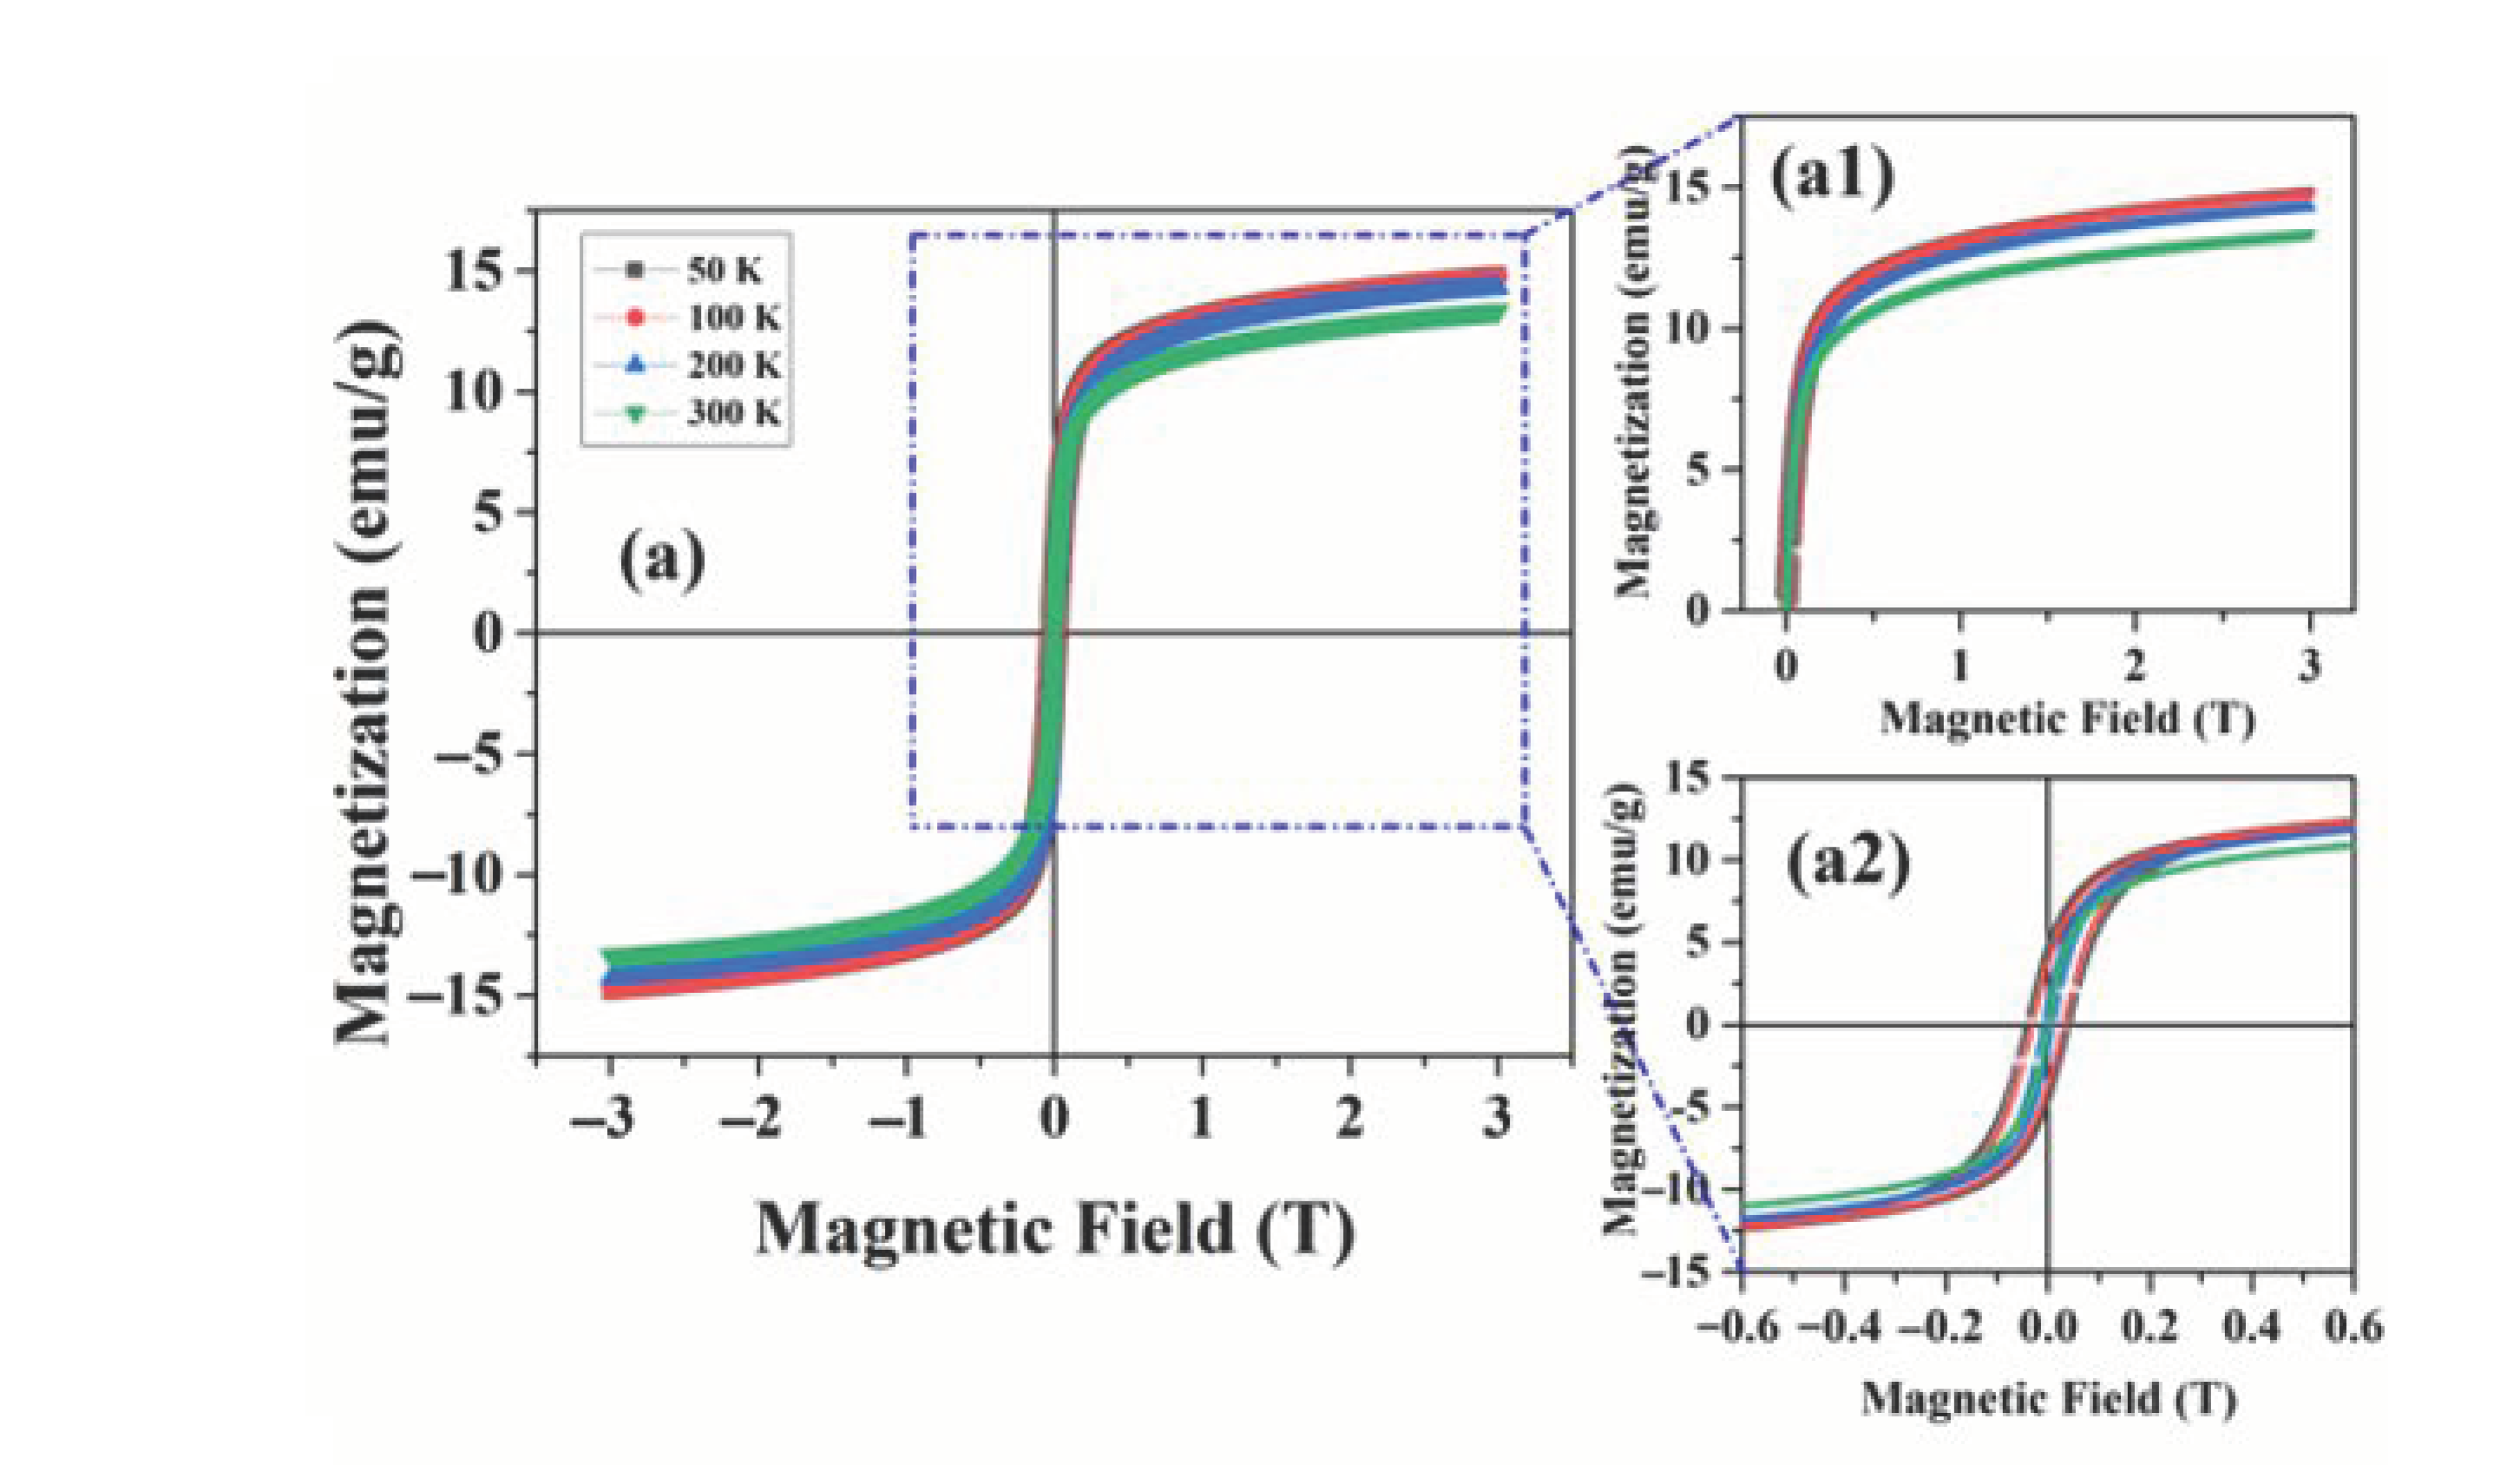
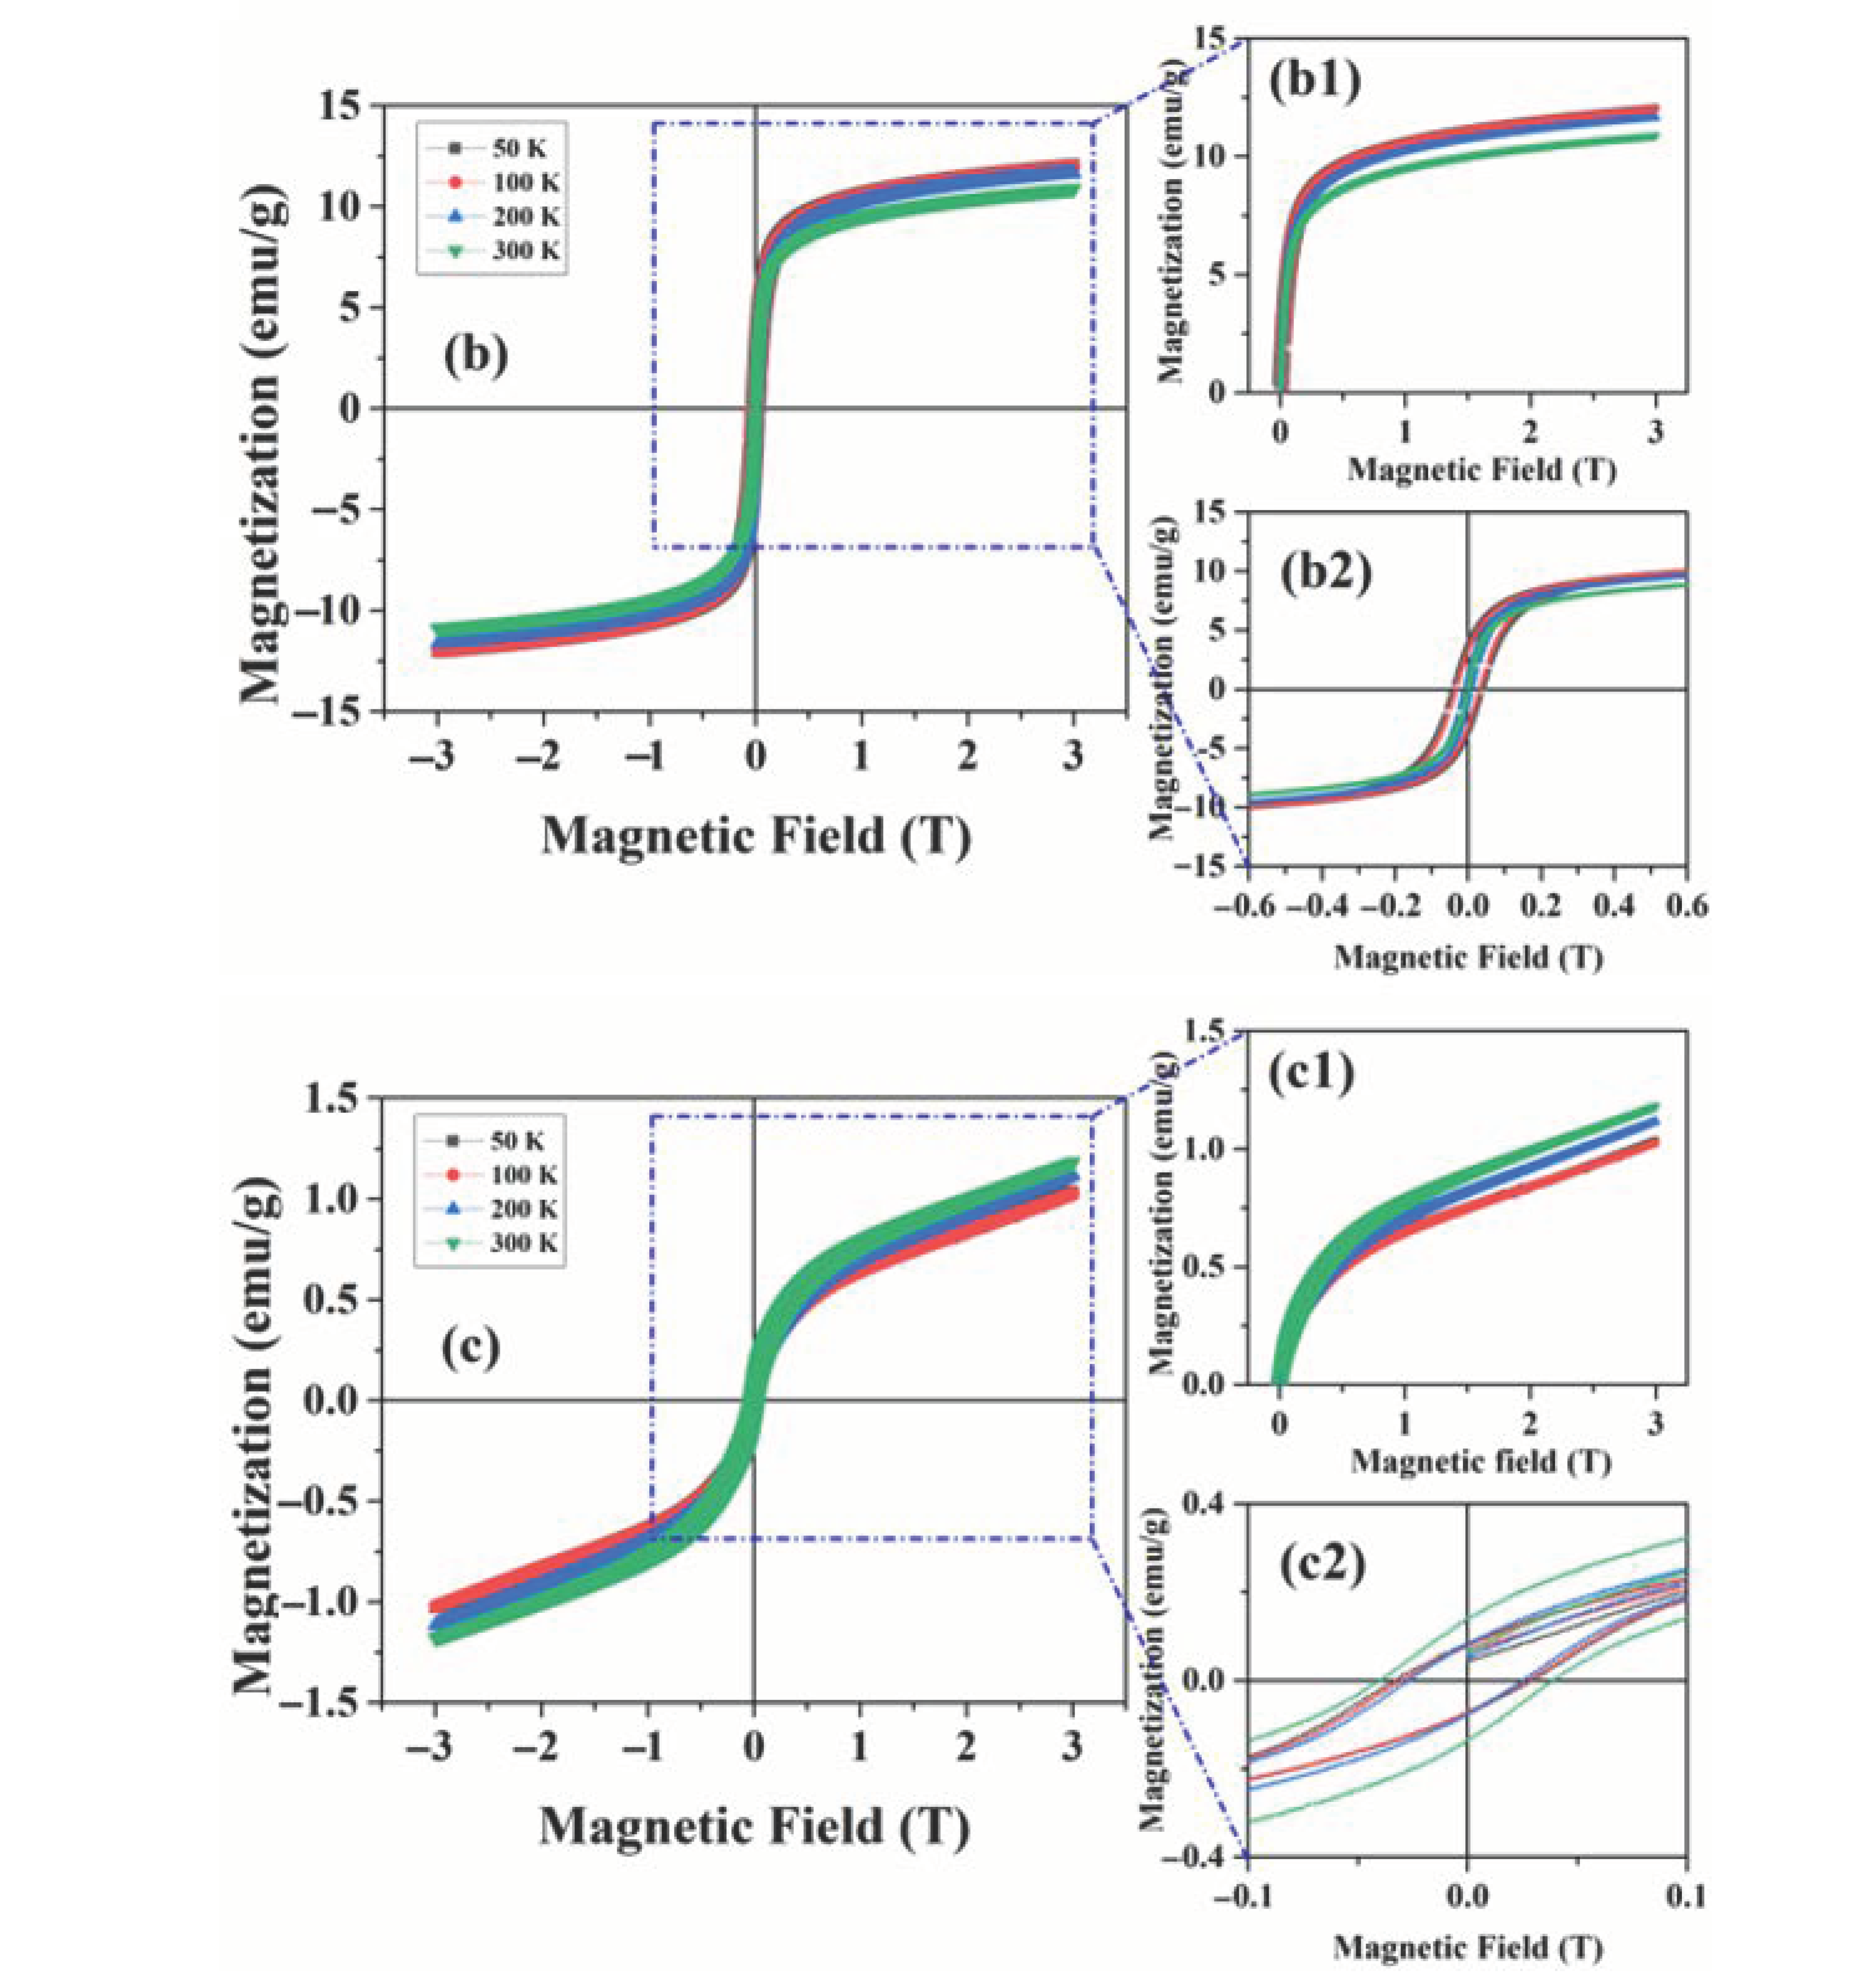
| Magnetization figures of merit (at 50K-FC), Mt/Mr (emu/g), HC (Oe) | Mt = 14.8 (at 3T), Mr: 4.83, HC = 428.1 | Mt = 12.1 (at 3T), Mr: 4.01, HC = 440.72 |
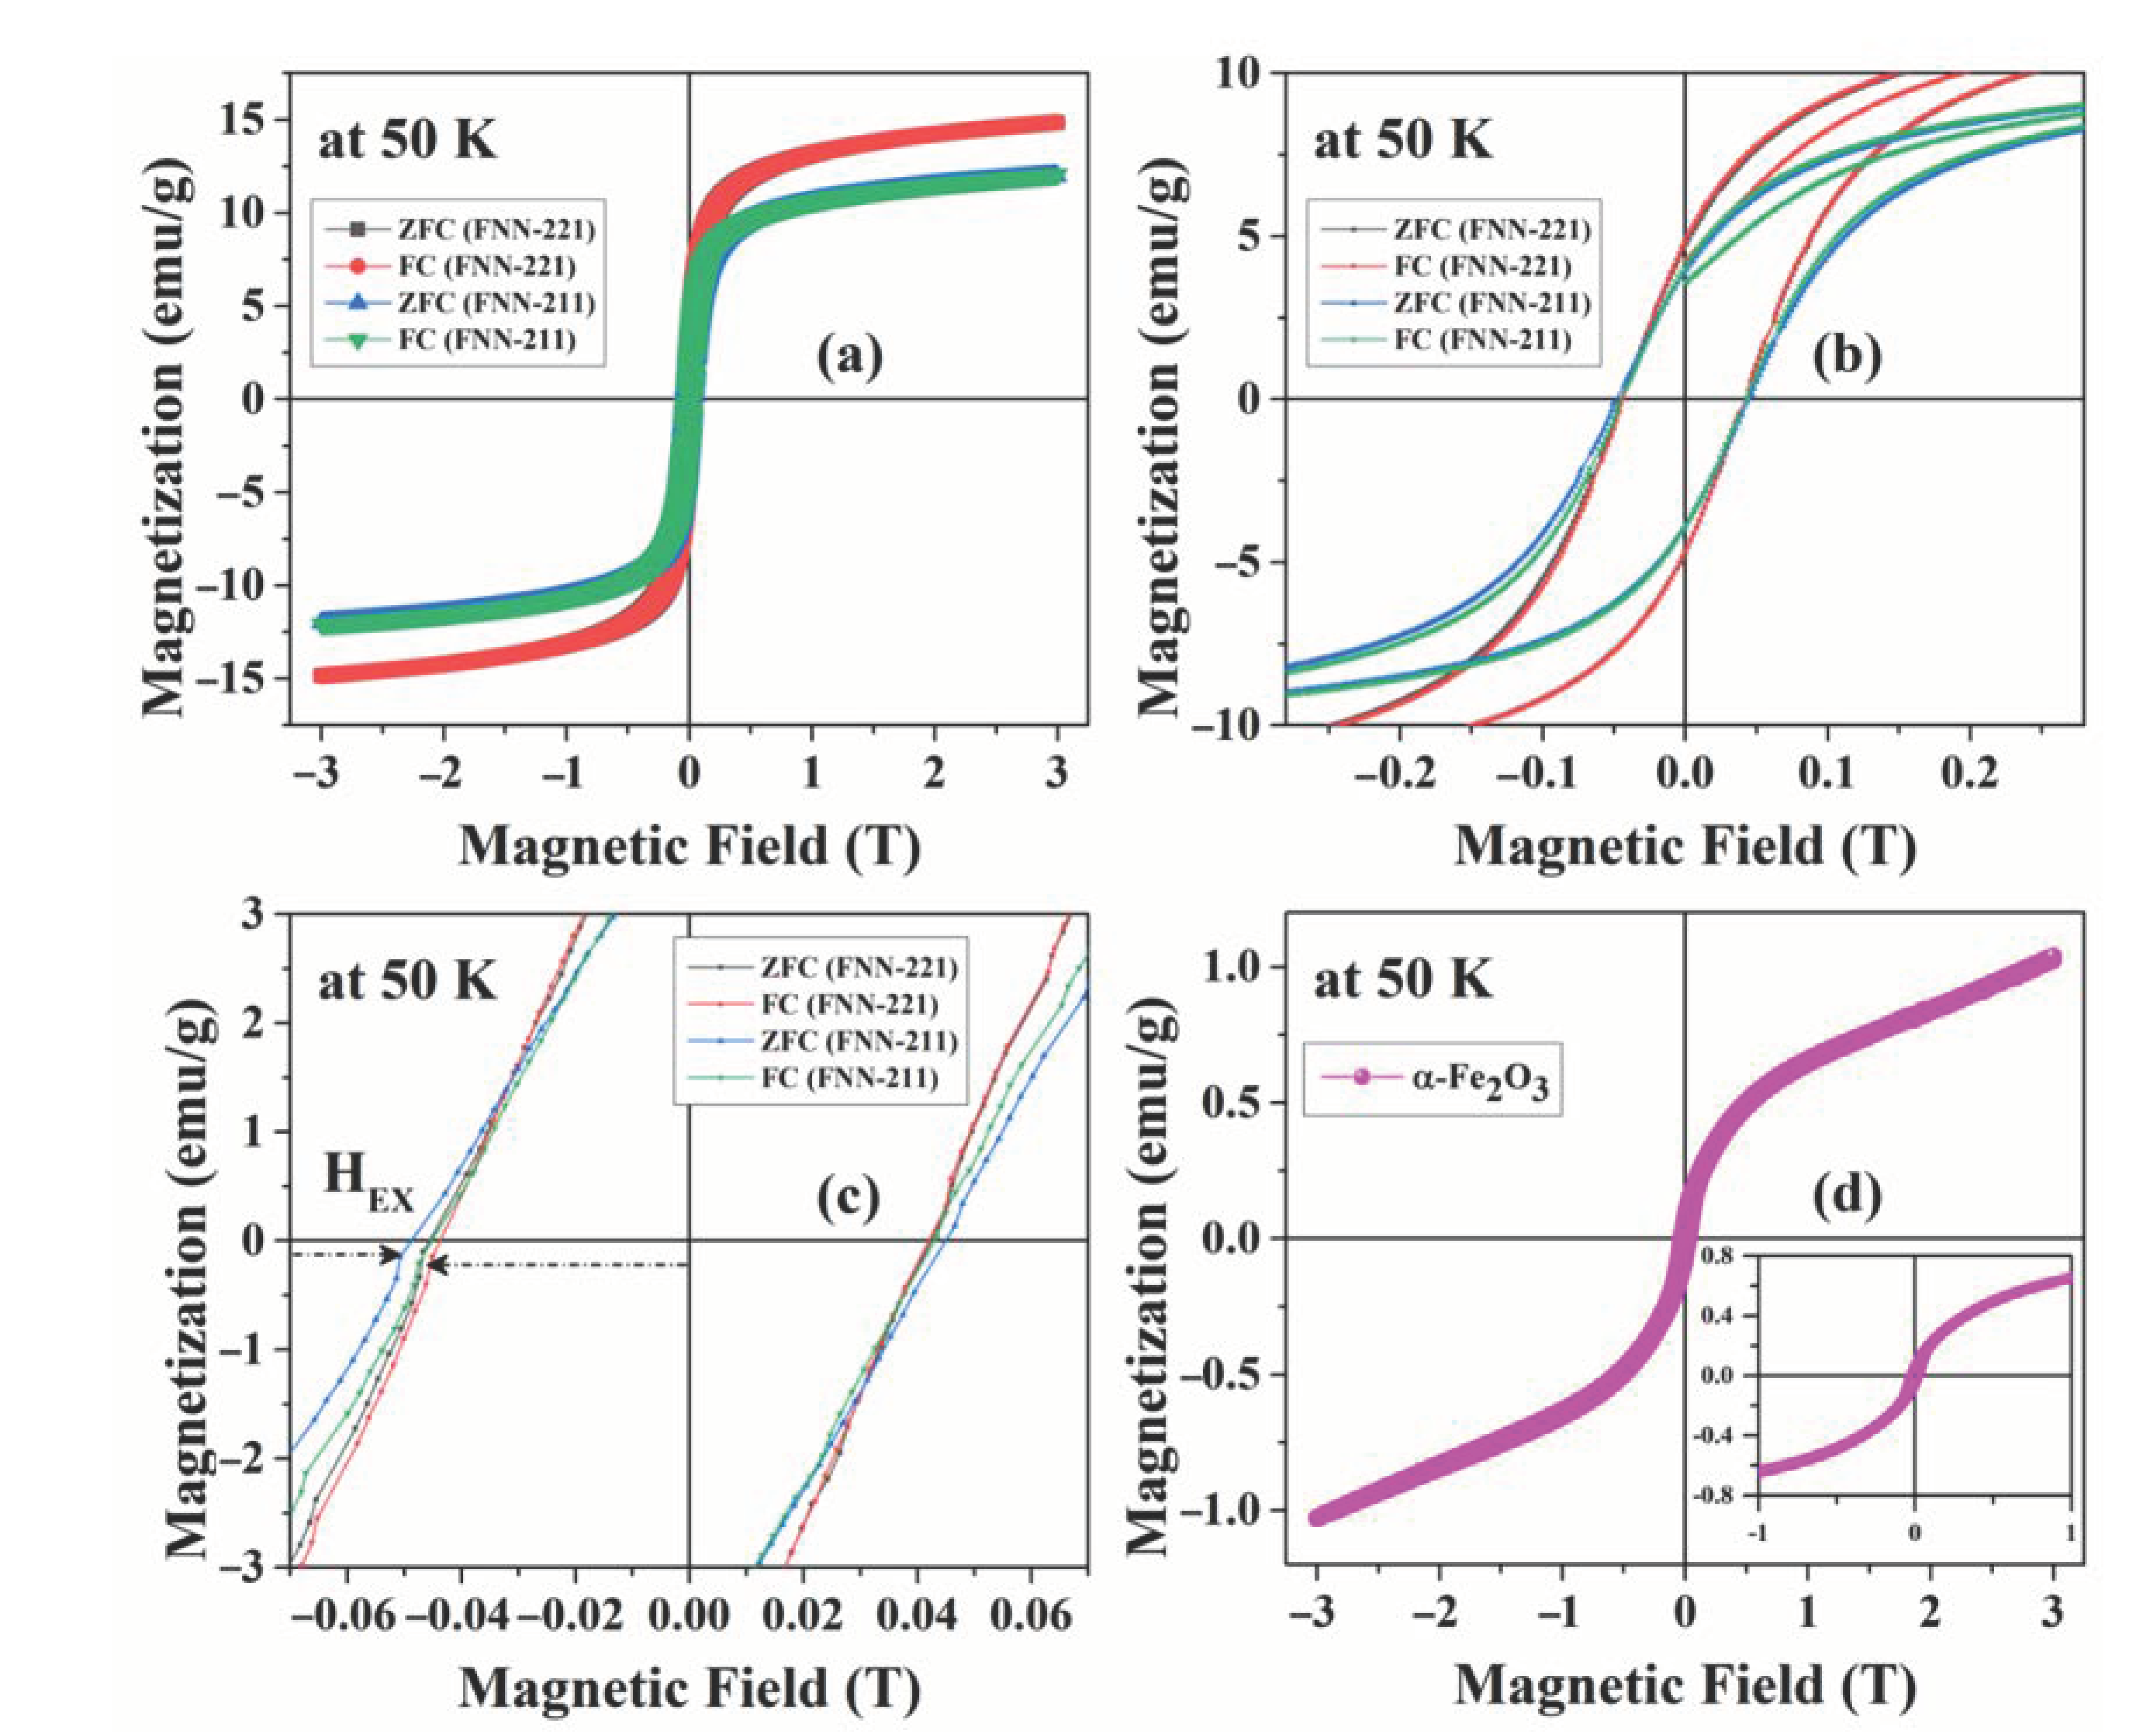
| Exchange Bias field (Hex) (Oe) | 35.1 | — |
Publisher’s Note: MDPI stays neutral with regard to jurisdictional claims in published maps and institutional affiliations. |
© 2021 by the authors. Licensee MDPI, Basel, Switzerland. This article is an open access article distributed under the terms and conditions of the Creative Commons Attribution (CC BY) license (https://creativecommons.org/licenses/by/4.0/).
Share and Cite
Alhashem, Z.; Awada, C.; Ahmed, F.; Farha, A.H. Structural and Magnetic Properties Study of Fe2O3/NiO/Ni2FeO4 Nanocomposites. Crystals 2021, 11, 613. https://doi.org/10.3390/cryst11060613
Alhashem Z, Awada C, Ahmed F, Farha AH. Structural and Magnetic Properties Study of Fe2O3/NiO/Ni2FeO4 Nanocomposites. Crystals. 2021; 11(6):613. https://doi.org/10.3390/cryst11060613
Chicago/Turabian StyleAlhashem, Zakia, Chawki Awada, Faheem Ahmed, and Ashraf H. Farha. 2021. "Structural and Magnetic Properties Study of Fe2O3/NiO/Ni2FeO4 Nanocomposites" Crystals 11, no. 6: 613. https://doi.org/10.3390/cryst11060613