Article

Applications of Gene Expression Programming and Regression Techniques for Estimating Compressive Strength of Bagasse Ash based Concrete

1
Department of Civil Engineering, COMSATS University Islamabad, Abbottabad Campus, Abbottabad 22060, KP Pakistan
2
Department of Civil and Environmental Engineering, College of Engineering, King Faisal University (KFU), P.O. 380, Al-Hofuf, Al Ahsa 31982, Saudi Arabia
3
Department of Civil Engineering, College of Engineering in Al-Kharj, Prince Sattam Bin Abdulaziz University, Al-Kharj 11942, Saudi Arabia
*
Authors to whom correspondence should be addressed.
Crystals 2020, 10(9), 737; https://doi.org/10.3390/cryst10090737
Submission received: 25 July 2020 / Revised: 17 August 2020 / Accepted: 18 August 2020 / Published: 21 August 2020
(This article belongs to the Special Issue Numerical Study of Concrete)

Abstract

:
Compressive strength is one of the important property of concrete and depends on many factors. Most of the concrete compressive strength predictive models mainly rely on available literature data, which are too simple to consider all the contributing factors. This study adopted a new approach to predict the compressive strength of sugarcane bagasse ash concrete (SCBAC). A vast amount of data from the literature study and fifteen laboratory tested concrete samples with different dosage of bagasse ash, were respectively used to calibrate and validate the models. The novel Gene Expression Programming, Multiple Linear Regression and Multiple Non-Linear Regression were used to model SCBAC compressive strength. The water cement ratio, bagasse ash percent replacement, quantity of fine and coarse aggregate and cement content were used as an input for models development. Various statistical indicators, i.e., NSE, R2 and RMSE were used to assess the performance of the models. The results indicated a strong correlation between observed and predicted values with NSE and R2 both above 0.8 during calibration and validation for the Gene Expression Programming (GEP). The outcomes from GEP outclassed all the models to predict SCBAC compressive strength. The validity of the model is further verified using data of fifteen tests conducted in the laboratory. Moreover, the cement content in the mix was revealed as the most sensitive parameter followed by water cement ratio form sensitivity analysis. The GEP fulfilled all the criteria for external validity. The simple formulae derived in this study could be used reliably for the prediction of SCBAC compressive strength.

1. Introduction

A large amount of waste is generated due to rapid industrial development. Generation and disposal of large amounts of waste poses serious environmental issues [1,2]. The construction industry is responsible for 30% of global carbon dioxide emissions and also consumes maximum energy [3]. Concrete is the most consumed material and production of 1 ton of concrete releases approximately 0.05–0.13 tons of CO2 into the environment [4,5,6]. Therefore, researchers are focusing on green technologies for sustainability [7,8,9]. Meanwhile, different types of wastes and by-products of industries were used as supplementary cementitious material for the production of green concrete. Such materials are considered as low-carbon alternatives to ordinary portland cement [10,11]. Incorporating these materials in concrete production can lead to durable and sustainable concrete. Hence, the production and use of green concrete is indispensable for reducing adverse environmental impacts [12,13], Sugarcane Bagasse Ash (SCBA) is agricultural waste produced in the sugar industry from the cogeneration process [14]. The use of SCBA as an alternative cementitious material in a concrete mix is considered to be advantageous to condense the environmental impact of the construction industry and preserve the natural environment [1].
Compressive strength is the fundamental property of concrete and indicates the ability to resist compression loads [15]. Concrete properties mainly depend on many factors such as mix design, type of material, testing procedure and mainly the concrete ingredients [16,17]. The properties and amount of supplementary material, curing techniques and concrete density [18] also effect the mechanical properties [19,20]. Therefore, knowing the relationship between mechanical properties, percentage replacement and water cement ratio used is indispensable before the frequent practice. For the assessment of concrete properties, the laboratory experiments are quite time-consuming, labor-intensive and costly. Therefore, models could be employed to reduce the experimental workload for assessment of mechanical properties [21]. Moreover, because of the small test record and restrictions in the parametric ranges, the accessible models could not provide accurate and desired results. Such a database, which covers a variety of parameters, is needed to create accurate equations which can easily predict multiple properties [1]. Developing strong prediction models for some key properties leads to time saving and making an effective mixture [22]. For this purpose, statistical regression techniques were employed by many researchers [23,24]. Some notable drawbacks were observed while using regression for empirical modeling. Firstly, the structure of the model should be definite and well defined by a linear or nonlinear equation for executing regression analysis. Secondly, the assumption of normality of residuals is another problem in regression analysis [25,26]. There are also concerns regarding the available equations in codes and standards for forecasting compressive strength because such equations are developed based on concrete tests without supplementary cementitious material [26].
Recent progress in the field of artificial intelligence (AI) techniques has resulted in the development of accurate and reliable models for the structural engineering problems [1]. The advancement and progress in the field of AI made it easy to produce models in order to adapt to difficulties related to concrete properties [1]. For solving problems specifically in Civil Engineering, AI has been in focus in both empirical and academic fields over the last decade [27]. The Artificial Neural Network (ANN) is the most widely used AI method to assess different concrete properties [28,29,30], although ANN is considered to be a black box model since it doesn’t provide information about the anticipated prediction principles. The formulations based on neural networks are often too complex to be used because of the empiric formulization [1]. Moreover, the ANN is unable to provide practical prediction equations [22]. Genetic programming (GP) is another type of AI technique that automatically generates models which are totally based on genetic evaluation. GP is an influential optimization technique based on neural and regression techniques. However, GP is much more advantageous than conventional techniques. Without assuming the base form, GP has the ability to produce simple expressions. Some functions should be defined for regression and then analysis of the defined function is performed. There is no need to predefine the functions in GP, i.e., considering the formulations that fit the experimental outcomes, and GP itself adds or deletes various combinations of parameters. In this regard, Gene Expression Programming (GEP) is considered superior to other techniques [16]. The output of GEP is characterized by simple mathematical equations which are more applicable with high accuracy. GEP has a unique and multi-genic nature which permits the development of more complex programs. Recently, GEP has been used for commonly predicted method explicitly in the field of Civil Engineering [31,32,33].
Various researchers have modelled different properties of concrete using GEP. Abdollahzadeh et al. [16] predicted the 28-day compressive strength of concrete with the help of two GEP models considering the amount of cement, silica fume, CA, FA, water and superplasticizers. From literature, data of 159 concrete mixes were taken. The authors concluded that the GEP models can predict the compressive strength of high-strength concrete for each testing phase rendered to different statistical parameters. Gholampour A., et al. [1] used GEP to model the mechanical properties of recycled aggregate concrete utilizing data from literature. The authors reported a close agreement of the model results with the test results. Saridemir, M., and Bilir, T. [19] studied the elastic modulus of fly ash concrete using GEP models. The data for models were collected from 132 concrete mixes available in literature. The elastic modulus was predicted form the compressive strength of fly ash concrete. In the second model, prediction of the elastic modulus was made through the amount and strength of fly ash concrete. Iqbal, M.F., et al. [34] predicted the mechanical properties of waste foundry sand based concrete with the help of GEP. Extensive data from literature was used and four different parameters were used as input. They confirmed the high accuracy and prediction capacity of the GEP model. Mousavi, S.M., et al., [22] modeled the compressive strength of high performance concrete with GEP. A database was generated from literature study, and they observed that GEP is an effective technique to predict compressive strength of high performance concrete.
However, most of the above mentioned studies mainly depends on data collected from literature and it is very difficult to consider all the factors responsible for compressive strength. No organized and detailed study was conducted that considered both the combination of available literature data for model calibration and experimental testing of concrete for models validation. This study is devoted to apply the novel Gene Expression Programming (GEP), Multiple Linear Regression (MLR) and Multiple Non-linear Regression (MNLR) techniques to predict the compressive strength of Sugarcane Bagasse Ash Concrete (SCBAC). The literature data was used for models calibration and compressive strength results derived from laboratory tests were used to validate the model. SCBA was used to replace Portland cement in quantities of 0% 10%, 20%, 30% and 40% by weight of cement. The formulation of such models that accurately estimate the concrete compressive strength by utilizing the minimum number of parameters and then validating the model results through practical laboratory test results significantly enhances the utility and building trust in the forecasting models in many research areas.

2. Methods, Datasets and Experimental Procedure

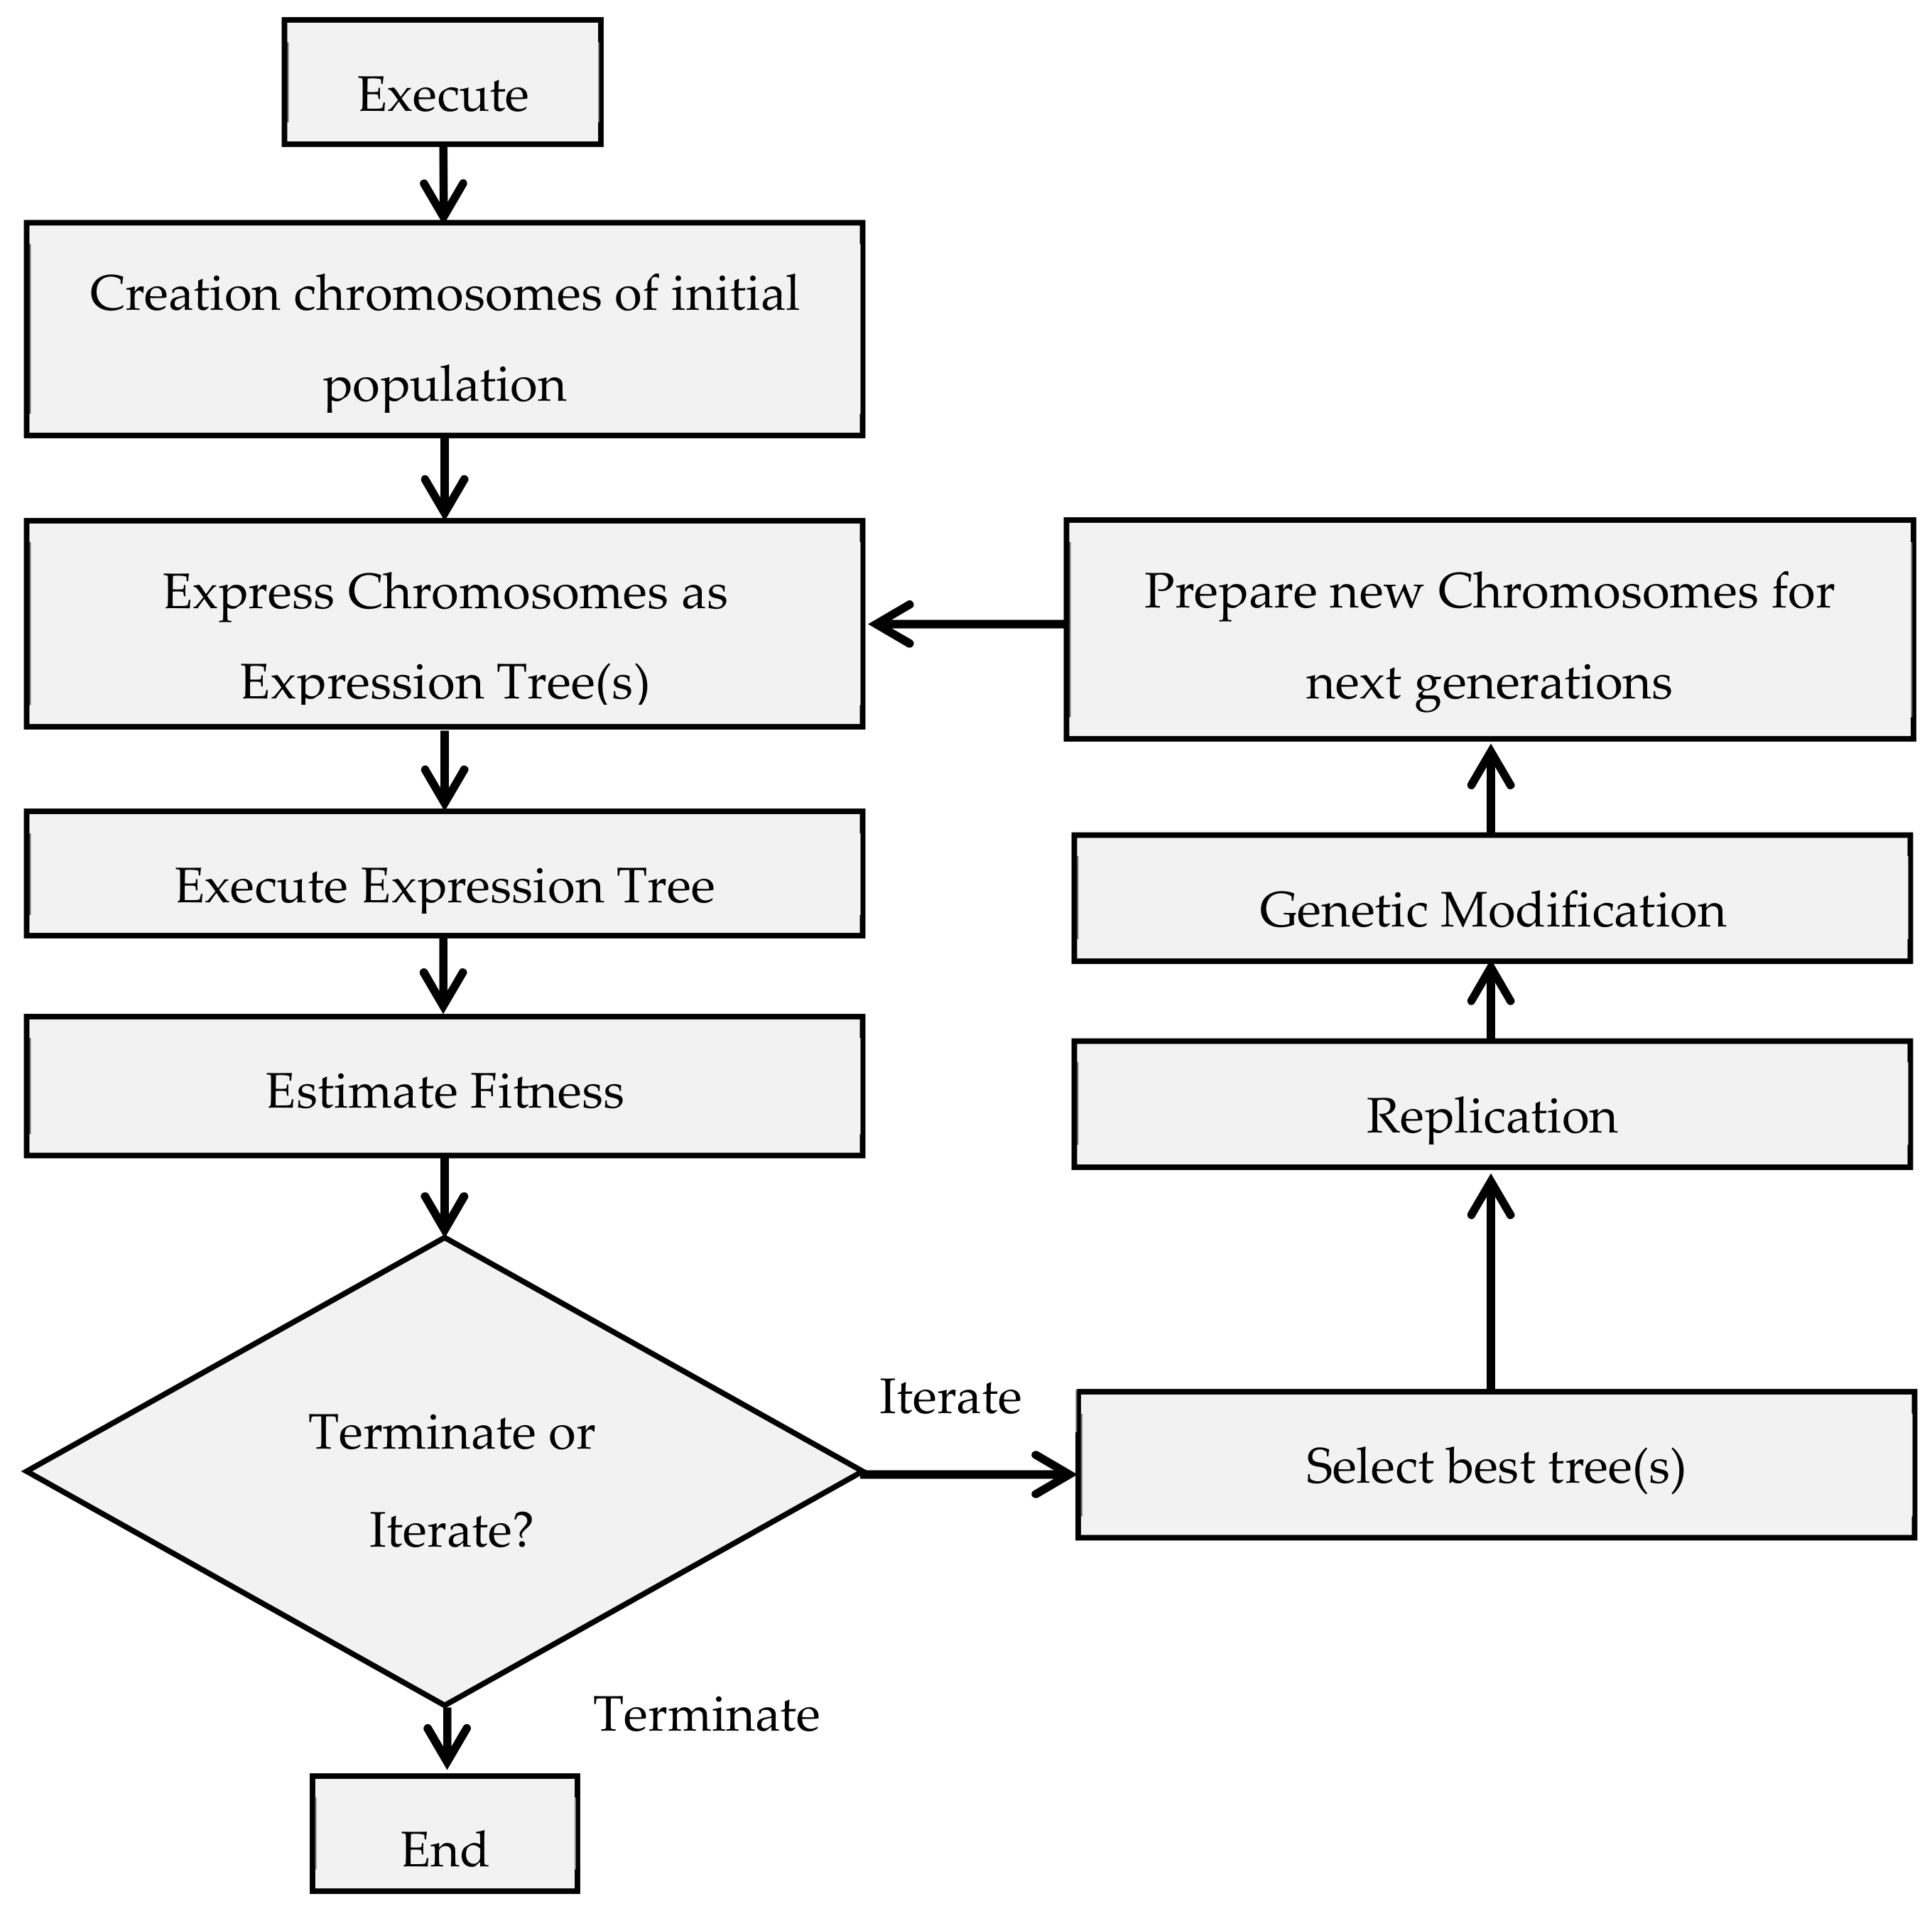
2.1. Genetic Algorithm and Gene Expression Programming (GEP)

The genetic algorithm (GA) was first introduced by J. Holland [35] which was inspired by Darwin’s theory of evolution. The biological evolution process is simply shown in the form of GAs and the solution is signified in fixed chromosome form. Similarly, Genetic programming (GP) was first proposed by Cramer [36] and further enhanced by Koza [37,38]. GP is basically an extension of GA, a type of machine learning that automatically generates models which are totally based on genetic evaluation. GP is an influential optimization technique based on neural and regression techniques. The computer-based program grows into a problem-independent solution based on the Darwinian reproduction principle.
The modified version of GP was proposed by Ferreira, C. [39] based on the population evolutionary algorithm and is named gene expression programming (GEP). A simple linear fixed array of chromosomes is encoded in GEP which outclasses the GP where a tree-like structure with variable length was used [40]. In the evolutionary GEP algorithm, the linear fixed length chromosomes and the nonlinear expression tree were inherited from GA and GP, respectively. GEP is an excellent method because of the linear fixed width of genetic programming as well as the genetic algorithm. Moreover, due to the genetic process on the chromosome level, GEP uses the simplest criteria and further permits the development of complex and nonlinear programs due to multi-genic behavior. The whole GEP comprised of five sets—Function set, terminal set, fitness measure set, parameters set and the criteria set—To terminate the functions. Each individual is set as a fixed-size linear string in GEP, which is called a genome. Furthermore, during the reproduction stage, the modification in the chromosomes takes place by genetic operators [41,42]. The schematic diagram of GEP algorithm is presented in Figure 1. Considering the formulations that fit the experimental outcomes, GEP itself adds or deletes various combinations of parameters [16].
In this paper, the GEP algorithm was applied with the help of GeneXproTools 5.0 [44]. Firstly, a chromosome of fixed length was randomly created for each individual. In the second step, the expression trees are created representing the chromosomes and the fitness of each expression tree is evaluated in terms of statistical indicators. And finally, the reproduction process is initiated for each individual assessed by a fitness function (which was RMSE for the developed model).

2.2. Multiple Linear and Non-Linear Regression

The multiple linear regression (MLR) model developed the relationship between many independent and dependent variables. The model expresses the value of a predicted variable as a linear function of one or more predictor variables. The basic assumption of MLR is that the association between Yi and the p vector of regression Xi is linear. In the multiple non-linear regression (MNLR) model, the relationship between the dependent and independent variable is considered to be non-linear. The MNLR technique estimates the model by creating a random nonlinear connection between dependent and independent variables. The fundamental difference in MNLR is that estimating the equation nonlinearly depends on input variables [45]. The following equations, Equation (1) and Equation (2), represent the MLR [46,47] and MNLR [48], respectively.
Y = a + β1X1 + β2X2 +⋅⋅⋅⋅⋅ + β𝑖X𝑖
Y = a + β1Xi + β2Xj + β3Xi2 + β4Xj2 + ⋅⋅⋅⋅⋅ + βkX𝑖Xj
Where a is the intercept, β is the slope or coefficient and k is the number of observations.
In this study, the MLR and MNLR models were developed using statistical analysis software called Statistical Package for Social Sciences (SPSS). It allows the user to perform a set of statistical analyses from basic to complex predictive functionalities. All the datasets were carefully analyzed before performing the linear and non-linear regression in SPSS.

2.3. Datasets

The dataset of SCBAC was collected from 21 published papers available in literature [14,49,50,51,52,53,54,55,56,57,58,59,60,61,62,63,64,65,66]. The final database form literature comprised of 65 data points. Each record of the collected data contained information about water/cement ratio (W/C), SCBA percentage replacement (SCBA%), fine aggregate in the mix (FA), cement content (CC), slump value (S), coarse aggregate in the mix (CA), water absorption (WA), specific gravity of the mix (SG) and compressive strength (fc). Numerous trials were performed to assess the consistency and validity of the data. The data points with up to 20% deviation from the global trend were not considered in the development and model performance evaluation [34]. The description of the collected data is shown in Table 1. The overall data from literature was used to develop and calibrate the GEP and regression models. For models validation, concrete specimens with varying dosages of SCBA were casted and then tested for compressive strength.

2.4. Model Development and Performance Evaluation

Prior to model development, the first and essential step is to choose the input parameters which can have an effect on the SCBAC properties. All the available parameters in the database were studied in detail and several preliminary runs were conducted in order to determine the most influential parameters for SCBAC to establish a generalized relationship. As a result, the compressive strength of SCBAC is considered to be a function of the following input parameters.
f c = f W C ,   S C B A % ,   F A ,   C C ,   C A
In order to assess the performance of the developed models, different indicators were used, such as Nash Sutcliff efficiency (NSE), correlation coefficient (R2) and Root Mean Squared Error (RMSE) [67,68]. These statistical indicators were used to check the model simulation with the actual data. The NSE ranges between - ∞ to 1, where 1 is a perfect match. An NSE value greater than 0.65 depicts a very good correlation [69,70]. The R2 value lies between 0 and 1 and the higher values indicate fewer errors, while value 1 represents completely matched data [70]. The RMSE is an error index type indicator commonly used in modelling studies. A lower value for RMSE is optimum. The mathematical expressions for RMSE, NSE and R2 are shown below as Equations (4)–(6), respectively.
R M S E = i = 1 n ( P i M i ) 2 N
N S E = 1 i = 1 n M i P i 2 i = 1 n M i M ¯ i 2
R 2 =   i = 1 n M i M ¯ i ( P i P ¯ i ) i = 1 n ( M i M ¯ i ) 2 i = 1 n ( P i P ¯ i ) 2
where n is the number of input samples; Mi and Pi are the measured and predicted values, respectively. M ¯ i and P ¯ i are the average of measured and predicted values, respectively.

2.5. Experimental Investigation

2.5.1. Mix Proportions and Specimen Designation

In order to validate the robustness of the developed GEP and regression models, fifteen concrete specimens were casted. Mixes were abbreviated as CM and BC. CM represents control mix without addition of ash; whereas BC represents cement replaced with bagasse ash. The specific designation 10BC indicates that 10 percent cement has been replaced with SCBA. Target design strength of 21 MPa was designed. SCBA was used to replace OPC in quantities of 0% 10%, 20%, 30% and 40% by weight of cement. Each mix had the same water to cementitious material ratio of 0.5 and overall cementitious contents of 366 Kg/m3 were kept constant. Furthermore, the X-ray Fluorescence (XRF) was conducted for chemical composition of sugarcane bagasse ash. Results of XRF are shown in Table 2. It can be seen that the sum of silica (SiO2), alumina (Al2O3) and Iron oxide (Fe2O3) is 77.47 % (>70%), which meets one of the requirements of pozzolan as per ASTM C618-05.
Mix proportions of the concrete mixes are shown in Table 3. Each mix was tested in fresh as well as in hardened state. The fresh concrete tests, i.e., slump test and fresh concrete density were determined as per ASTM C143 and ASTM C138M-01, respectively. At the curing age of 28 days, the compressive strength of the SCBAC and control concrete were determined according to BS 1881: Part 116: 1983 standard.

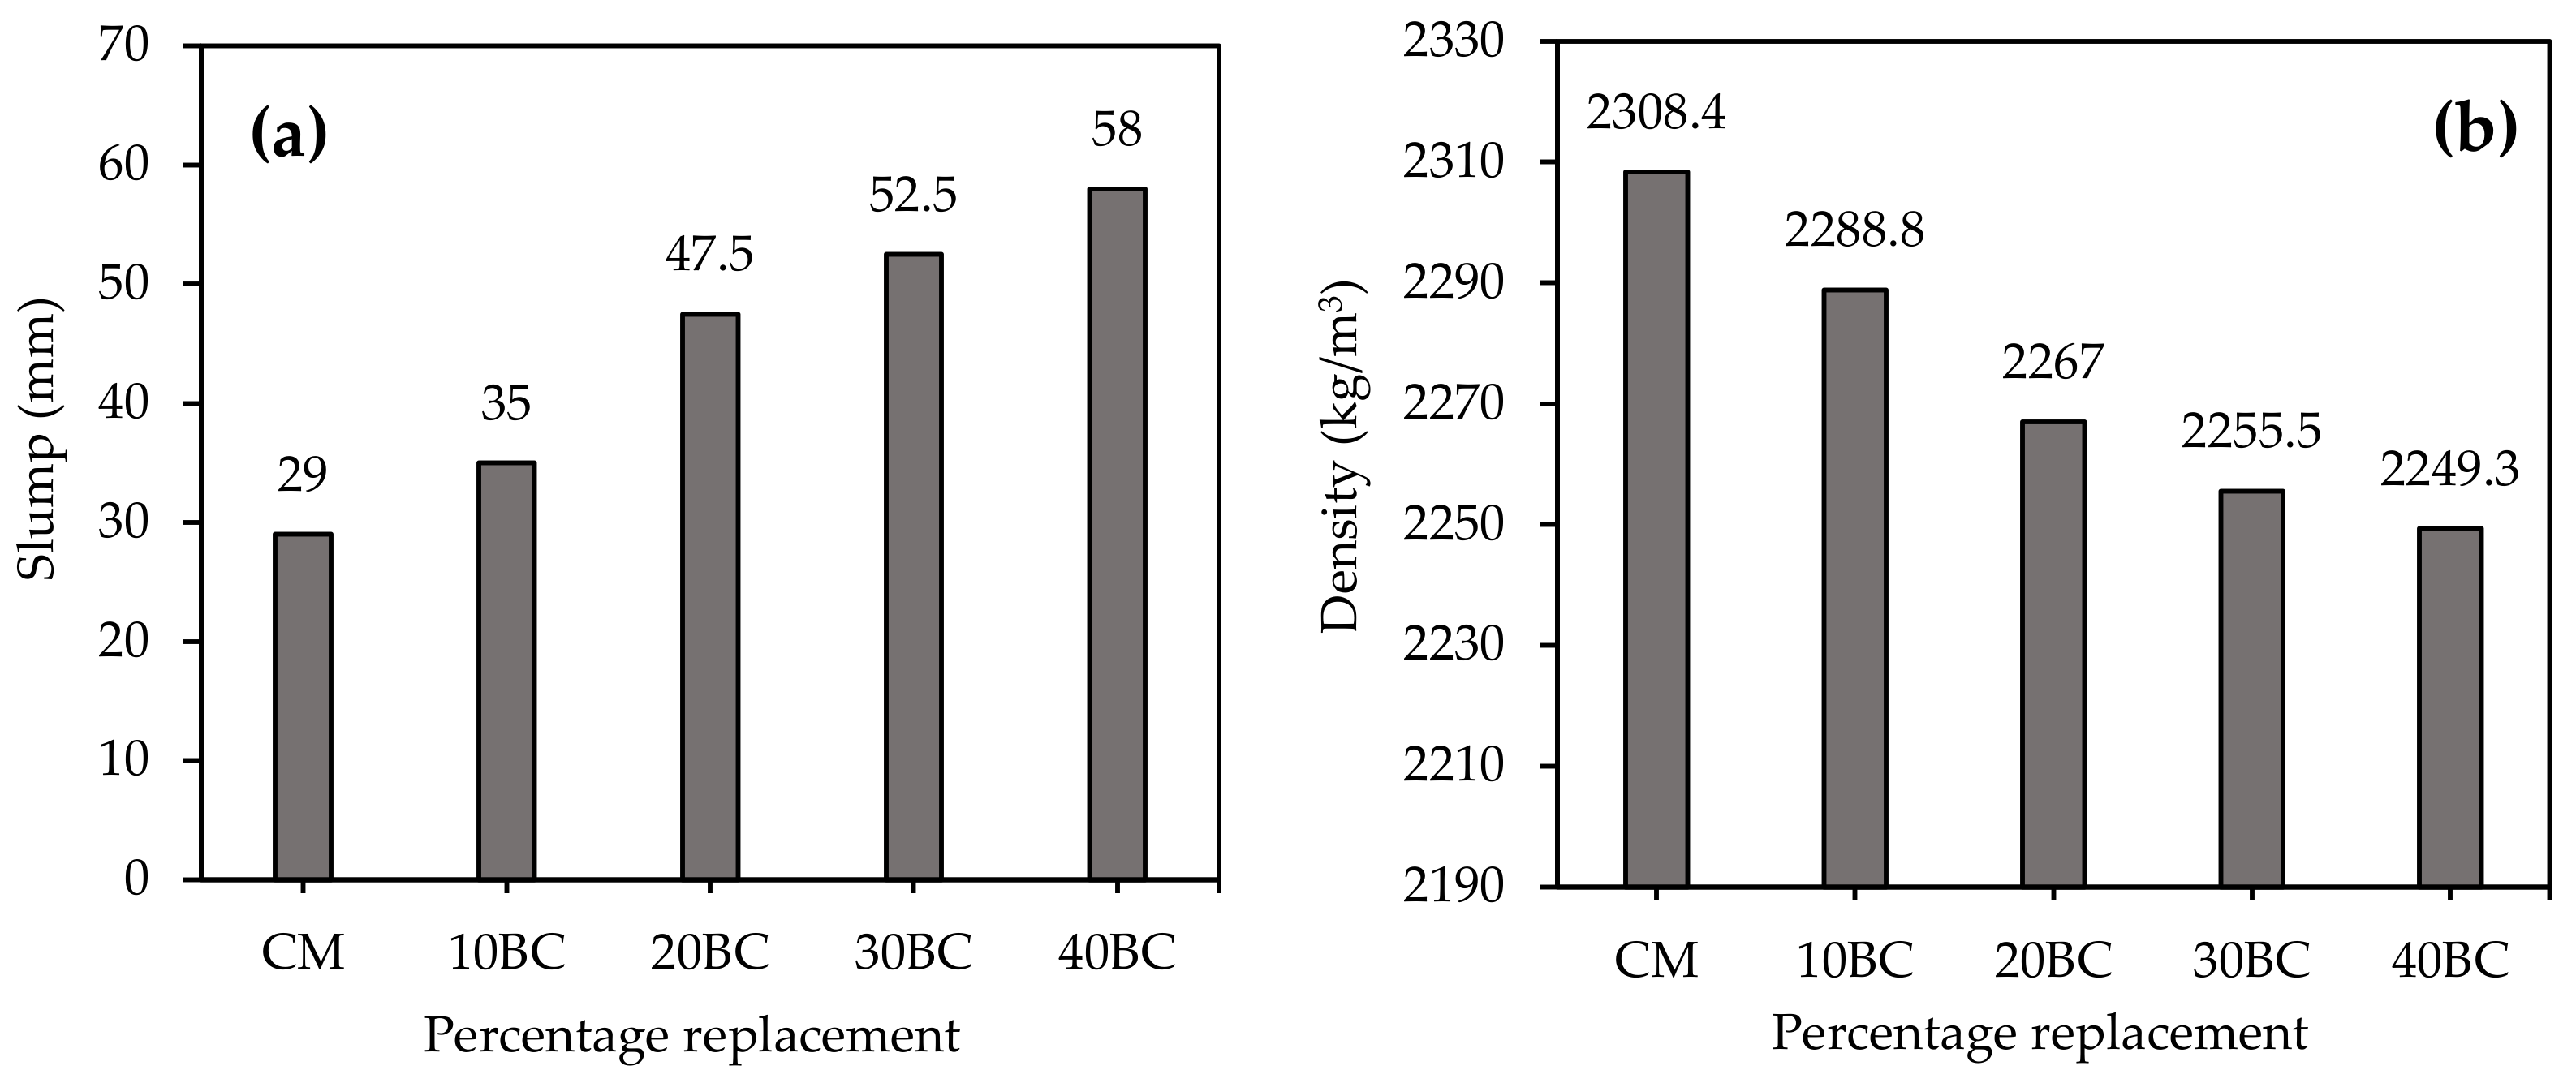
2.5.2. Fresh Concrete Properties

Slump and fresh concrete densities of the concrete mixes at different replacement levels of SCBA (0, 10, 20, 30 & 40%) are presented in Figure 2a,b, respectively. Result shows that with the addition of further ash, the consistency of concrete increases. The maximum and minimum slump values of 58mm and 29mm were found for 40BC and control mix, respectively. Similarly, the maximum fresh density achieved by the CM was 2308.4 Kg/m3. The fresh density decreased with the introduction of SCBA as cement replacement. In comparison to control concrete, the decrease in fresh concrete densities for 10BC, 20BC, 30BC and 40BC mixes was found to be 0.85%, 1.82%, 2.34% and 2.62%, respectively. The decrease in fresh density is due to the fact that the density is a function of specific gravity. Since the specific gravity of cement is more as compared to bagasse ash, therefore, the density of the CM mix is highest.

2.6. Sensitivity Analysis

The behavior of the developed models and its relationship with the input variables was measured using sensitivity analysis. It is a procedure to observe the most sensitive parameters as there are uncertainties related to model input values. The models can provide acceptable results during calibration and validation but it is not confirmed that they will also provide the same results on unknown data sets. Therefore, it is necessary to perform the sensitivity analysis to evaluate the relative contribution of each input parameter on model output. In the current study, the method developed by Gandomi et al. [71] was adopted. The authors used Equation (7) and Equation (8) to find out the contribution to output by each input variable.
N i = f m a x x i f m i n x i
S i = N i j = i n N j × 100
The f m a x x i and f m i n x i are the max and min of the estimated output over the ith output.

3. Results and Discussion

3.1. SCBAC Mixes Compressive Strength from Laboratory Tests

For GEP and regression models validation, concrete specimens were casted with different percentages of SCBA and tested for compressive strength at the curing age of 28 days. The results are tabulated in Table 4. The results show the SCBAC (10BC) has a higher strength than all of the mixes. The difference in strength between 10BC and CM is found to be 3.58%. The compressive strength consistently decreases with the addition of SCBA. This may be attributed to the fact that cement is the primary binding material. The cement replacement of 30% and 40% reduces the lime content required for pozzolanic reaction. The optimum replacement level of SCBA with cement is found to be 10%.

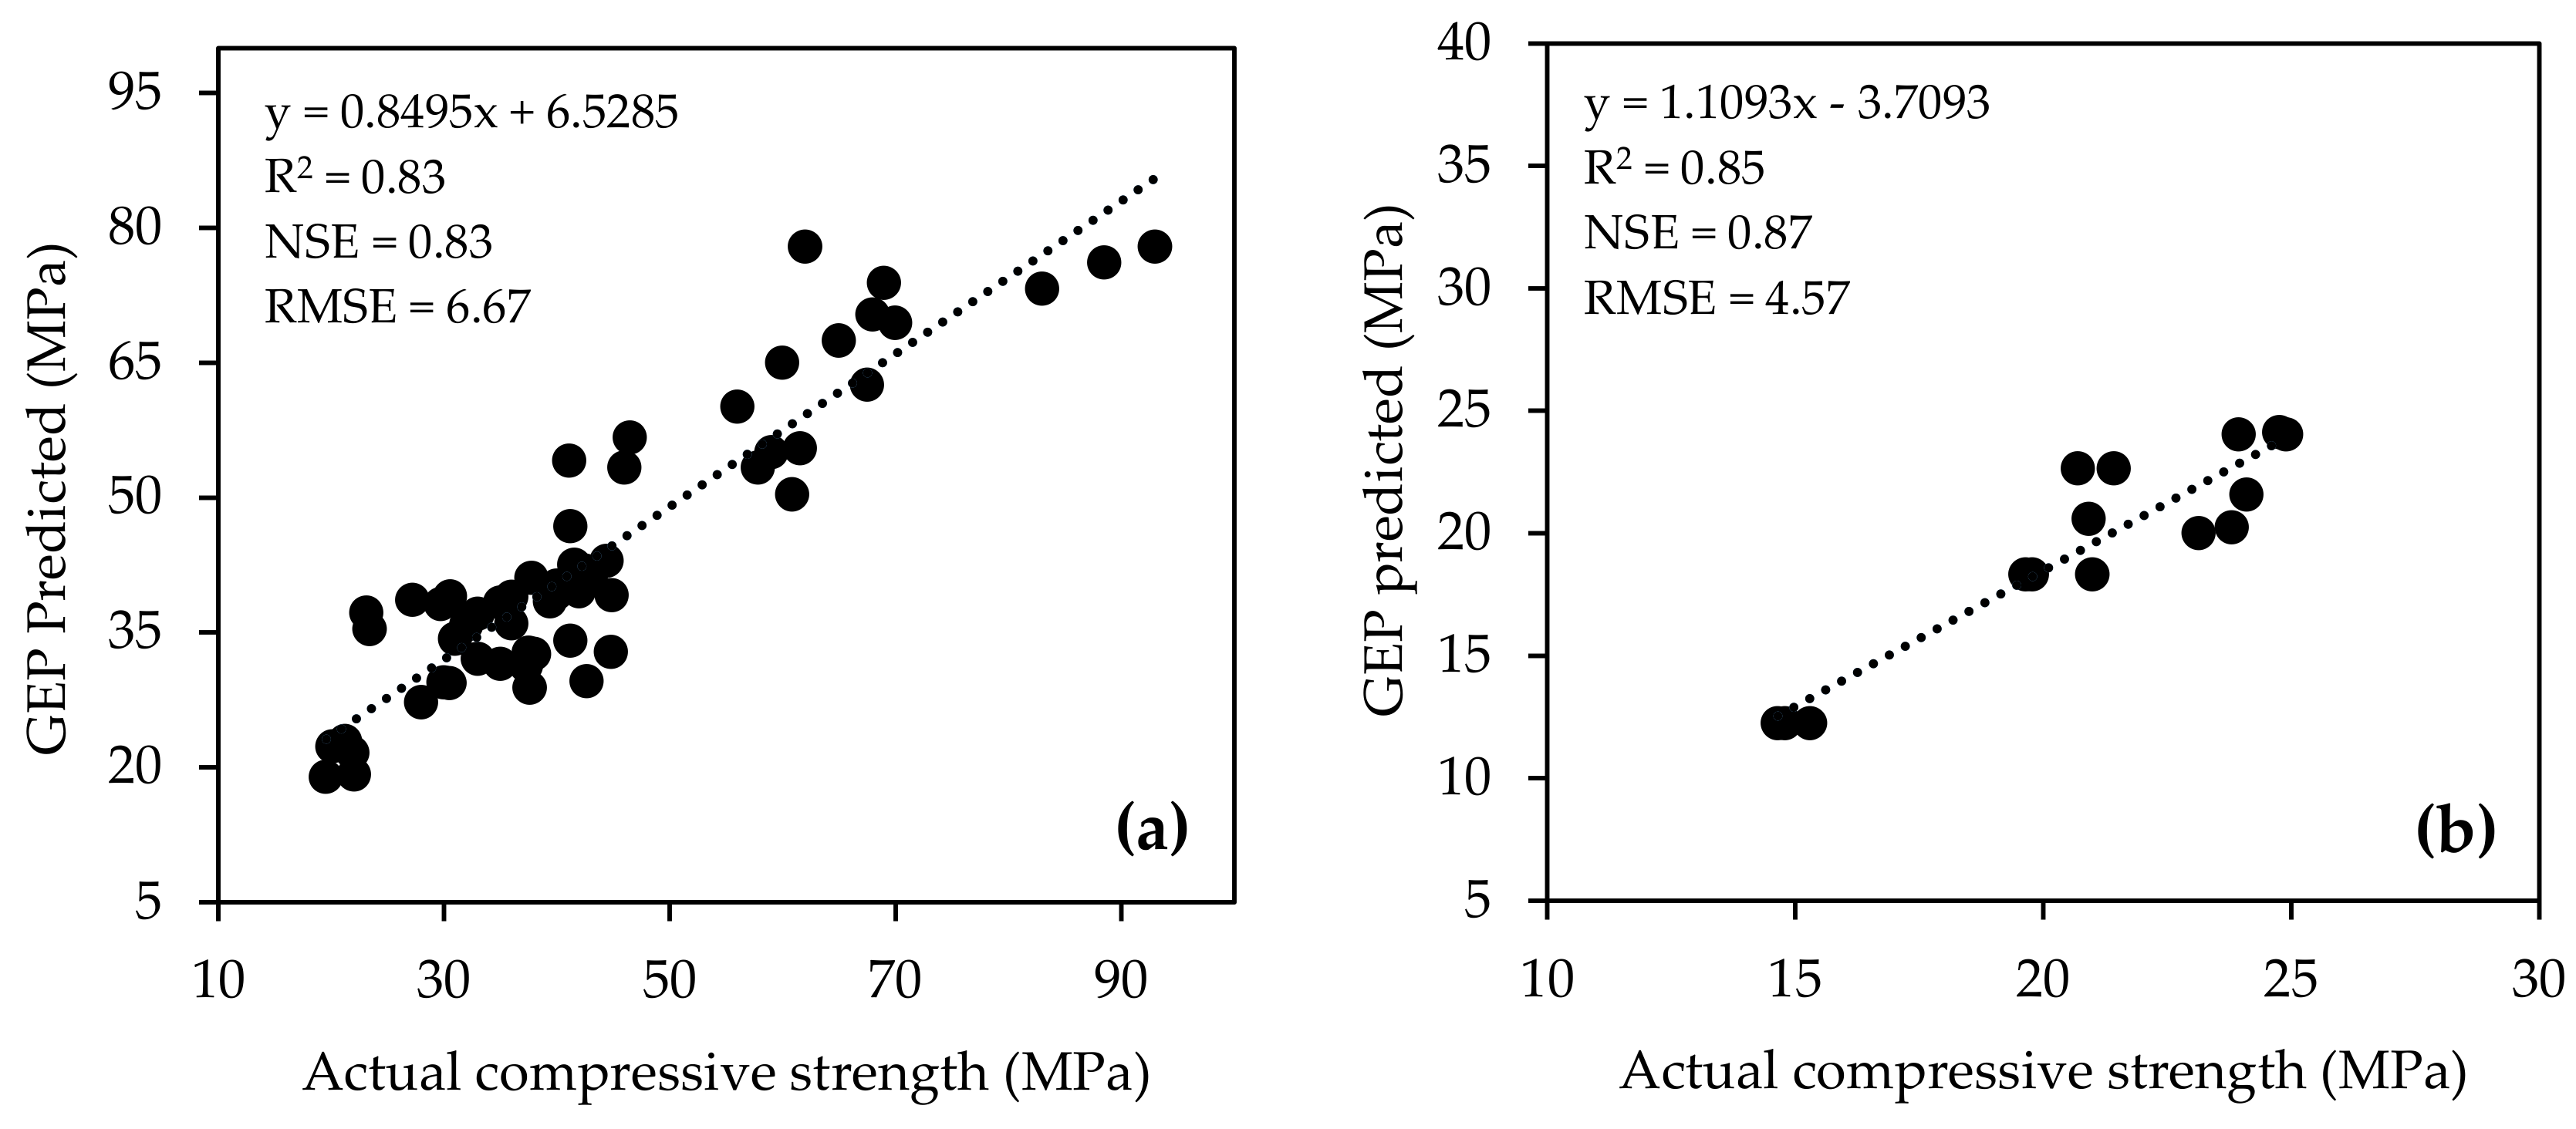
3.2. GEP Based Formulation for Compressive Strength of SCBAC Mixes

The model to formulate the compressive strength of SCBAC, Equation (9), is proposed to predict the 28th day compressive strength of SCBAC. The GEP model developed for compressive strength of SCBAC is shortlisted after running a set of GEP algorithms initiating from fundamental set function, small head size and a single gene chromosome. The important parameters involved for GEP setting are tabulated in Table 5. All the structural association of chromosomes and function sets were chosen before running the GEP algorithm. The capability of GEP is highly affected by parameters selection. Basic mathematical operators were used to assess the best and simplest model. Due to the number of potential outcomes and the complexity of estimating the test model, the three best populations of 50, 100 or 150 were considered.
f c = A D   × B   × C
where,
A =   S C B A % 31 2.6 W C
B = 0.014 × F A × S C B A % + C C C C + S C B A % + 110.6 C A
C = 0.27   C C 9.6 W C 25.38 0.005 F A + 11.16 C C F A
D =   W C 7.2 + 5
For GEP model simulation, five parameters, i.e., W/C, SCBA%, FA, CC, CA were used as an input. It is evident from Figure 3a,b that the developed GEP model effectively considered the influence of all the input parameters for both model calibration and validation. The statistical indicators, i.e., NSE, R2 and RMSE, are 0.83, 0.83, 6.67 during model calibration and 0.87, 0.85, and 4.57 for model validation, respectively. An R2 value of more than 0.8 is adequate [31]. Moreover, lower values of RMSE and higher values of R2 and NSE show that the developed models adequately simulated the results [40].

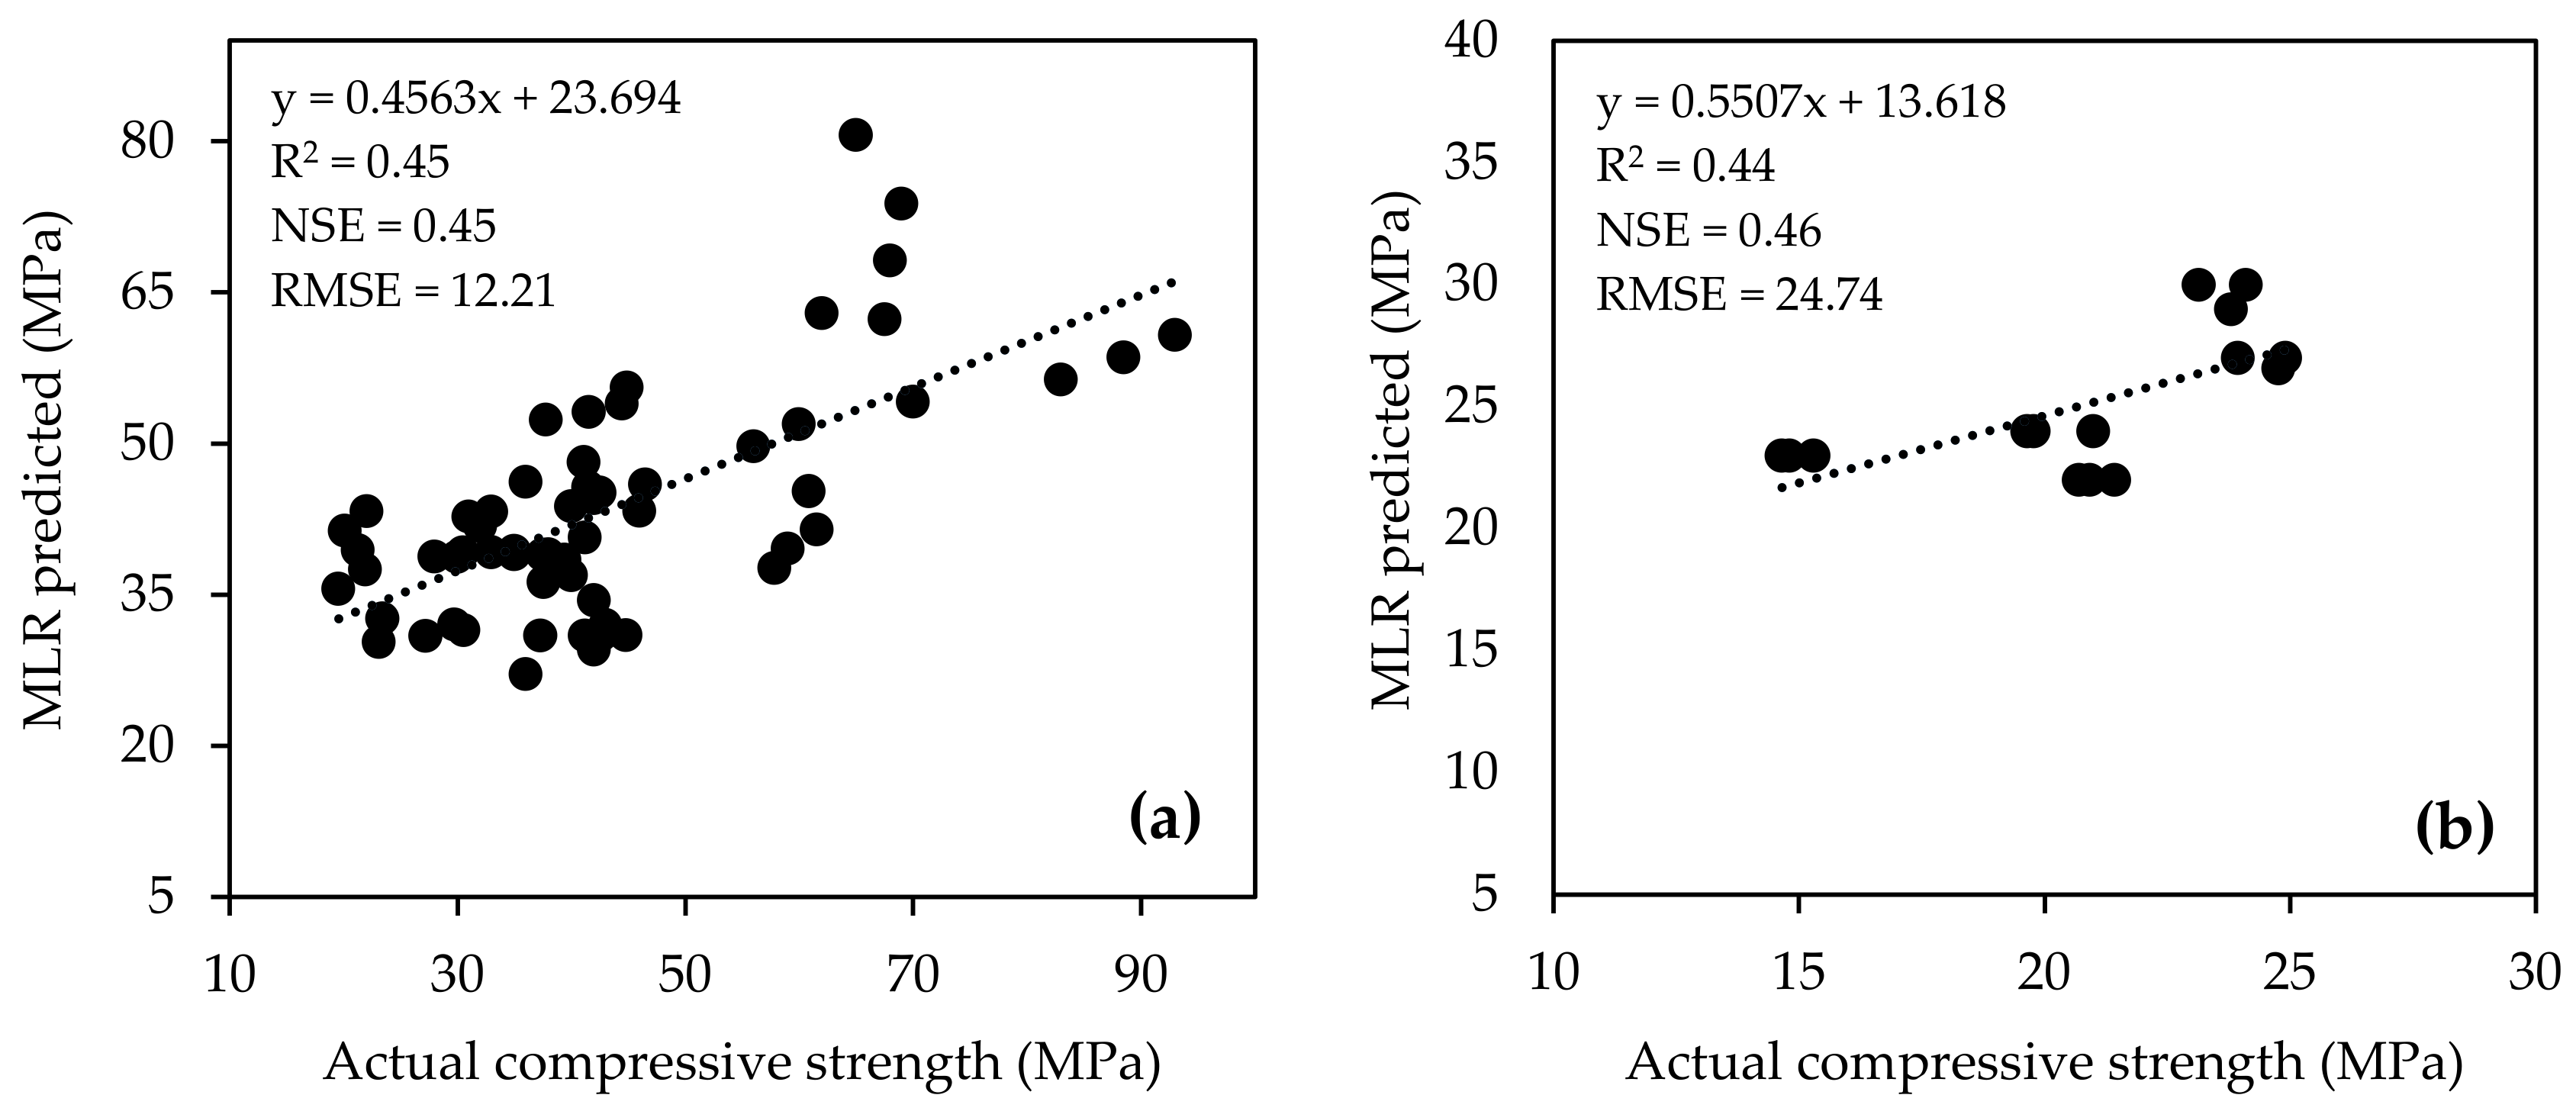
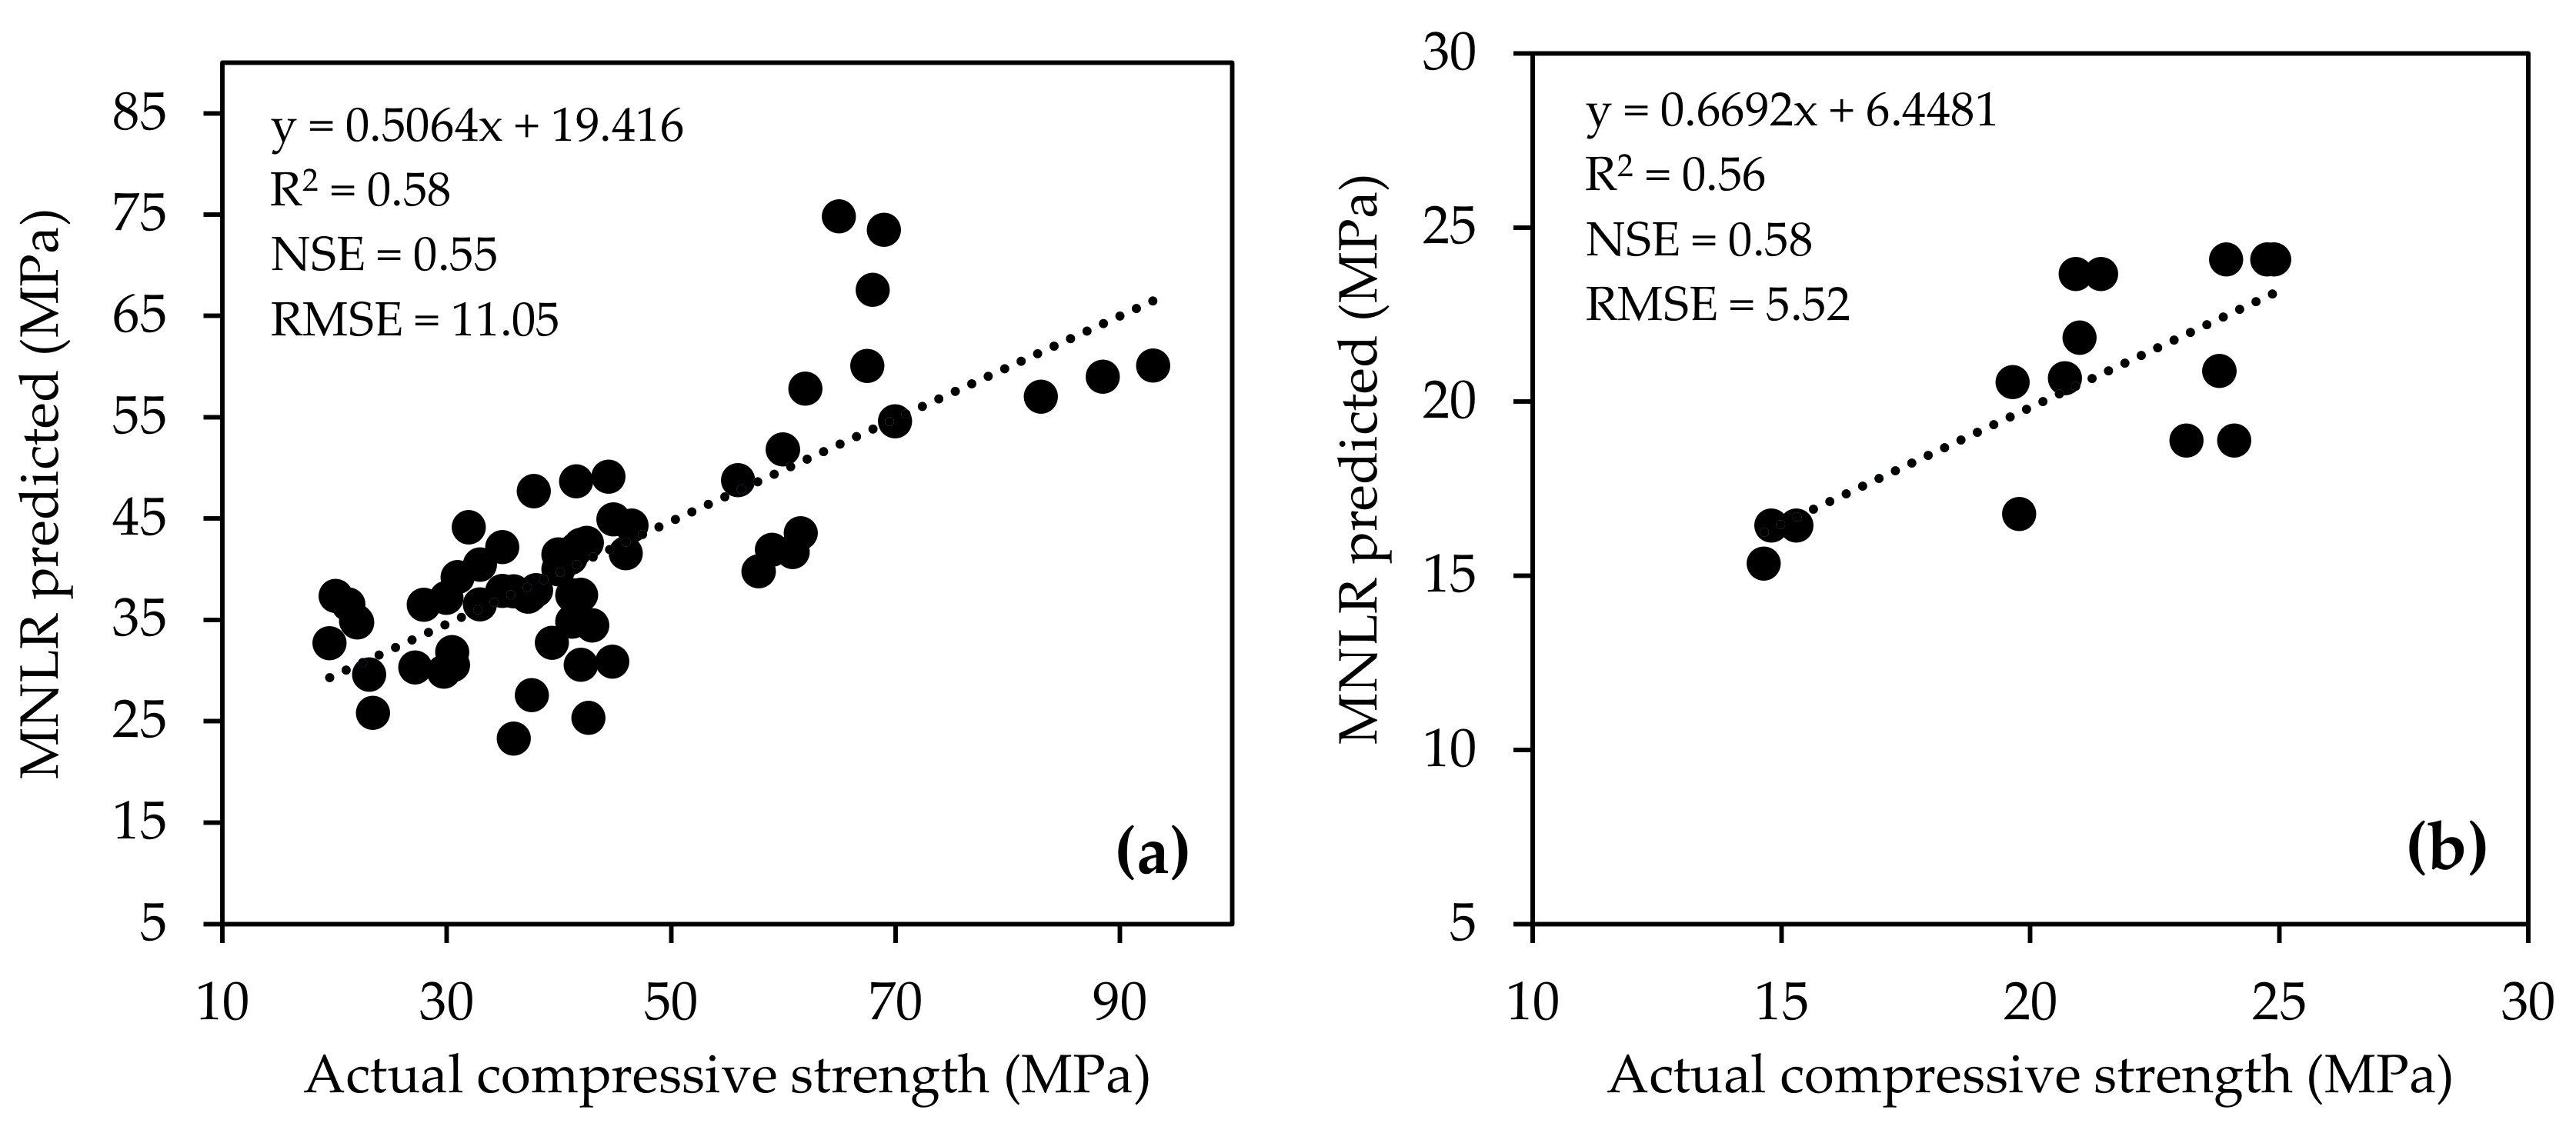
3.3. MLR and MNLR Based Formulation for Compressive Strength of SCBAC Mixes

Figure 4a,b graphically demonstrates the MLR-simulated compressive strength of SCBAC mixes during model calibration and validation, respectively. The statistical indicators show a strong relationship between actual and predicted data. During MLR model calibration, the NSE, R2 and RMSE, are 0.45, 0.45 and 12.21, respectively. Similarly, the values of NSE, R2 and RMSE are 0.46, 0.44, and 24.74, respectively, for the validation period. It is obvious from the results that performance of the MLR during calibration is better than model validation. This could be considered as one of the limitations of MLR.
The MNLR model simulation results for SCBAC compressive strength are shown in Figure 5a,b for calibration and validation, respectively. The NSE, R2 and RMSE are found to be 0.55, 0.58 and 11.05, respectively, for calibration and 0.58, 0.56 and 5.52 for validation of the MNLR model. The absolute error between actual and predicted data for all the models is shown in Figure 6.

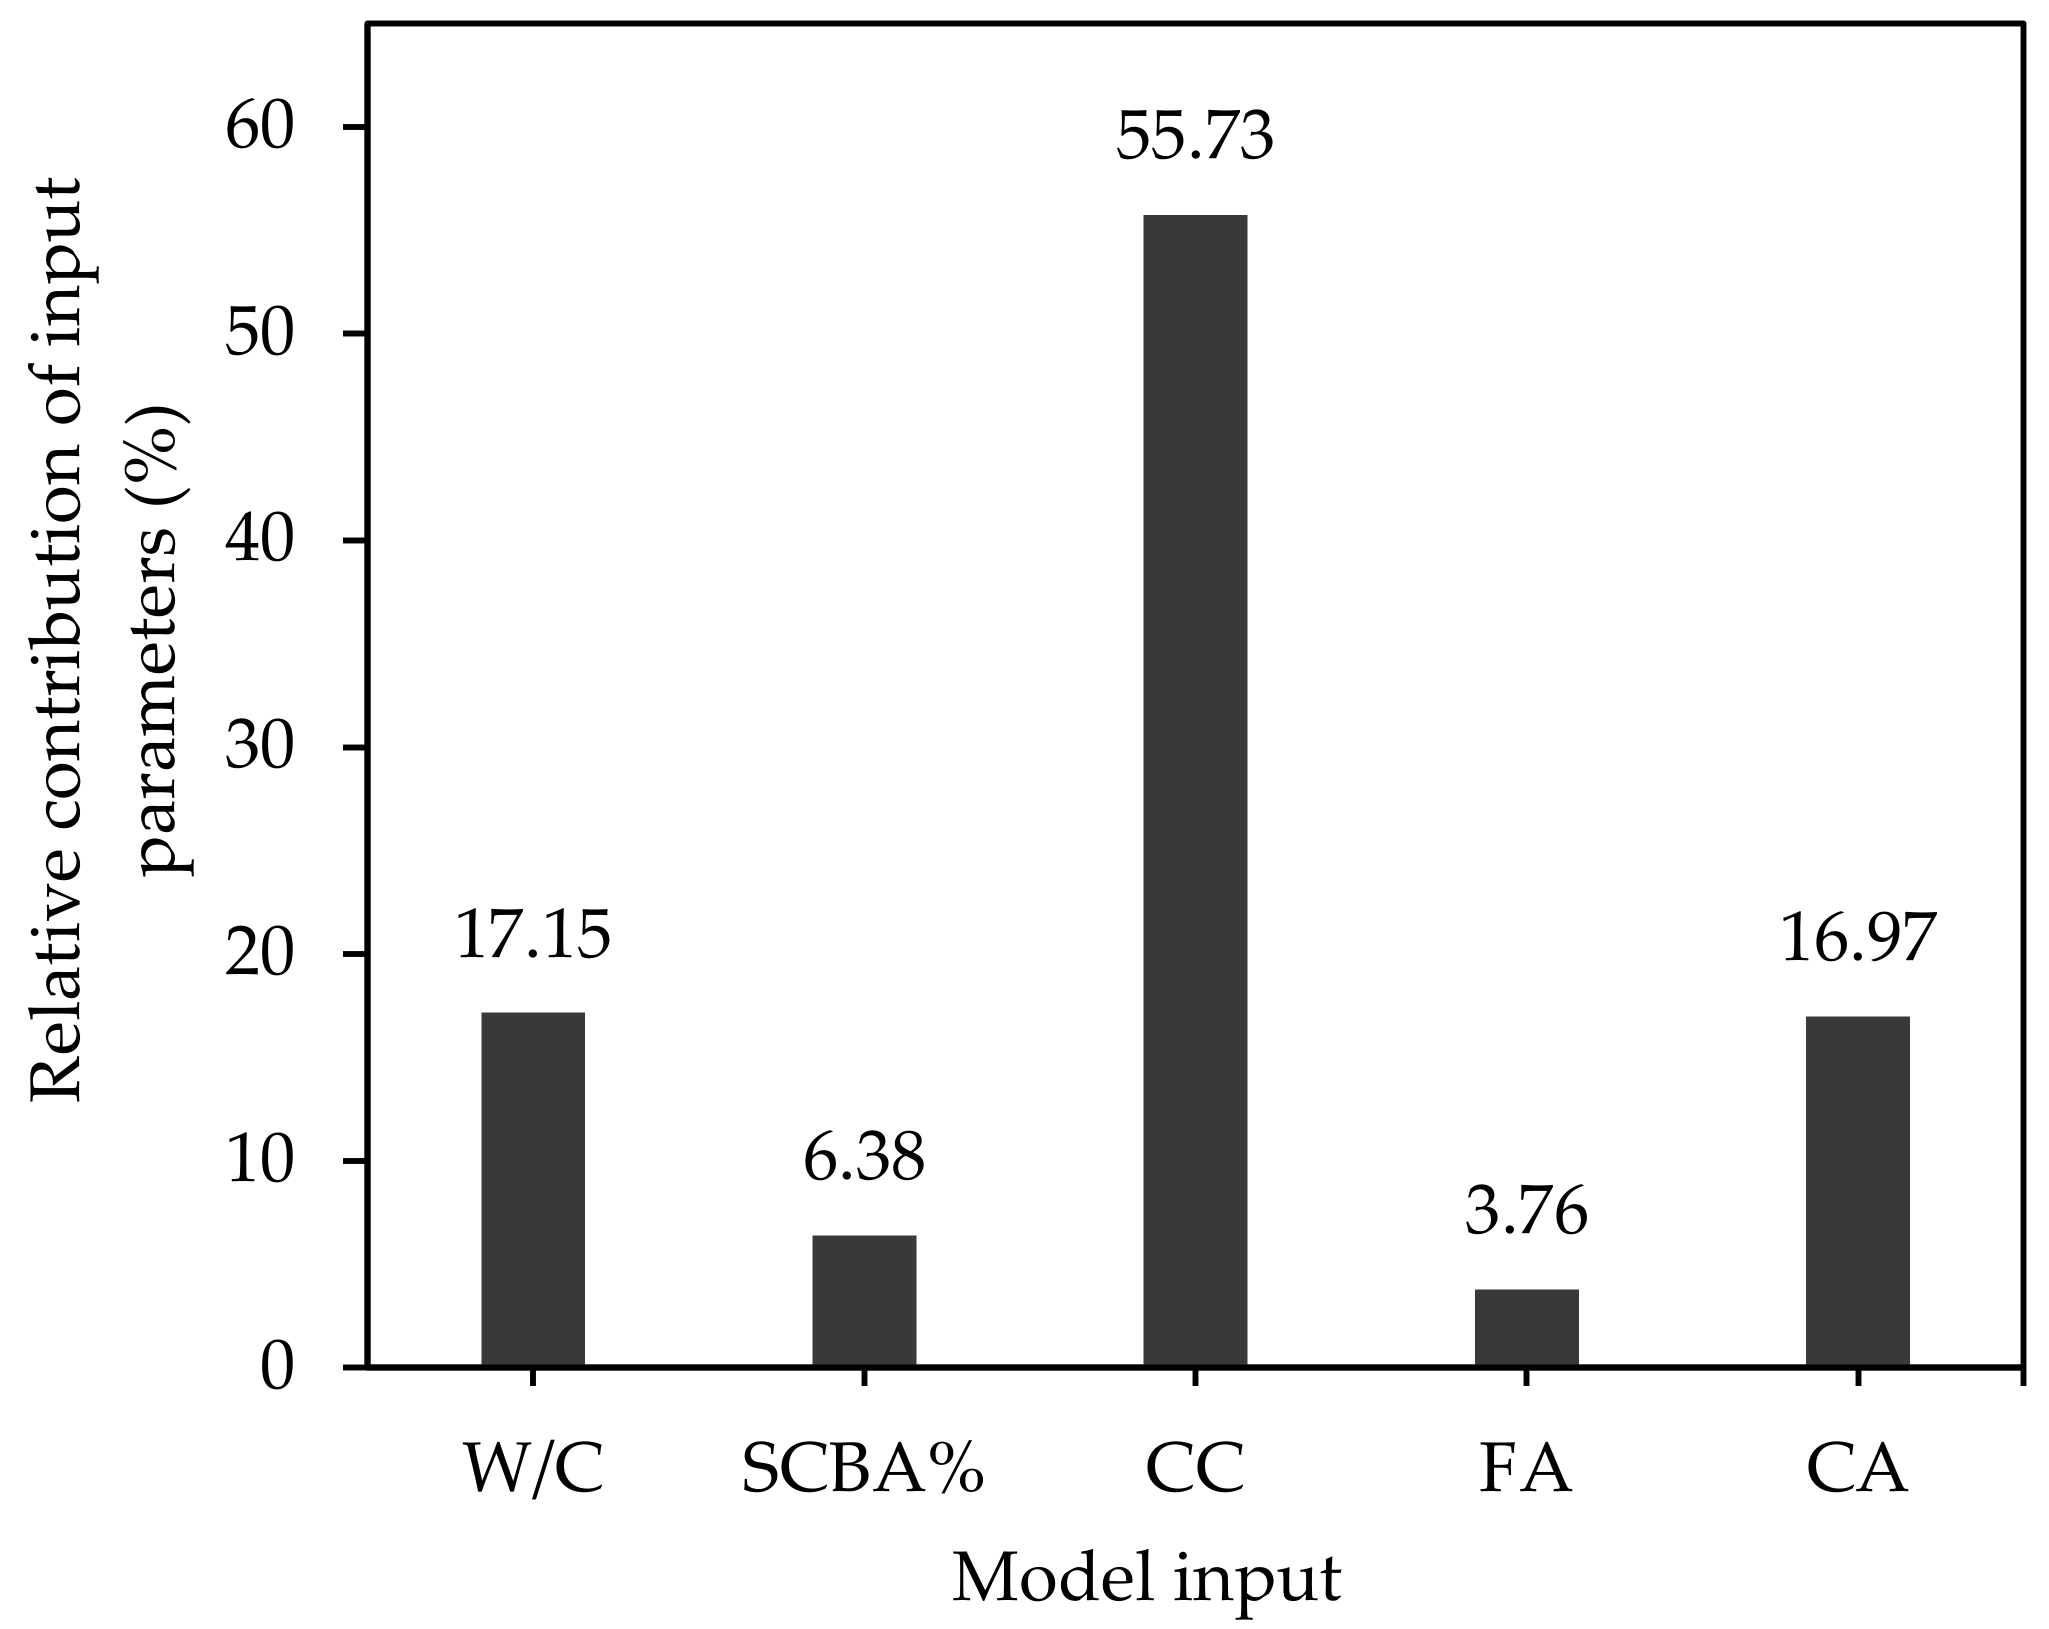
3.4. Sensitivity Analysis

The contribution of the most relevant parameters (W/C, SCBA%, CC, FA, and CA) in the model was evaluated through sensitivity analysis. Various sensitive parameters were identified that are essential for modelling the compressive strength of SCBAC. The results are graphically shown in Figure 7. The results revealed that the cement content (CC) in the mix is the most sensitive parameter for SCBAC compressive strength with a relative contribution of 55.73%. The same results were observed during experimental testing of SCBAC where the strength of the concrete decreased consistently with the addition of SCBA up to 40% (reduction in cement content). So it is obvious that the model results are much in line with experimental results which further enhances the robustness of the developed model. The second and third most sensitive parameters for compressive strength of SCBAC turned out to be W/C with 17.14% and the CA aggregate content in the mix with 16.98% relative contribution to compressive strength. Furthermore, the compressive strength is least affected by FA content in the mix.

3.5. External Validation of the Models

Various researchers have suggested that the performance of the proposed model considerably depends on the ratio of data points to the number of inputs [72,73]. In order to check the suitability of data points for attaining the connection between selected variables, the ratio should be more than 5 for the ideal model [73]. In the current study, the suggested ratio is 13 which fulfill the criteria set by researchers. Furthermore, other criteria for external verification of the models proposed by Golbraikh and Tropsha [74] suggested that the slope of the regression line should be approximately near to 1. Roy and Roy [75] introduced a new indicator (Rm) for external predictability of the proposed models and suggested the Rm value of more than 0.5 for a satisfied model. Alavi et al. [76] suggested that the squared correlation coefficients Ro2 and Ro2 between the observed and predicted values should be near to 1. In this paper, the performances of the developed models were evaluated by the above mentioned criteria and the results are summarized in Table 6. The novel GEP model strongly fulfills all the aforementioned criteria.

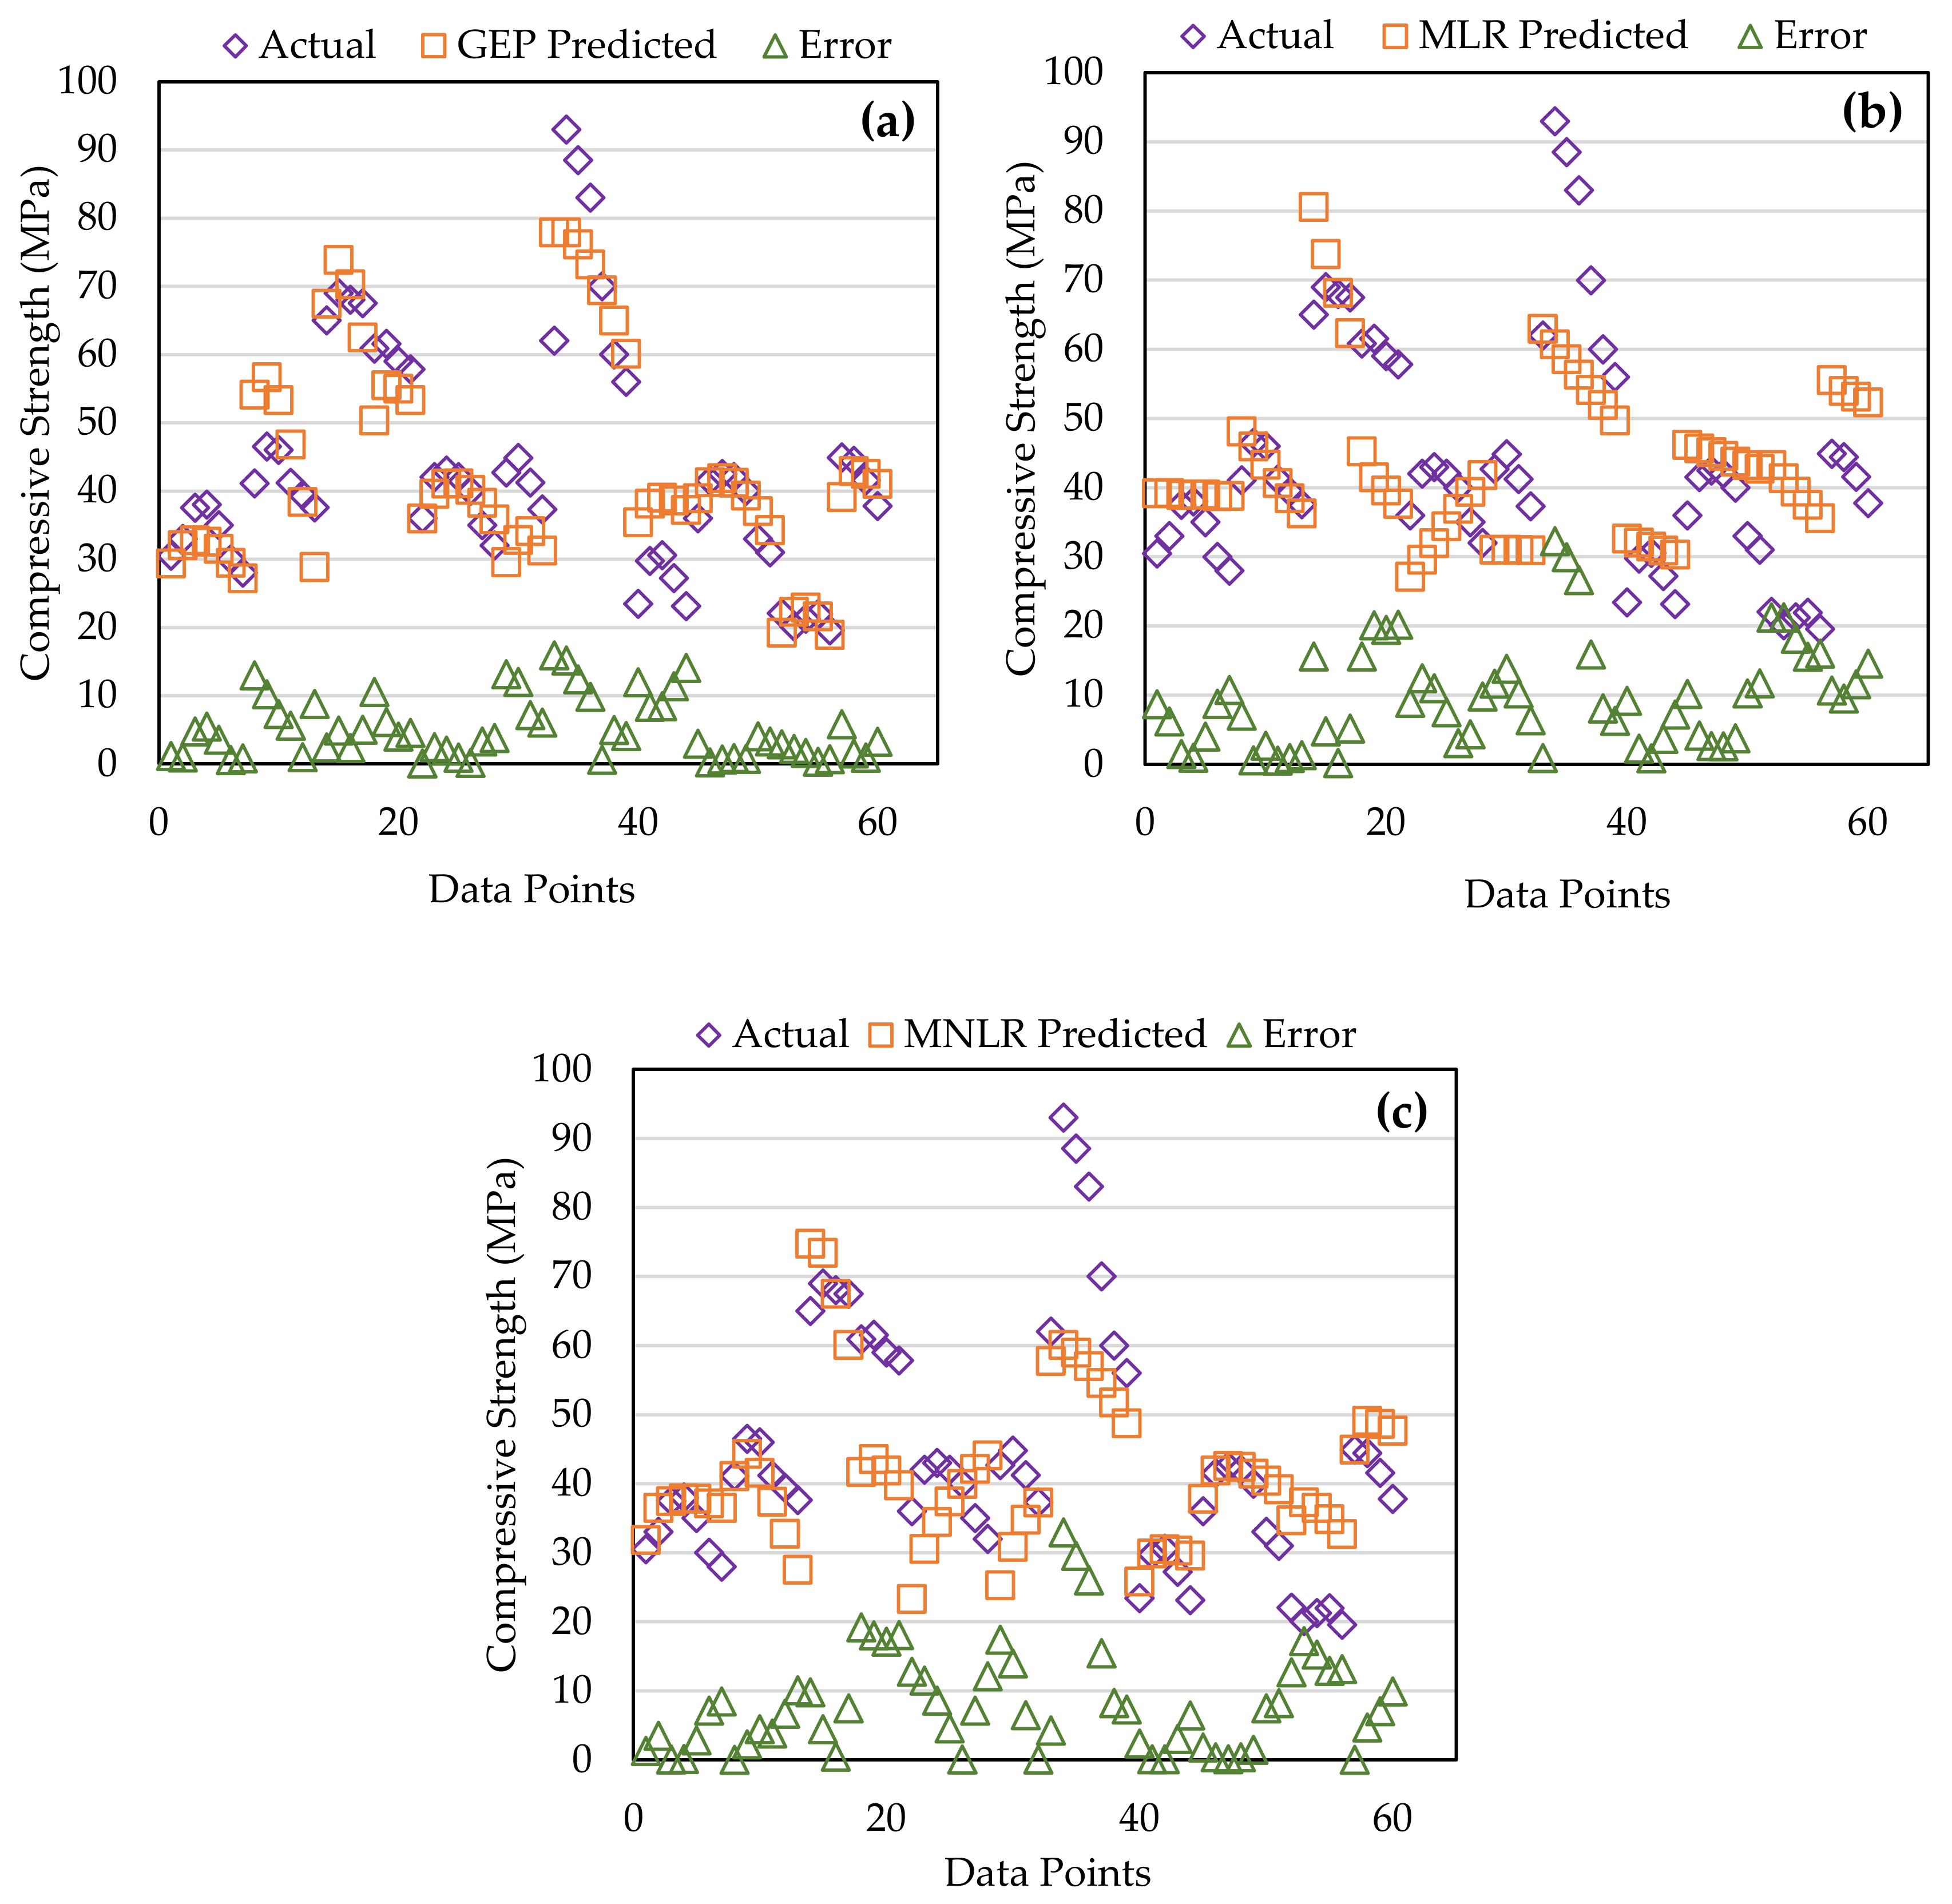
3.6. Comparison of GEP, MLR and MNLR Models

To the authors’ best knowledge, no detailed study was conducted that considered the regression as well as novel GEP technique to predict the compressive strength of SCBAC and also to validate the model results by laboratory concrete testing. Therefore, GEP, MLR and MNLR models were developed to predict the compressive strength of SCBAC and the results are compared. The NSE and R2 values are highest for GEP followed by MNLR. Similarly, the RMSE is lowest for the GEP model during both calibration and validation. Summarizing the results and performance of all the models, the GEP outclassed all other models during calibration and validation. Moreover, the GEP-developed equation can easily be used to predict the compressive strength of SCBAC. The performance of both MLR and MNLR reduced (in terms of statistical indicators) during validation. This may be considered as one of the shortcomings of the regression-based models. The average errors between actual and predicted data are shown in Figure 6 and were found to be 0.79%, 2.12% and 4.52% for GEP, MLR and MNLR models, respectively.

4. Conclusions

The present study reported the applications of the novel gene expression programming and regression methods, i.e., multiple linear and non-linear regression for modeling and predicting the compressive strength of sugarcane bagasse ash concrete. A new method was proposed where the already available data from literature study was used to develop and calibrate the proposed models. To validate the models, laboratory specimens of concrete with different dosages of bagasse ash were casted and simultaneously the test results were used for validation. Regardless of the large number of factors responsible for variation in the compressive strength, the developed models were successfully calibrated and validated. The goodness of fit for the models was estimated in terms of NSE, R2 and RMSE. A good correlation was observed in both the calibration and validation period between actual and predicted values. However, it was observed that gene expression programming outperformed all the other techniques and is capable of forecasting the compressive strength of sugarcane bagasse ash concrete for a known set of input parameters. The empirical equation developed by gene expression programming could be used frequently to estimate the compressive strength. Gene expression programming played a major role in evaluating the suitable relations required for the qualitative depiction of the processes responsible for compressive strength. This technique does not assume any prior solution and establishes a suitable relation between dependent and independent variables, thus making the techniques superior to others. The performance of the multiple linear and non-linear regression models reduced during model validation and may be considered as one of the drawbacks of the regression based models. The novel gene expression programming applied in this study could serve as a baseline to model and predict the mechanical properties of concrete with high accuracy and the minimum number of parameters.

Author Contributions

Conceptualization, data analysis, review and editing, M.F.J.; Formal analysis and visualization, M.N.A.; conceptualization, data collection, writing original draft preparation, M.I.S.; Investigation and review, K.K.; Methodology and write up, B.I.; visualization and manuscript revision, F.F.; validation check and supervision, F.A.; Writing—Review & editing, R.A.; funding acquisition and supervision, H.A. All authors have read and agreed to the published version of the manuscript.

Funding

This research project was supported by the deanship of scientific research at prince sattam bin Abdulaziz University under the research project number 2020/01/16810.

Acknowledgments

The authors acknowledge the support of lab staff for providing access to materials lab and helped in casting and testing concrete specimens.

Conflicts of Interest

The authors declare no conflict of interest.

References

  1. Gholampour, A.A.; Gandomi, A.H.; Ozbakkaloglu, T. New formulations for mechanical properties of recycled aggregate concrete using gene expression programming. Constr. Build. Mater. 2017, 130, 122–145. [Google Scholar] [CrossRef]
  2. Batayneh, M.; Marie, I.; Asi, I. Use of selected waste materials in concrete mixes. Waste Manag. 2007, 27, 1870–1876. [Google Scholar] [CrossRef] [PubMed]
  3. Li, H.; Deng, Q.; Xia, B.; Zhang, J.; Skitmore, M. Assessing the life cycle CO2 emissions of reinforced concrete structures: Four cases from China. J. Clean. Prod. 2019, 210, 1496–1506. [Google Scholar] [CrossRef]
  4. Mao, L.-X.; Hu, Z.; Xia, J.; Feng, G.-L.; Azim, I.; Yang, J.; Liu, Q.-F. Multi-phase modelling of electrochemical rehabilitation for ASR and chloride affected concrete composites. Compos. Struct. 2019, 207, 176–189. [Google Scholar] [CrossRef]
  5. He, Z.; Zhu, X.; Wang, J.; Mu, M.; Wang, Y. Comparison of CO2 emissions from OPC and recycled cement production. Constr. Build. Mater. 2019, 211, 965–973. [Google Scholar] [CrossRef]
  6. Obla, K.H. What is green concrete? Indian Concr. J. 2009, 24, 26–28. [Google Scholar]
  7. Pan, S.-Y.; Fan, C.; Lin, Y.-P. Development and Deployment of Green Technologies for Sustainable Environment. Environments 2019, 6, 114. [Google Scholar] [CrossRef] [Green Version]
  8. Sagotra, A.K.; Errandonea, D.; Cazorla, C. Mechanocaloric effects in superionic thin films from atomistic simulations. Nat. Commun. 2017, 8, 1–7. [Google Scholar] [CrossRef] [Green Version]
  9. Shafiei, M.W.M.; Abadi, H. The Importance of Green Technologies and Energy Efficiency for Environmental Protection. Int. J. Appl. Environ. Sci. 2017, 12, 937–951. [Google Scholar]
  10. Chen, L.; Wang, L.; Cho, D.-W.; Tsang, D.C.W.; Tong, L.; Zhou, Y.; Yang, J.; Hu, Q.; Poon, C.S. Sustainable stabilization/solidification of municipal solid waste incinerator fly ash by incorporation of green materials. J. Clean. Prod. 2019, 222, 335–343. [Google Scholar] [CrossRef]
  11. Wang, L.; Chen, L.; Cho, D.-W.; Tsang, D.C.W.; Yang, J.; Hou, D.; Baek, K.; Kua, H.W.; Poon, C.-S. Novel synergy of Si-rich minerals and reactive MgO for stabilisation/solidification of contaminated sediment. J. Hazard. Mater. 2019, 365, 695–706. [Google Scholar] [CrossRef] [PubMed]
  12. Du, H.; Tan, K.H. Properties of high volume glass powder concrete. Cem. Concr. Compos. 2017, 75, 22–29. [Google Scholar] [CrossRef]
  13. Tan, K.H.; Du, H. Use of waste glass as sand in mortar: Part I–Fresh, mechanical and durability properties. Cem. Concr. Compos. 2013, 35, 109–117. [Google Scholar] [CrossRef]
  14. Bahurudeen, A.; Kanraj, D.; Dev, V.G.; Santhanam, M. Performance evaluation of sugarcane bagasse ash blended cement in concrete. Cem. Concr. Compos. 2015, 59, 77–88. [Google Scholar] [CrossRef]
  15. Yehia, S.; Abdelfatah, A.; Mansour, D. Effect of Aggregate Type and Specimen Configuration on Concrete Compressive Strength. Crystals 2020, 10, 625. [Google Scholar] [CrossRef]
  16. Abdollahzadeh, G.; Jahani, E.; Kashir, Z. Genetic Programming Based Formulation to Predict Compressive Strength of High Strength Concrete. Civ. Eng. Infrastruct. J. 2017, 50, 207–219. [Google Scholar]
  17. Hwang, R.; Lee, I.W.; Pyo, S.; Kim, D.J. Influence of the Aggregate Surface Conditions on the Strength of Quick-Converting Track Concrete. Crystals 2020, 10, 543. [Google Scholar] [CrossRef]
  18. Marcalikova, Z.; Cajka, R.; Bilek, V.; Bujdos, D.; Sucharda, O. Determination of Mechanical Characteristics for Fiber-Reinforced Concrete with Straight and Hooked Fibers. Crystals 2020, 10, 545. [Google Scholar] [CrossRef]
  19. Sarıdemir, M.; Billir, T. Modeling of elastic modulus of concrete containing fly ash by gene expression programming. In Proceedings of the Fourth International Conference on Sustainable Construction Materials and Technologies, Las Vegas, NV, USA, 7–11 August 2016. [Google Scholar]
  20. Kliszczewicz, A.; Ajdukiewicz, A. Differences in instantaneous deformability of HS/HPC according to the kind of coarse aggregate. Cem. Concr. Compos. 2002, 24, 263–267. [Google Scholar] [CrossRef]
  21. Zhang, J.; Zhao, Y.; Li, H. Experimental Investigation and Prediction of Compressive Strength of Ultra-High Performance Concrete Containing Supplementary Cementitious Materials. Adv. Mater. Sci. Eng. 2017, 2017, 4563164. [Google Scholar] [CrossRef] [Green Version]
  22. Mousavi, S.M.; Aminian, P.; Gandomi, A.H.; Alavi, A.H.; Bolandi, H. A new predictive model for compressive strength of HPC using gene expression programming. Adv. Eng. Softw. 2012, 45, 105–114. [Google Scholar] [CrossRef]
  23. Domone, P.; Soutsos, M. Approach to the proportioning of high-strength concrete mixes. Concr. Int. 1994, 16, 26–31. [Google Scholar]
  24. Yeh, I.C. Modeling of strength of high-performance concrete using artificial neural networks. Cem. Concr. Res. 1998, 28, 1797–1808. [Google Scholar] [CrossRef]
  25. Gandomi, A.H.; Alavi, A.H.; Arjmandi, P.; Aghaeifar, A.; Seyednour, R. Genetic programming and orthogonal least squares: A hybrid approach to modeling the compressive strength of CFRP-confined concrete cylinders. J. Mech. Mater. Struct. 2010, 5, 735–753. [Google Scholar] [CrossRef]
  26. Mousavi, S.M.; Gandomi, A.H.; Alavi, A.H.; Vesalimahmood, M. Modeling of compressive strength of HPC mixes using a combined algorithm of genetic programming and orthogonal least squares. Struct. Eng. Mech. 2010, 36, 225–241. [Google Scholar] [CrossRef]
  27. Jepsen, M.T. Predicting concrete durability by using artificial neural network. In Proceedings of the Durability of Exposed Concrete Containing Secondary Cementitious Materials, Hirtshals, Denmark, 20 November 2002. Special NCR-Publication. [Google Scholar]
  28. Yeh, I.C. Modeling slump flow of concrete using second-order regressions and artificial neural networks. Cem. Concr. Compos. 2007, 29, 474–480. [Google Scholar] [CrossRef]
  29. Basma, A.A.; Barakat, S.A.; Al-Oraimi, S. Prediction of cement degree of hydration using artificial neural networks. ACI Mater. J. 1999, 96, 167–172. [Google Scholar]
  30. Ji, T.; Lin, T.; Lin, X. A concrete mix proportion design algorithm based on artificial neural networks. Cem. Concr. Res. 2006, 36, 1399–1408. [Google Scholar] [CrossRef]
  31. Gandomi, A.H.; Alavi, A.H.; Mirzahosseini, M.R.; Nejad, F.M. Nonlinear genetic-based models for prediction of flow number of asphalt mixtures. J. Mater. Civ. Eng. 2011, 23, 248–263. [Google Scholar] [CrossRef]
  32. Mahdinia, S.; Eskandari-Naddaf, H.; Shadnia, R. Effect of cement strength class on the prediction of compressive strength of cement mortar using GEP method. Constr. Build. Mater. 2019, 198, 27–41. [Google Scholar] [CrossRef]
  33. Azimi-Pour, M.; Eskandari-Naddaf, H. ANN and GEP prediction for simultaneous effect of nano and micro silica on the compressive and flexural strength of cement mortar. Constr. Build. Mater. 2018, 189, 978–992. [Google Scholar] [CrossRef]
  34. Iqbal, M.F.; Liu, Q.F.; Azim, I.; Zhu, X.; Yang, J.; Javed, M.F.; Rauf, M. Prediction of mechanical properties of green concrete incorporating waste foundry sand based on gene expression programming. J. Hazard. Mater. 2020, 384, 121322. [Google Scholar] [CrossRef] [PubMed]
  35. Holland, J. Adaptation in Natural and Artificial Systems; University of Michigan Press: Ann Arbor, MI, USA, 1975. [Google Scholar]
  36. Cramer, N.L. A representation for the adaptive generation of simple sequential programs. In Proceedings of the First International Conference on Genetic Algorithms, Pittsburg, PA, USA, 24–25 July 1985. [Google Scholar]
  37. Koza, J.R. Genetic Programming II: Automatic Discovery of Reusable Subprograms; MIT Press: Cambridge, MA, USA, 1994; Volume 13, p. 32. [Google Scholar]
  38. Koza, J.R. Genetic programming as a means for programming computers by natural selection. Stat. Comput. 1994, 4, 87–112. [Google Scholar] [CrossRef]
  39. Ferreira, C. Gene expression programming: A new adaptive algorithm for solving problems. arXiv 2001, arXiv:cs/0102027. [Google Scholar]
  40. Azim, I.; Yang, J.; Javed, M.F.; Iqbal, M.F.; Mahmood, Z.; Wang, F.; Liu, Q.F. Prediction model for compressive arch action capacity of RC frame structures under column removal scenario using gene expression programming. Structures 2020, 25, 212–228. [Google Scholar] [CrossRef]
  41. Lopes, H.S.; Weinert, W.R. A gene expression programming system for time series modeling. In Proceedings of the XXV Iberian Latin American Congress on Computational Methods in Engineering, Recife, Brazil, 10–12 November 2004. [Google Scholar]
  42. Ferreira, C. Gene expression programming in problem solving. In Soft Computing and Industry; Springer: Berlin/Heidelberg, Germany, 2002; pp. 635–653. [Google Scholar]
  43. Ferreira, C. Gene Expression Programming: Mathematical Modelling by an Artificial Intelligence, 2nd ed.; Springer: Berlin/Heidelberg, Germany, 2006; 480p. [Google Scholar]
  44. GeneXopro Tools 5.0; GEPSOFT Limited: Bristol, UK, 2013.
  45. Simões, A.; Costa, E. Prediction in evolutionary algorithms for dynamic environments using markov chains and nonlinear regression. In Proceedings of the 11th Annual Conference on Genetic and Evolutionary Computation, Montreal, QC, Canada, 8–12 July 2009. [Google Scholar]
  46. Pedhazur, E.J. Multiple Regression in Behavioral Research: Prediction and Explanation, 2nd ed.; Holt, Rinehart, & Winston: New York, NY, USA, 1982; 822p. [Google Scholar]
  47. Montgomery, D.C.; Peck, E.A.; Vining, G.G. Introduction to Linear Regression Analysis, 5th ed.; Wiley: New York, NY, USA, 2012. [Google Scholar]
  48. Ivakhnenko, A. Heuristic self-organization in problems of automatic control. Automatica 1970, 3, 207–219. [Google Scholar] [CrossRef]
  49. Srinivasan, R.; Sathiya, K. Experimental study on bagasse ash in concrete. Int. J. Serv. Learn Eng. Humanit. Eng. Soc. Entrep. 2010, 5, 60–66. [Google Scholar] [CrossRef] [Green Version]
  50. Patel, J.A.; Raijiwala, D. Experimental study on use of sugar cane bagasse ash in concrete by partially replacement with cement. Int. J. Innov. Res. Sci. Eng. Technol. 2015, 4, 2228–2232. [Google Scholar]
  51. Neeraja, D.; Jagan, S.; Kumar, S.; Mohan, P.G. Experimental Study on Strength Properties of Concrete by Partial Replacement of Cement with Sugarcane Bagasse Ash. Nat. Environ. Poll. Technol. 2014, 13, 629. [Google Scholar]
  52. Ganesan, K.; Rajagopal, K.; Thangavel, K. Evaluation of bagasse ash as supplementary cementitious material. Cem. Concr. Compos. 2007, 29, 515–524. [Google Scholar] [CrossRef]
  53. Subramani, T.; Prabhakaran, M. Experimental study on bagasse ash in concrete. Int. J. Innov. Eng. Res. Manag. 2015, 4, 163–172. [Google Scholar]
  54. Rerkpiboon, A.; Tangchirapat, W.; Jaturapitakkul, C. Strength, chloride resistance, and expansion of concretes containing ground bagasse ash. Constr. Build. Mater. 2015, 101, 983–989. [Google Scholar] [CrossRef]
  55. Rukzon, S.; Chindaprasirt, P. Utilization of bagasse ash in high-strength concrete. Mater. Des. 2012, 34, 45–50. [Google Scholar] [CrossRef]
  56. Cordeiro, G.C.; Toledo Filho, R.D.; Tavares, L.M.; Fairbairn, E.D.M.R. Ultrafine grinding of sugar cane bagasse ash for application as pozzolanic admixture in concrete. Cem. Concr. Res. 2009, 39, 110–115. [Google Scholar] [CrossRef]
  57. Kumar, T.S.; Balaji, K.; Rajasekhar, K. Assessment of Sorptivity and Water Absorption of Concrete with Partial Replacement of Cement by Sugarcane Bagasse Ash (SCBA) and Silica Fume. Int. J. Appl. Eng. Res. 2016, 11, 5747–5752. [Google Scholar]
  58. Amin, N.U. Use of bagasse ash in concrete and its impact on the strength and chloride resistivity. J. Mater. Civ. Eng. 2011, 23, 717–720. [Google Scholar] [CrossRef]
  59. Hailu, B.; Dinku, A. Application of sugarcane bagasse ash as a partial cement replacement material. Zede J. 2012, 29, 1–12. [Google Scholar]
  60. Mangi, S.A.; Jamaluddin, N.; Ibrahim, M.W.; Abdullah, A.H.; Awal, A.S.M.A.; Sohu, S.; Ali, N. Utilization of sugarcane bagasse ash in concrete as partial replacement of cement. IOP Conf. Ser. Mater. Sci. Eng. 2017, 271, 1–8. [Google Scholar] [CrossRef]
  61. Dhengare, S.W.; Raut, S.P.; Bandwal, N.V.; Khangan, A. Investigation into utilization of sugarcane bagasse ash as supplementary cementitious material in concrete. Int. J. 2015, 3, 109. [Google Scholar]
  62. Hussein, A.A.E.; Shafiq, N.; Nuruddin, M.F.; Memon, F.A. Compressive strength and microstructure of sugar cane bagasse ash concrete. Res. J. Appl. Sci. Eng. Technol. 2014, 7, 2569–2577. [Google Scholar] [CrossRef]
  63. Reddy, M.V.S.; Ashalatha, K.; Madhuri, M.; Sumalatha, P. Utilization of sugarcane bagasse ash (SCBA) in concrete by partial replacement of cement. J. Mech. Civ. Eng. 2015, 12, 12–16. [Google Scholar]
  64. Ganesan, K.; Rajagopal, K.; Thangavel, K. Evaluation of bagasse ash as corrosion resisting admixture for carbon steel in concrete. Anti-Corros. Methods Mater. 2007, 54, 230–236. [Google Scholar] [CrossRef]
  65. Yashwanth, M.K.; Avinash, G.B.; Raghavendra, A.; Kumar, B.G.N. An experimental study on alternative cementitious materials: Bagasse ash as partial replacement for cement in structural lightweight concrete. Indian Concr. J. 2017, 91, 51–58. [Google Scholar]
  66. Jagadesh, P.; Ramachandramurthy, A.; Murugesan, R. Evaluation of mechanical properties of Sugar Cane Bagasse Ash concrete. Constr. Build. Mater. 2018, 176, 608–617. [Google Scholar] [CrossRef]
  67. Ghorbani, M.A.; Khatibi, R.; Hosseini, B.; Bilgili, M. Relative importance of parameters affecting wind speed prediction using artificial neural networks. Theor. Appl. Climatol. 2013, 114, 107–114. [Google Scholar] [CrossRef]
  68. Montaseri, M.; Ghavidel, S.Z.Z.; Sanikhani, H. Water quality variations in different climates of Iran: Toward modeling total dissolved solid using soft computing techniques. Stoch. Environ. Res. Risk Assess. 2018, 32, 2253–2273. [Google Scholar] [CrossRef]
  69. Mandeville, A.N.; O’connell, P.E.; Sutcliffe, J.V.; Nash, J.E. River flow forecasting through conceptual models part III-The Ray catchment at Grendon Underwood. J. Hydrol. 1970, 11, 109–128. [Google Scholar] [CrossRef]
  70. Moriasi, D.N.; Arnold, J.G.; van Liew, M.W.; Bingner, R.L.; Harmel, R.D.; Veith, T.L. Model evaluation guidelines for systematic quantification of accuracy in watershed simulations. Trans. ASABE 2007, 50, 885–900. [Google Scholar] [CrossRef]
  71. Gandomi, A.H.; Yun, G.J.; Alavi, A.H. An evolutionary approach for modeling of shear strength of RC deep beams. Mater. Struct. 2013, 46, 2109–2119. [Google Scholar] [CrossRef]
  72. Gandomi, A.H.; Roke, D.A. Assessment of artificial neural network and genetic programming as predictive tools. Adv. Eng. Softw. 2015, 88, 63–72. [Google Scholar] [CrossRef]
  73. Frank, I.E.; Todeschini, R. The Data Analysis Handbook; Elsevier: Amsterdam, The Netherlands, 1994. [Google Scholar]
  74. Golbraikh, A.; Tropsha, A. Beware of q2! J. Mol. Graph. Model. 2002, 20, 269–276. [Google Scholar] [CrossRef]
  75. Roy, P.P.; Roy, K. On some aspects of variable selection for partial least squares regression models. QSAR Comb. Sci. 2008, 27, 302–313. [Google Scholar] [CrossRef]
  76. Alavi, A.H.; Ameri, M.; Gandomi, A.H.; Mirzahosseini, M.R. Formulation of flow number of asphalt mixes using a hybrid computational method. Constr. Build. Mater. 2011, 25, 1338–1355. [Google Scholar] [CrossRef]
Figure 1. Schematic diagram of the Gene Expression Programming (GEP) algorithm [43].
Crystals 10 00737 g001
Figure 2. Comparison of different concrete mixes for (a) slump density and (b) fresh concrete density.
Crystals 10 00737 g002
Figure 3. Comparison of actual and GEP predicted compressive strength during (a) calibration (b) validation.
Crystals 10 00737 g003
Figure 4. Comparison of actual and Multiple Linear Regression (MLR) predicted compressive strength during (a) calibration (b) validation.
Crystals 10 00737 g004
Figure 5. Comparison of actual and Multiple Non-Linear Regression (MNLR) predicted compressive strength during (a) calibration (b) validation.
Crystals 10 00737 g005
Figure 6. Absolute error in the actual and predicted results (a) GEP (b) MLR (c) MNLR.
Crystals 10 00737 g006
Figure 7. Relative contribution of input parameters to model output.
Crystals 10 00737 g007
Table 1. Statistics of the Available Collected Data.
ParameterUnitRangeMinMaxMeanSD
W/C-0.30.30.60.470.074
SCBA%%5005014.4111.16
FAKg/m3625240865609.1239.1
CCKg/m3444116560341.2101.2
CAKg/m37704901260891.8390.6
fcMPa67.3514.658237.6115.5
Table 2. Chemical Composition of Bagasse Ash.
CompositionPercentage
SiO266.70
Al2O39.24
Fe2O31.53
CaO10.07
MgO4.60
P2O51.98
K2O4.32
Na2O1.30
TiO20.22
MnO0.02
LOI1.9
Moisture content1.1
Table 3. Mix Proportions of the Concrete Mix.
Mix Design.Cement (Kg/m3)Bagasse Ash
(Kg/m3)
W/CFine
Aggregate
(Kg/m3)
Coarse Aggregate
(Kg/m3)
Water
(Kg/m3)
0BC(CM)36600.5742.31013.5183
10BC329.436.60.5742.31013.5183
20BC292.873.20.5742.31013.5183
30BC256.2109.80.5742.31013.5183
40BC219.6146.40.5742.31013.5183
Table 4. Compressive Strength of the Normal and Sugarcane Bagasse Ash Concrete (SCBAC) Mixes for Models Validation.
MIX28 Day Compressive Strength (MPa)
Specimen 1Specimen 2Specimen 3Average
0BC (CM)23.1423.8024.1023.68
10BC23.9424.7624.9024.53
20BC21.4320.7020.9221.01
30BC21.019.7819.6520.14
40BC15.3014.6514.814.91
Table 5. Optimal Parameter Setting for GEP.
ParameterSetting
GeneralChromosomes30
Genes4
Head size10
Gene size26
Linking functionAddition
Function set+, −, ×, ÷,^2, 3
Mutation rate0.0138
Inversion rate0.00546
IS transposition rate0.00546
Genetic operatorsRIS transposition rate0.00546
One point recombination rate0.00277
Two point recombination rate0.00277
Gene recombination rate0.00755
Gene transposition rate0.00277
Constants per gene10
Numerical ConstantsData typeFloating type
Lower bound−10
Upper bound10
Table 6. Statistical Parameters of the Models for the External Validation.
S.No.EquationConditionModelsValueSuggested by
1. R = i = 1 n M i M ¯ i ( P i P ¯ i ) i = 1 n ( M i M ¯ i ) 2 i = 1 n ( P i P ¯ i ) 2 R > 0.8GEP0.838[74]
MLR0.456
MNLR0.580
2. k = i = 1 n ( M i P i ) M i 2 0.85 < k < 1.15GEP0.992[75]
MLR1.021
MNLR0.954
3. k = i = 1 n ( M i P i ) P i 2 0.85 < k’ < 1.15GEP1.008[75]
MLR0.978
MNLR1.047
4. R m = R 2 × ( 1 R 2 R 0 2 Rm > 0.5GEP0.510[76]
MLR0.119
MNLR0.120
R 0 2 = i = 1 n P i M i 0 2 i = 1 n ( P i P i 0 ¯ ) 2 ,   M i 0 = k × P i R 0 2 1 GEP0.999
MLR0.999
MNLR0.997
R 0 2 ´ = i = 1 n M i P i 0 2 i = 1 n ( M i M i 0 ¯ ) 2 ,   P i 0 = k × M i R 0 2 ´ 1 GEP0.999
MLR0.999
MNLR0.997

