Article

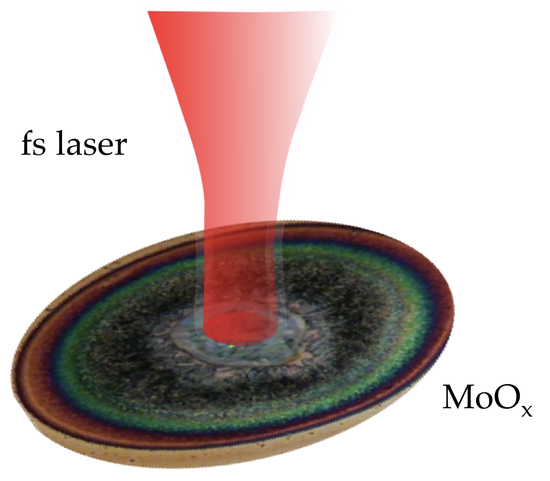
Fast Growth of Multi-Phase MoOx Synthesized by Laser Direct Writing Using Femtosecond Pulses

by
Santiago Camacho-Lopez
1,*,
Miroslava Cano-Lara
1 and
Marco Camacho-Lopez
2,*
1
Departamento de Óptica, Centro de Investigación Científica y de Educación Superior de Ensenada, Carretera Ensenada-Tijuana 3918, Zona Playitas, Ensenada, Baja California 22860, Mexico
2
Laboratorio de Investigación y Desarrollo de Materiales Avanzados, Facultad de Química, Universidad Autónoma del Estado de Mexico, Campus Rosedal, Km 14.5 Carretera Toluca-Atlacomulco, San Cayetano de Morelos, Toluca, Estado de Mexico 50295, Mexico
*
Authors to whom correspondence should be addressed.
Crystals 2020, 10(7), 629; https://doi.org/10.3390/cryst10070629
Submission received: 29 June 2020 / Revised: 16 July 2020 / Accepted: 17 July 2020 / Published: 21 July 2020

Abstract

:
Molybdenum oxide is an attractive material for application in several technology fields such as sensors, displays, and batteries, among many others. In this work, we present a reliable laser direct writing (LDW) method for synthesizing multi-phase molybdenum oxide (MoOx) on a single processing step. We use femtosecond laser pulses to produce up to five distinct crystalline phases of molybdenum oxide at once. We demonstrate how the laser irradiation conditions determine the MoOx stoichiometry, phase, and morphology. We show that by conveniently adjusting either the per-pulse laser fluence or the exposure time, MoOx can be obtained in nano or micro-structured form. We found that this ultrashort pulse laser processing method allows for the formation of unusual MoOx phases such as o-Mo18O52, which is rarely reported in the literature. In addition, it is possible to synthesize other sub-stoichiometric molybdenum oxide phases such as o-Mo4O11 and m-Mo8O23 all at atmospheric air conditions, with no need for demanding oxygen pressure precautions.

Graphical Abstract

1. Introduction

For decades, the laser has been a convenient tool for modifying the properties of many solid materials [1,2]. For instance, the laser irradiation of a solid in an oxidant atmosphere with a cw-laser produces heating within the irradiated region, raising its temperature and therefore triggering the oxidation of the material. A wide selection of both metals and semiconductors (Ti, Cr, V, Zr, Nb, W, Fe, Co, Ni, Cu, Zn, Cd, Al, Si, Ge, Sn, Te) has been demonstrated to oxidize under cw laser irradiation [3]. Bismuth, a semi-metal that is abundant in earth and a technologically attractive material, has also been studied in this context by several groups [4,5,6,7].
Materials processing by using pulsed lasers provides another way to confer new or improved properties to a great variety of materials including metals, semiconductors, ceramics, and polymers [8,9,10,11,12,13,14,15,16,17,18,19,20,21,22,23,24,25,26,27,28,29,30,31,32,33]. Pulsed lasers offer additional versatility on the processing, as compared to cw-laser irradiation. In the pulsed case, the laser processing parameters can be conveniently adjusted to achieve the desired material modification; pulse duration, for instance, determines the ablation threshold, while the repetition rate drives the heating rate. Pulsed laser irradiation has been used extensively to create a variety of effects on solid surfaces such as induced oxidation, LIPSS (laser-induced periodic surface structures), waveguide writing, and micromachining, among others. We have summarized in Table 1 a few illustrative examples of published work on pulsed laser-induced oxidation in metals. As seen in this summary table, pulsed laser-induced oxidation in titanium has been studied under different experimental conditions by various groups [8,9,10,11,12,15]. Further studies of pulsed laser-induced oxidation have also been reported for other materials as copper, chromium, bismuth, molybdenum, and zinc [13,14,16,17,18,19,20,21,22,23,24,25].
Molybdenum oxides are very versatile materials that attract lots of attention due to their multiple chemical compositions, crystalline phases, and crystallite morphologies, which give rise to a wide variety of applications as functional materials [34,35]. Molybdenum oxides (MoOx) can be obtained as MoO2, MoO3, or as a set of sub-stochiometric molybdenum oxides (MoOx, 2 < x < 3) such as Mo4O11, Mo17O47, Mo5O14, Mo8O23, and Mo18O52 [36,37,38,39,40,41,42]. The commonly known crystalline phases for stochiometric molybdenum oxides are m-MoO2, α-MoO3, β-MoO3, MoO3′, and h-MoO3 [36,43,44,45]. This rich selection of molybdenum oxides has shown potential industrial applications such as sensors, cathodes for lithium ion batteries, photocatalyst, and supercapacitors, among others [45,46,47,48]. It is worth mentioning that both the MoO2 and MoO3 crystalline phases have been extensively studied and well characterized by Raman spectroscopy. In contrast, limited information of Raman signature for sub-stoichiometric molybdenum oxides (MoOx, 2 < x < 3) has been published.
We must note that molybdenum oxides have been largely synthesized by a collection of methods including chemical routes such as hydrothermal, sol–gel, precipitation, and physical techniques including laser ablation, sputtering, thermal evaporation, and solid-state reaction, among others. These well-established routes allow for obtaining molybdenum oxides with different properties [35]. On the laser processing side, structural phase transformations can be triggered on already formed molybdenum oxides by using cw-laser irradiation, as reported in [42,49,50].
In our research group, we have focused our work during the last decade on the pulsed laser-induced oxidation of metals such as titanium, molybdenum, bismuth, and zinc in their thin film form by using short and ultrashort laser pulses [11,13,16,18,21,22,23].
In the present paper, we report on the experimental findings for the synthesis of MoOx by laser direct writing (LDW). We used femtosecond laser pulses for the fast growth of multi-phase molybdenum oxide, in atmospheric air, on single-step processing. These molybdenum oxides are grown on initially sputtered molybdenum thin films. We studied the MoOx formation as a function of both the per pulse laser fluence and exposure time. The laser-irradiated regions were characterized by optical microscopy (OM), micro-Raman spectroscopy (μRS), and scanning electron microscopy (SEM). Results demonstrate a clear influence of the LDW conditions on the optical, phase/chemical, and morphological features of the obtained MoOx. Up to five spatially resolved—closely packed—MoOx phases are obtained at once with distinct characteristics such as oxide coloring, varying stoichiometry, and micro/nanostructuring.

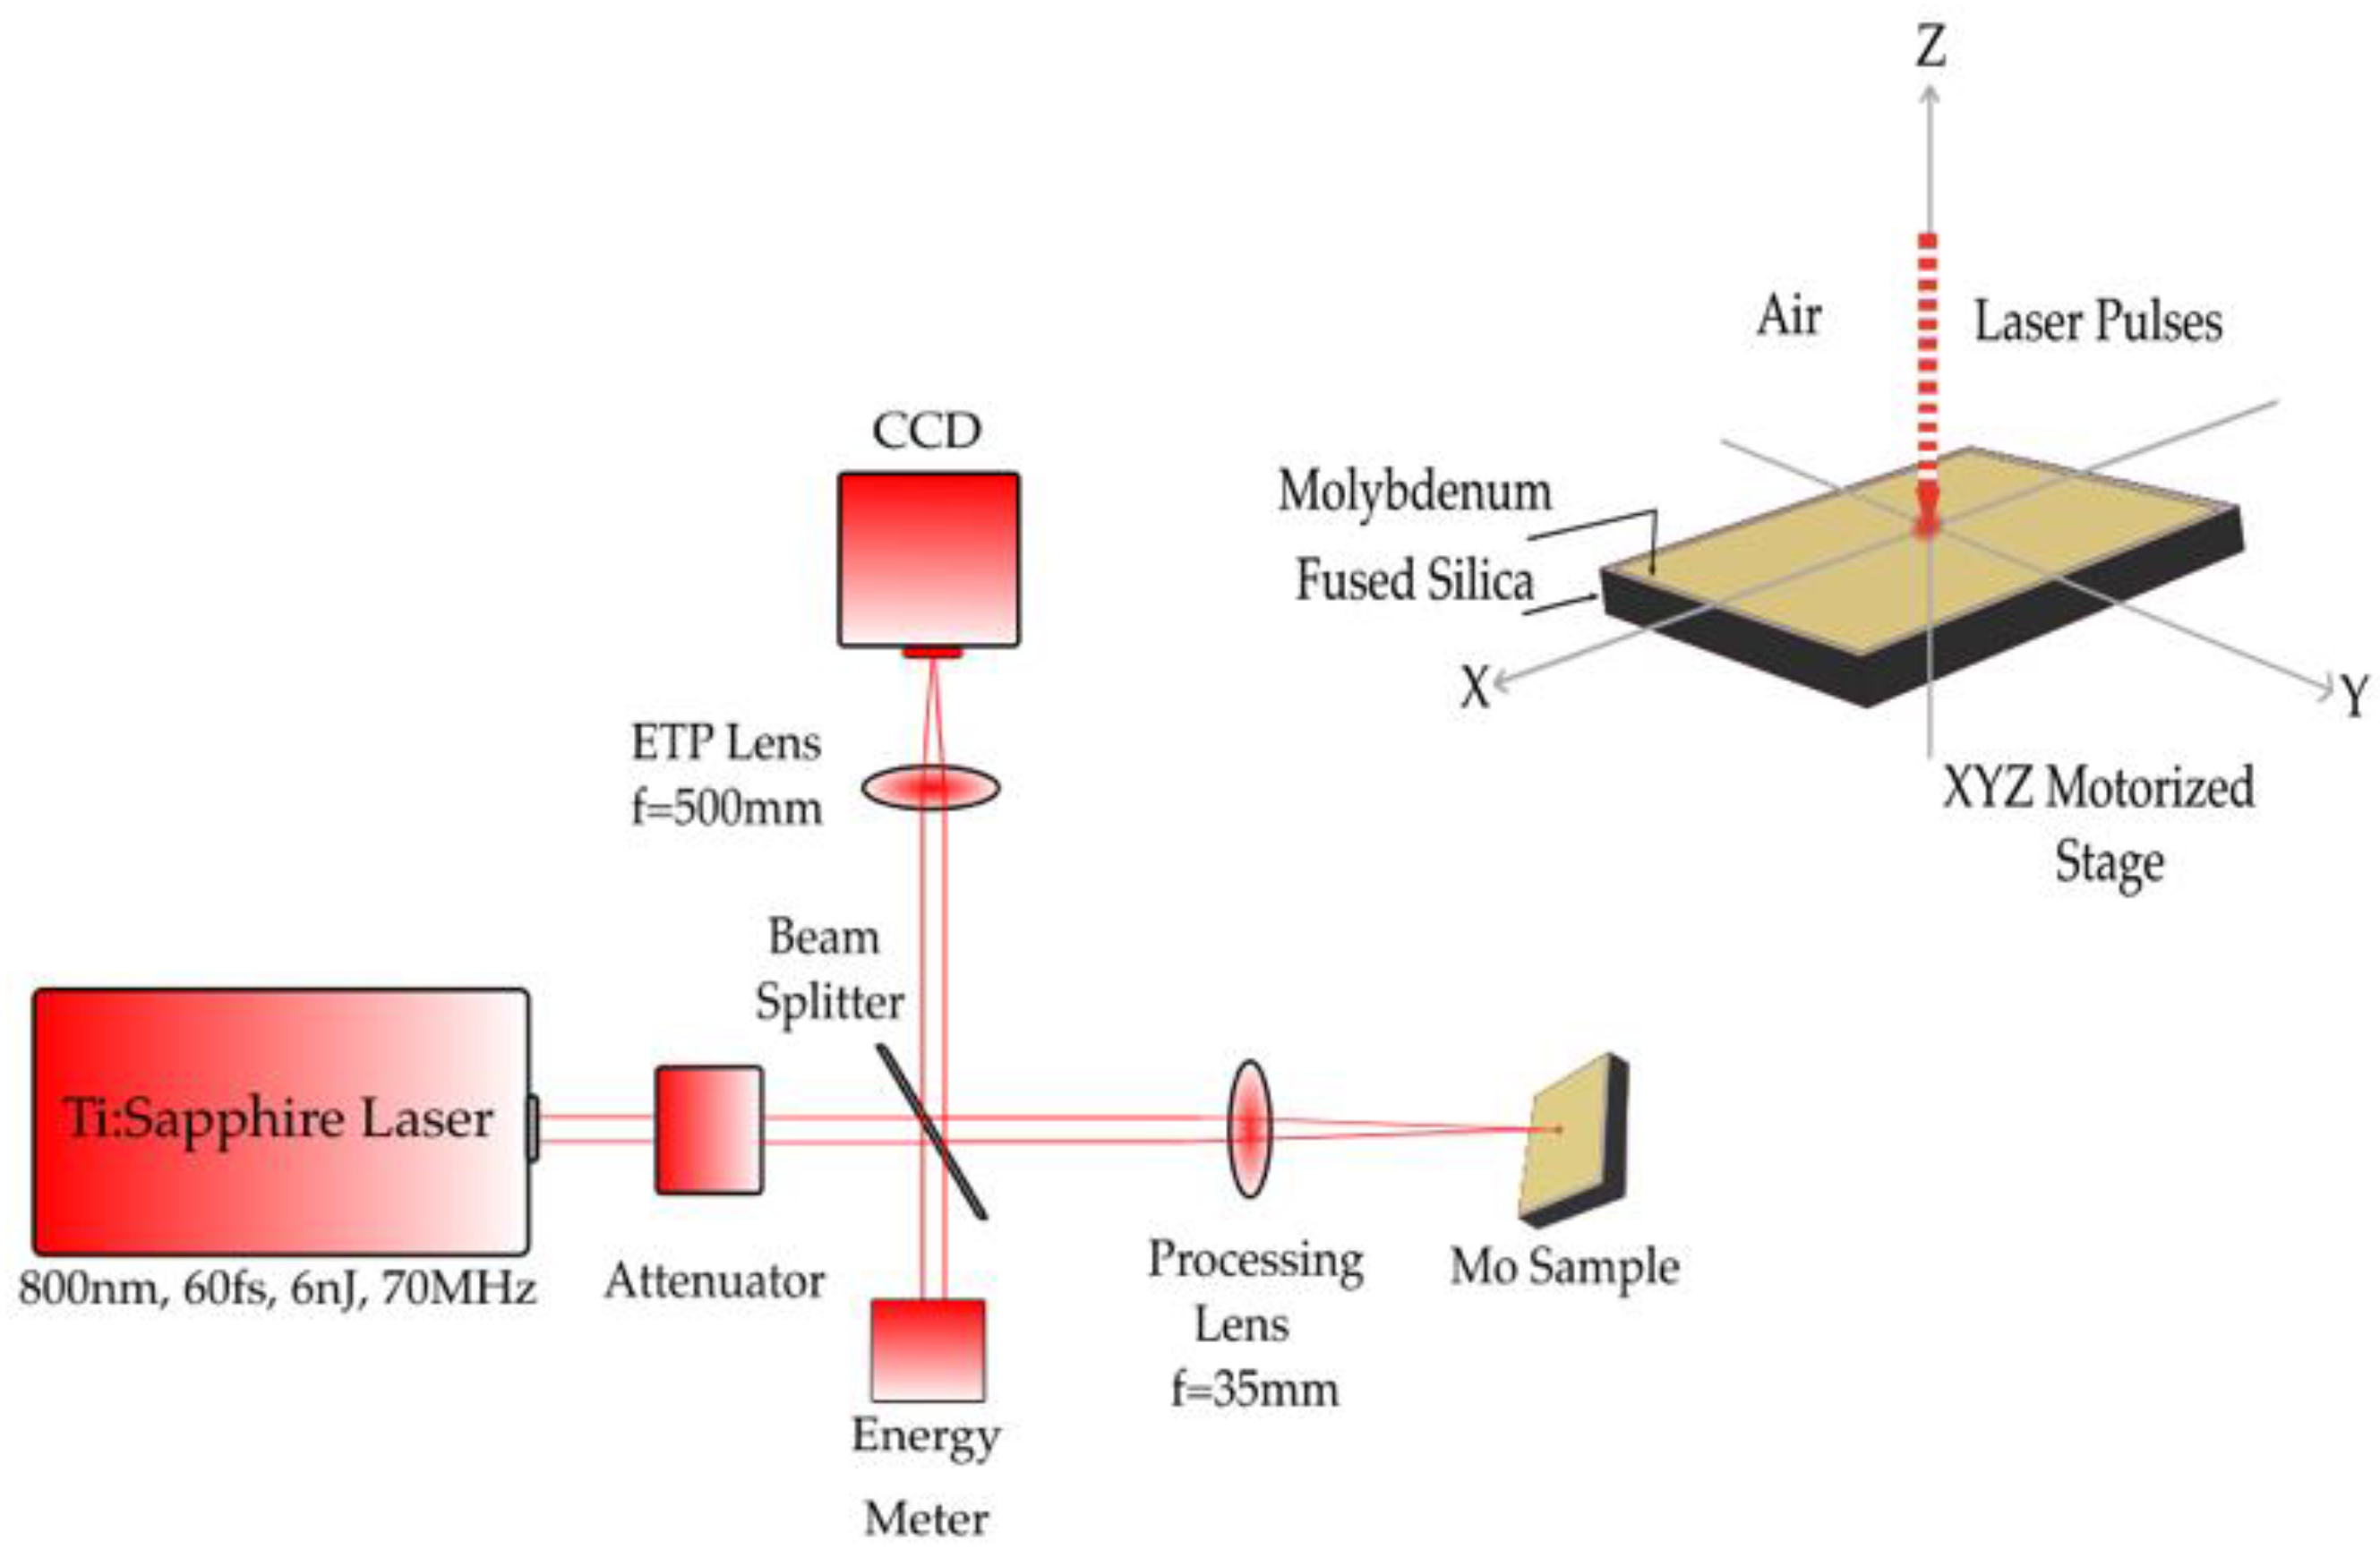
2. Materials and Methods

We used crystalline molybdenum (c-Mo) thin films deposited on glass substrates by the magnetron sputtering technique. The molybdenum films are 500 nm thick and grow preferentially in the (110) direction with a body-centered cubic (bbc) crystalline structure [13]. The whole laser processing work presented here was carried out well below the ablation threshold of molybdenum. For pulsed laser irradiation with ultrashort pulses, the ablation threshold strongly depends on the pulse duration [51,52]; therefore, it is very important to know the ablation threshold of molybdenum in its thin film form for femtosecond laser pulses. Hermann et al. [53] reported on the experimental determination of the femtosecond laser ablation threshold fluence of molybdenum films, 500 nm thick, deposited on a glass substrate. They reported a per-pulse laser ablation threshold fluence of 110 mJ/cm2 for laser pulses of 100 fs duration at 800 nm (Ti:Sapphire laser source).
In the present work, we used a Ti:Sapphire laser producing pulses of 60 fs duration at an 800 nm center wavelength, and the laser beam intensity profile is Gaussian. The laser irradiation was performed on the molybdenum films at fixed spot positions, using a 35 mm focal length positive lens. Since the incoming laser beam is slightly elliptical, the laser beam waist is also elliptical with the following dimensions: 10.36 μm (short axis) and 12.85 μm (long axis) measured at FW1/e2M. Laser pulses of energies 1.45, 2, 2.61, 3.2, 3.77, and 4.35 nJ were delivered to the molybdenum sample at a 70 MHz repetition rate. The per-pulse laser fluences for molybdenum irradiation were in the 1.4–4.2 mJ/cm2 range, i.e., they were less than the 4% ablation threshold fluence. This serves the purpose of avoiding molybdenum erosion at the surface and instead promoting a gentle material transformation as a result of the laser interaction with the molybdenum under ambient air conditions. The exposure time of the sample to the 70 MHz repetition rate laser pulses was set to 2, 10, 20, 30, 60, 180, 360, 600, and 1200 s. Figure 1 depicts the experimental set up we used in all the experiments. The output laser pulses are transported down to the sample through a series of mirrors and the lens, to finally land onto the sample. This is set on a computer-controlled x-y-z translation stage, which allows precisely (0.5 μm step resolution) repositioning the laser beam waist onto a new position after the laser irradiation has been completed on the current spot. We used an image relay optical system to help finely positioning the laser beam waist right on the sample surface. This image relay system is called the equivalent target plane (ETP), and it is composed by the processing lens (f = 35 mm), a 90/10 beam splitter, a second lens (f = 500 mm), and the CCD (charge-coupled device) camera.
The post-irradiated sample was characterized to assess the optical, phase/chemical, and morphological laser-induced changes. We used an optical microscope (Olympus BX-41, Olympus, Takakura, Tokyo, Japan) to take optical micrographs of the laser-irradiated spots. The phase/chemical changes were characterized by using an approximately 2 μm spatial resolution micro-Raman system (Jobin-Yvon-Horiba LABRAM HR-800, Horiba, Minami, Kyoto, Japan) whose laser source is an He–Ne laser (632.8 nm). The morphological features were studied by scanning electron microscopy (SEM, JEOL 5300, JEOL, Akishima, Tokyo, Japan).

3. Results

As a result of the laser irradiation of the Mo thin films in ambient air, the Mo surface is rapidly modified in three different aspects. An optical transformation occurs such that the silvery-dark Mo surface turns into a rich pattern of color as the laser irradiation progresses; this color patterning is accompanied by a morphological change in the surface, micro, and even nanostructures developed during laser irradiation, and this structure correlates to a distinctive color in the pattern. As it could be expected, the above-mentioned coloring and morphological change correspond to a particular phase change of the material, and several Mo oxide phases are synthesized at once during laser irradiation. In the sections below, the results of optical, morphological, and phase laser-induced changes are presented and discussed through an optical, SEM, and micro-Raman analysis of the irradiated Mo thin films.

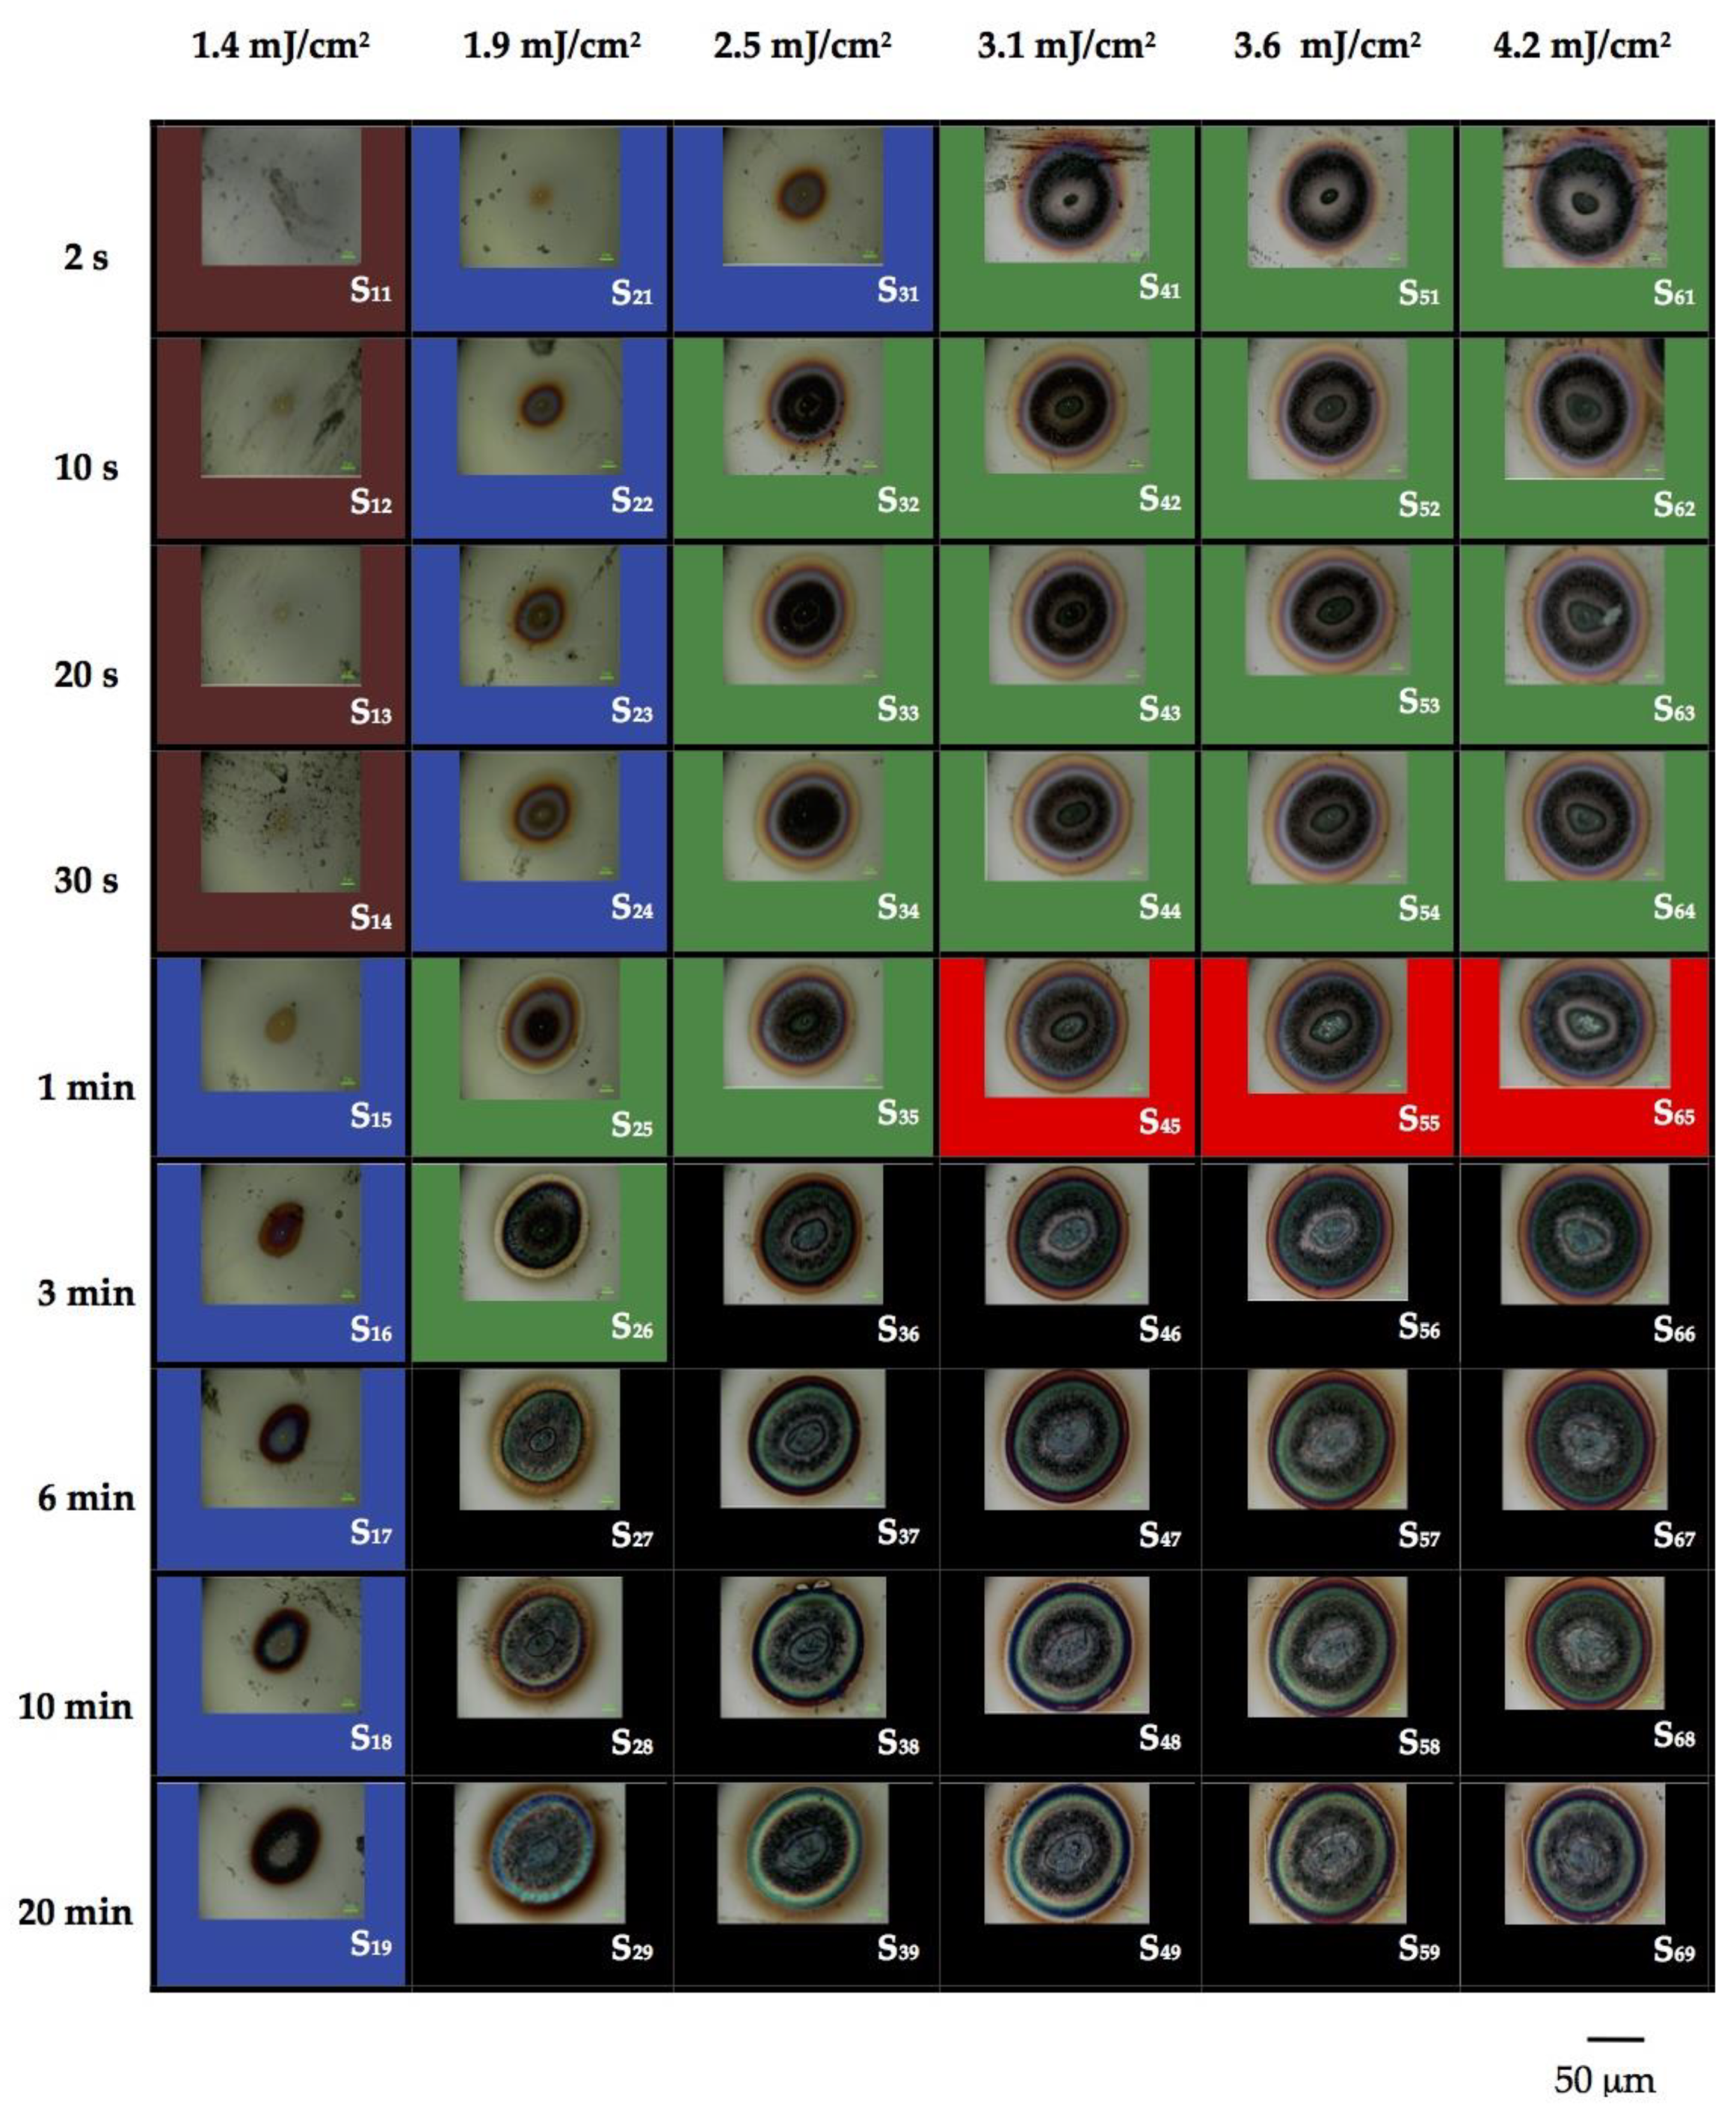
3.1. Optical Modification of the Mo Thin Film Surface

The optical modification on the surface of the Mo thin film consists of the rapid formation of a concentric ring pattern, where each ring acquires a distinct color. The growth and evolution of the pattern is directly related to both the per-pulse laser fluence and the exposure time to the pulsed fs laser irradiation. Figure 2 shows a matrix of optical micrographs (labeled Sij; with i = 1, …, 6 and j = 1, …, 9) where columns (i) correspond to per-pulse laser fluence, while rows (j) correspond to exposure time. The background color (dark red, blue, green, light red, and black) identifies five oxides phases that were formed right in the center of the irradiated spot, as it is shown in Section 3.2.
We can see how the laser irradiation rapidly modifies the surface of the Mo film in the following way: at low per-pulse laser fluences and short exposure times (1.4 mJ/cm2 and up to 1 min; 1.9 mJ/cm2 and 2 sec), the initial silvery dark surface turns into a yellowish one, right on the irradiation spot. As the exposure time progresses and the per-pulse laser fluence increases, a concentric colored ring pattern develops. The number of concentric rings rises up to five around the quasi-elliptical central zone. Notice that the long axis of this quasi-elliptical central zone is approximately 2–3 times the size (12.85 μm FW1/e2M) of the laser spot, meaning that most of the surface modification, i.e., the concentric rings, are the result of heat diffusion effects originating at the laser heat source generated at the irradiation spot location. Of course, the central zone where the heat source is generated by strong optical absorption is under direct light illumination, which makes the conditions for oxide synthesis different between the central zone and the concentric rings, since at the illuminated spot, the synthesis occurs under the influence of a strong electric field in addition to the generated heat. The overall effect of the increasing laser fluence and longer exposure times makes the modified surface area grow steadily by developing an increasing number of rigs of different colors. As it is discussed in the following sections, distinct oxide phases and morphology characterize the central zone as well as each one of the concentric rings.

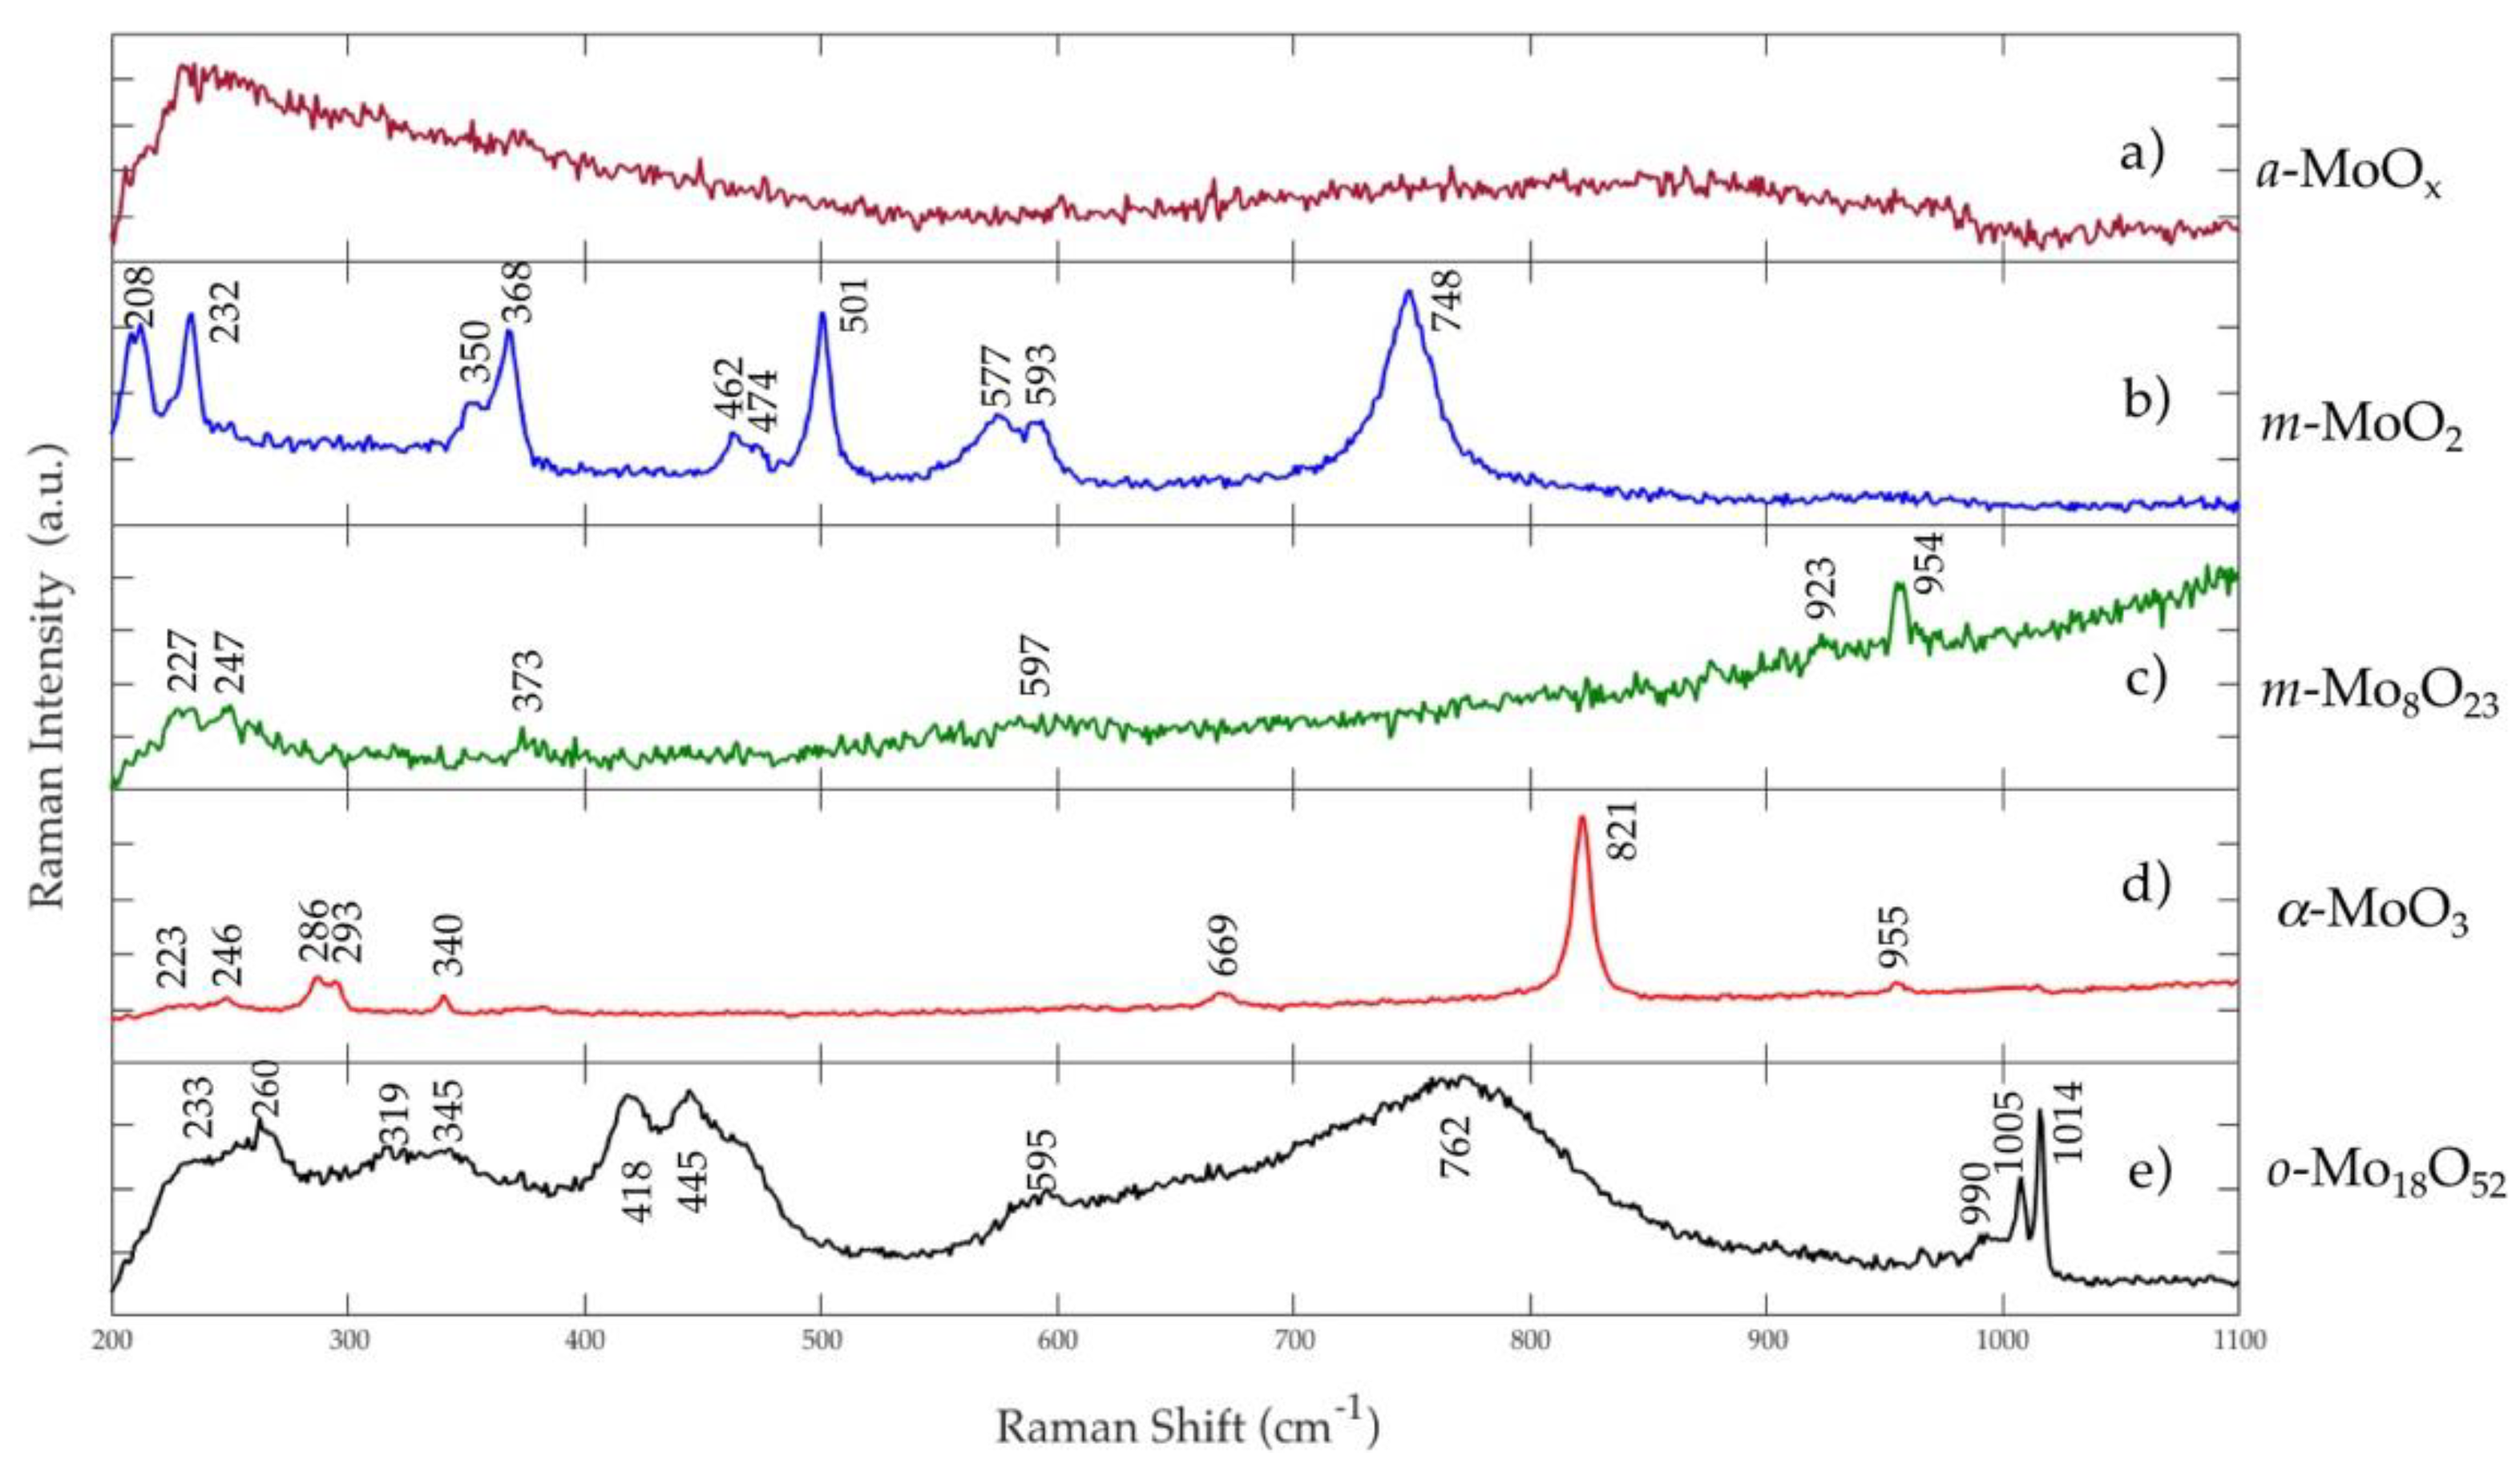
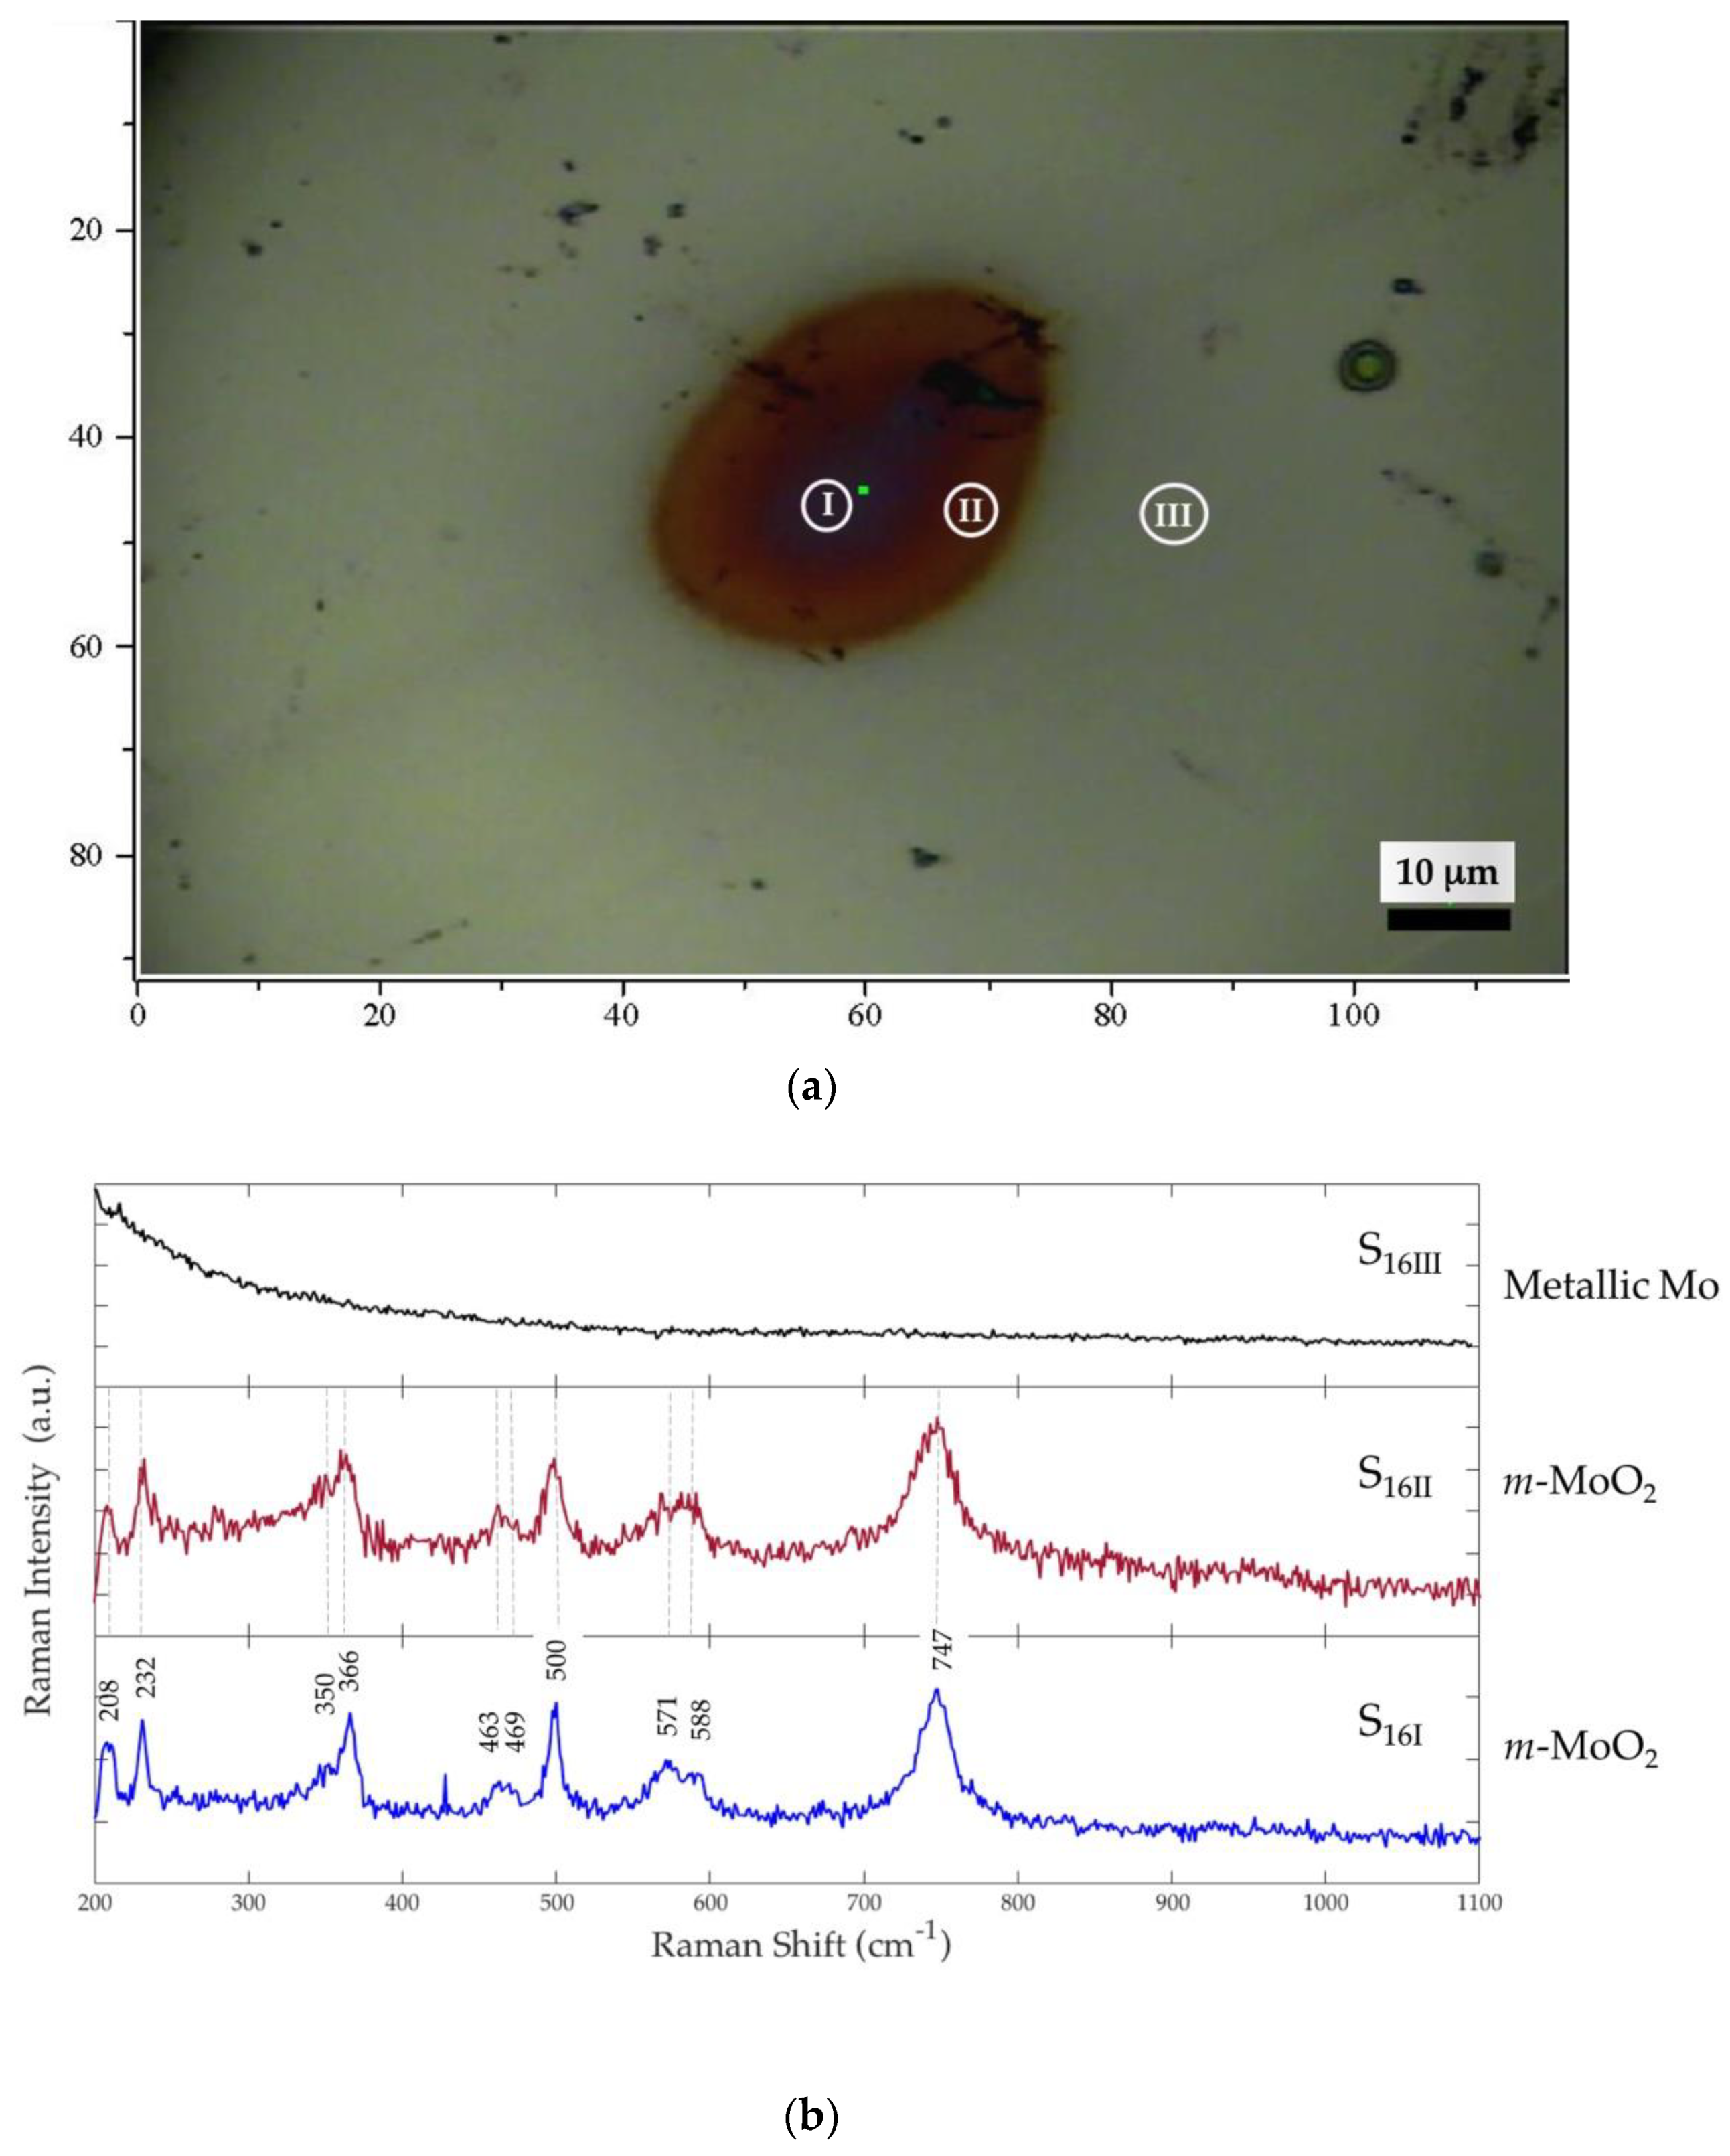
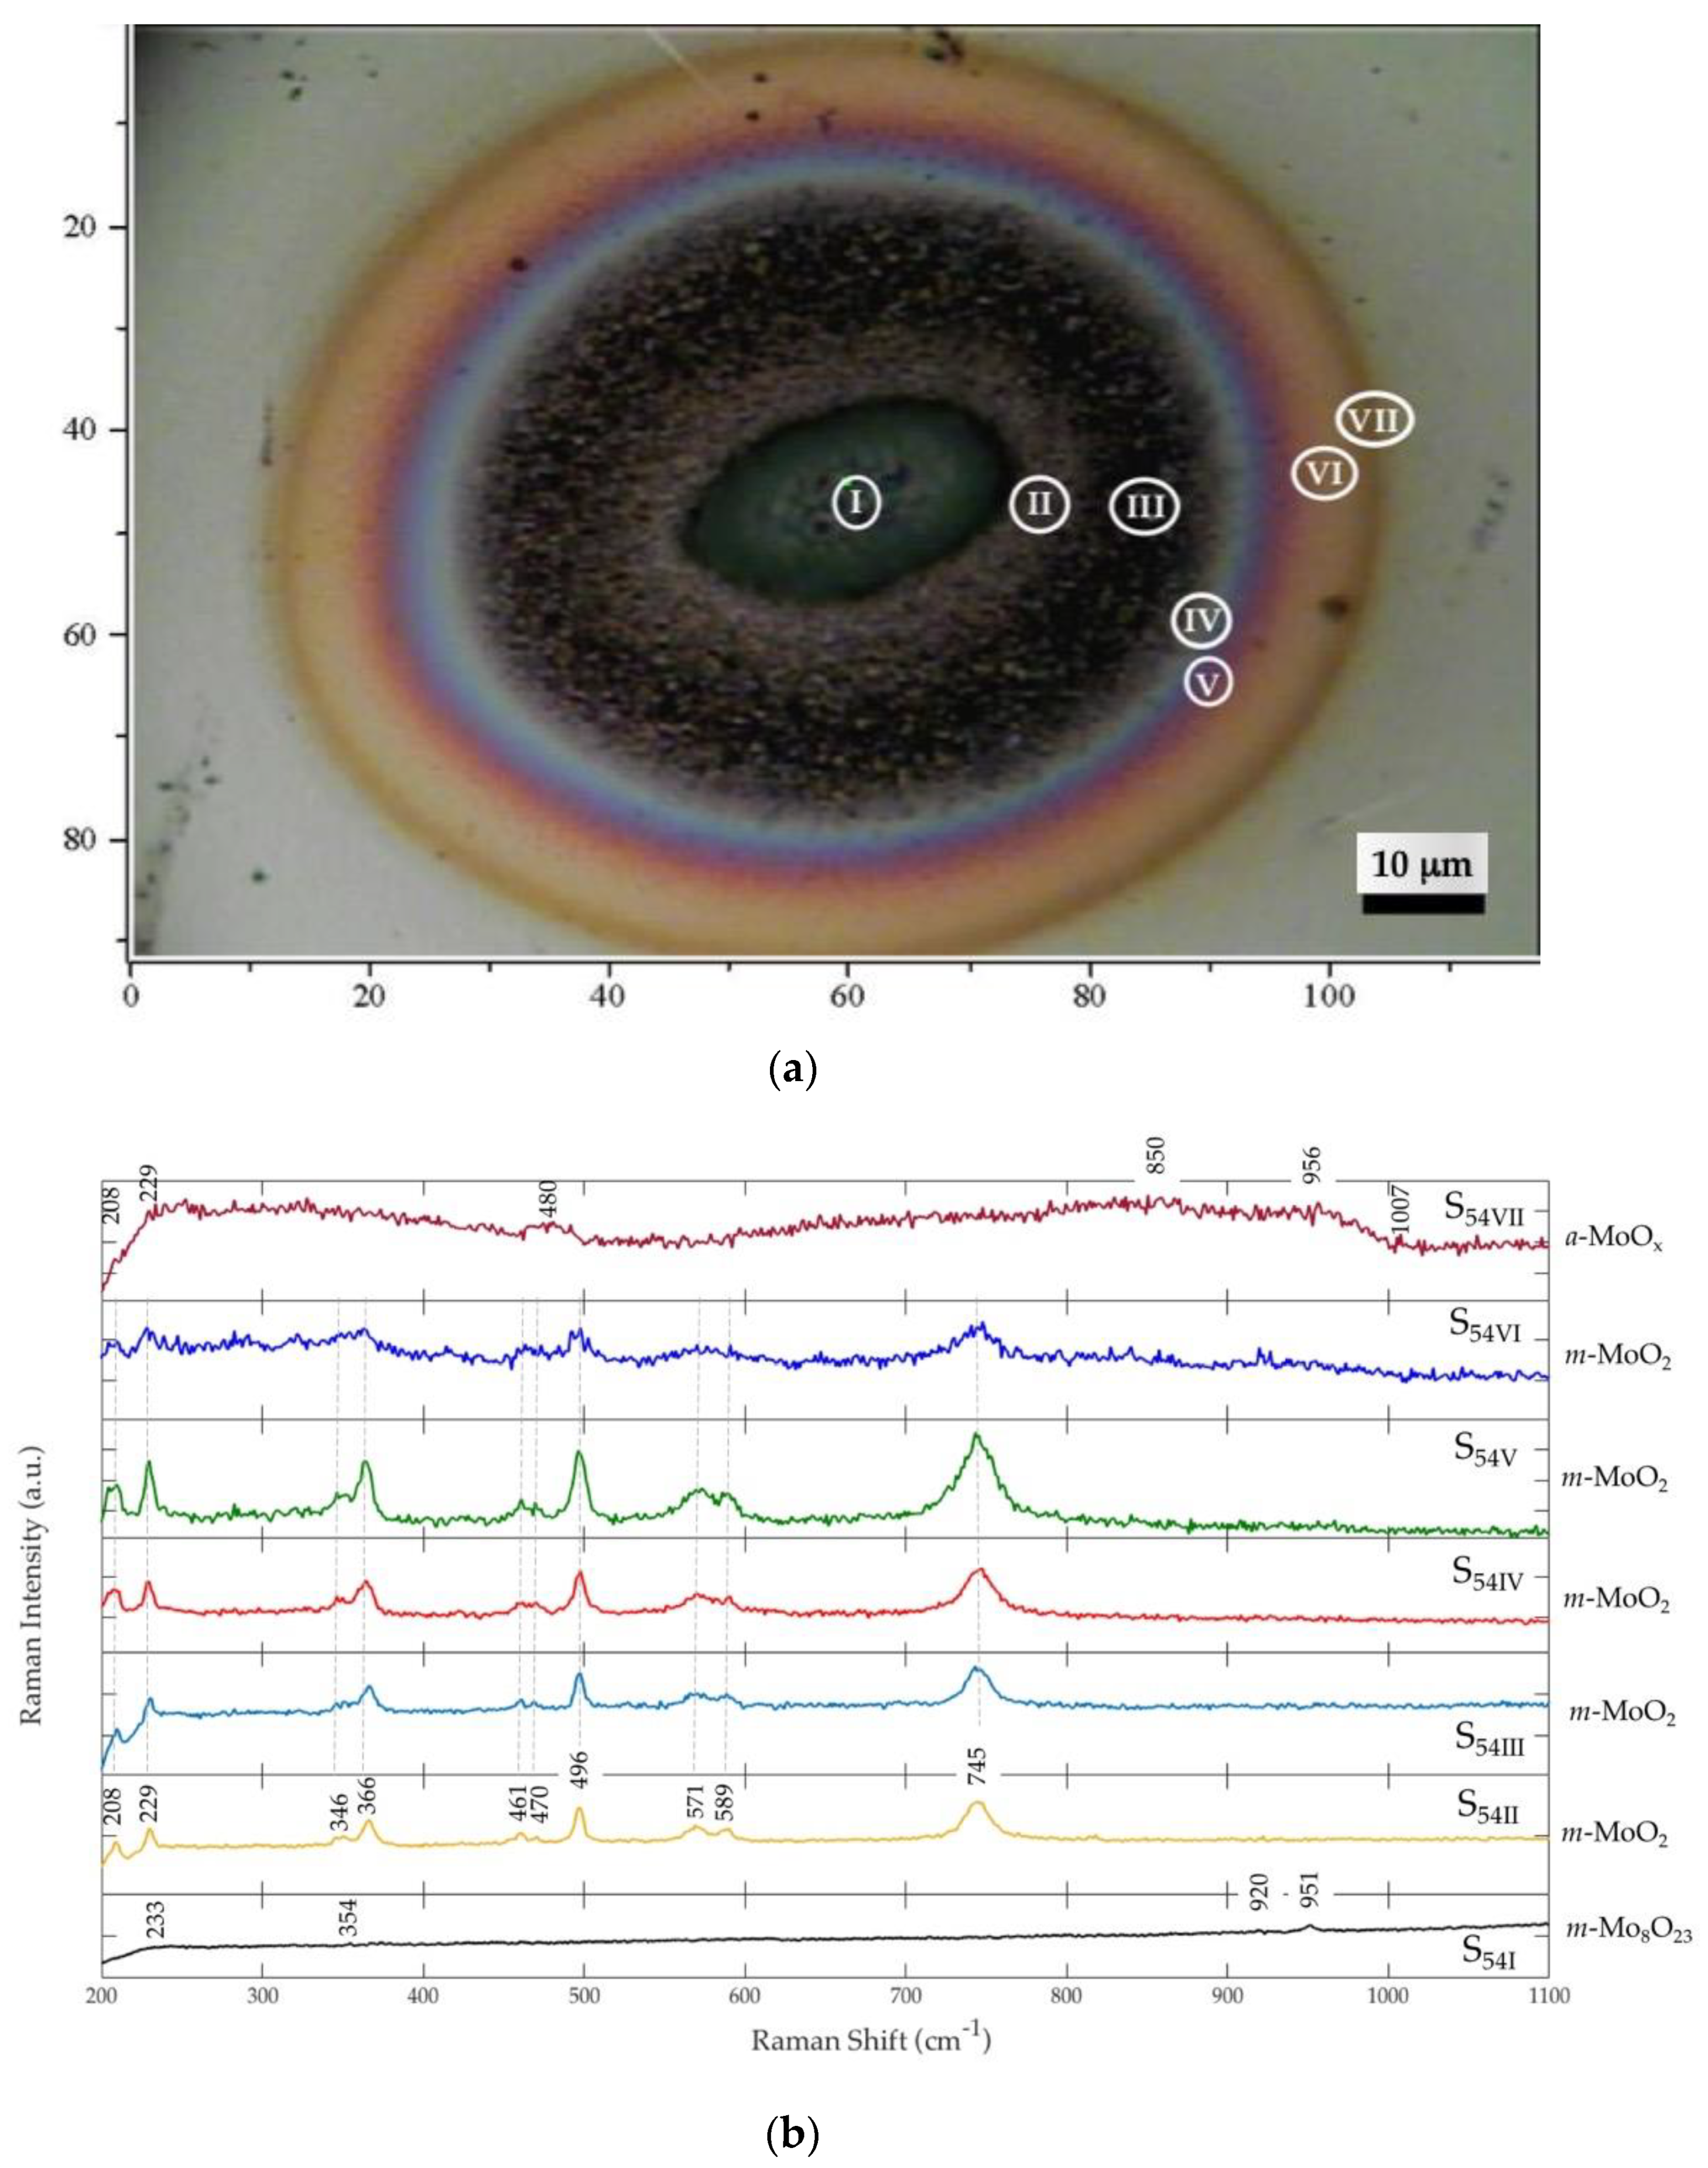
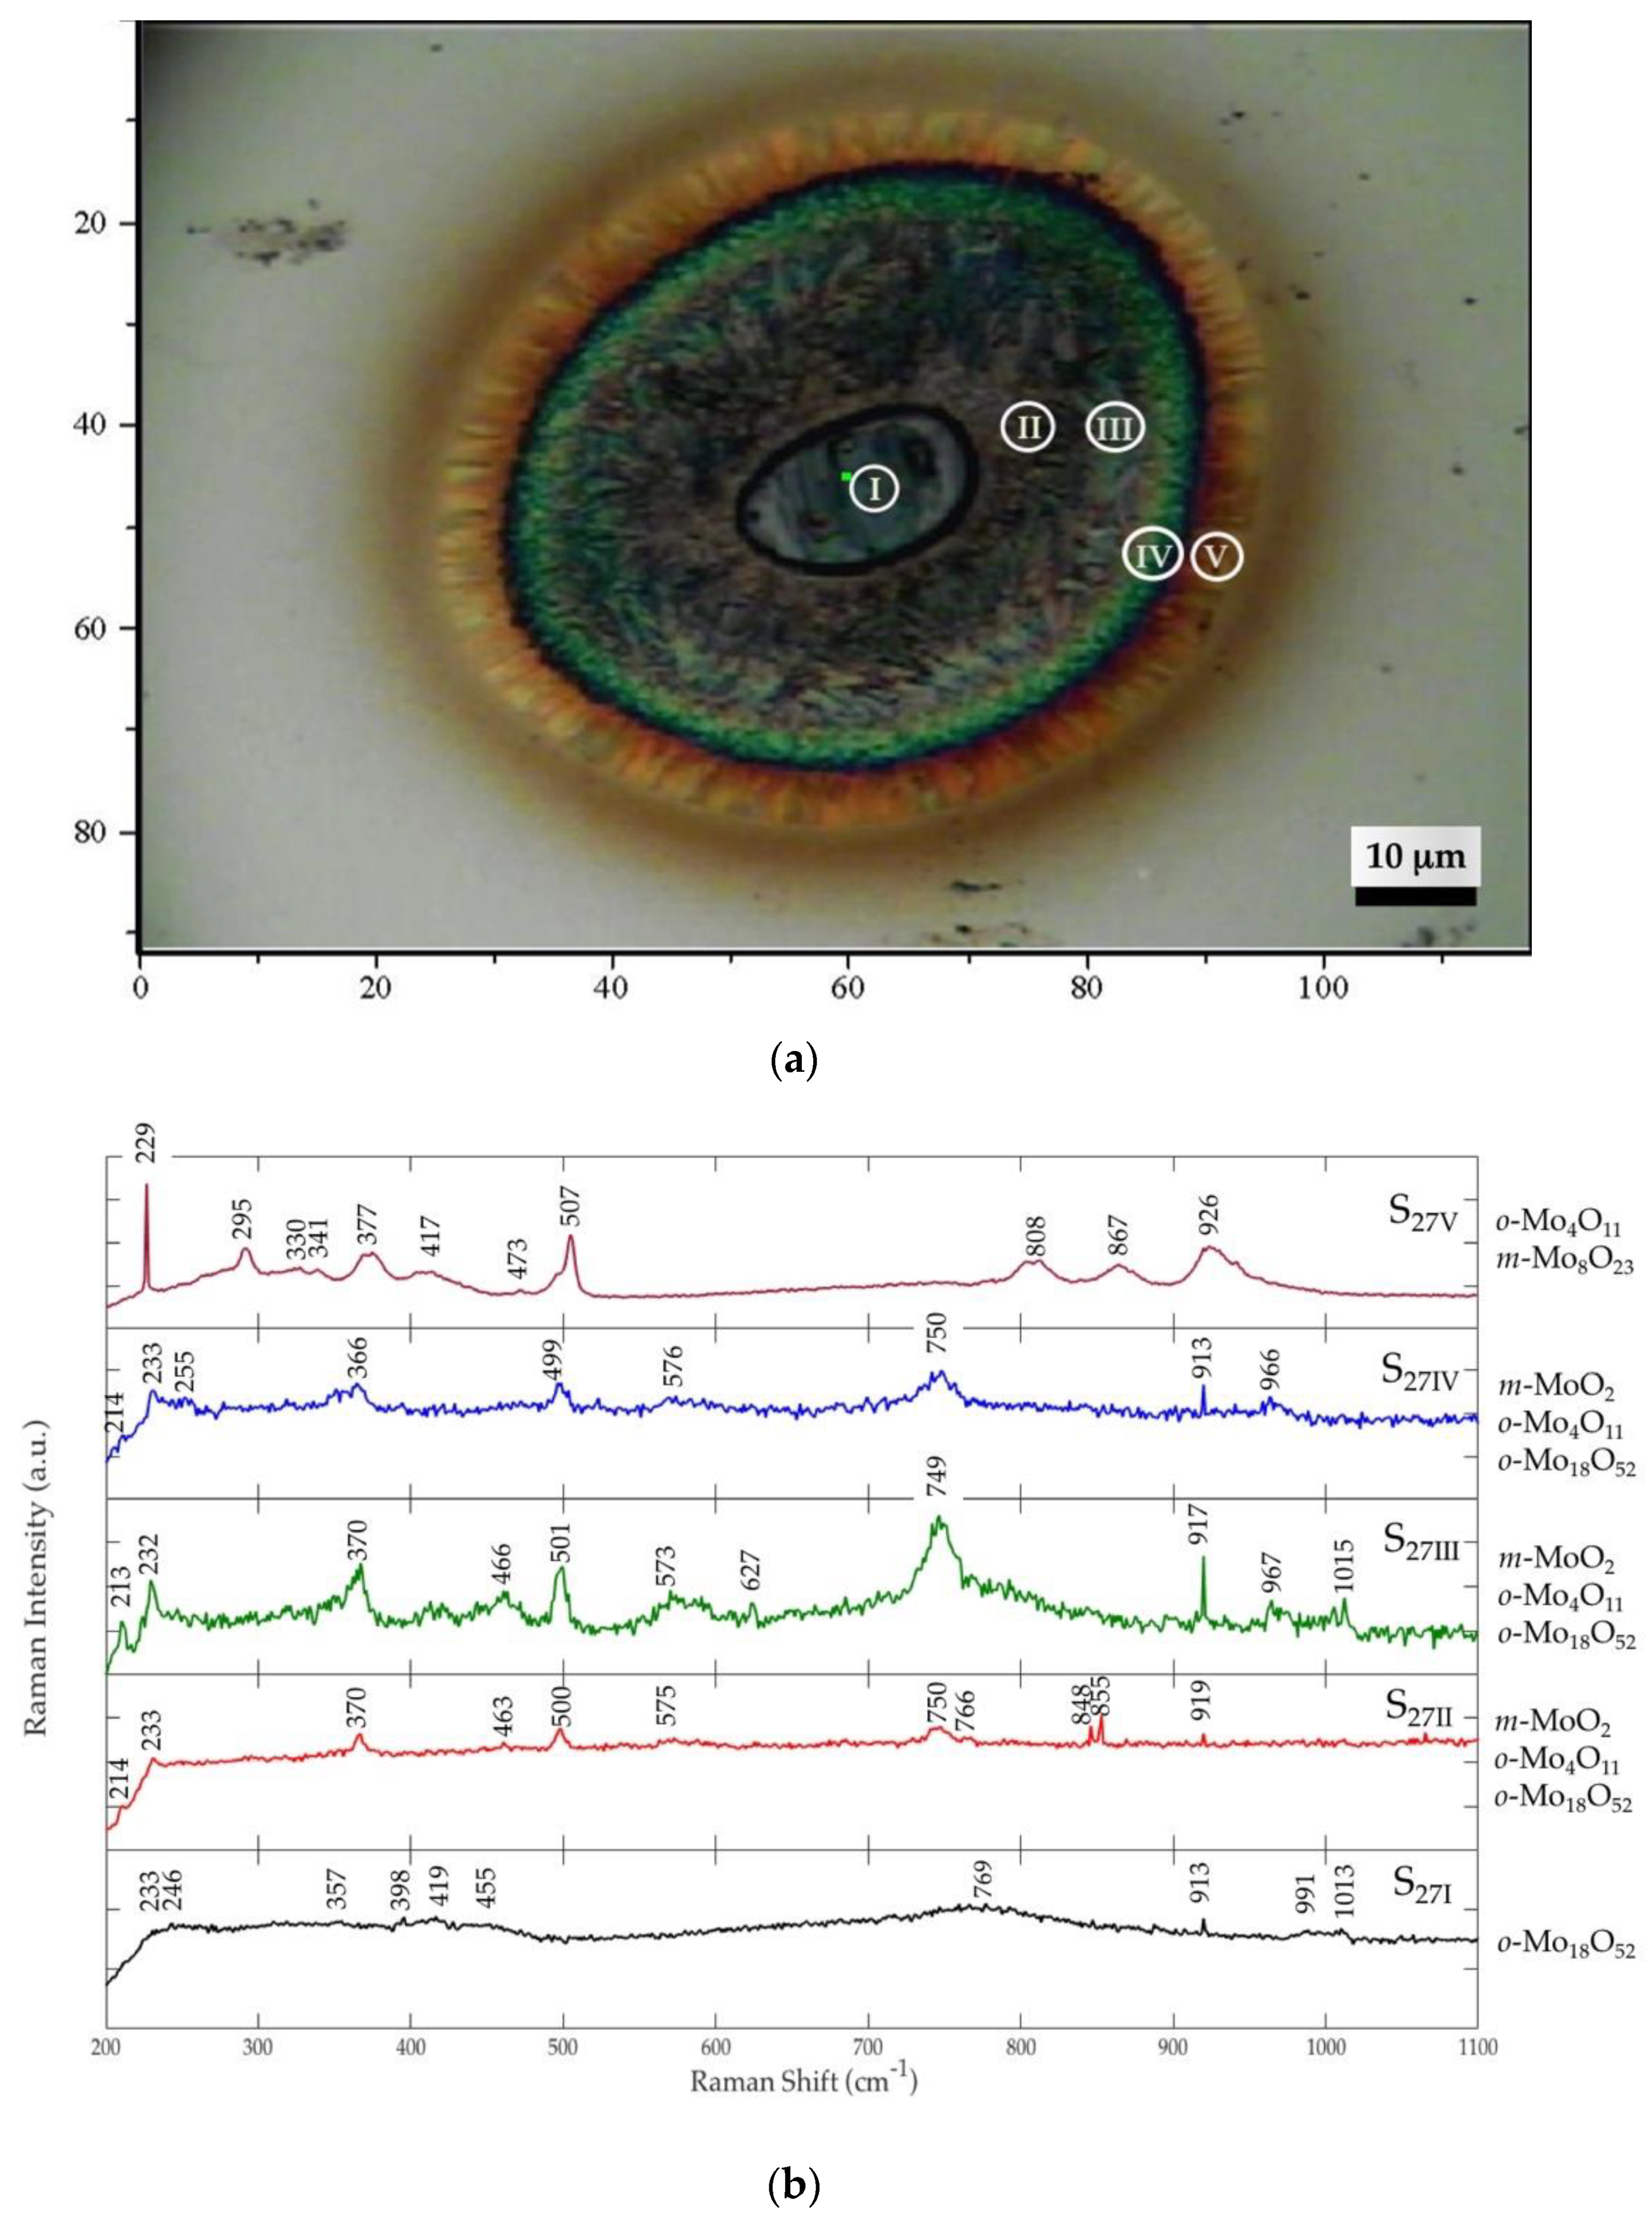
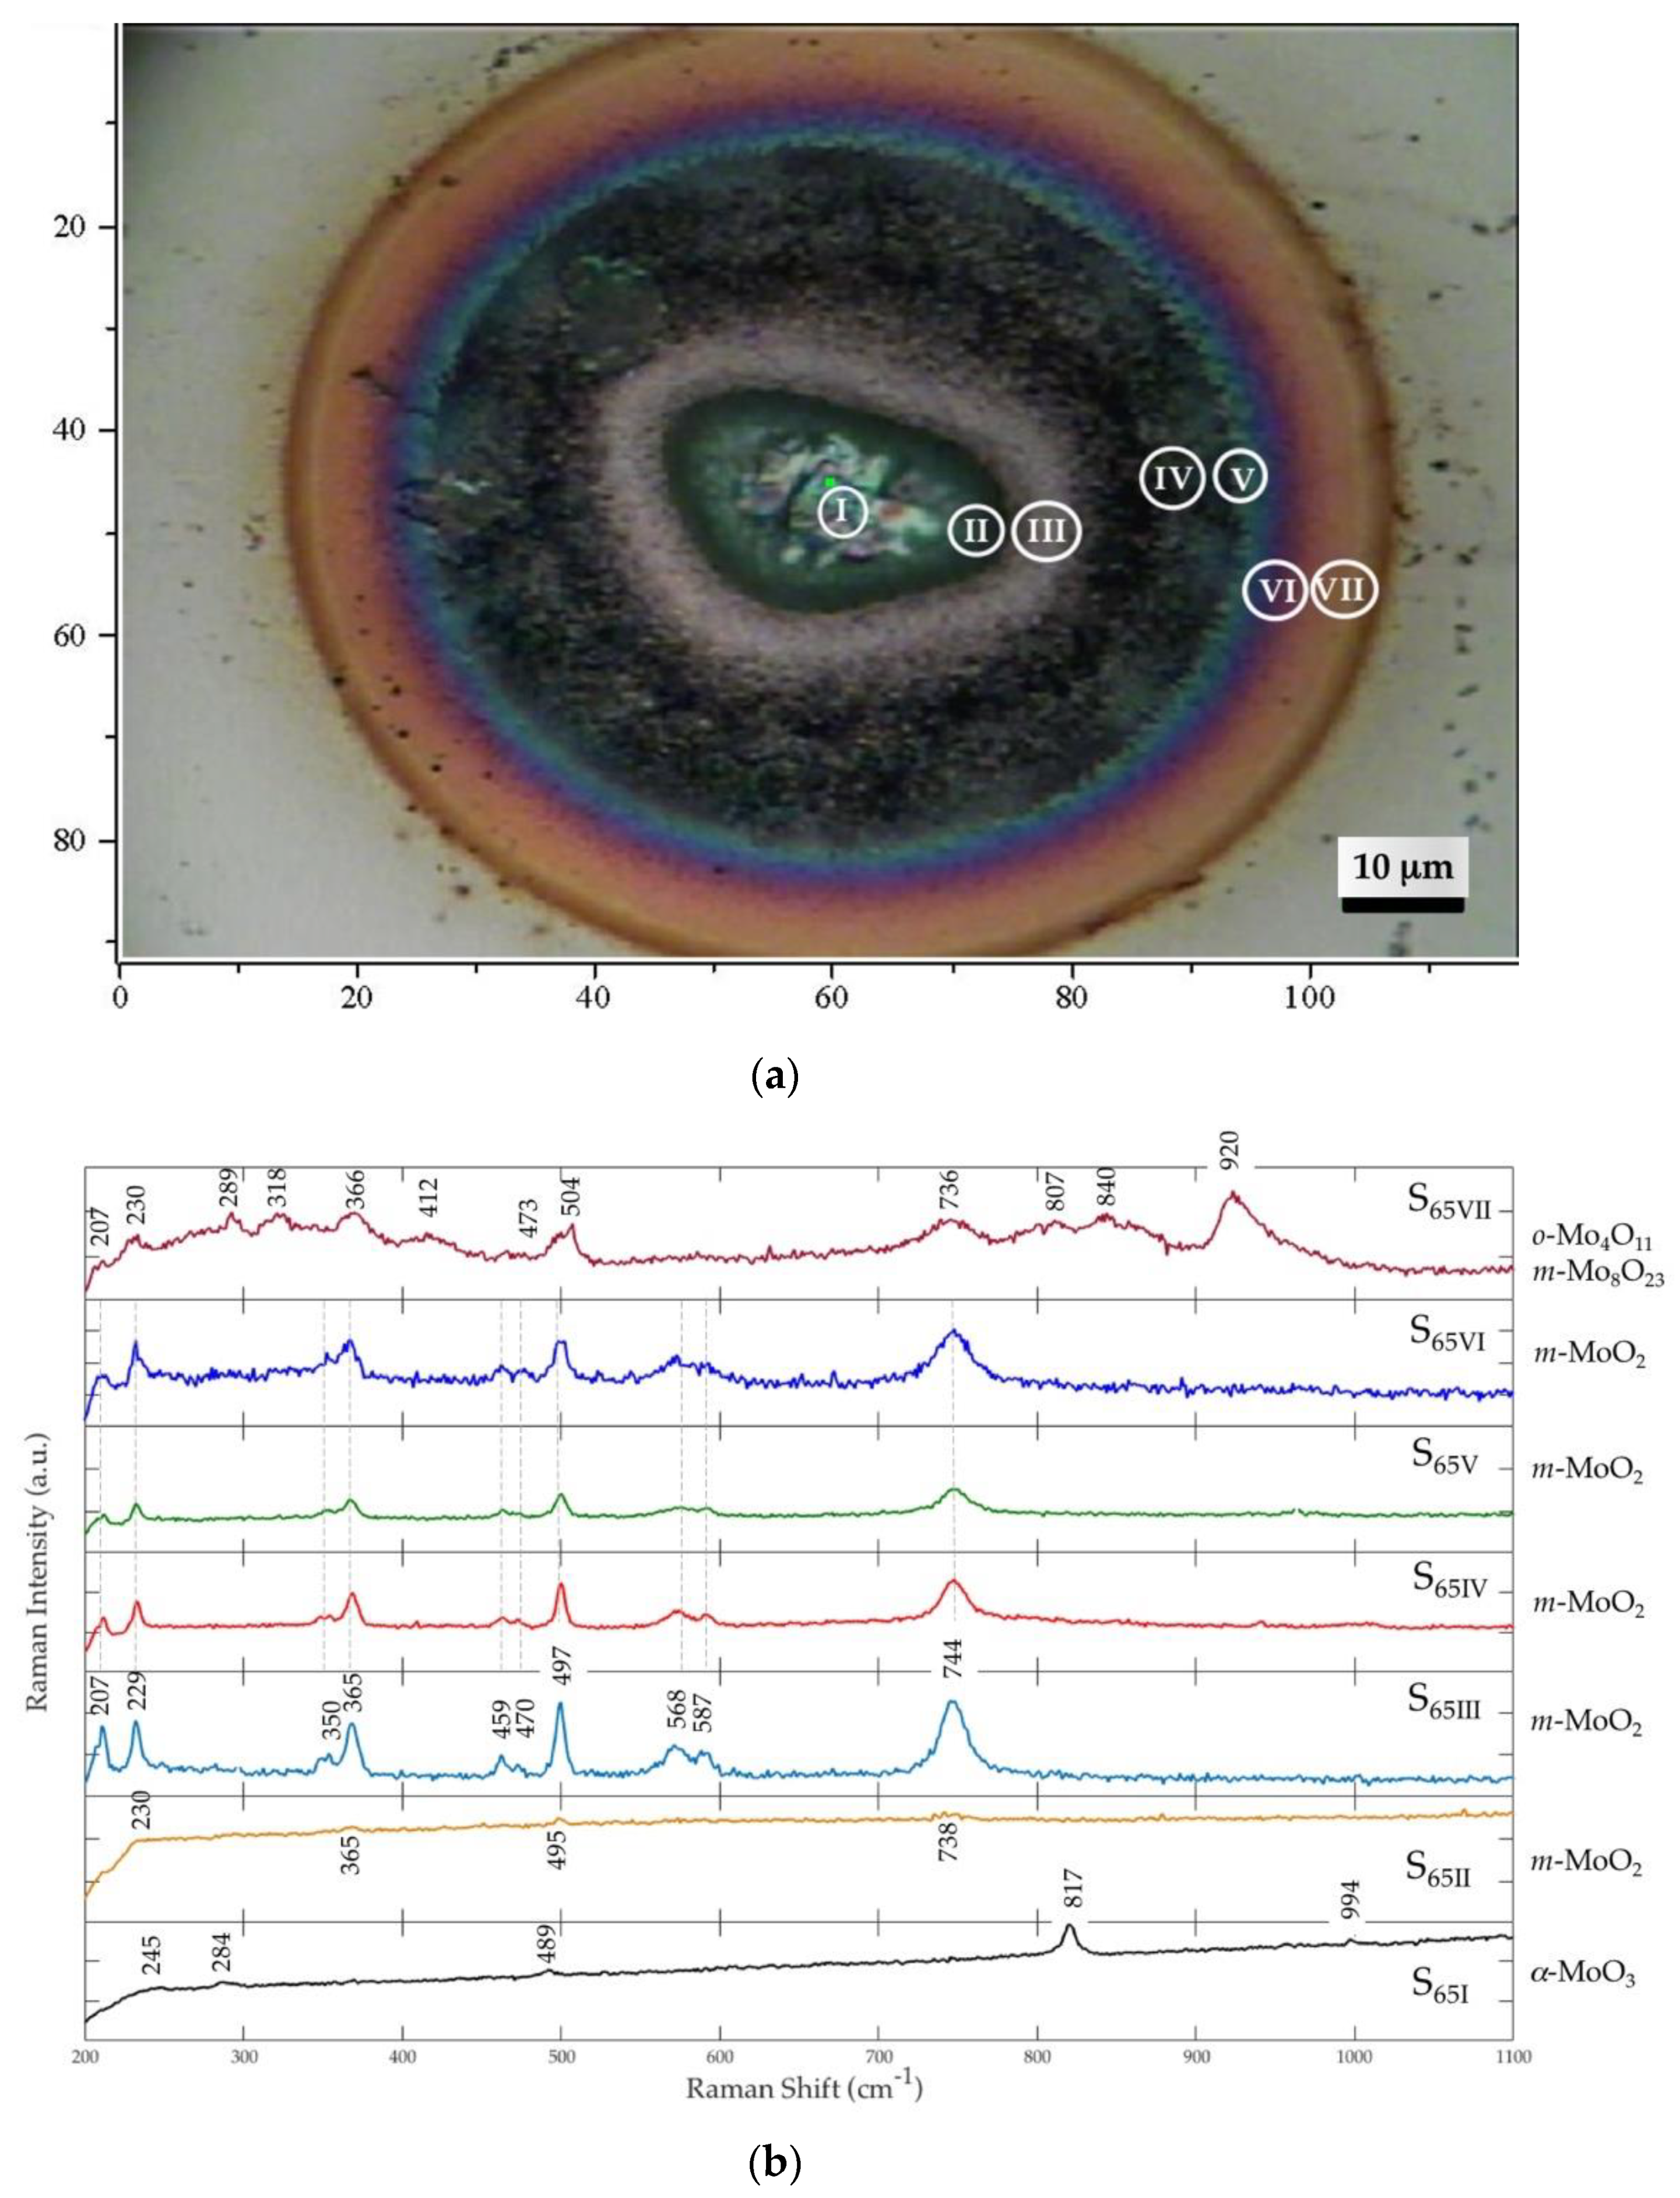
3.2. Laser-Induced Mo Oxide Phases

Micro-Raman spectroscopy was performed at the center in each one of the irradiated spots presented in Figure 2. By doing so, we identified five molybdenum oxide phases whose Raman spectra are presented in Figure 3. There are several combinations of per-pulse laser fluence and exposure times, which produce a specific oxide phase at the center of the irradiated spot. For the purpose of this work, we chose to show a representative spectrum for each one of the five background colored frame blocks (dark red, blue, green, light red, black) in Figure 2.
Amorphous molybdenum oxide (Figure 3a) is formed at the lowest (1.4 mJ/cm2) per-pulse fluence and up to 30 s exposure time (dark-red background frames in Figure 2); m-MoO2 (Figure 3b) [39,42] is obtained after 1 min and up to 20 min exposure time for a fluence of 1.4 mJ/cm2, although it grows faster (2–30 s) if the fluence increases up to 2.5 mJ/cm2 (blue background frames in Figure 2); m-Mo8O23 (Figure 3c) [54] forms fast at fluences between 2.5 and 4.2 mJ/cm2 with exposure times up to 30 s, while it needs up to 3 min to form if the fluence lowers down to 1.9 mJ/cm2 (green background frames in Figure 2); there are noticeable α-MoO3 (Figure 3d) [36,42] forms for a very narrow selection of fluence (3.1–4.2 mJ/cm2) and a single exposure time of 1 min (light-red background frames in Figure 2); the o-Mo18O52 (Figure 3e) [39] phase requires long exposure times (3–20 min) to form under per-pulse fluence from 1.9 up to 4.2 mJ/cm2 (black background frames in Figure 2).
Micro-Raman spectroscopy was also performed at selected irradiated spots by probing in the radial direction, in order to characterize the oxide phases synthesized at each concentric ring. Figure 4 shows the optical micrograph and the spatially resolved Raman spectra for the irradiated spot S16 (1.4 mJ/cm2, 3 min). As it can be clearly seen, this spot is constituted by a dark central zone surrounded by a single light-brown ring. Raman measurements were carried out at the I, II, and III positions, i.e., at a position far beyond the laser-modified zone (our reference of the starting material) and within the modified region. The unmodified film shows no Raman activity (S16III), since the starting material is constituted by pure metallic molybdenum. S16I shows well-defined peaks at 208, 232, 350, 366, 463, 469, 500, 571, 588, and 747 cm−1, indicating the formation of the monoclinic molybdenum dioxide m-MoO2 phase [39,42]. S16II shows the same spectrum with a slightly broadening on the peaks, which is possibly due to a lower degree of crystallization at the outer edge of the laser-modified region.
Figure 5 shows the optical micrograph and the Raman spectra corresponding to the center and the concentric rings of the irradiated spot S54 (3.6 mJ/cm2, 30 s). In this case, the modified region in the film develops into a rich colored pattern, where we probed with micro-Raman spectroscopy at seven spatially resolved positions—I, II, III, IV, V, VI, VII—as it is indicated in the optical micrograph. At the center of the irradiated spot, the Raman spectrum S54I shows incipient peaks at the following positions: 233, 354, 920, and 951 cm−1. These can be assigned to the sub-stoichiometric monoclinic the m-Mo8O23 phase [39,54]. The Raman spectra S54II–S54VI at the light-gray, dark-gray, blue, purple, and the outer light-brown ring in the rings pattern show peaks at 208, 229, 346, 366, 461, 470, 496, 571, 589, and 745 cm−1, which belong to the molybdenum dioxide m-MoO2 phase [39,42]. At the very edge of the pattern, the Raman spectrum S54VII shows incipient bands at 208, 229, 480, 850, 956, and 1007 cm−1, which seems to be composed by a mixture form of amorphous a-MoOx oxide phases.
Figure 6 shows the optical micrograph and the Raman spectra corresponding to the center and the concentric rings of the irradiated spot S27 (1.9 mJ/cm2, 6 min). The micro-Raman spectroscopy measurements were carried out at the I, II, III, IV, and V spatially resolved positions indicated in the optical micrograph. Notice that in this case, the rings’ dominant colors are dark gray for S27II, green for S27III–S27IV, and light brown for S27V. At the center of the irradiated spot, the Raman spectrum S27I shows incipient peaks at 233, 246, 357, 398, 419, 455, 769, 890, 991, and 1013 cm−1, indicating the formation of the o-Mo18O52 oxide phase [39]. The Raman spectrum S27II taken at the dark-gray ring shows more defined peaks at 233, 370, 463, 500, 575, and 750 cm−1, which correspond to m-MoO2 [39,42]. Additional peaks are located at 848 and 855 cm−1 which are close to the reported peaks for the o-Mo4O11 phase [38,39]; there are also tiny peaks at the positions 766 and 919 cm−1 that belong to the o-Mo18O52 phase [39], meaning that there is phase mixture; i.e., the three m-MoO2, o-Mo4O11, and o-Mo18O52 coexist. For the edges of the green ring, the Raman spectra S27III and S27IV are constituted by peaks at around 232, 370, 415, 466, 501, 573, and 749 cm−1, which indicate the formation of both m-MoO2 and o-Mo4O11 oxide phases [38,39,42]. There are also additional peaks at 627, 913, 917, 967, and 1015 cm−1 showing the coexistence of the o-Mo18O52 oxide phase [39]. At the outer light-brown ring, the Raman spectrum S27V presents peaks at 229, 295, 330, 341, 377, 417, 473, 507, 808, 867, and 926 cm−1, where the coexistence of the o-Mo4O11 and m-Mo8O23 phases is identified [38,39].
Figure 7 shows the optical micrograph and the Raman spectra corresponding to the center and the concentric rings of the irradiated spot S65 (4.2 mJ/cm2, 1 min). Spatially resolved micro-Raman measurements were performed at the positions I, II, III, IV, V, VI, and VII, as indicated in the optical micrograph. At the center of the laser-irradiated spot, it shows the formation of large crystals. The surrounding six concentric rings display colors as follows: dark gray for S65II, light gray for S65III, dark gray for S65IV, green for S65V, blue for S65VI, and light brown for S65VII. The Raman spectrum S65I shows peaks at 245, 284, 489, 817, and 994 cm−1, indicating the formation of the alpha phase of molybdenum trioxide α-MoO3 [36,42]. The first inner ring has a Raman spectrum S65II with peaks at 230, 365, 495, and 738 cm−1, showing an incipient formation of the monoclinic phase of molybdenum dioxide m-MoO2. The Raman spectra S65III-S65VI are all very similar with well-defined peaks at around 207, 229, 350, 365, 459, 470, 497, 568, 587, and 744 cm−1, indicating a much better formation of the m-MoO2 oxide phase. The outer light-brown ring shows a Raman spectrum S65VII with peaks at 207, 230, 289, 318, 366, 412, 473, 504, 736, 807, 840, and 920 cm−1, where we have the coexistence of the o-Mo4O11 and m-Mo8O23 phases [39,54] similarly as in the case of S27V in Figure 6.

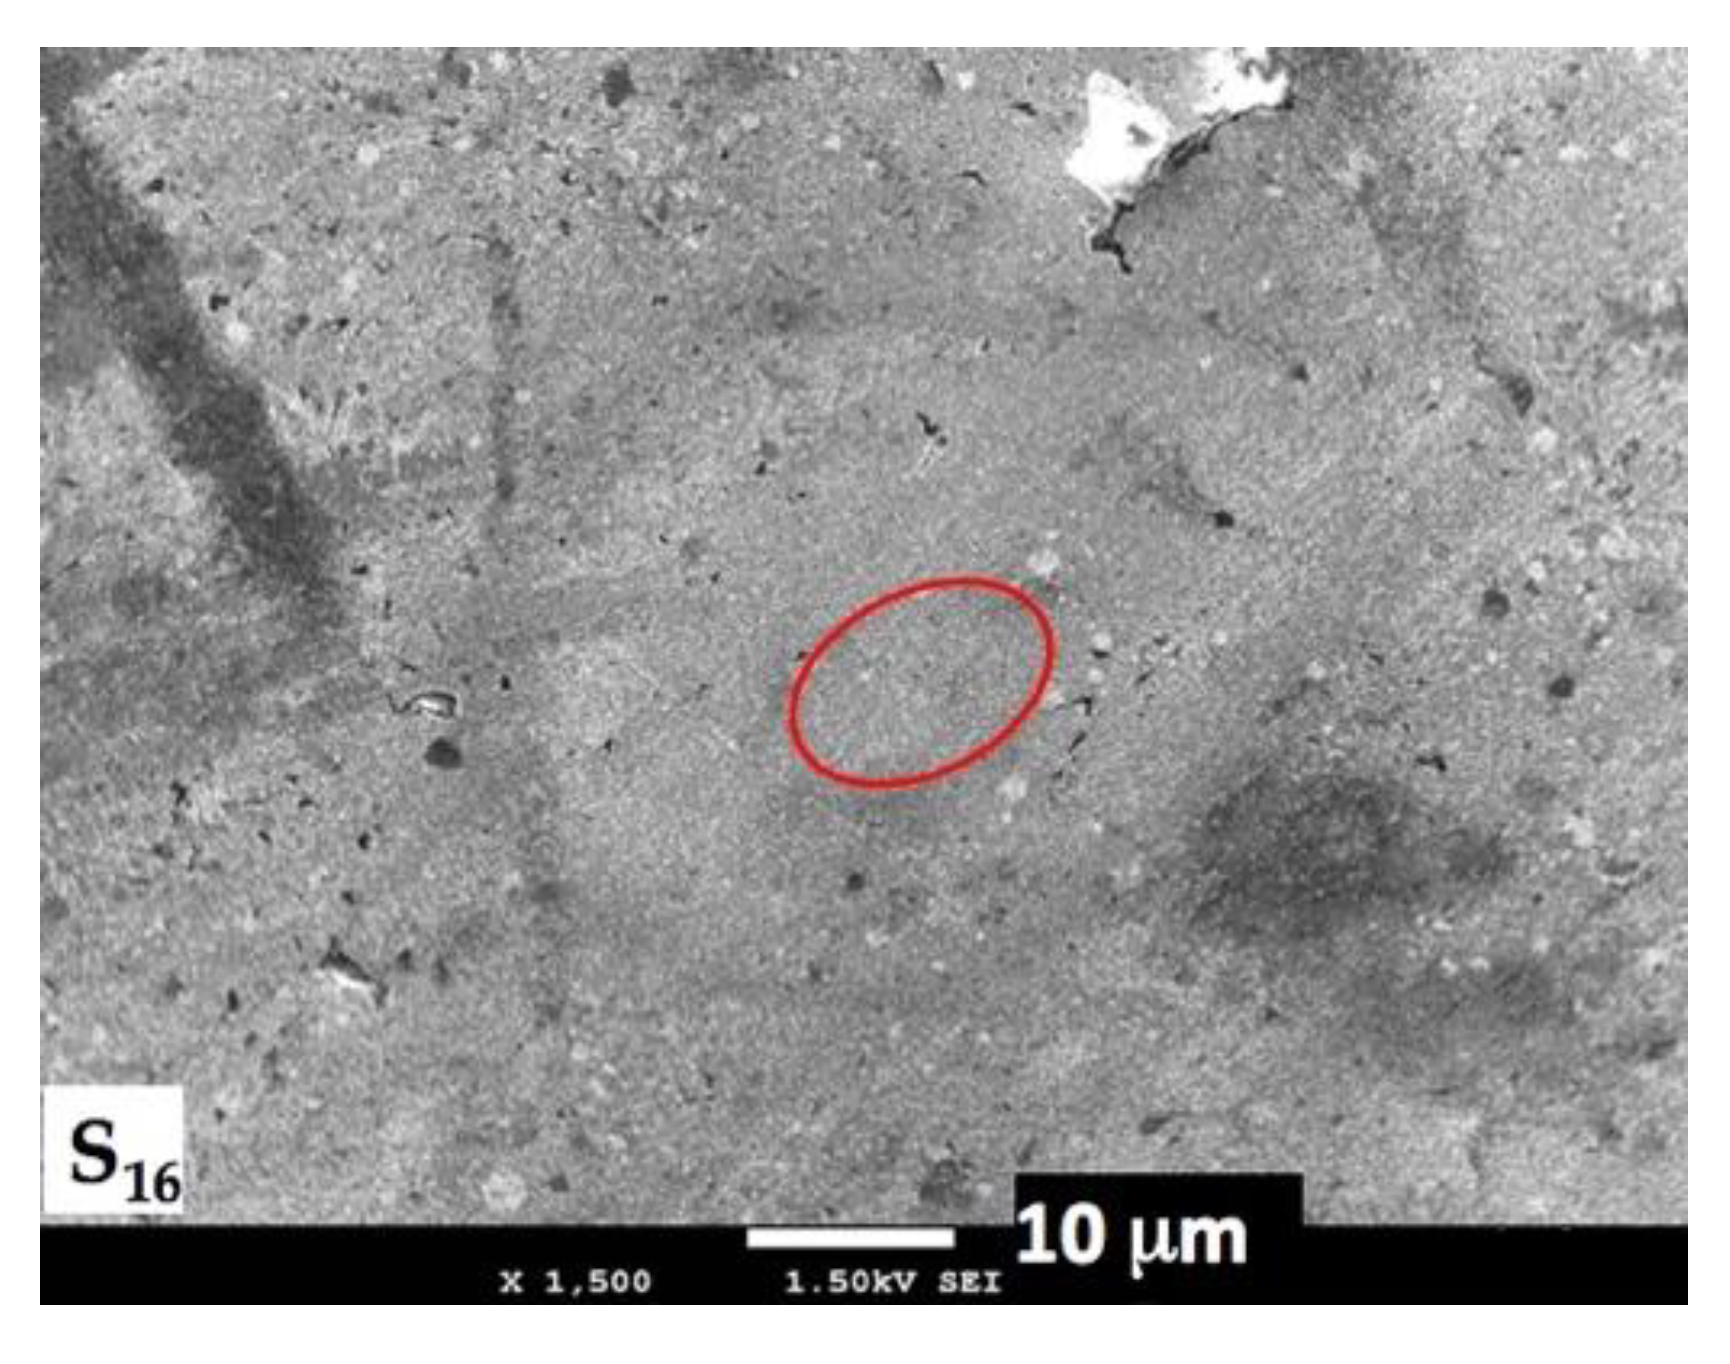
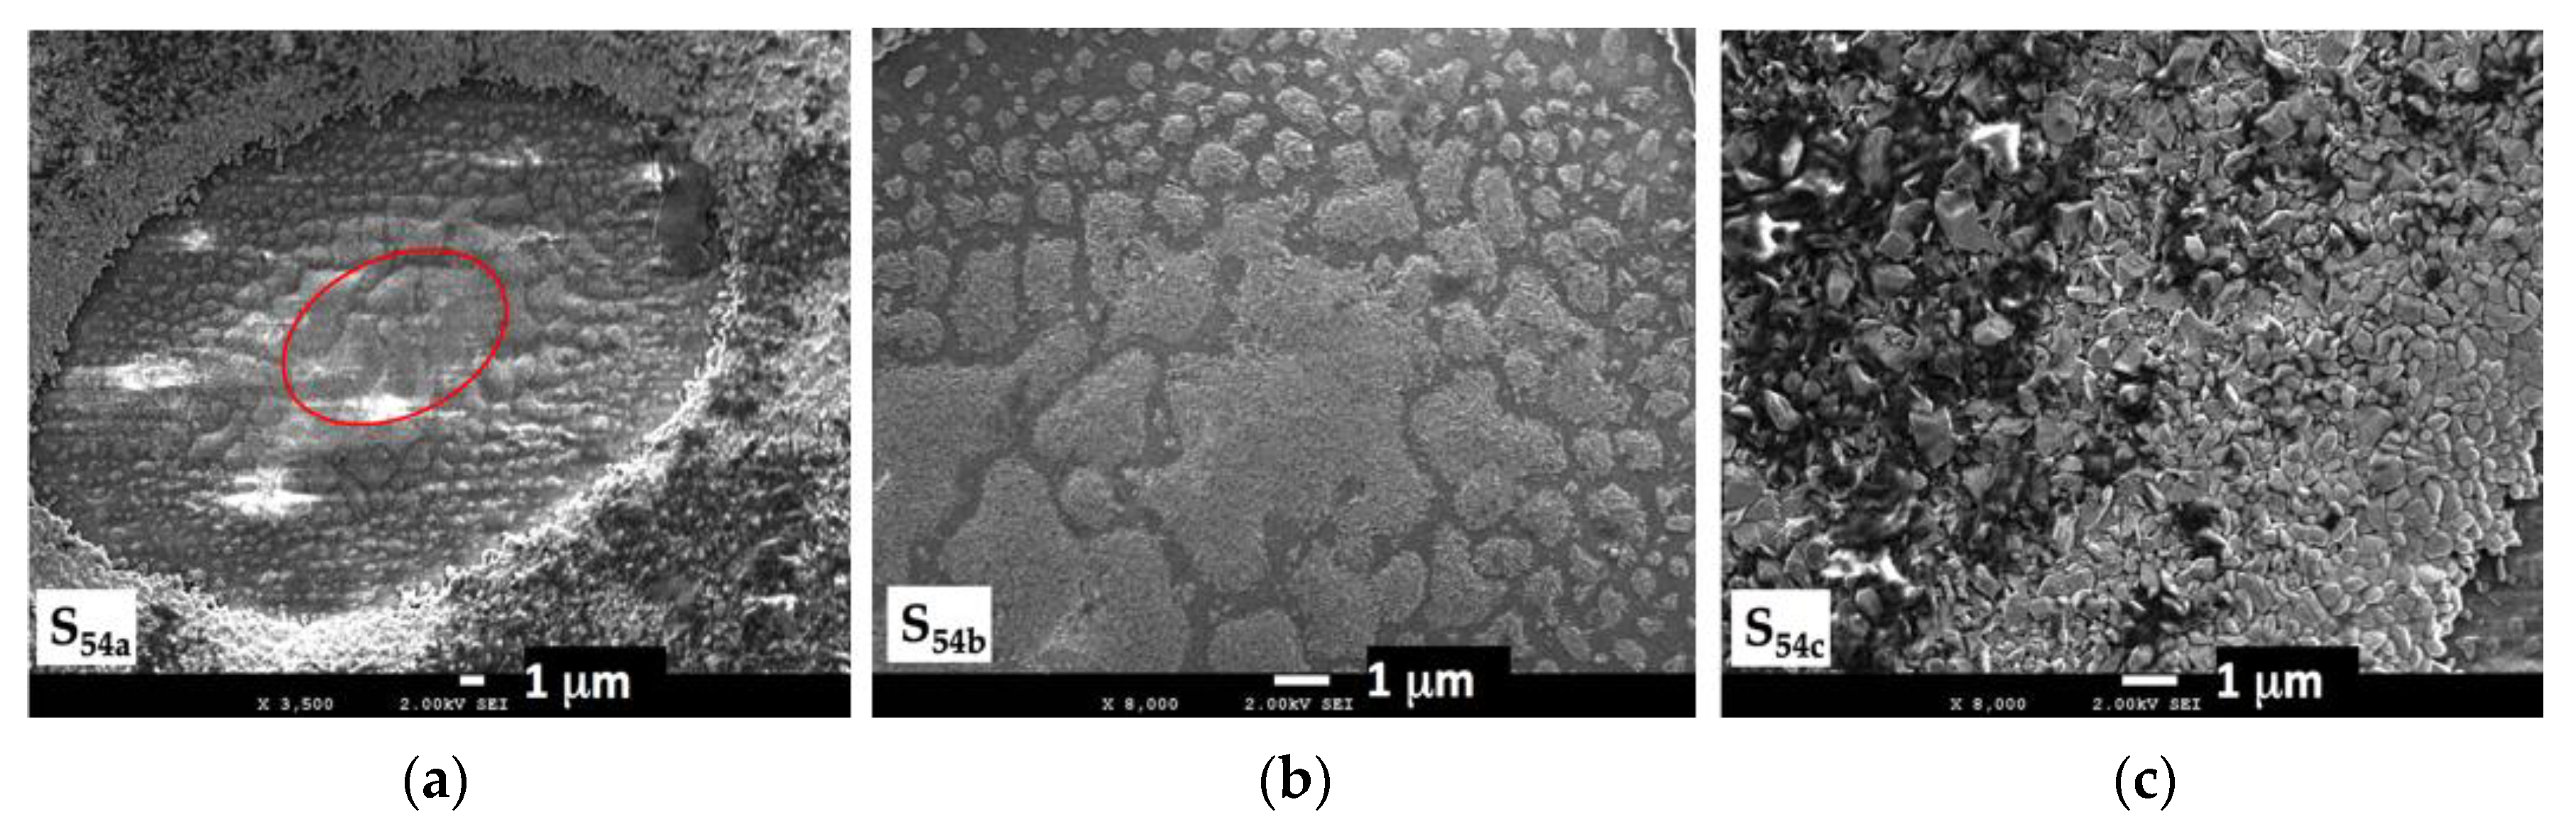
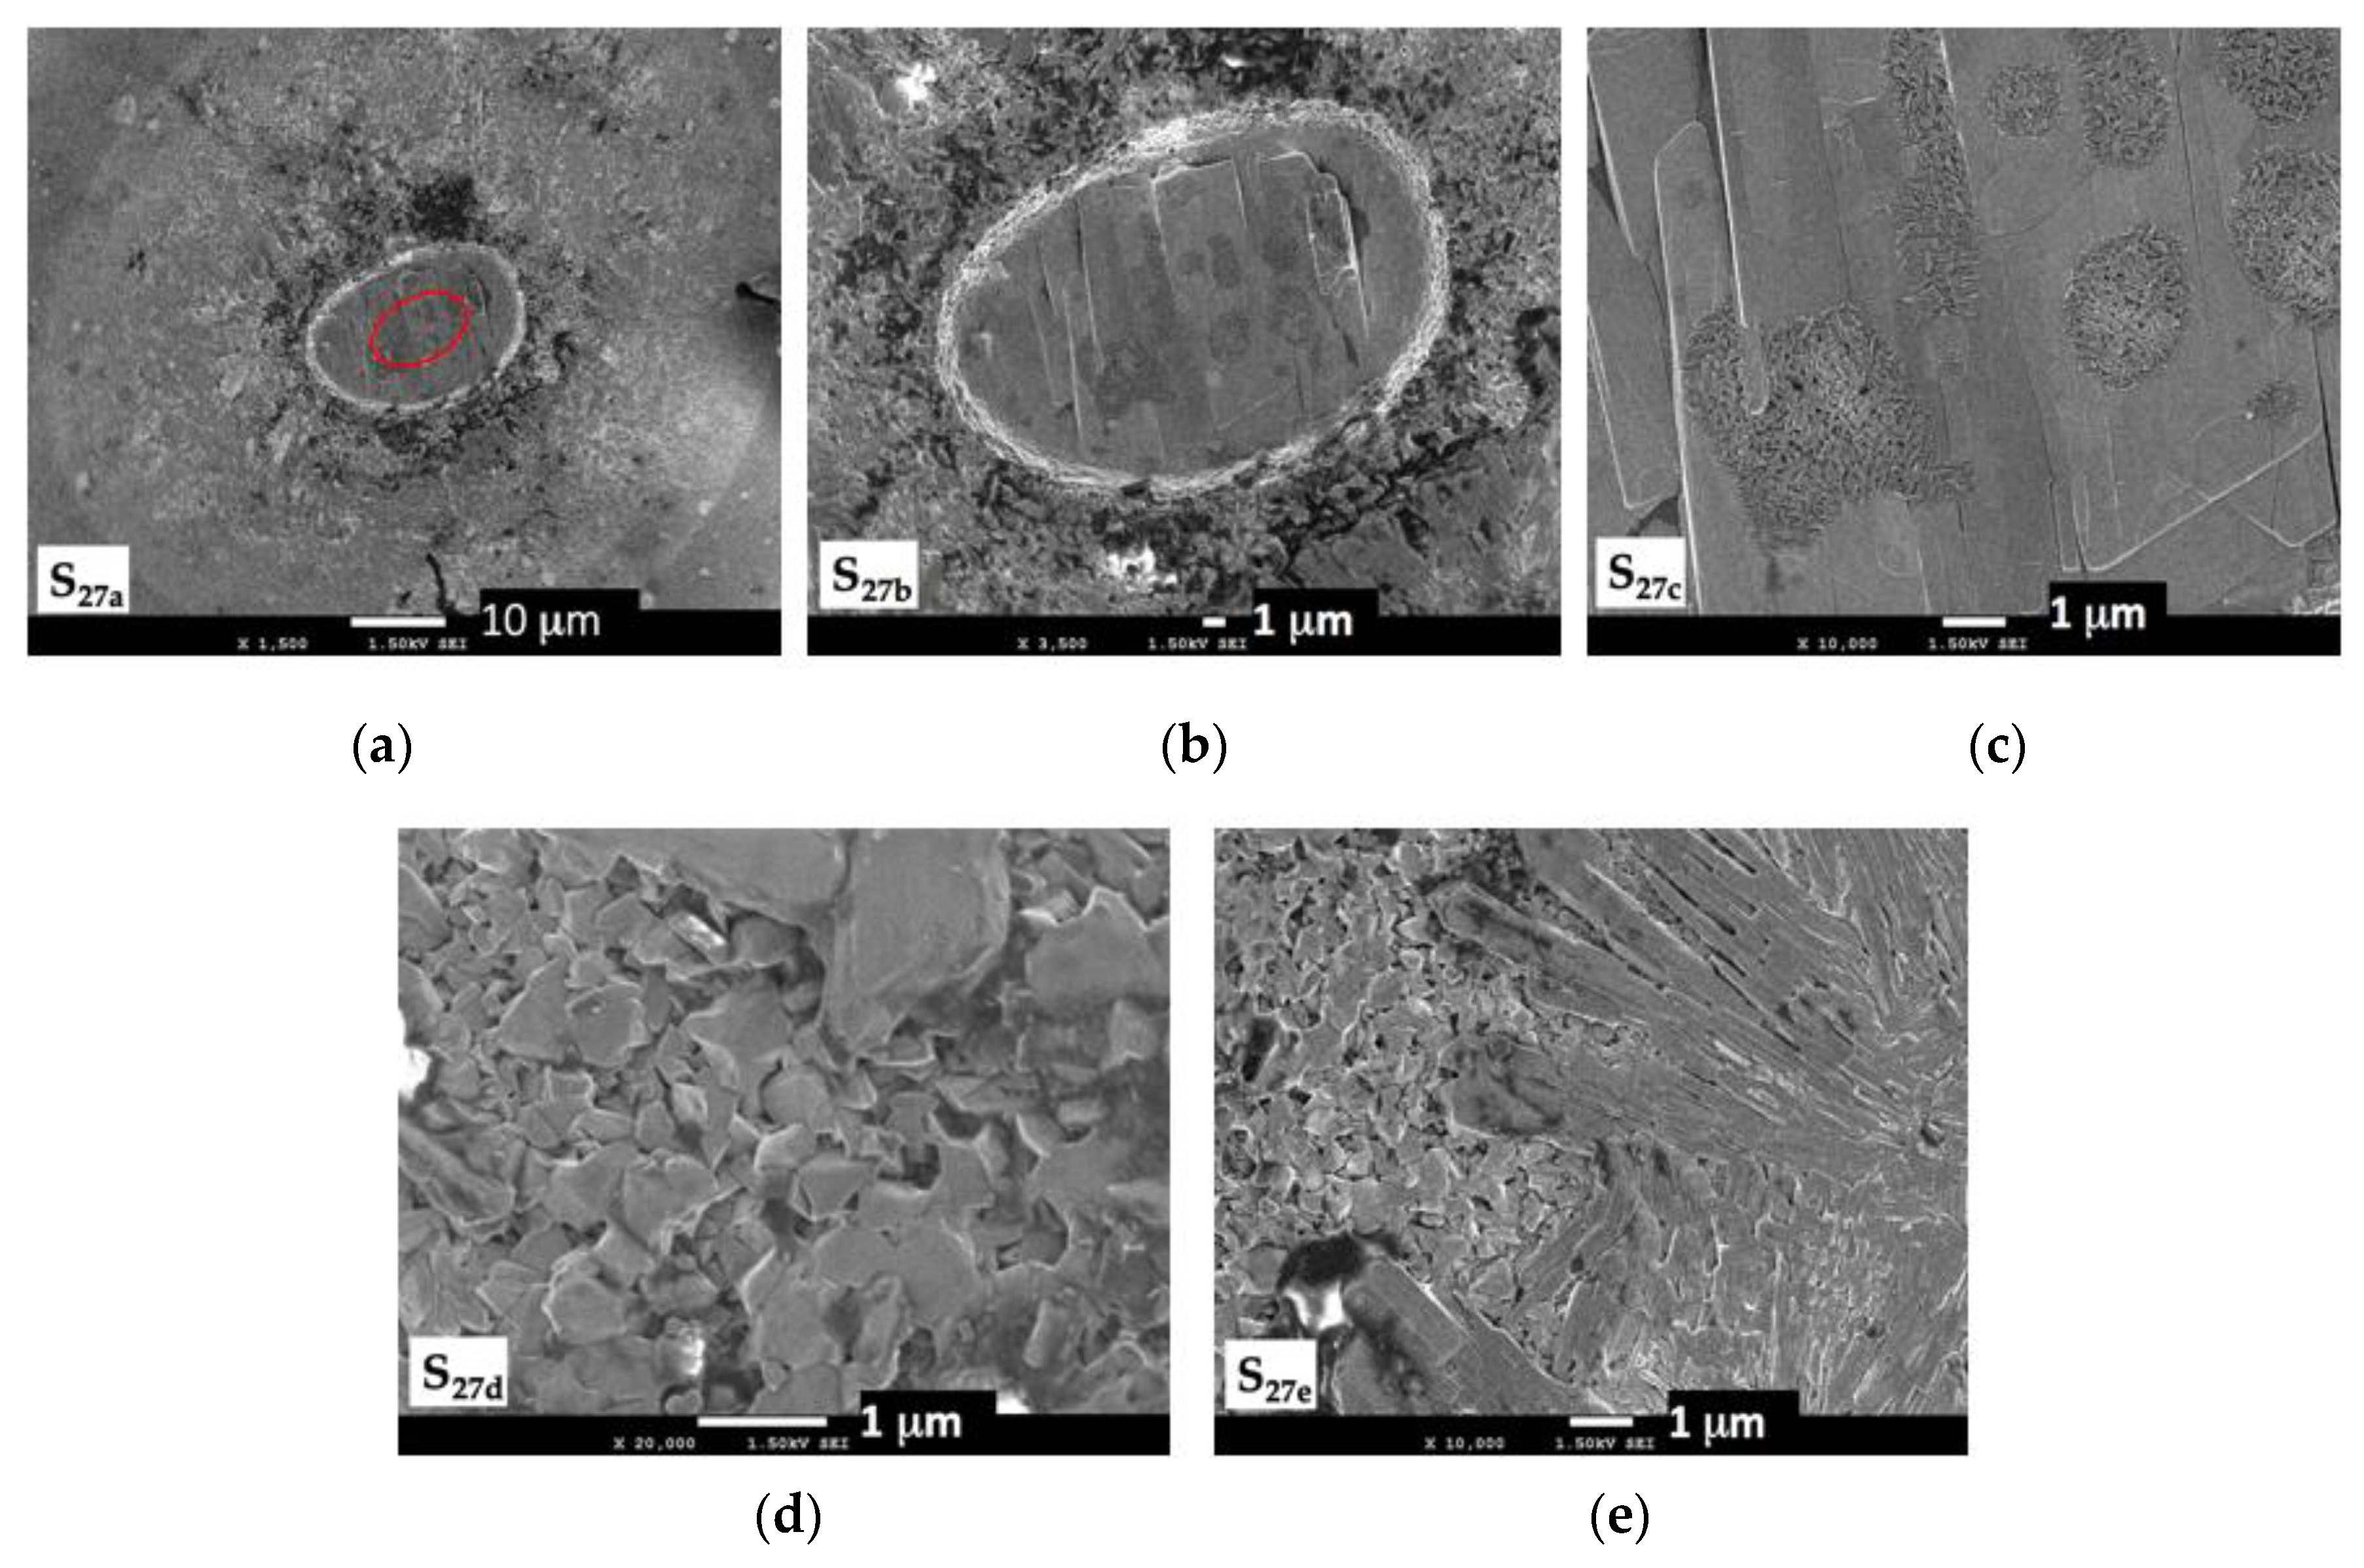
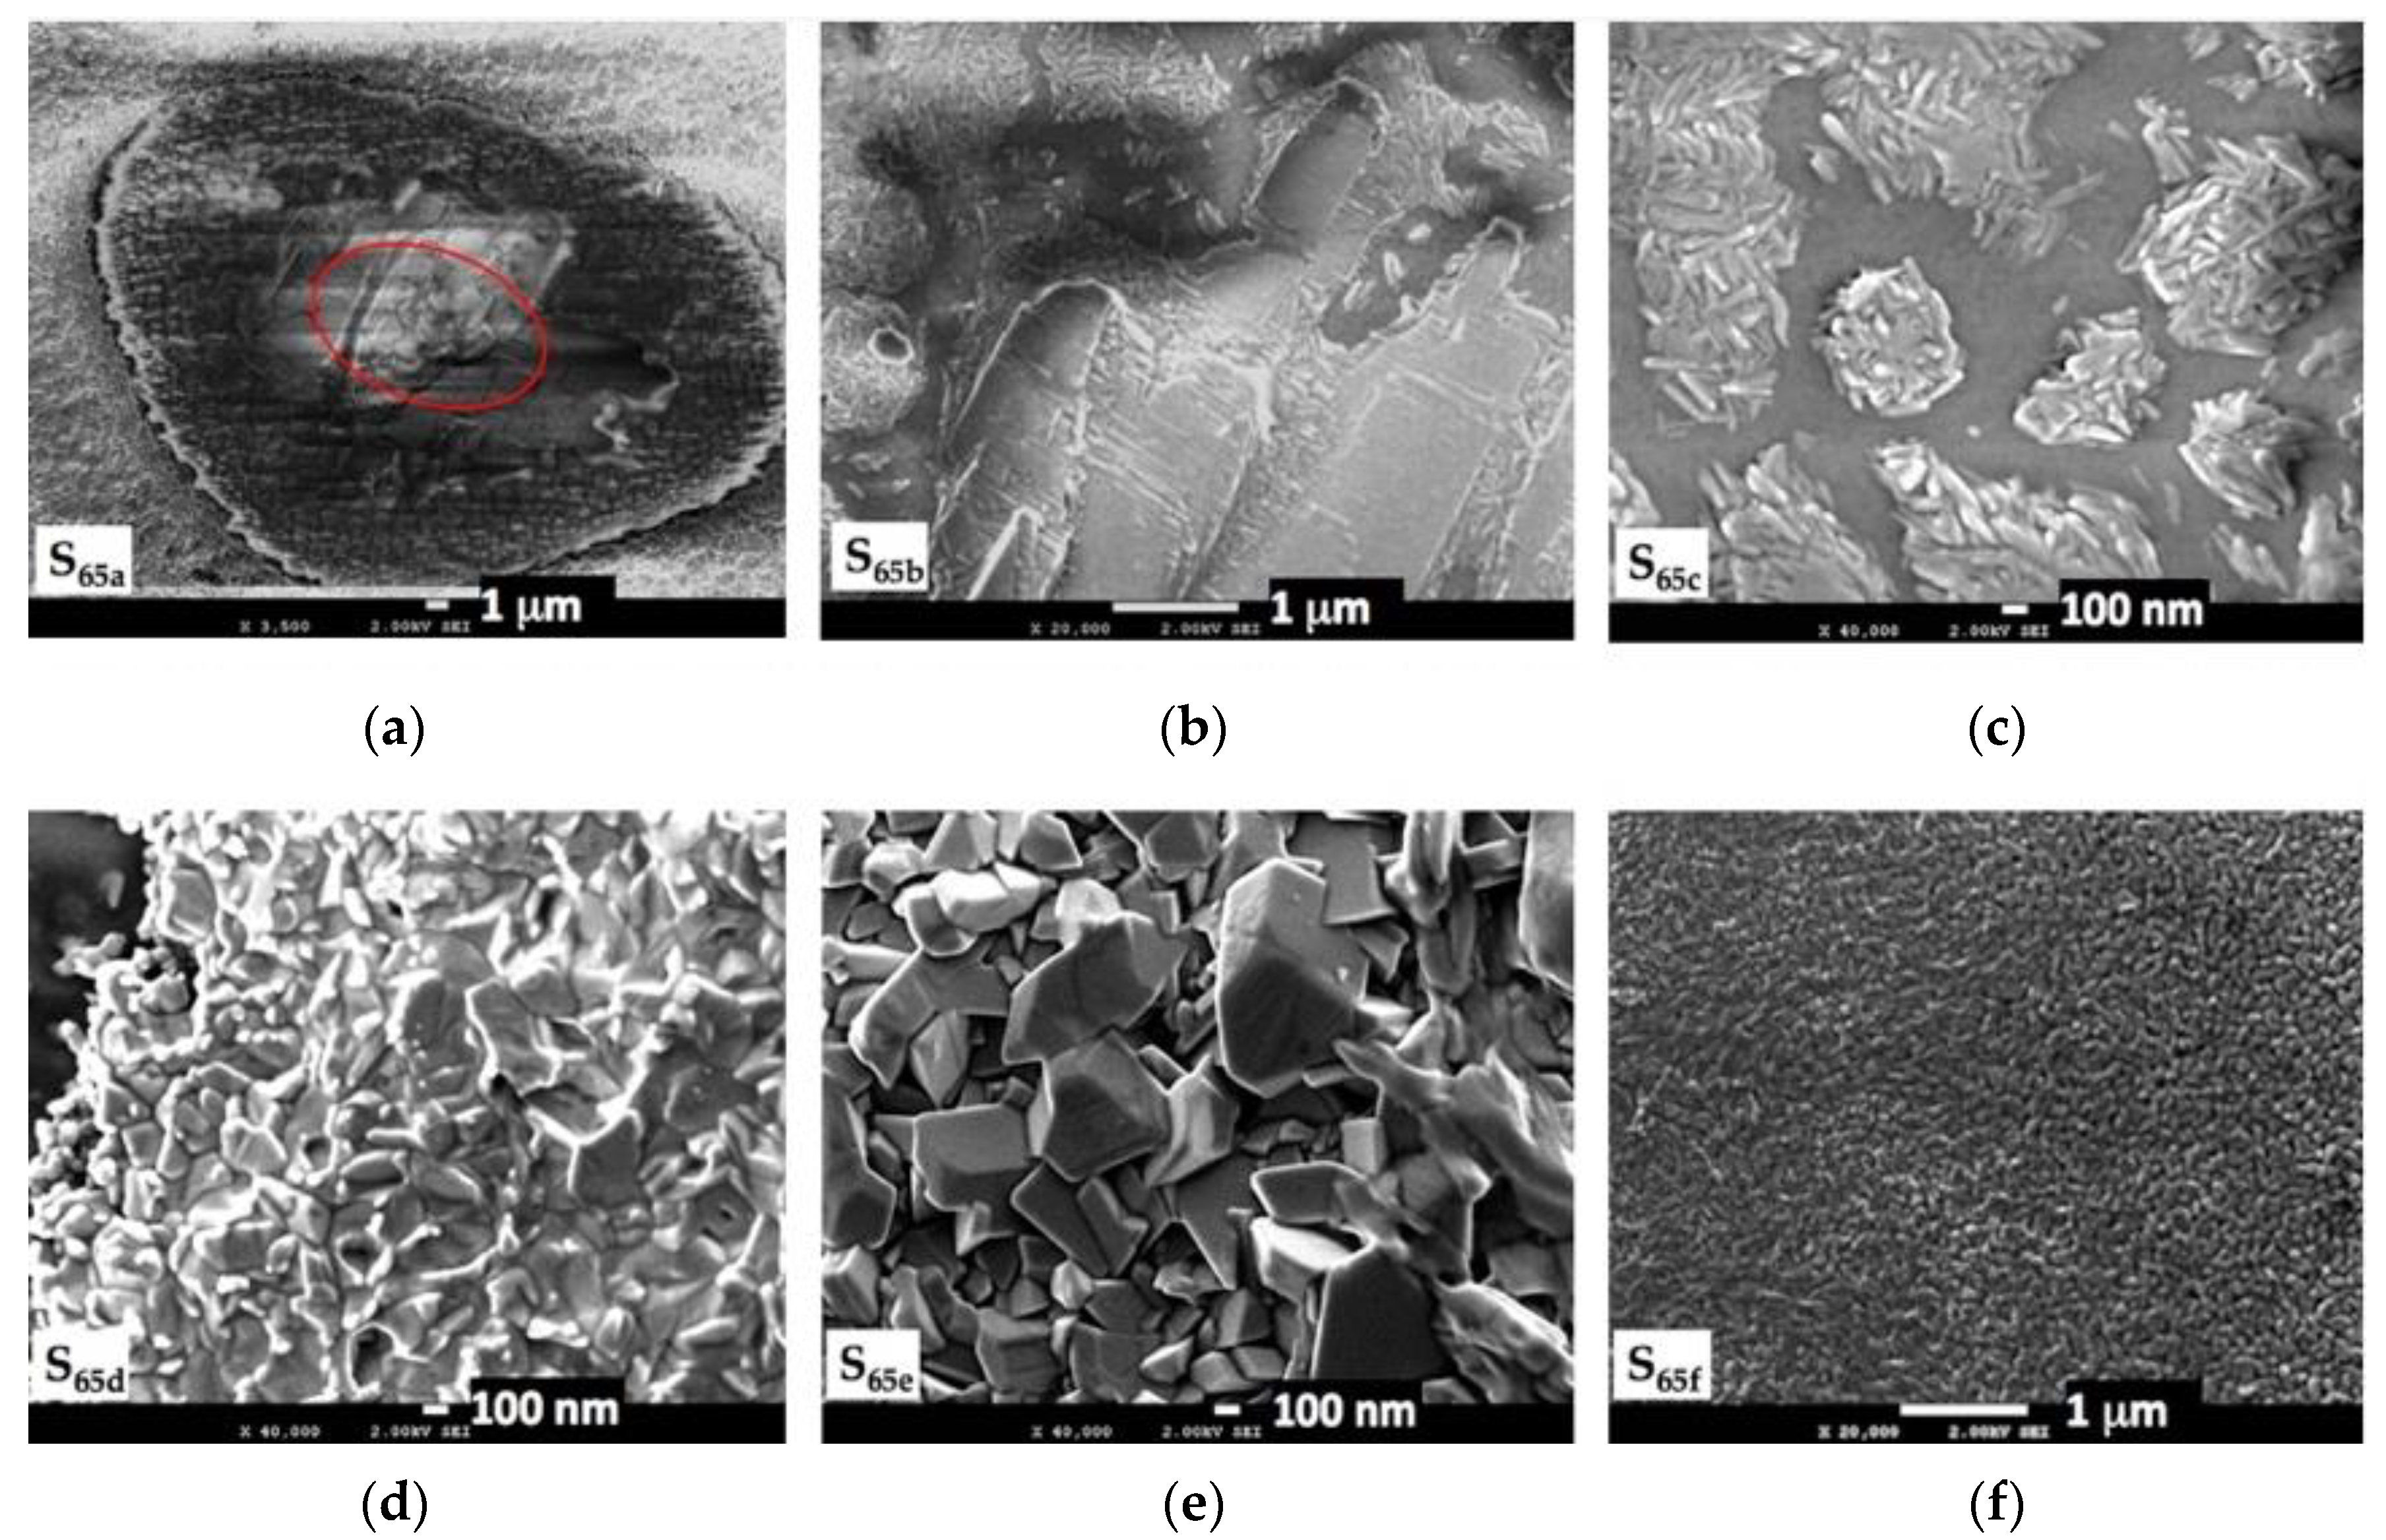
3.3. Morphological Features of the Laser-Modified Surface

The femtosecond laser irradiation of the initial molybdenum film promotes the growth of both micro and nano-sized structures along with the chemical/phase changes. The morphological features that accompany the spatially resolved oxide phases already discussed in the previous section are depicted below.
Figure 8 shows the SEM micrograph for the S16 laser-irradiated spot. At the lowest per-pulse fluence and 3 min exposure time, the film surface just starts to show a light texture modification. The size of the modified area is approximately 40 μm (the red ellipse represents the laser beam waist on the film). At this spot, the synthesis of m-MoO2 was obtained across the whole spot.
A much more complex morphology is obtained for the laser-irradiated spot S54, as shown in Figure 9. The center zone develops an elliptical shallow crater that mimics the shape of the laser beam waist (red ellipse); this crater reaches 20 μm in its short axis and 31 μm in its long axis (S54a). It can be seen that the crater is seeded with a large number of islands; a magnified image (S54b) allows seeing that these islands are composed by a sort of nano bar. Notice that Navas et al. reported molybdenum oxide nano bars in [54]. The structure that surrounds the crater (S54c) is a polyhedral one with submicron particles. The crater islands are made of m-Mo8O23 according to the Raman results in Figure 5, while the polyhedral structure is constituted by m-MoO2.
The laser-irradiated spot S27 has a modified zone that is approximately 85 μm across, as seen in Figure 10. At the center of the spot, a quasi-elliptical shallow crater forms (the red ellipse represents the laser beam waist); this crater is surrounded by three concentric rings with distinct textures (S27a). The quasi-elliptical crater reaches 15 μm in its short axis and 22 μm in its long axis (S27b); notice that in this case, the crater is filled with a stratified lamellar structure. A magnified image of the crater allows clearly seeing several nanostructured islands nucleating at specific sites within the lamellar structure (S27c); according to the Raman results, this lamellar structure corresponds to o-Mo18O52. The nanostructures at the nucleating sites are agglomerated nano bars at a size in the order of 50–60 nm (width) by 300–400 nm (length). The ring next to the crater shows polyhedral submicron particles (S27d), which correspond to the coexisting m-MoO2, o-Mo4O11, and o-Mo18O52 oxide phases, as shown by the spatially resolved Raman measurements. The outer ring next to it (S27e) has also a stratified o-Mo18O52 lamellar structure similar to the one formed in the crater.
Figure 11 shows the morphological features for the laser-irradiated spot S65, where similarly to the already analyzed cases, there is a quasi-elliptical crater formed at the center of the spot (the red ellipse represents the laser beam waist). The crater dimensions are 23 μm in its short axis and 32 μm in its long axis (S65a). A stratified layered structure is observed right at the center of the crater; the corresponding Raman measurements at that location show that this layered structure is composed by α-MoO3. Close to the layered structure, there are a large number of islands (S65b). A magnified image of the islands shows that these are conglomerates of nano bars of dimensions of approximately 50 nm (width) by 100–250 nm (length) randomly orientated (S65c). Distinct morphological features can be seen as we analyze the irradiated spot toward the outer radial direction. Next to the crater (S65d), a polyhedral growth produces particles less than 500 nm in size. Further out, more faceted particles grow with sizes from 100 nm up to 1 μm (S65e). At the edge of the laser-irradiated spot, a uniformly granular structure is formed with a grain size in the order of 60 nm (S65f). From the Raman measurements, we identify the polyhedral structures as m-MoO2, while the granular structure is composed by the o-Mo4O11 and m-Mo8O23 oxide phases.

4. Discussion

The above-presented results demonstrate the feasibility of rapid formation of multi-phase molybdenum oxides under a high repetition rate of femtosecond laser irradiation. As shown in Figure 2, there exists a right combination of per-pulse laser fluence and exposure time, which leads to the consistent formation of specific molybdenum oxide at the very center of the irradiated spot. This means that the oxide growth is the result of what we may call an integrated fluence. In other words, incubation and/or thermal accumulative effects drive the oxide formation. This is confirmed by the increasing dimensions of the modified region as either the per-pulse fluence or exposure time increases. The varying stoichiometry, phase type, and morphology from the center to the edge (radial direction) of the modified region reveal a temperature gradient established by heat diffusion, from the center of the heat source, i.e., from the laser-illuminated spot outwards. It is interesting what happens during laser exposure, since at the very beginning, for a certain number of delivered laser pulses, the optical absorption coefficient is very high (in the order of 104 cm−1) for the initially metallic molybdenum; however, this radically changes within the first few seconds of laser irradiation once the film surface starts to oxidize. In fact, for a sufficient exposure time, MoO3 is formed right at the center of the irradiation spot. Molybdenum trioxide is a transparent material, which means that its optical absorption coefficient is negligible. Therefore, at the beginning, a large amount of heat is generated by the laser, followed by rapidly rising the temperature, but as time goes by, the optical absorption coefficient seen by the incoming laser pulses drops fast due to oxidation, up to the point where it approaches zero. This makes the thermal scenario quite complex, since the temperature profile across the laser-modified region does not stay Gaussian, as it could be expected, and as it surely is at the beginning of the exposure. Instead, as time progresses, the center of the irradiated spot sees less and less heat generated because of the dropping of the optical absorption coefficient. At some point during the irradiation, the initially Gaussian temperature profile will get a deep hole right at the center; i.e., the center is colder than its surroundings in the modified zone. Under these circumstances, the synthesis of the presented molybdenum oxide is not an easy task to explain, mainly because several physical and optical parameters (thermal diffusion coefficient, specific heat capacity, density, optical absorption and reflectance, etc.) are dynamically changing with the delivering of pulse after pulse at a very high repetition rate.
To the best of our knowledge, there are no reports in the literature about the conventional thermal treatment of molybdenum in air to produce the sort of molybdenum oxides that we obtain in this work. If that was already in the literature, it could be possible to infer the temperatures that are achieved during the fs laser irradiation of the molybdenum thin films in the present work. The closest report in this direction is the one by Dieterle et al. in [40], where they study different molybdenum oxides MoO3−x obtained in the 670–923 K temperature range. However, they use different molybdenum precursors and different atmospheres including air, oxygen, and nitrogen to synthesize the MoO3−x. Currently, in our research group, there is work underway to obtain molybdenum oxides by the simple thermal treatment in air of the same molybdenum thin films used in the present work. Then, this will allow us to contrast (temperature-wise) conventional thermally obtained molybdenum oxides against fs laser-induced molybdenum oxides. We have to notice though that these two methods are not equivalent, since in the conventional thermal treatment, there is no electric field involved in the molybdenum oxide synthesis, while in the fs laser-induced molybdenum oxide synthesis, there is a very strong electric field present.
No matter the complex and challenging opto-thermal scenario during synthesis, we can point out a few observations. There are clear spatially resolved phase transitions when looking into the radial direction. Consistently, there is always a distinct oxide phase forming right at the center of the irradiated spot; these specific phases are either m-MoO2, m-Mo8O23, o-Mo18O52, or α-MoO3. Then, going outwards in the modified region, there is a large zone where the dominant phase is m-MoO2 with a crystallinity degree that decays as a function of the distance to the center of the spot. We can see in Figure 4, Figure 5 and Figure 7 how the Raman spectra for m-MoO2 loses its sharpness and the peaks broaden the farther from the center the measurement is taken. This is not surprising if we assume a temperature profile that decays from the center to the edge of the laser-modified zone. In the case presented in Figure 5, the far end of the modified zone sees another transition to amorphous molybdenum oxide; while in the case of Figure 6 and Figure 7, we see a mixture of the o-Mo4O11 and m-Mo8O23 oxide phases forming at that far end. We must note that there are some unknown features accompanying this mixture of phases, which are provided by some Raman peaks that are not identified in the literature as belonging to these oxide phases. Interestingly, while in the cases of Figure 5; Figure 7, the dominant phase in between the center and the edge of the laser-modified zone is m-MoO2; in the case of Figure 6, there is a mixture of the m-MoO2, o-Mo4O11, and o-Mo18O52 oxide phases forming at that same zone. In Figure 6 and Figure 7, the transition at the edge of the laser-modified zone is to the mixture of the o-Mo4O11 and m-Mo8O23 oxide phases, and we can note how the case in Figure 6 obtains a better crystallization than that in Figure 7. This may be explained by the fact that in Figure 6, we have the case of a longer exposure time that would allow for improved crystalline formation.
Morphology wise, we found that at the center of the irradiated spot where the laser beam directly lands, there is always an island or a lamellar formation. The islands are composed by nano bar agglomerates, and in some cases, these islands nucleate either around the lamellar structure or within the lamellar pieces. The zone in between the center crater and the edge of the laser-modified region is consistently occupied by polyhedral crystals with submicron sizes composed mainly by m-MoO2, and in some areas, we can also see lamellar structure associated to the o-Mo18O52 oxide phase. At the far end of the modified zone a nanosized granular morphology dominates presumably as a result of competing oxide phases, o-Mo4O11 and m-Mo8O23.
According to the Raman characterization, either a uniform single phase or a uniform phase mixture covers several concentric rings with different colors (see Figure 5, Figure 6 and Figure 7). This means that those colors are not necessarily heralded from the phase/chemical properties, but it could be that the ring colors are due to the surface morphology; i.e., those are what have been named structured colors.
In case a determined uniform single crystalline phase is required over a large area, it could be achieved by implementing the following protocol, which includes using a top hat beam intensity profile that is accompanied by a raster scan. This would help the purpose of homogenizing the laser heating across the laser-scanned area, creating the appropriate thermal conditions, which will promote the formation of a single crystalline oxide phase. Kotsedi et al. [17] showed the formation of only MoO2 under fs laser irradiation in air by scanning across the molybdenum film sample.

5. Conclusions

We have demonstrated a successful optical method for simple, rapid, clean, and versatile synthesis of transition metal oxides. Femtosecond lasers have become more accessible with time, and several industrial models are available from brands all around the world. This enables the fast and low-cost production of transition metal oxides that can be highly density packaged thanks to the ability of laser beams to be focused down to small spot sizes. As shown and discussed in this work, spatially resolved multi-phase oxide synthesis is possible in tiny areas under conveniently adjusted irradiation conditions. This might lead to tackle interesting challenges in industry and technology in the field of micro and nano sensors, energy storage, smart optical materials, photonics, and plasmonics.
As pointed out in the previous section, a full explanation of the laser-induced synthesis requires a careful analysis of the opto-thermal scenario during irradiation. Therefore, there is an open window for developing a suitable model that considers physical and optical dynamically changing variables in order to reconstruct the opto-thermal evolution around the synthesis. Another interesting situation is the fact that the oxide that forms directly at the laser beam waist position synthesizes under the influence of both the very strong electric field of the femtosecond pulses and the generated heat, while the oxides that synthesize in the surroundings form under the influence of heat alone.

6. Patents

Camacho-Lopez, S.; Camacho-Lopez, M. A. Process for obtaining metal oxides by low energy laser pulses irradiation of metal films. US 2014/0227457 A2.

Author Contributions

Conceptualization: S.C.-L. and M.C.-L. (Marco Camacho-Lopez); methodology: M.C.-L. (Miroslava Cano-Lara); formal analysis: S.C.-L. and M.C.-L. (Marco Camacho-Lopez); investigation: S.C.-L. and M.C.-L. (Miroslava Cano-Lara); resources: S.C.-L.; data curation: M.C.-L. (Miroslava Cano-Lara); writing—original draft preparation: S.C.-L.; writing—review and editing: S.C.-L. and M.C.-L. (Marco Camacho-Lopez); funding acquisition: S.C.-L. All authors have read and agreed to the published version of the manuscript.

Funding

This research was partially funded by CONACyT grant numbers 57309 and FONCICyT-246648; and partially funded by AFOSR grant numbers FA9550-10-1-0212, FA9550-13-1-0173, FA9550-15-1-0142.

Acknowledgments

We thank Alejandro Esparza-Garcia from Laboratorio de Películas Delgadas del ICAT-UNAM, for his technical support by providing us with the molybdenum thin films used in the present study, and his valuable input in the discussions about the thin films fabrication and characterization. We also thank Fabián Alonso Cordero from Departamento de Óptica, CICESE, and Dora A. Solis-Casados from CCIQS UAEM-UNAM for their support with SEM characterization along this investigation.

Conflicts of Interest

The authors declare no conflict of interest.

References

  1. Wautelet, M. Solid Surfaces Under Laser Irradiation. Surf. Sci. 1980, 95, 299–308. [Google Scholar] [CrossRef]
  2. Bauerle, D. Chemical Processing with Lasers: Recent developments. Appl. Phys. B 1988, 46, 261–270. [Google Scholar] [CrossRef]
  3. Wautelet, M. Laser-Assisted Reaction of Metals with Oxygen. Appl. Phys. A 1990, 50, 131–139. [Google Scholar] [CrossRef]
  4. Kumari, L.; Lin, J.-H.; Ma, Y.-R. Laser oxidation and wide-band photoluminescence of thermal evaporated bismuth thin films. J. Phys. D Appl. Phys. 2008, 41, 1–7. [Google Scholar] [CrossRef]
  5. Zepeda, M.A.; Picquart, M.; Haro-Poniatowski, E. Laser induced oxidation effects in bismuth thin films. Mater. Res. Soc. Symp. Proc. 2012, 1477, 1–6. [Google Scholar] [CrossRef]
  6. Steele, J.A.; Lewis, R.A. In situ micro-Raman studies of laser-induced bismuth oxidation reveals metastability of β-Bi2O3 microislands. Opt. Mater. Express 2014, 4, 2133–2142. [Google Scholar] [CrossRef]
  7. Díaz-Guerra, C.; Almodóvar, P.; Camacho-Lopez, M.; Camacho-López, S.; Piqueras, J. Formation of β-Bi2O3 and δ-Bi2O3 during laser irradiation of Bi films studied in-situ by spatially resolved Raman spectroscopy. J. Alloys Compounds. 2017, 723, 520–526. [Google Scholar] [CrossRef]
  8. Ogale, S.B.; Polman, A.; Quentin, F.O.P.; Roorda, S.; Saris, F.W. Pulsed laser oxidation and nitridation of metal surfaces immersed in liquid media. Appl. Phys. Lett. 1987, 50, 138–140. [Google Scholar] [CrossRef]
  9. Pérez del Pino, A.; Serra, P.; Morenza, J.L. Coloring of titanium by pulsed laser processing in air. Thin Solid Films 2002, 415, 201–205. [Google Scholar] [CrossRef]
  10. Pérez del Pino, A.; Fernández-Pradas, J.M.; Serra, P.; Morenza, J.L. Coloring of titanium through laser oxidation: Comparative study with anodizing. Surf. Coat. Technol. 2004, 187, 106–112. [Google Scholar] [CrossRef]
  11. Camacho-López, S.; Evans, R.; Escobar-Alarcón, L.; Camacho-López, M.A.; Camacho-López, M. Polarization-dependent single-beam laser-induced grating-like effects on titanium films. Appl. Surf. Sci. 2008, 255, 3028–3032. [Google Scholar] [CrossRef]
  12. Shupyk, I.; Lavisse, L.; Jouvard, J.-M.; Marco de Lucas, M.C.; Bourgeois, S.; Herbst, F.; Piquemal, J.-Y.; Bozon-Verduraz, F.; Pilloz, M. Study of surface layers and ejected powder formed by oxidation of titanium substrates with a pulsed Nd:YAG laser beam. Appl. Surf. Sci. 2009, 255, 5574–5578. [Google Scholar] [CrossRef]
  13. Cano-Lara, M.; Camacho-López, S.; Esparza-García, A.; Camacho-López, M.A. Laser-induced molybdenum oxide formation by low energy (nJ)–high repetition rate (MHz) femtosecond pulses. Opt. Mater. 2011, 33, 1648–1653. [Google Scholar] [CrossRef]
  14. Baranov, A.V.; Bogdanov, K.V.; Fedorov, A.V.; Yarchuk, M.V.; Ivanov, A.I.; Veiko, V.P.; Berwick, K. Micro-Raman characterization of laser-induced local thermo-oxidation of thin chromium films. J. Raman Spectrosc. 2011, 42, 1780–1783. [Google Scholar] [CrossRef]
  15. Landis, E.C.; Phillips, K.C.; Mazur, E.; Friend, C.M. Formation of nanostructured TiO2 by femtosecond laser irradiation of titanium in O2. J. Appl. Phys. 2012, 112, 1–5. [Google Scholar] [CrossRef]
  16. Camacho-Lopez, S.; Camacho-Lopez, M.; Olea-Mejia, O.; Evans, R.; Castillo-Vega, G.; Camacho-Lopez, M.A.; Herrera-Zaldivar, M.A.; Esparza-García, A.; Banuelos Muñeton, J.G. Processing of metallic thin films using Nd:YAG laser pulses. In Nd YAG Laser; InTech: London, UK, 2012; pp. 23–40. [Google Scholar]
  17. Kotsedi, L.; Mthunzi, P.; Nuru, Z.Y.; Eaton, S.M.; Sechoghela, P.; Mongwaketsi, N.; Ramponi, R.; Maaza, M. Femtosecond laser structuring of molybdenum thin films. Appl. Surf. Sci. 2015, 353, 1334–1341. [Google Scholar] [CrossRef]
  18. Venegas-Castro, A.; Reyes-Contreras, A.; Camacho-López, M.; Olea-Mejía, O.; Camacho-López, S.; Esparza-García, A. Study of the integrated fluence threshold condition for the formation of β-Bi2O3 on Bi thin films by using ns laser pulses. Opt. Laser Technol. 2016, 81, 50–54. [Google Scholar] [CrossRef]
  19. He, S.; Amoruso, S.; Pang, D.; Wang, C.; Hu, M. Chromatic annuli formation and sample oxidation on copper thin films by femtosecond laser. J. Chem. Phys. 2016, 144, 1–10. [Google Scholar] [CrossRef] [Green Version]
  20. Kotsedi, L.; Kaviyarasu, K.; Fuku, X.G.; Eaton, S.M.; Amara, E.H.; Bireche, F.; Ramponi, R.; Maaza, M. Two temperature approach to femtosecond laser oxidation of molybdenum and morphological study. Appl. Surf. Sci. 2017, 421, 213–219. [Google Scholar] [CrossRef]
  21. Esqueda-Barrón, Y.; Herrera, M.; Camacho-López, S. ZnO synthesized in air by fs laser irradiation on metallic Zn thin films. Appl. Surf. Sci. 2018, 439, 681–688. [Google Scholar] [CrossRef]
  22. Cuando-Espitia, N.; Redenius, J.; Mensink, K.; Camacho-López, M.; Camacho-López, S.; Aguilar, G. Influence of oxygen pressure on the fs laser-induced oxidation of molybdenum thin films. Opt. Mater. Express 2018, 8, 581–596. [Google Scholar] [CrossRef]
  23. Camacho-Lopez, S.; Perez-Lopez, I.O.; Cano-Lara, M.; Esparza-Garcia, A.; Maya-Sanchez, M.C.; Reynoso-Hernandez, J.A.; Camacho-Lopez, M. Laser Fluence Dependence of the Electrical Properties of MoO2 Formed by High Repetition Femtosecond Laser Pulses. Phys. Status Solidi A 2018, 215, 1800226. [Google Scholar] [CrossRef]
  24. Dostovalov, A.V.; Korolkov, V.P.; Okotrub, K.A.; Bronnikov, K.A.; Babin, S.A. Oxide composition and period variation of thermochemical LIPSS on chromium films with different thickness. Opt. Express 2018, 26, 7712–7723. [Google Scholar] [CrossRef]
  25. Florian, C.; Déziel, J.-L.; Kirner, S.V.; Siegel, J.; Bonse, J. The Role of the Laser-Induced Oxide Layer in the Formation of Laser-Induced Periodic Surface Structures. Nanomaterials 2020, 10, 147. [Google Scholar] [CrossRef] [Green Version]
  26. Florian, C.; Wonneberger, R.; Undisz, A.; Kirner, S.V.; Wasmuth, K.; Spaltmann, D.; Krüger, J.; Bonse, J. Chemical effects during the formation of various types of femtosecond laser-generated surface structures on titanium alloy. Appl. Phys. A 2020, 126, 1–11. [Google Scholar] [CrossRef] [Green Version]
  27. Reyes-Contreras, A.; Camacho-López, M.; Camacho-López, S.; Olea-Mejía, O.; Esparza-García, A. Laser-induced periodic surface structures on bismuth thin films with ns laser pulses below ablation threshold. Opt. Mater. Express 2017, 7, 1777–1786. [Google Scholar] [CrossRef]
  28. Santillan, R.; Wong, A.; Segovia, P.; Camacho-López, M.; Camacho-López, S. Femtosecond laser-induced periodic surface structures formation on bismuth thin films upon irradiation in ambient air. Opt. Mater. Express 2020, 10, 674–681. [Google Scholar] [CrossRef]
  29. Sanz, M.; Rebollar, E.; Ganeev, R.A.; Castillejo, M. Nanosecond laser-induced periodic surface structures on wide band-gap semiconductors. Appl. Surf. Sci. 2013, 278, 325–329. [Google Scholar] [CrossRef] [Green Version]
  30. Shukla, P.; Waugh, D.G.; Lawrence, J.; Vilar, R. Laser surface structuring of ceramics, metals and polymers for biomedical applications: A review. In Laser Surface Modification of Biomaterials: Techniques and Applications; Elsevier: Amsterdam, The Netherlands, 2016; Volume 2, pp. 281–299. [Google Scholar]
  31. Castillo-Vega, G.R.; Penilla, E.H.; Camacho-López, S.; Aguilar, G.; Garay, J.E. Waveguide-like structures written in transparent polycrystalline ceramics with an ultra-low fluence femtosecond laser. Opt. Mater. Express 2012, 2, 1416–1424. [Google Scholar] [CrossRef]
  32. Rodríguez-Beltrán, R.I.; Paszkiewicz, S.; Szymczyk, A.; Rosłaniec, Z.; Nogales, A.; Ezquerra, T.A.; Castillejo, M.; Moreno, P.; Rebollar, E. Laser-induced periodic surface structures on polymer nanocomposites with carbon nano additives. Appl. Phys. A 2017, 123, 1–7. [Google Scholar] [CrossRef]
  33. Prada-Rodrigo, J.; Rodríguez-Beltrán, R.I.; Paszkiewicz, S.; Szymczyk, A.; Ezquerra, T.A.; Moreno, P.; Rebollar, E. Laser-Induced Periodic Surface Structuring of Poly(trimethylene terephthalate) Films Containing Tungsten Disulfide Nanotubes. Polymers 2020, 12, 1090. [Google Scholar] [CrossRef] [PubMed]
  34. Chippindale, A.M.; Cheetham, A.K. The Oxide Chemistry of Molybdenum. In Molybdenum: An Outline of Chemistry and Uses; Elsevier: Amsterdam, The Netherlands, 1994; Volume 19, pp. 146–184. [Google Scholar]
  35. Alves de Castro, I.; Datta, R.; Ou, J.; Castellanos-Gomez, A.; Sriram, S.; Daeneke, T.; Kalantar-Zadeh, K. Molybdenum oxides—From fundamentals to functionality. Adv. Mater. 2017, 29, 1–31. [Google Scholar]
  36. Spevack, P.A.; McIntyre, N.S. Thermal reduction of molybdenum trioxide. J. Phys. Chem. 1992, 96, 9029–9035. [Google Scholar] [CrossRef]
  37. Seguin, L.; Figlarz, M.; Cavagnat, R.; Lassègues, J.C. Infrared and Raman spectra of MoO3 molybdenum trioxides and MoO3·xH2O molybdenum trioxide hydrates. Spectrochim Acta 1995, 51, 1323–1344. [Google Scholar] [CrossRef]
  38. Dieterle, M. In Situ Resonance Raman Studies of Molybdenum Oxide Based Selective Oxidation Catalysts. Ph.D. Tesis, Technischen Universität, Berlin, Germany, 2001. [Google Scholar]
  39. Blume, A. Synthese und strukturelle Untersuchungen von Molybdän-, Vanadium- und Wolframoxiden als Referenzverbindungen für die heterogene Katalyse. Ph.D. Tesis, Technischen Universität, Berlin, Germany, 2004. [Google Scholar]
  40. Dieterle, M.; Weinberg, G.; Mestl, G. Raman spectroscopy of molybdenum oxides, Part I. Structural characterization of oxygen defects in MoO3−x by DR UV/VIS, Raman spectroscopy and X-ray diffraction. Phys. Chem. Chem. Phys. 2002, 4, 812–821. [Google Scholar] [CrossRef]
  41. Dieterle, M.; Mestl, G. Raman spectroscopy of molybdenum oxides, Part II. Resonance Raman spectroscopic characterization of the molybdenum oxides Mo4O11 and MoO2. Phys. Chem. Chem. Phys. 2002, 4, 822–826. [Google Scholar] [CrossRef]
  42. Camacho-López, M.; Escobar-Alarcón, L.; Picquart, M.; Arroyo, R.G.; Córdoba, G.; Haro-Poniatowski, E. Micro-Raman study of the m-MoO2 to α-MoO3 transformation induced by cw-laser irradiation. Opt. Mater. 2011, 33, 480–484. [Google Scholar] [CrossRef]
  43. Mc. Carron III, E. β-MoO3: A metastable analogue of WO3. J. Chem. Soc. Chem. Commun. 1986, 4, 336–338. [Google Scholar] [CrossRef]
  44. Lunk, H.-J.; Hartl, H.; Hartl, M.A.; Fait, M.J.G.; Ilya, G.; Shenderovich, I.G.; Feist, M.; Frisk, T.A.; Daemen, L.L.; Mauder, D.; et al. Hexagonal Molybdenum Trioxide—Known for 100 Years and Still a Fount of New Discoveries. Inorg. Chem. 2010, 49, 9400–9408. [Google Scholar]
  45. Rahmani, M.B.; Keshmiri, S.H.; Yu, J.; Sadek, A.Z.; Al-Mashat, L.; Moafi, A.; Latham, K.; Li, Y.X.; Wlodarski, W.; Kalantar-Zadeh, K. Gas sensing properties of thermally evaporated lamellar MoO3. Sens. Actuators B 2010, 145, 13–19. [Google Scholar] [CrossRef]
  46. Lakshmi-Narayana, A.; Hussain, O.M.; Ramana, C.V.; Camacho-Lopez, M.; Abdel-Ghany, A.; Hashem, A.; Mauger, A.; Julien, C.M. Molybdenum-Suboxide Thin Films as Anode Layers in Planar Lithium Microbatteries. Electrochem 2020, 2, 12. [Google Scholar] [CrossRef]
  47. Chithambararaj, A.; Sanjini, N.S.; Velmathi, S.; Bose, A.C. Preparation of h-MoO3 and α-MoO3 nanocrystals: Comparative study on photocatalytic degradation of methylene blue under visible light irradiation. Phys. Chem. Chem. Phys. 2013, 15, 14761–14769. [Google Scholar] [CrossRef] [PubMed]
  48. Rajeswari, J.; Kishore, P.S.; Viswanathan, B.; Varadarajan, T.K. One-dimensional MoO2 nanorods for supercapacitor applications. Electrochemistry Communications 2009, 11, 572–575. [Google Scholar] [CrossRef]
  49. Haro-Poniatowski, E.; Julien, C.; Pecquenard, B.; Livage, J.; Camacho-López, M.A. Laser-induced structural transformations in MoO3 investigated by Raman spectroscopy. J. Mater. Res. 1998, 13, 1033–1037. [Google Scholar] [CrossRef]
  50. Almodóvar, P.; Díaz-Guerra, C.; Ramírez-Castellanos, J.; González-Calbet, J.M. In situ local assessment of laser irradiation-induced phase transformations in hexagonal MoO3 microrods. Cryst. Eng.Comm. 2018, 20, 4954–4961. [Google Scholar]
  51. Du, D.; Liu, X.; Korn, G.; Squier, J.; Mourou, G. Laser-induced breakdown by impact ionization in SiO2 with pulse widths from 7 ns to 150 fs. Appl. Phys. Lett. 1994, 64, 3071–3073. [Google Scholar] [CrossRef] [Green Version]
  52. Stuart, B.; Feit, M.; Rubenchik, A.; Shore, B.; Perry, M. Laser-induced damage in dielectrics with nanosecond to subpicosecond pulses. Phys. Rev. Lett. 1995, 74, 2248–2251. [Google Scholar] [CrossRef] [Green Version]
  53. Hermann, J.; Coustillier, G.; Bruneau, S.; Axente, E.; Guillemoles, J.F.; Sentis, M.; Alloncle, P.; Itina, T. Selective ablation of thin films with short and ultrashort laser pulses. Appl. Surf. Sci. 2006, 252, 4814–4818. [Google Scholar] [CrossRef]
  54. Navas, I.; Vinodkumar, R.; Lethy, K.; Detty, A.; Ganesan, V.; Sathe, V.; Mahadevan, P. Growth and characterization of molybdenum oxide nanorods by RF magnetron sputtering and subsequent annealing. J. Phys. D Appl. Phys. 2009, 42, 2–9. [Google Scholar] [CrossRef]
Figure 1. Experimental set up. The Ti:Sapphire linearly polarized laser beam is focused down on to the Mo sample by a 35 mm focal length processing lens. The laser pulse energy is adjusted by using an attenuator made of a half-wave plate and a linear polarizer. The ETP 500 mm focal length lens together with the CCD camera, and the 35 mm processing lens, make an image relay optical system for visualizing the target (Mo sample) plane.
Crystals 10 00629 g001
Figure 2. Optical transformation of the initial molybdenum film under increasing per-pulse laser fluence and increasing exposure time. Laser irradiation with fs laser pulses (60 fs) delivered at a 70 MHz repetition rate. The background color coding is related to the oxide phase that is obtained at the center for each irradiated spot (see Section 3.2).
Crystals 10 00629 g002
Figure 3. Representative Raman spectra for the center at each irradiated spot within the five background colored frame blocks (dark-red, blue, green, light-red, black) in Figure 2. (a) a-MoOx (amorphous molybdenum oxide); (b) m-MoO2; (c) m-Mo8O23; (d) α-MoO3; (e) o-Mo18O52.
Crystals 10 00629 g003
Figure 4. Optical micrograph (a) with I, II, III the positions where Raman measurements were taken, and spatially resolved Raman spectra (b) for the irradiated spot S16 at per-pulse laser fluence 1.4 mJ/cm2 and 3 min exposure time.
Crystals 10 00629 g004
Figure 5. Optical micrograph (a) with I–VII the positions where Raman measurements were taken, and spatially resolved Raman spectra (b) for the irradiated spot S54 at per-pulse laser fluence 3.6 mJ/cm2 and 30 s exposure time.
Crystals 10 00629 g005
Figure 6. Optical micrograph (a) with I–V the positions where Raman measurements were taken, and spatially resolved Raman spectra (b) for the irradiated spot S27 at per-pulse laser fluence 1.9 mJ/cm2 and 6 min exposure time.
Crystals 10 00629 g006
Figure 7. Optical micrograph (a) with I–VII the positions where Raman measurements were taken, and spatially resolved Raman spectra (b) for the irradiated spot S65 at per-pulse laser fluence 4.2 mJ/cm2 and 1 min exposure time.
Crystals 10 00629 g007
Figure 8. SEM micrograph for the irradiated spot S16 at per-pulse laser fluence 1.4 mJ/cm2 and 3 min exposure time.
Crystals 10 00629 g008
Figure 9. SEM micrograph for the irradiated spot S54 at per-pulse laser fluence 3.6 mJ/cm2 and 30 s exposure time. (a) S54a is a close up of the crater; (b) S54b shows a zoom in within the crater; (c) S54c is a magnified image of the edge zone next to the crater.
Crystals 10 00629 g009
Figure 10. SEM micrograph for the irradiated spot S27 at per-pulse laser fluence 1.9 mJ/cm2 and 6 min exposure time. (a) S27a is a wide view of the laser-modified zone; (b) S27b is a close-up of the crater, and (c) S27c is a zoom-in within the crater showing details of the lamellar structure and the nucleating islands; (d) S27d is a magnified image of the edge zone next to the crater; (e) S27e is a magnified image at the zone besides S27d toward the edge of the laser-modified region.
Crystals 10 00629 g010
Figure 11. SEM micrograph for the irradiated spot S65 at a per-pulse laser fluence of 4.2 mJ/cm2 and 1 min exposure time. (ac) S65b and S65c are images that zoom in at the center and the periphery within the crater S65a; (d) S65d is a magnified image of the edge zone next to the crater; (e) S65e is a magnified image at the zone besides S65d toward the edge of the laser-modified region; (f) S65f corresponds to the very outer edge of the laser-modified zone.
Crystals 10 00629 g011
Table 1. Pulsed laser-induced oxidation of metals published in the literature.
Starting MaterialPulse DurationObtained MaterialResearch GroupYear
TitaniumnsTiOOgale et al.1986
[8]
Titaniumns1 a-Ti2O3Pérez del Pino et al.2002
[9,10]
Ti2O3
1 R-TiO2
Titanium thin filmsns1 R-TiO2Camacho-López et al.2008
[11]
Titaniumns1 A-TiO2, R-TiO2Shupyk et al.2009
[12]
Molybdenum thin filmsfsMoO2, Mo4O11Cano Lara et al.2011
[13]
Chromium thin filmsfsCrO2, Cr2O3Baranov et al.2011
[14]
Titanium platesfs1 a-TiO2Landis et al.2012
[15]
Molybdenum thin filmsns, psMoO2Camacho-López et al.2012
[16]
Molybdenum filmsfsMoO2Kotsedi et al.2015
[17]
Bismuth thin filmsnsβ-Bi2O3Venegas-Castro et al.2016
[18]
Copper thin filmsfsCu2O, CuOHe et al.2016
[19]
Molybdenum filmsfsMoO2Kotsedi et al.2017
[20]
Zinc thin filmsfsZnOEsqueda-Barron et al.2018
[21]
Molybdenum thin filmsfsMoO2, MoO3, Mo8O23Cuando-Espitia et al.2018
[22]
Molybdenum thin filmsfsMoO2, Mo4O11Camacho-López et al.2018
[23]
Chromium filmsfsCrO2, Cr2O3Dostovalov et al.2018
[24]
CrN layerfsCrO2, Cr2O3Florian et al.2020
[25]
1 a, A, and R stands for amorphous, anatase, and rutile, respectively.

