Article

Polarization-Sensitive Metamaterials with Tunable Multi-Resonance in the Terahertz Frequency Range

State Key Laboratory of Optoelectronic Materials and Technologies, School of Electronics and Information Technology, Sun Yat-Sen University, Guangzhou 510275, China
*
Author to whom correspondence should be addressed.
Crystals 2020, 10(7), 611; https://doi.org/10.3390/cryst10070611
Submission received: 17 June 2020 / Revised: 7 July 2020 / Accepted: 9 July 2020 / Published: 13 July 2020
(This article belongs to the Special Issue Polarization-Handling Metasurfaces)

Abstract

:
We propose two designs of polarization-sensitive metamaterials (PSMs), which are composed of face-to-face spilt-ring resonators (SRRs) and a cut-wire resonator (CWR) sandwiched by two face-to-face SRRs. For convenient description, they are denoted as PSM_1 and PSM_2, respectively. PSM_1 and PSM_2 are fabricated by tailoring Au layers with periodic configurations on silicon-on-insulator (SOI) substrates. By changing the incident polarization light, the electromagnetic responses of PSM_1 can be manipulated between single-resonance and dual-resonance, while those of PSM_2 exhibit switching behavior between single-resonance and triple-resonance. By enlarging the distance between the gap centers of the two face-to-face SRRs along the y-axis direction, the electromagnetic responses of PSM_1 show switching characteristics from single-resonance to triple-resonance at the transverse electric (TE) mode and from dual-resonance to triple-resonance at the transverse magnetic (TM) mode. PSM_2 exhibits switching characteristics from single-resonance to triple-resonance at the TE mode and from dual-resonance to quad-resonance at the TM mode. Furthermore, by changing the width of the CWR under the condition of two face-to-face SRRs with a constant gap distance, PSM_2 exhibits stable electromagnetic responses at the TE mode and tunable resonances at the TM mode, respectively. This work paves the way to the possibility of metamaterial devices with great tunability, switchable bandwidth, and polarization-dependence characteristics.

1. Introduction

Metamaterials have attracted great attention by researchers due to their extraordinary electromagnetic properties spanning the entire spectra range. These unique optical properties are unavailable in natural materials [1]. Through electromagnetic waves, metamaterials exhibit surprising optical characteristics, such as a negative refraction index [2,3], a biosensor [4], an antenna [5], invisible cloaking [6], and a perfect absorber [7]. The classical design of a metamaterial is the configuration of a split-ring resonator (SRR). There has been much research presenting and demonstrating the use of diversified SRR designs [8,9,10,11,12,13], either symmetrically or asymmetrically, such as cross-shaped SRR [9], V-shaped SRR [10,11], spiral-shaped SRR [12], and multiple SRRs [13]. In view of these extraordinary optical properties of SRR-based metamaterials, there have been extensive studies reported in the different frequency ranges, from microwave, terahertz (THz), and infrared to visible spectra [14,15,16,17,18,19].
Designs utilizing THz metamaterials have attracted a great deal of interest owing to the extraordinary electromagnetic responses of metamaterials and the potential applications of their sensing and imaging characteristics in the THz frequency range [20,21,22,23]. This is a considerable method to obtain excellent transmission characteristics. In addition, metamaterials are useful for tunable THz devices, which have been presented with electrical control [24], optical control [25], thermal control [26], and magnetic control [27]. Recently, THz metamaterials hybridized with microelectromechanical systems (MEMS) have become one of the most striking topics in this field, owing to their advantages of electrostatic tunability, enhanced electro-optic performance, and miniaturized size [10,11]. Many electromagnetic functions can be performed by using the MEMS technique to actively manipulate the metamaterial’s configuration. The MEMS technique has become a notable approach for tunable THz metamaterials, in areas such as resonant filtering, resonant switching, and electromagnetically-induced transparency [28,29].
In this study, we propose two designs of polarization-sensitive metamaterials (PSMs) composed of face-to-face SRRs and a cut-wire resonator (CWR) sandwiched by two face-to-face SRRs, which are noted as PSM_1 and PSM_2, respectively. These two designs are fabricated by tailoring Au layers with periodic configurations on silicon-on-insulator (SOI) substrates. The electromagnetic responses of the proposed PSMs are investigated in order to implement the tunable THz metamaterial with polarization-sensitive multi-resonance characteristics in the THz frequency range. These designs open an avenue by which THz metamaterials could be used in widespread applications, with high portability, flexibility, and compatibility.

2. Materials and Methods

Figure 1 shows the schematic drawings of PSM_1 (Figure 1a) and PSM_2 (
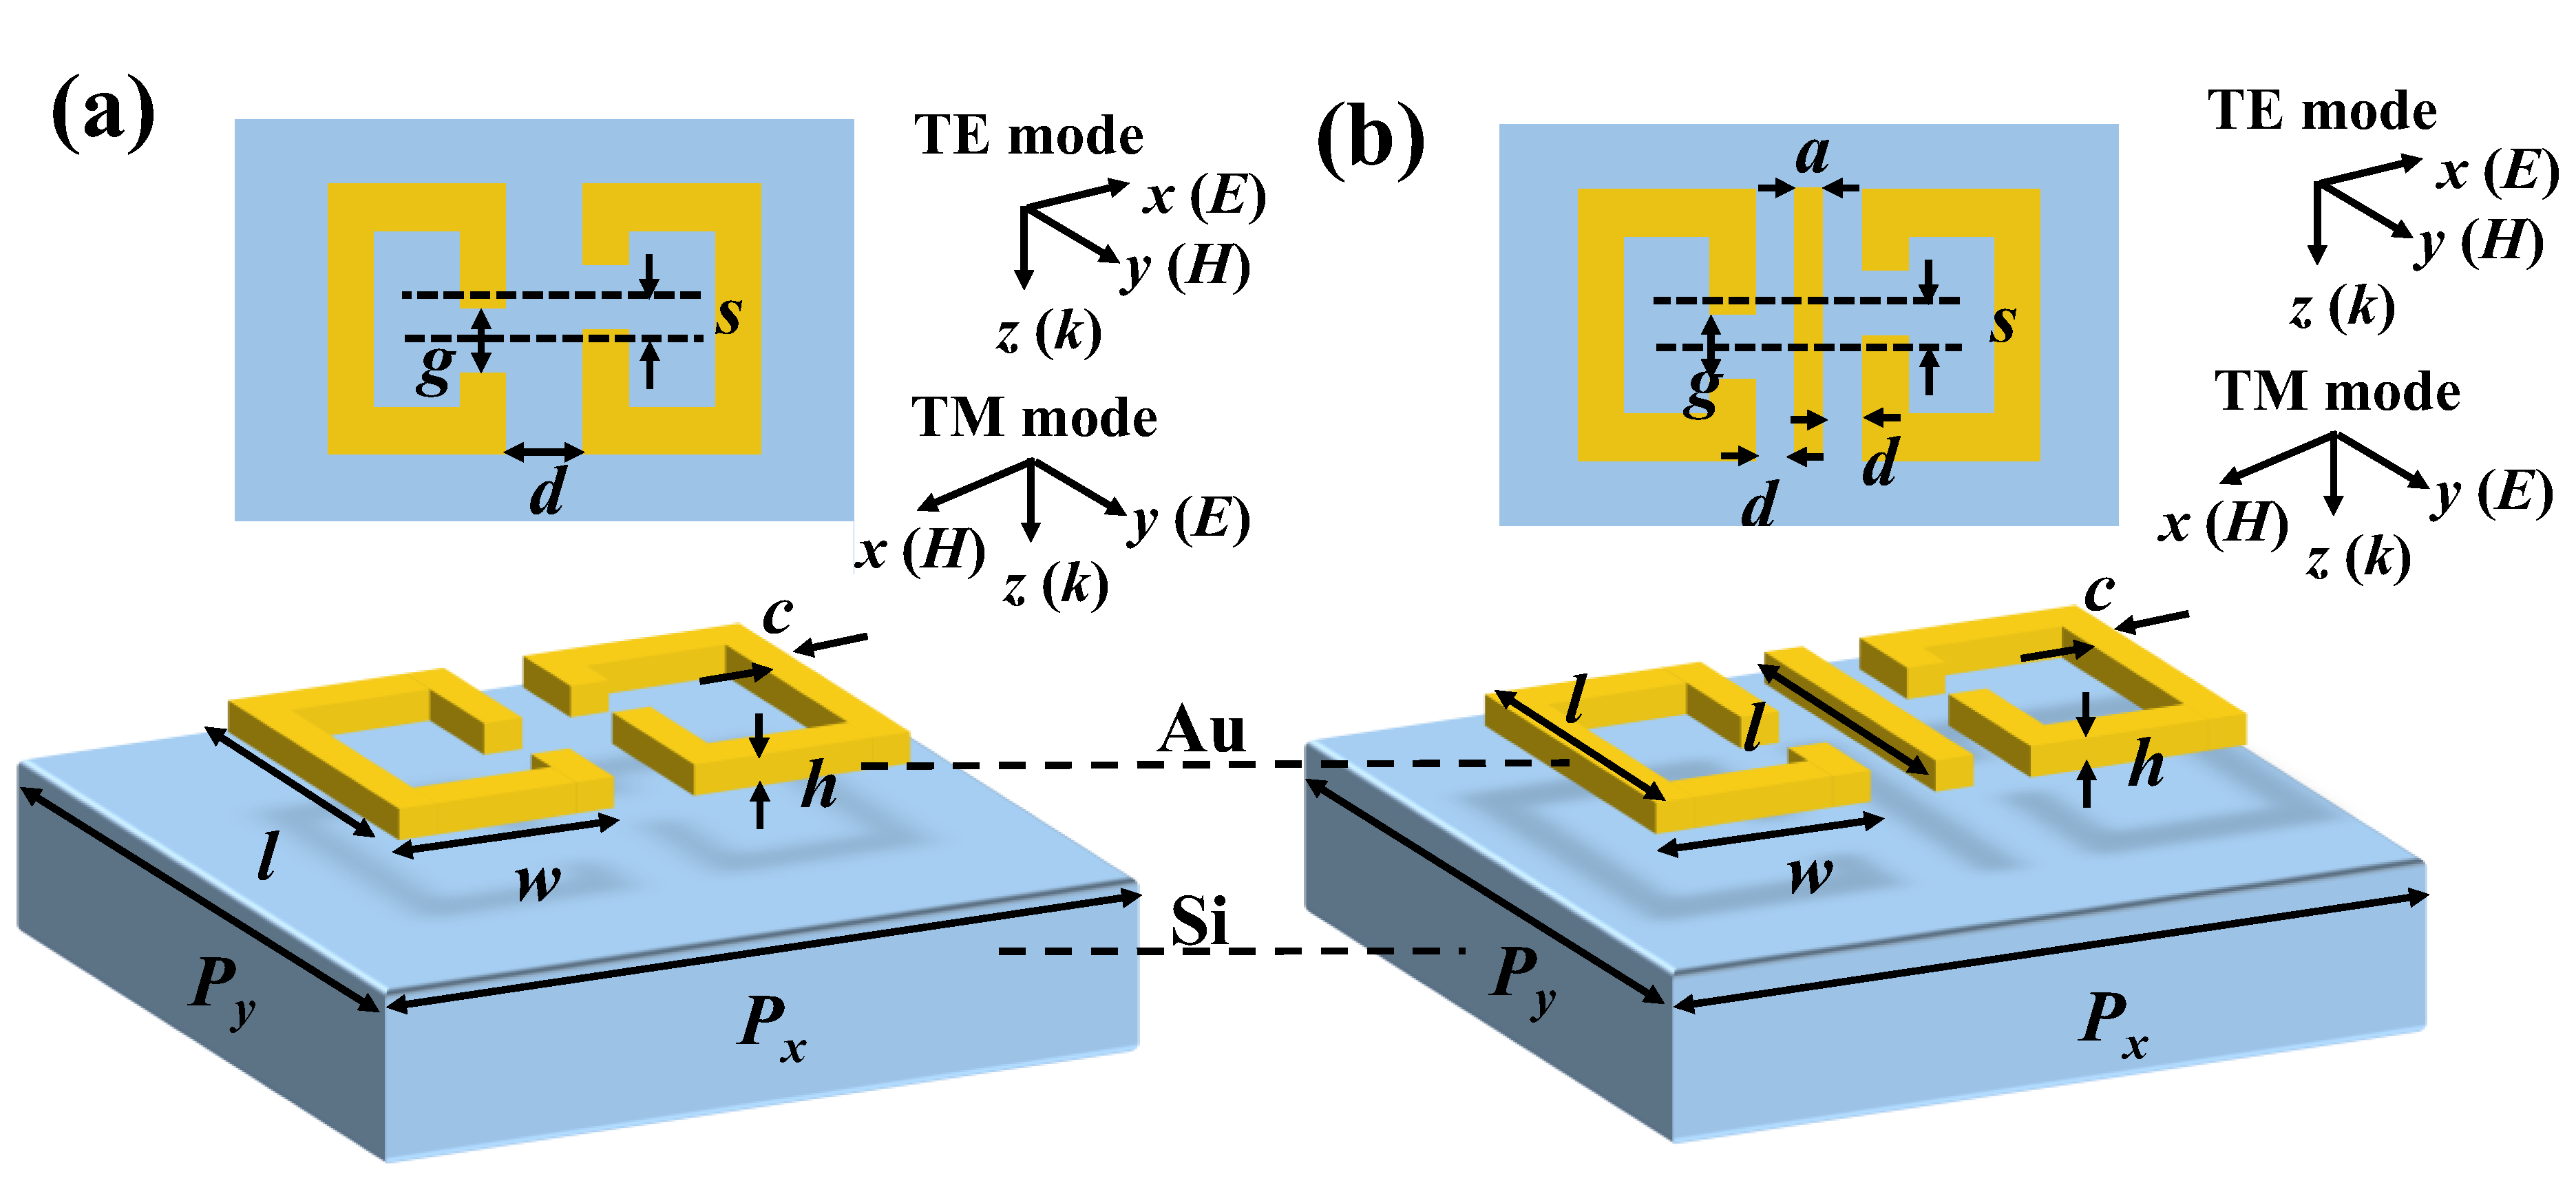
Figure 1b) unit cells and the corresponding denotations, respectively. The configuration of PSM_1 is two face-to-face SRRs, while that of PSM_2 is a CWR sandwiched by the two face-to-face SRRs. The propagation direction of the incident THz wave is set along the negative z-axis direction, whereas the electric (E) field and magnetic (H) field are set as the xy-plane. The incident transverse electric (TE) polarized light is defined as the E-field, set along the x-axis direction, and the H-field, set along the y-axis direction, named the TE mode. The incident transverse magnetic (TM) polarized light is defined as the E-field, set along the y-axis direction, and the H-field, set along the x-axis direction, named the TM mode. The incident THz wave is set as a plane wave propagating vertically to the PSM surface; the surface plasma resonances will then be generated between two face-to-face SRRs for PSM_1 and between the CWR sandwiched by the two face-to-face SRRs for PSM_2. The proposed PSMs are tailored by the Au layer with a thickness of 300 nm (h = 300 nm) on SOI substrates. The structural periods of the PSMs are denoted as Px and Py along the x- and y-axis directions, respectively, where Px = Py = 100 μm. The lengths and widths of the PSMs are denoted as l and w, respectively, where l = 60 μm and w = 27.5 μm. The line widths of the PSMs are kept constant at 5 μm (c = 5 μm). The gaps and the distances of the gap center of the face-to-face SRRs along the y-axis direction are defined as g and s, respectively. The distances between the two face-to-face SRRs and between the SRRs and the CWR along the x-axis direction for PSM_1 and PSM_2 are defined as d. The geometrical parameters of the CWR are the metallic line width (a) and length (l). The g, s, and d parameters of PSM_1 are kept constant at g = 5 μm, s = 0 μm, and d = 5 μm, respectively. The g, s, d, and a parameters of PSM_2 are kept constant at g = 5 μm, s = 0 μm, d = 2 μm, and a = 1 μm, respectively. First, the transmission spectra of the PSMs are explored under the incident THz wave. Then, for PSM_2, the a and d variations are changed synchronously to investigate their relationships to the transmission spectra, while the g and s parameters are kept as g = 5 μm and s = 0 μm, and the sum value of a and d is kept constant. Finally, the effect of the incident polarization angles at 0 degrees (TE mode) and 90 degrees (TM mode) for both PSM_1 and PSM_2 are compared and investigated. The optical properties of the proposed devices are simulated through Lumerical Solutions’ finite difference time domain (FDTD)-based simulations. The propagation direction of incident light is set to be perpendicular to the x-y plane in the numerical simulations. Periodic boundary conditions are also adopted in the x and y directions, and perfectly matched layer (PML) boundary conditions are assumed in the z direction. The transmission of the incident THz wave is calculated by a monitor set under the bottom side of the proposed PSMs.

3. Simulation Results and Discussion

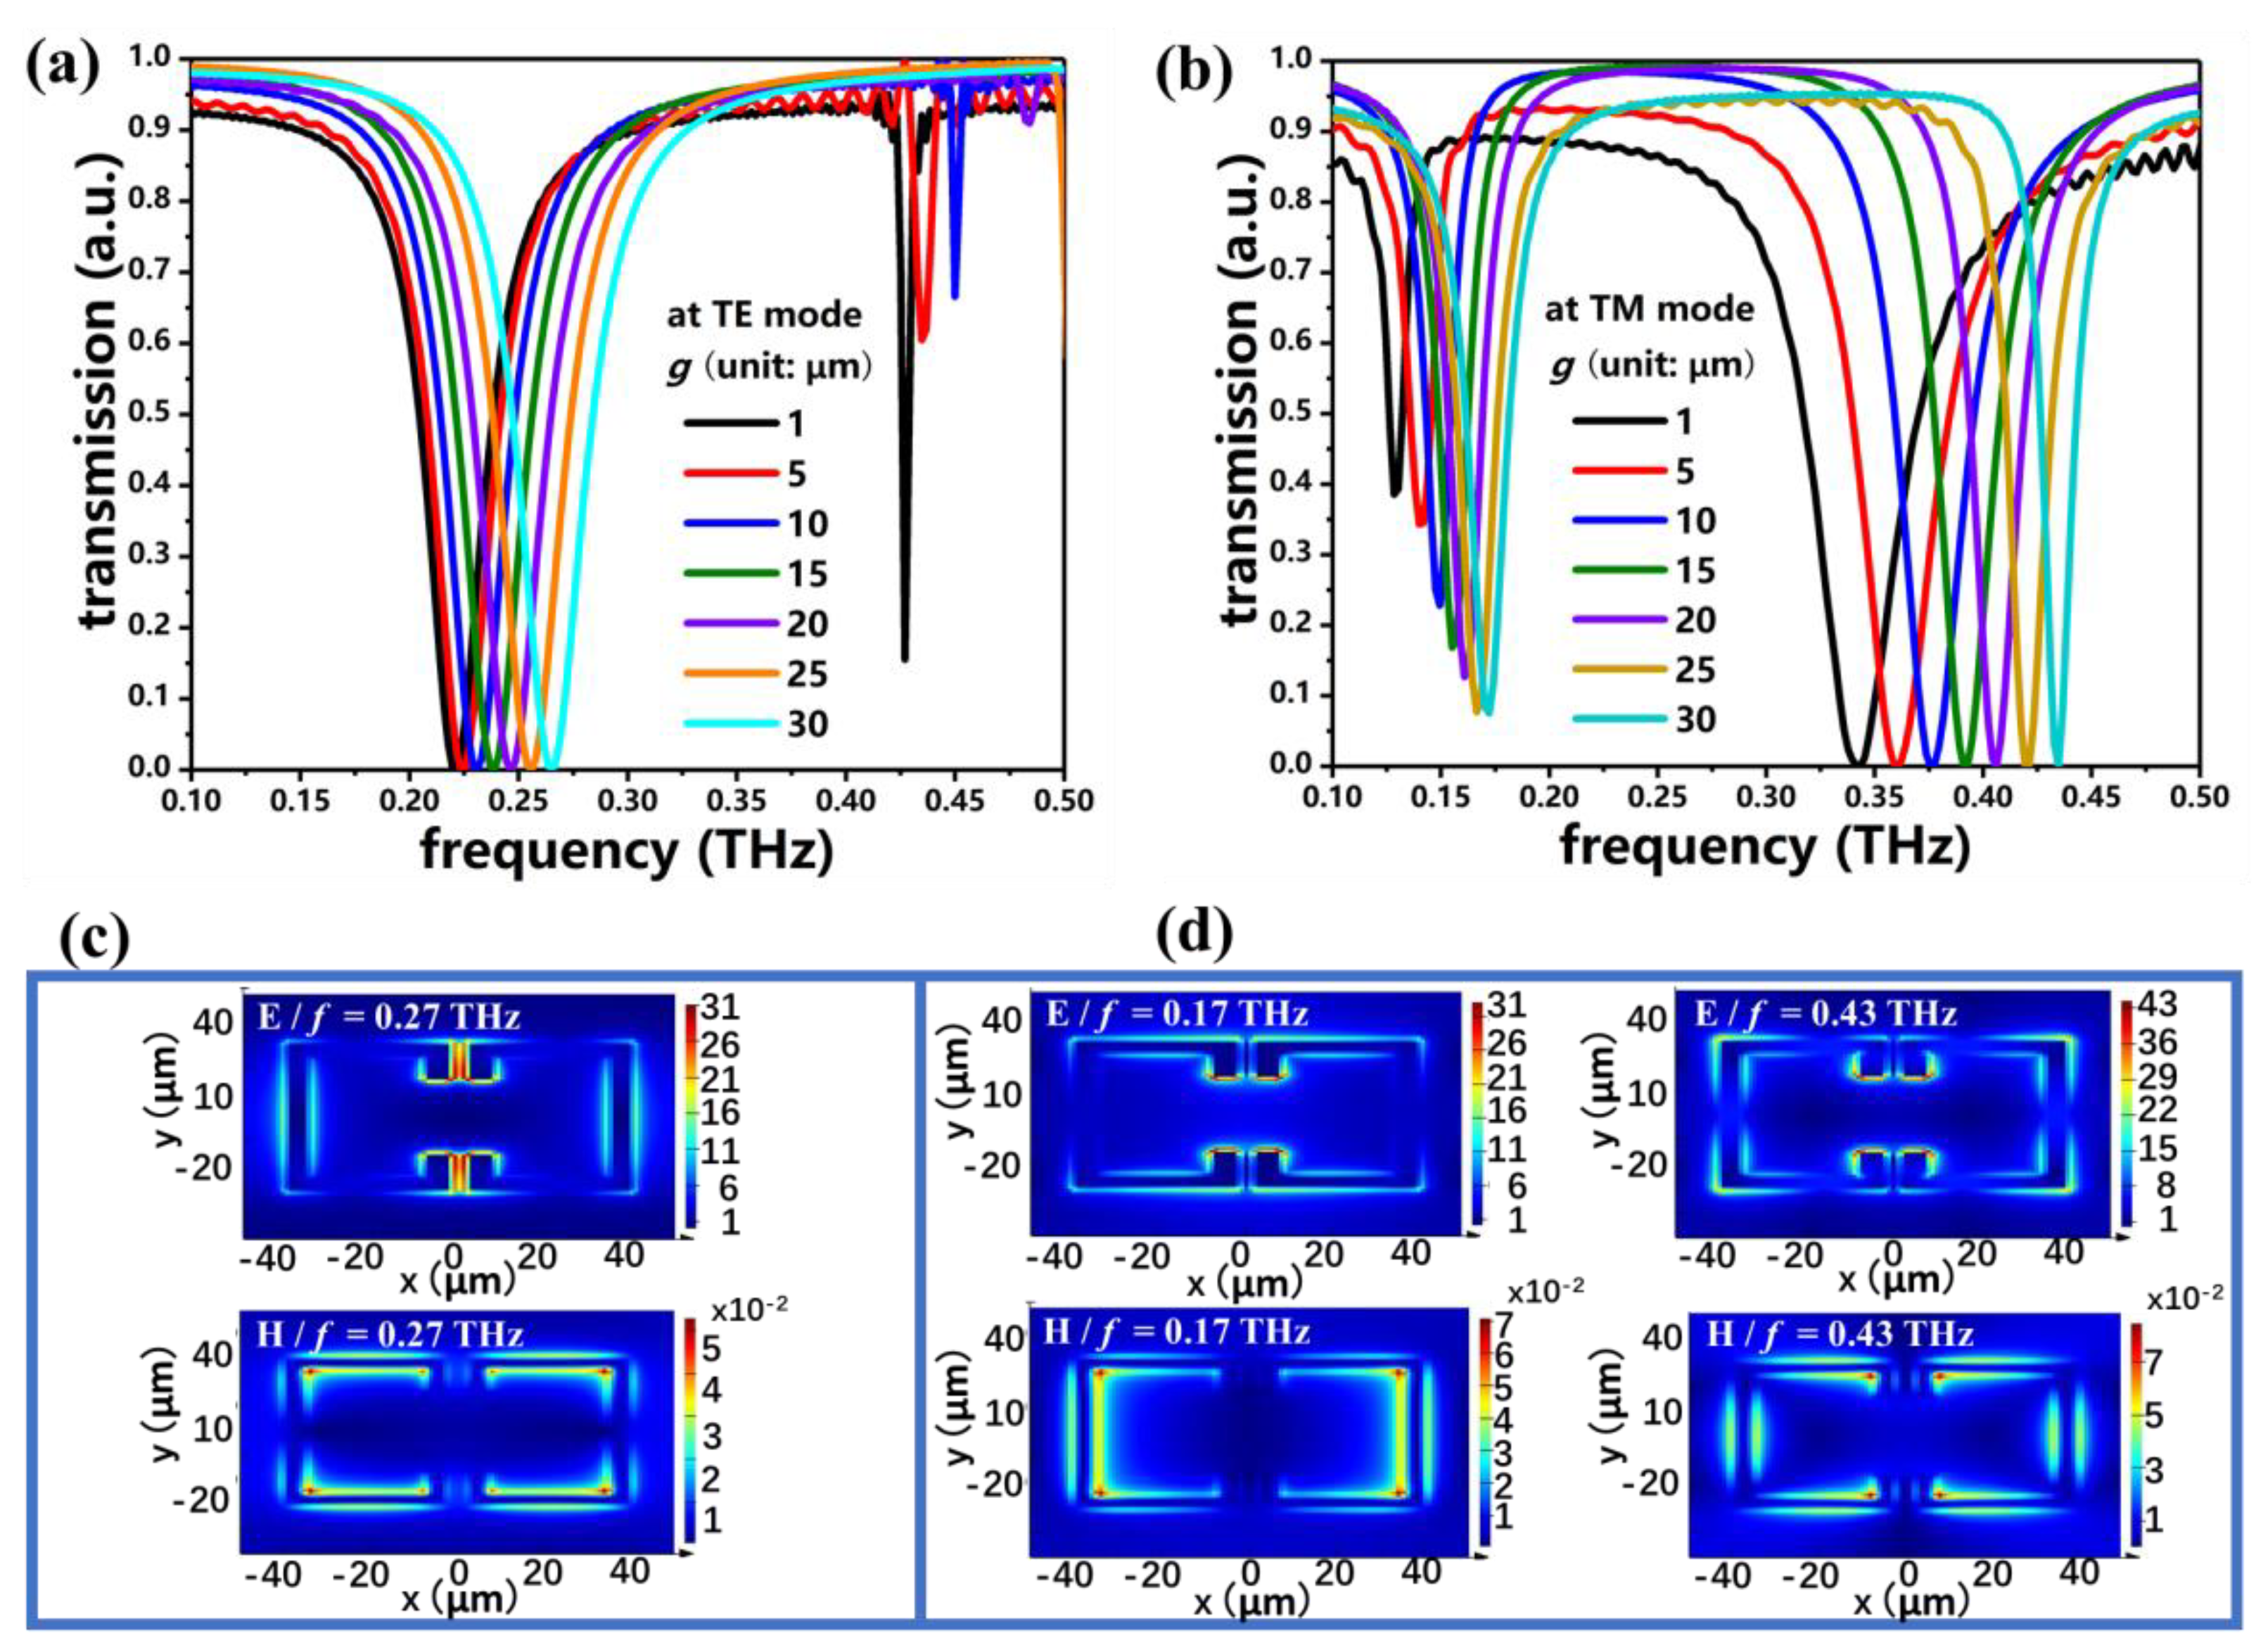
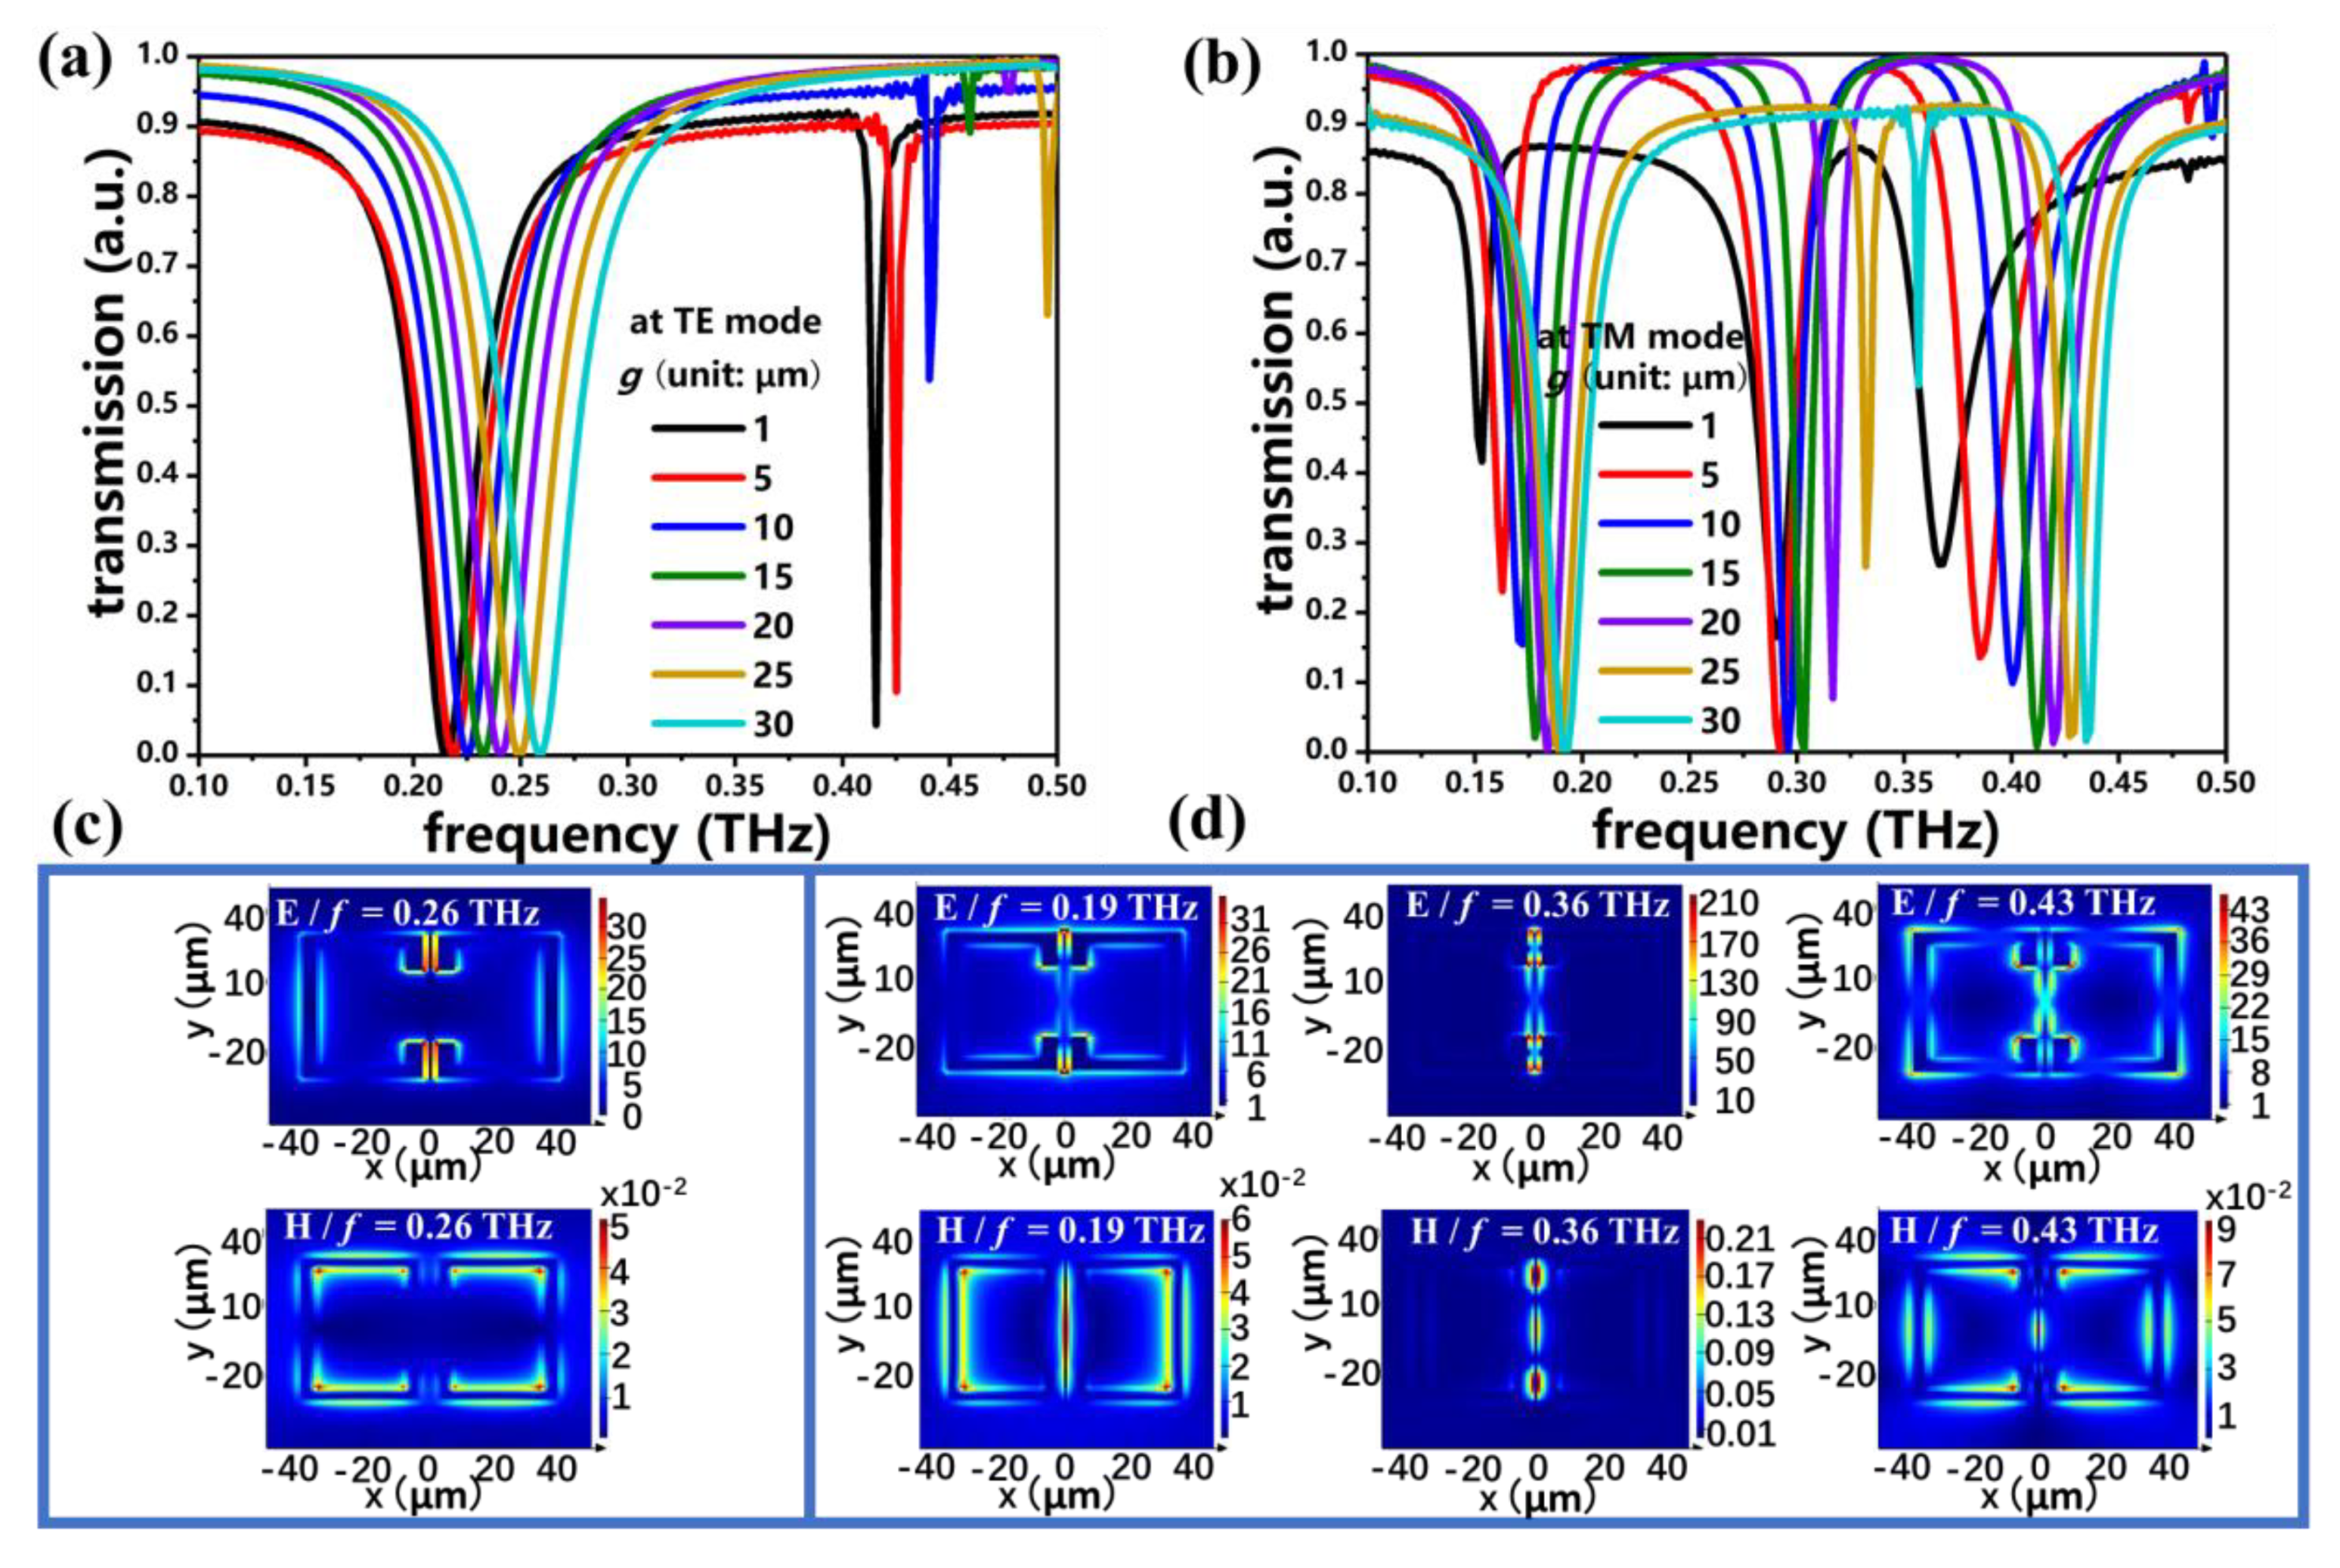
Figure 2a,b show the transmission spectra of PSM_1 by changing the g value from 1 μm to 30 μm at the TE and TM modes, respectively, while s and d are kept as s = 0 μm, d = 5 μm. The electromagnetic response exhibits single-resonance at TE mode and dual-resonance at TM mode. These two different responses show the polarization dependence of PSM_1. At the TE mode, the resonant intensity is almost kept constant, whereas the resonant frequency is blue-shifted from 0.22 THz to 0.27 THz by increasing the g value. The tuning range is 50 GHz. For a resonance larger than 0.40 THz, the resonant frequency is blue-shifted with the decreasing resonant intensity. When g is larger than 15 μm, there is no resonance. At the TM mode, there are two resonances blue-shifted from 0.13 THz to 0.17 THz (the first resonance) and from 0.34 THz to 0.44 THz (the second resonance). In order to better interpret the physical mechanism of this phenomenon, the corresponding E- and H-field distributions of PSM_1 at the TE and TM modes under the condition of g = 30 μm are presented in Figure 2c,d, respectively. At the TE mode, the E-field is accumulated in the adjacent parts of the two face-to-face SRRs, and the H-field is distributed around the upper and lower conductor bars of the SRRs. It generates a typical localized surface plasmon (LSP) resonance at 0.27 THz [30]. Figure 2d indicates the electromagnetic field distributions of these two different resonances, which contribute to the two LSP resonances at 0.17 THz and 0.43 THz. The E-fields are distributed around the gap of each SRR at 0.17 THz (the first resonance) and 0.43 THz (the second resonance), whereas the H-fields are distributed around the left and right conductor bars of the structure at 0.17 THz and around the contours of both SRRs at 0.43 THz.
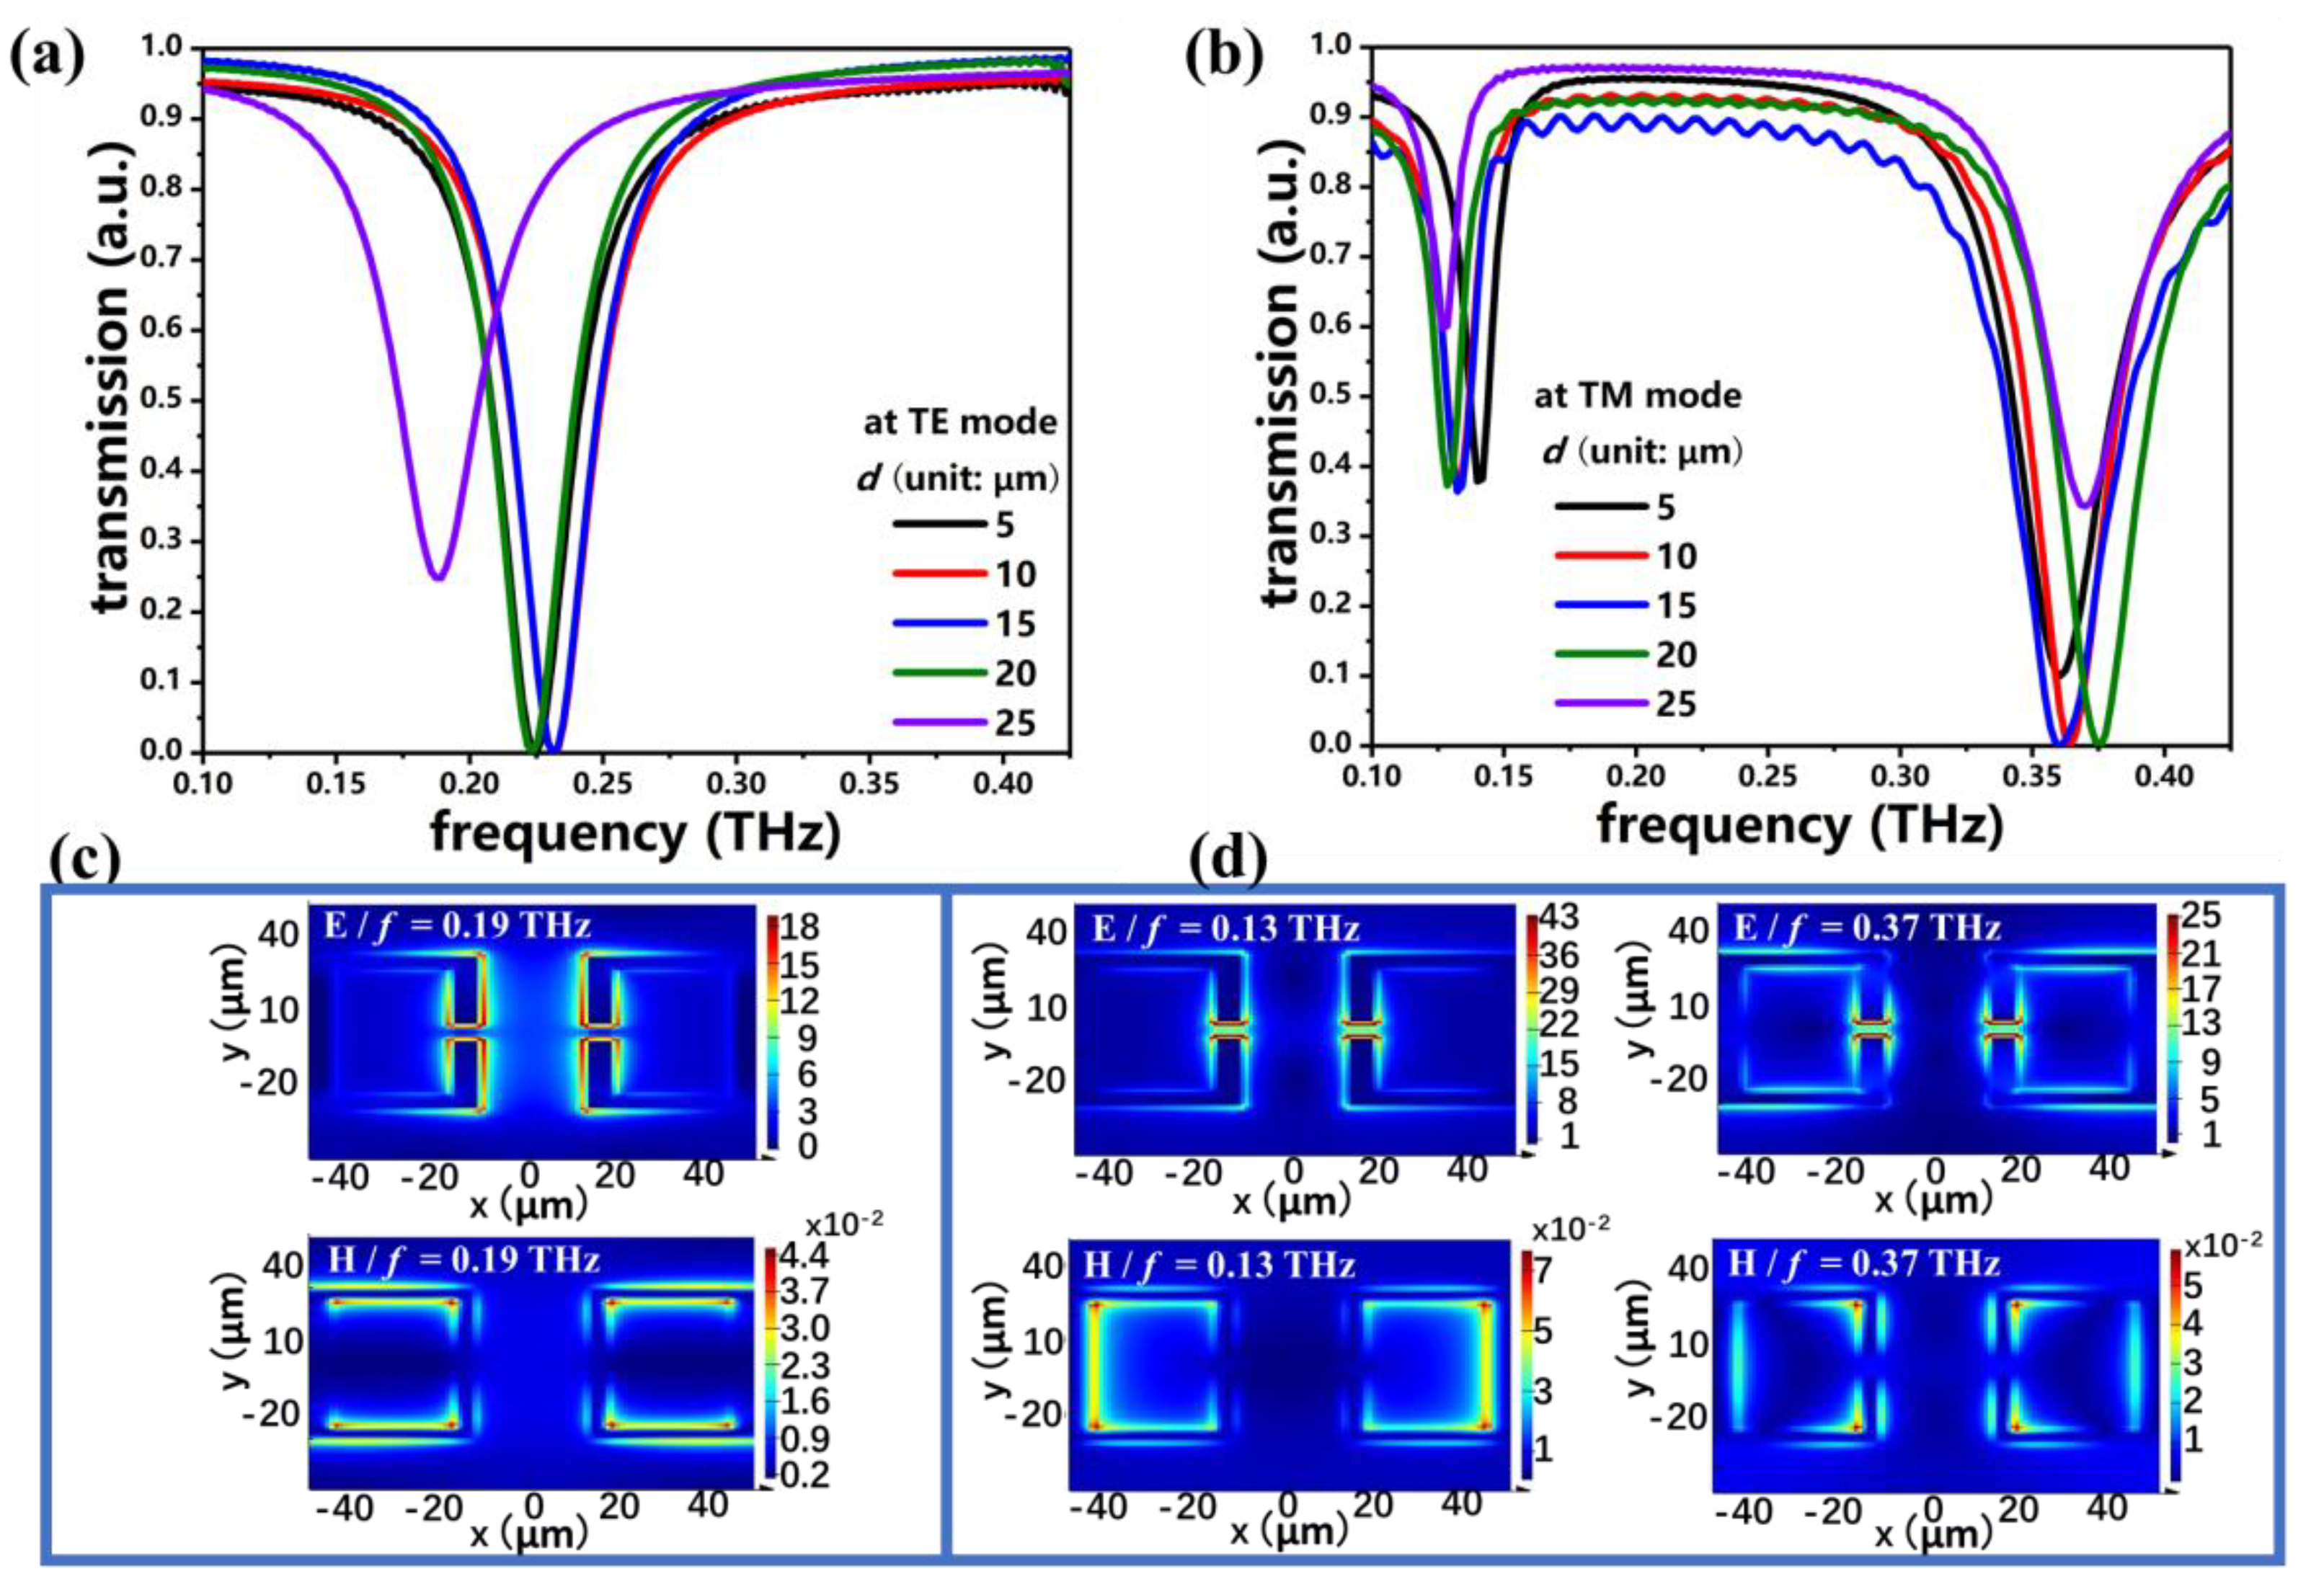
The transmission spectra of PSM_1, obtained by changing the d value and simultaneously keeping s = 0 μm and g = 5 μm at the TE and TM modes, are shown in Figure 3a,b, respectively. At the TE mode, the resonances are first blue-shifted from 0.22 THz to 0.25 THz when d increases from 5 μm to 15 μm, and then the resonances are red-shifted from 0.24 THz to 0.19 THz when d increases from 15 μm to 25 μm. At the TM mode, there are two resonances at 0.14 THz and 0.36 THz, and both resonances are slight variations of the resonant frequency and intensity, obtained by changing the d value. This indicates that the proposed PSM_1 exhibits the polarization-dependence characteristic. The electromagnetic characteristics of PSM_1 can be switched from single-resonance to dual-resonance by changing the polarization mode from TE to TM. These results could be explained by the corresponding E- and H-field distributions at the TE and TM modes, as shown in Figure 3c,d, respectively. It is obvious that the electromagnetic field distributions of PSM_1 with d = 25 μm are similar to those with g = 30 μm, which are shown in Figure 2c,d. Therefore, the resonances of 0.19 THz at the TE mode and the resonances of 0.13 THz and 0.37 THz at the TM mode are LSP resonances.
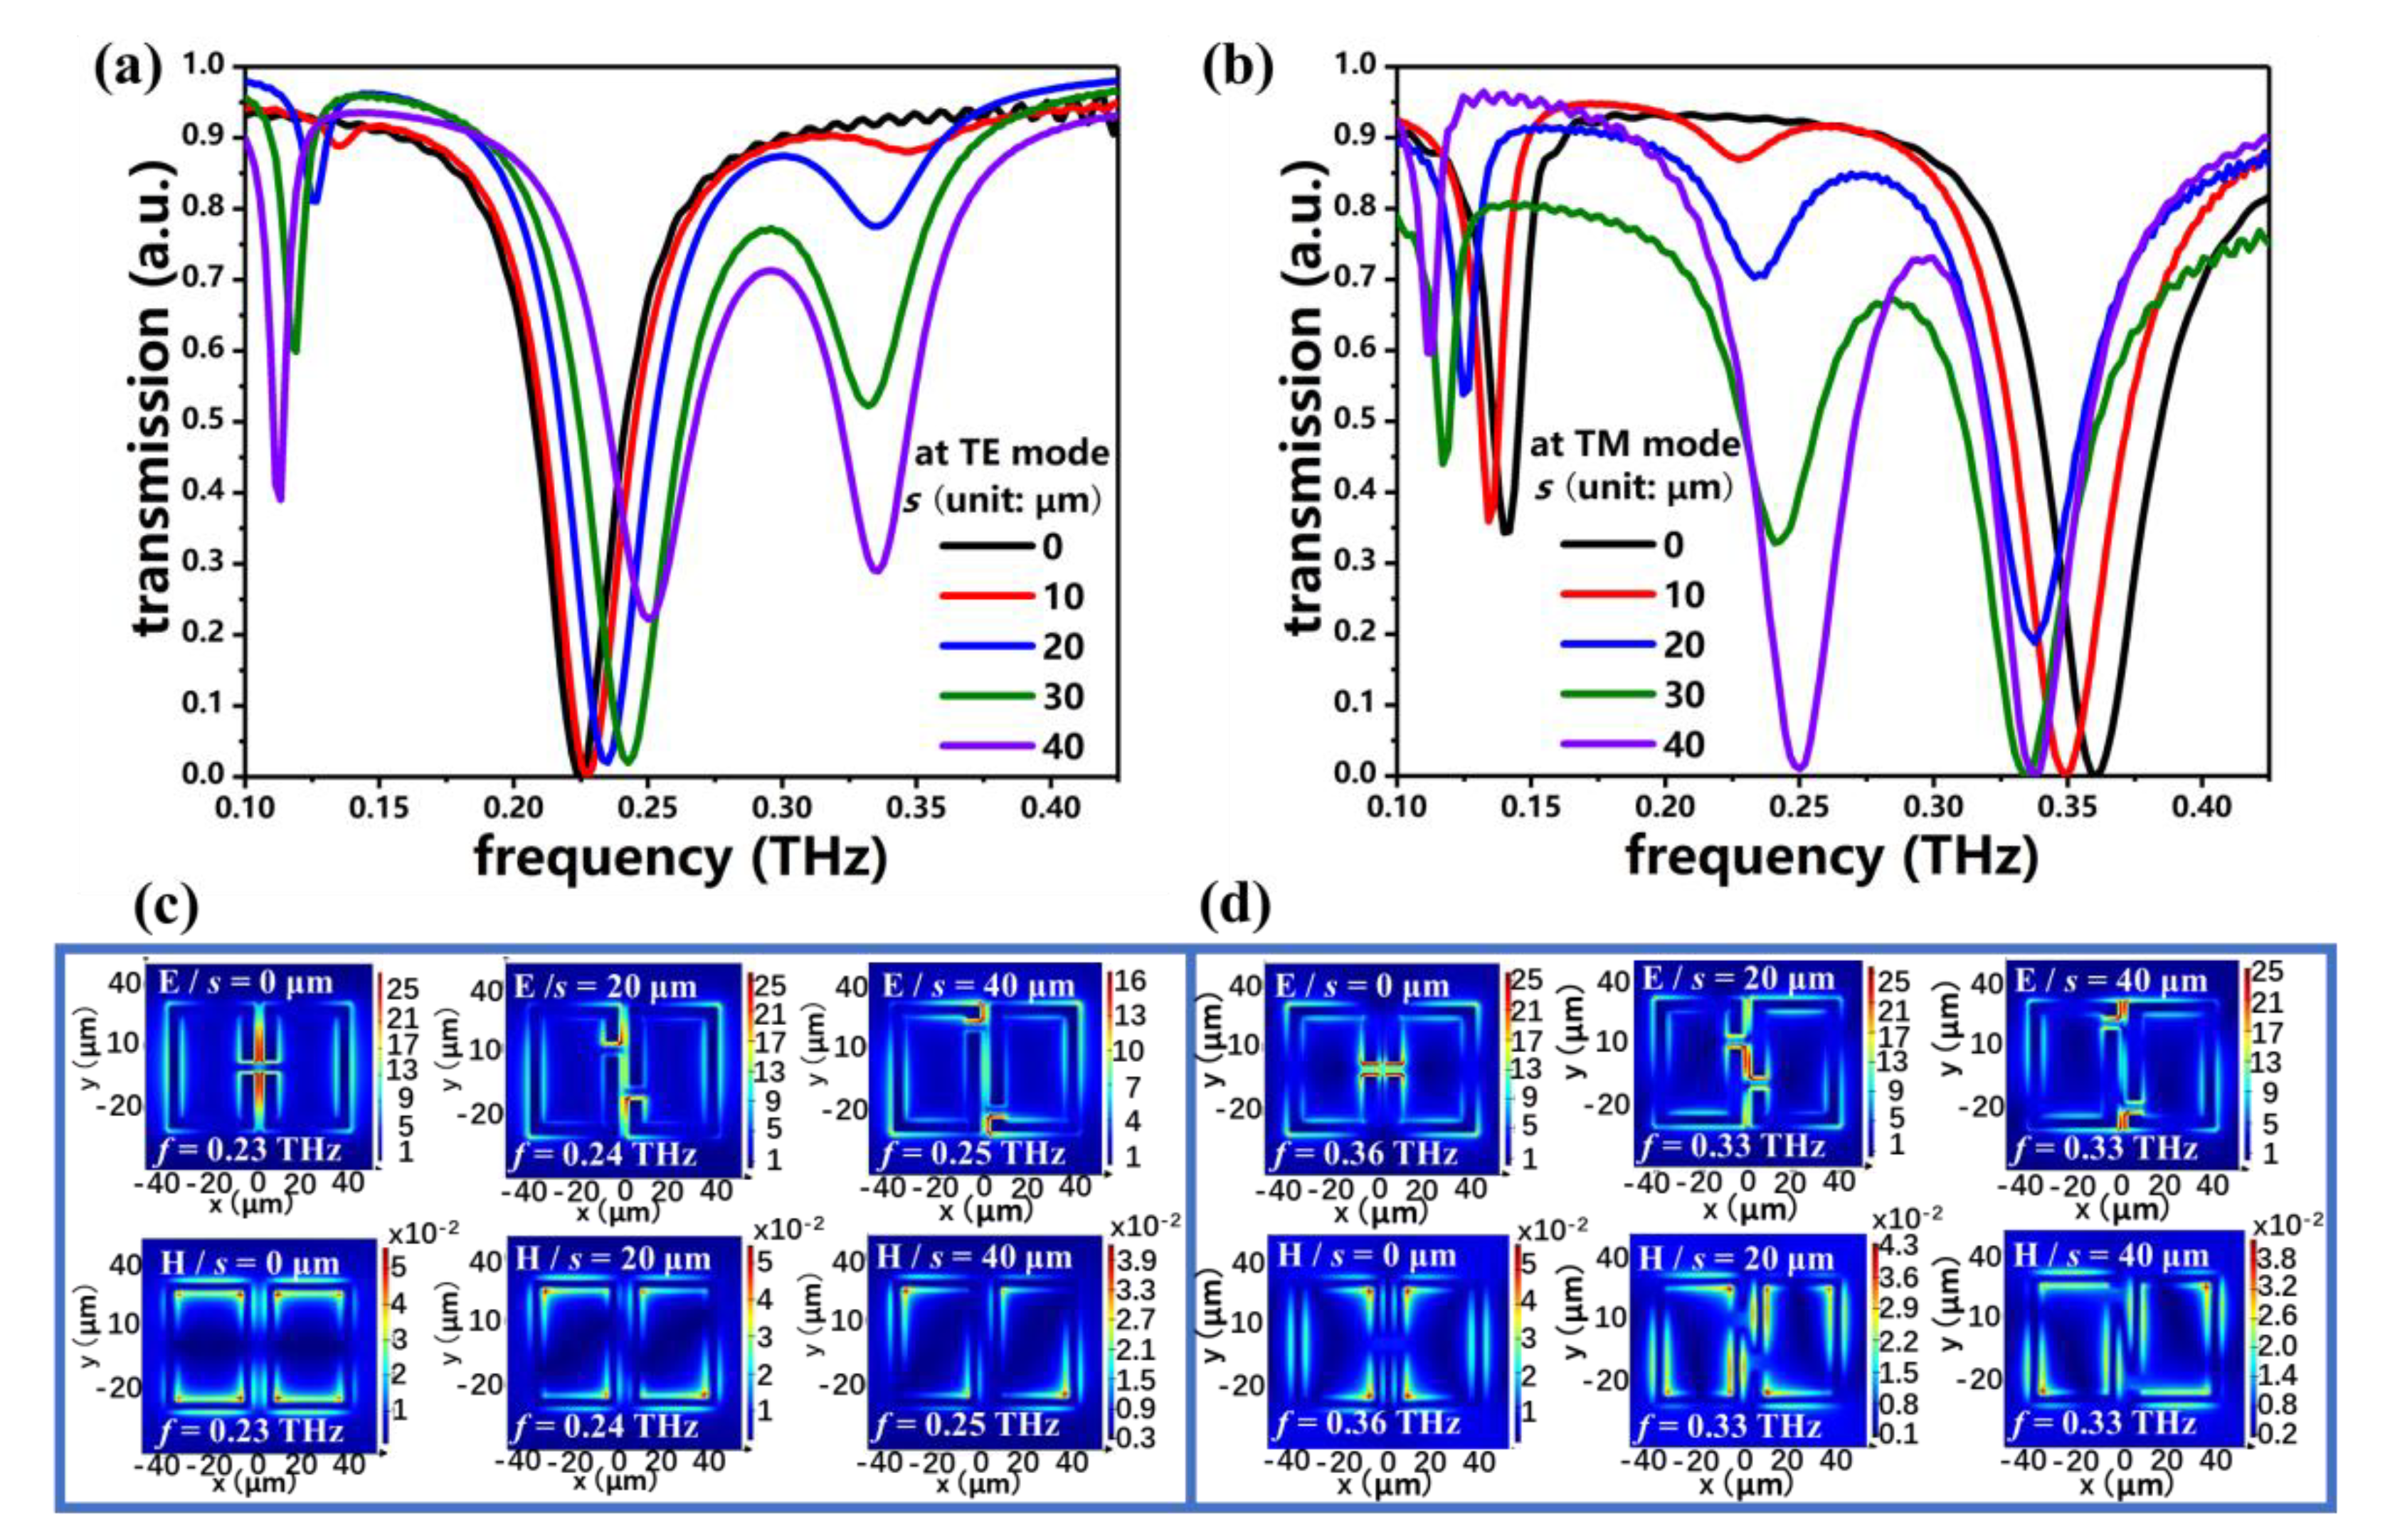
To investigate the coupling effect between the gap center distance of the face-to-face SRRs and the incident THz wave, the transmission spectra of PSM_1 with different s values from 0 μm to 40 μm at the TE and TM modes are shown in Figure 4a,b, respectively. The g and d values are kept constant at 5 μm. The electromagnetic responses indicate that PSM_1 with different s values exhibits polarization-sensitivity. At the TE mode, the main resonance that occurs at 0.24 THz is blue-shifted, and the resonant intensity decays as a result of the increasing s value. Meanwhile, two resonances are generated around the resonant frequencies of 0.12 THz and 0.34 THz. By increasing the s value, these two resonances are red-shifted, and the corresponding resonant intensity becomes stronger. This shows a switchable behavior. At the TM mode, there are two resonances, at 0.14 THz and 0.37 THz, and there is no resonance at 0.24 THz for s = 0 μm. By increasing the s value, these two resonances are red-shifted with decreasing resonant intensities. A resonance is generated at 0.24 THz which is blue-shifted, and the resonant intensity increases when the s value is increased. This indicates the behavior of a switchable electromagnetic response. The corresponding E- and H-field distributions of PSM_1 at the TE and TM modes under the conditions of s = 0 μm, 20 μm, and 40 μm are presented in Figure 4c,d, respectively. The corresponding monitored frequencies are 0.23 THz, 0.24 THz, and 0.25 THz at the TE mode and 0.36 THz, 0.33 THz, and 0.33 THz at the TM mode. At the TE mode, the E-fields are gathered at the adjacent parts of the two face-to-face SRRs and the H-fields are distributed around the upper and lower conductor bars of the SRRs. This indicates that the resonances of 0.23 THz for s = 0 μm, the resonances of 0.24 THz for s = 20 μm, and the resonances of 0.25 THz for s = 40 μm are LSP resonances. Figure 4d indicates the electromagnetic fields distributions of resonances under the conditions of s = 0 μm, 20 μm, and 40 μm, which contribute to LSP resonances at 0.36 THz, 0.33 THz, and 0.33 THz at the TM mode. The E-field is distributed within the gap of the SRRs, and the H-field is distributed around the corners of the SRRs for s = 0 μm. For s = 20 μm and s = 40 μm, the H-fields are distributed around the contours of the SRRs. Meanwhile, the E-fields are restricted in the middle adjacent parts of the face-to-face SRRs for s = 20 μm and at the apexes of the adjacent parts of the SRRs for s = 40 μm. By increasing the s value, the E- and H-fields captured by PSM_1 at the TE and TM modes vanish, which indicates the correspondingly decreasing resonant intensities.
Figure 5a,b show the transmission spectra of PSM_2 by changing g from 1 μm to 30 μm and simultaneously keeping s = 0 μm, d = 2 μm, and a = 1 μm at the TE and TM modes, respectively. At the TE mode, the resonant frequency is blue-shifted from 0.21 THz to 0.26 THz, while the resonant intensity is almost kept constant when the g value is increased. The tuning range is 50 GHz. For the resonance larger than 0.4 THz, the resonant frequency is blue-shifted, and the resonant intensities are strong only for g = 1 μm and g = 5 μm. At the TM mode, there are three resonances that are blue-shifted, from 0.15 THz to 0.20 THz (the first resonance), from 0.29 THz to 0.36 THz (the second resonance), and from 0.37 THz to 0.44 THz (the third resonance). Compared with the transmission spectra of PSM_1 by changing g from 1 μm to 30 μm in Figure 2a,b, the electromagnetic characteristic of PSM_2 is the same at the TE mode but is different at the TM mode. The electromagnetic response exhibits single-resonance at the TE mode for both PSMs, while it exhibits dual-resonance for PSM_1 and triple-resonance for PSM_2 at the TM mode. The extra resonance from 0.29 THz to 0.36 THz at the TM mode is contributed by the CWR, which generates a stronger coupling effect of PSM_2 at the TM mode but is almost transparent at the TE mode. These could be explained by the corresponding E- and H-field distributions of PSM_2, with g = 30 μm at the TE and TM modes in Figure 5c,d. The electromagnetic field distributions of PSM_2, with g = 30 μm at the TE mode, are similar to those of PSM_1 in Figure 2c, which indicates that the LSP resonances of these two devices are almost the same at the TE mode. At the TM mode, three LSP resonances are generated, at 0.19 THz, 0.36 THz, and 0.43 THz, for g = 30 μm. The E-fields are distributed around the gaps of each SRR and the apexes of the CWR at 0.19 THz, while the H-fields are distributed around the left and right conductor bars of the structure and the contour of the CWR. At 0.36 THz, the electromagnetic fields are gathered at the contour of the CWR, while at 0.43 THz, the electromagnetic fields are distributed around the contours of the SRRs and the middle part of the CWR. Therefore, the difference in the electromagnetic response between PSM_1 and PSM_2 at the TM mode is that the CWR contributes a greater coupling effect with the two face-to-face SRRs, leading to the second resonance at around 0.30 THz and the stronger resonant intensity of the transmission spectra that are shown in Figure 5b, compared with those shown in Figure 2b.
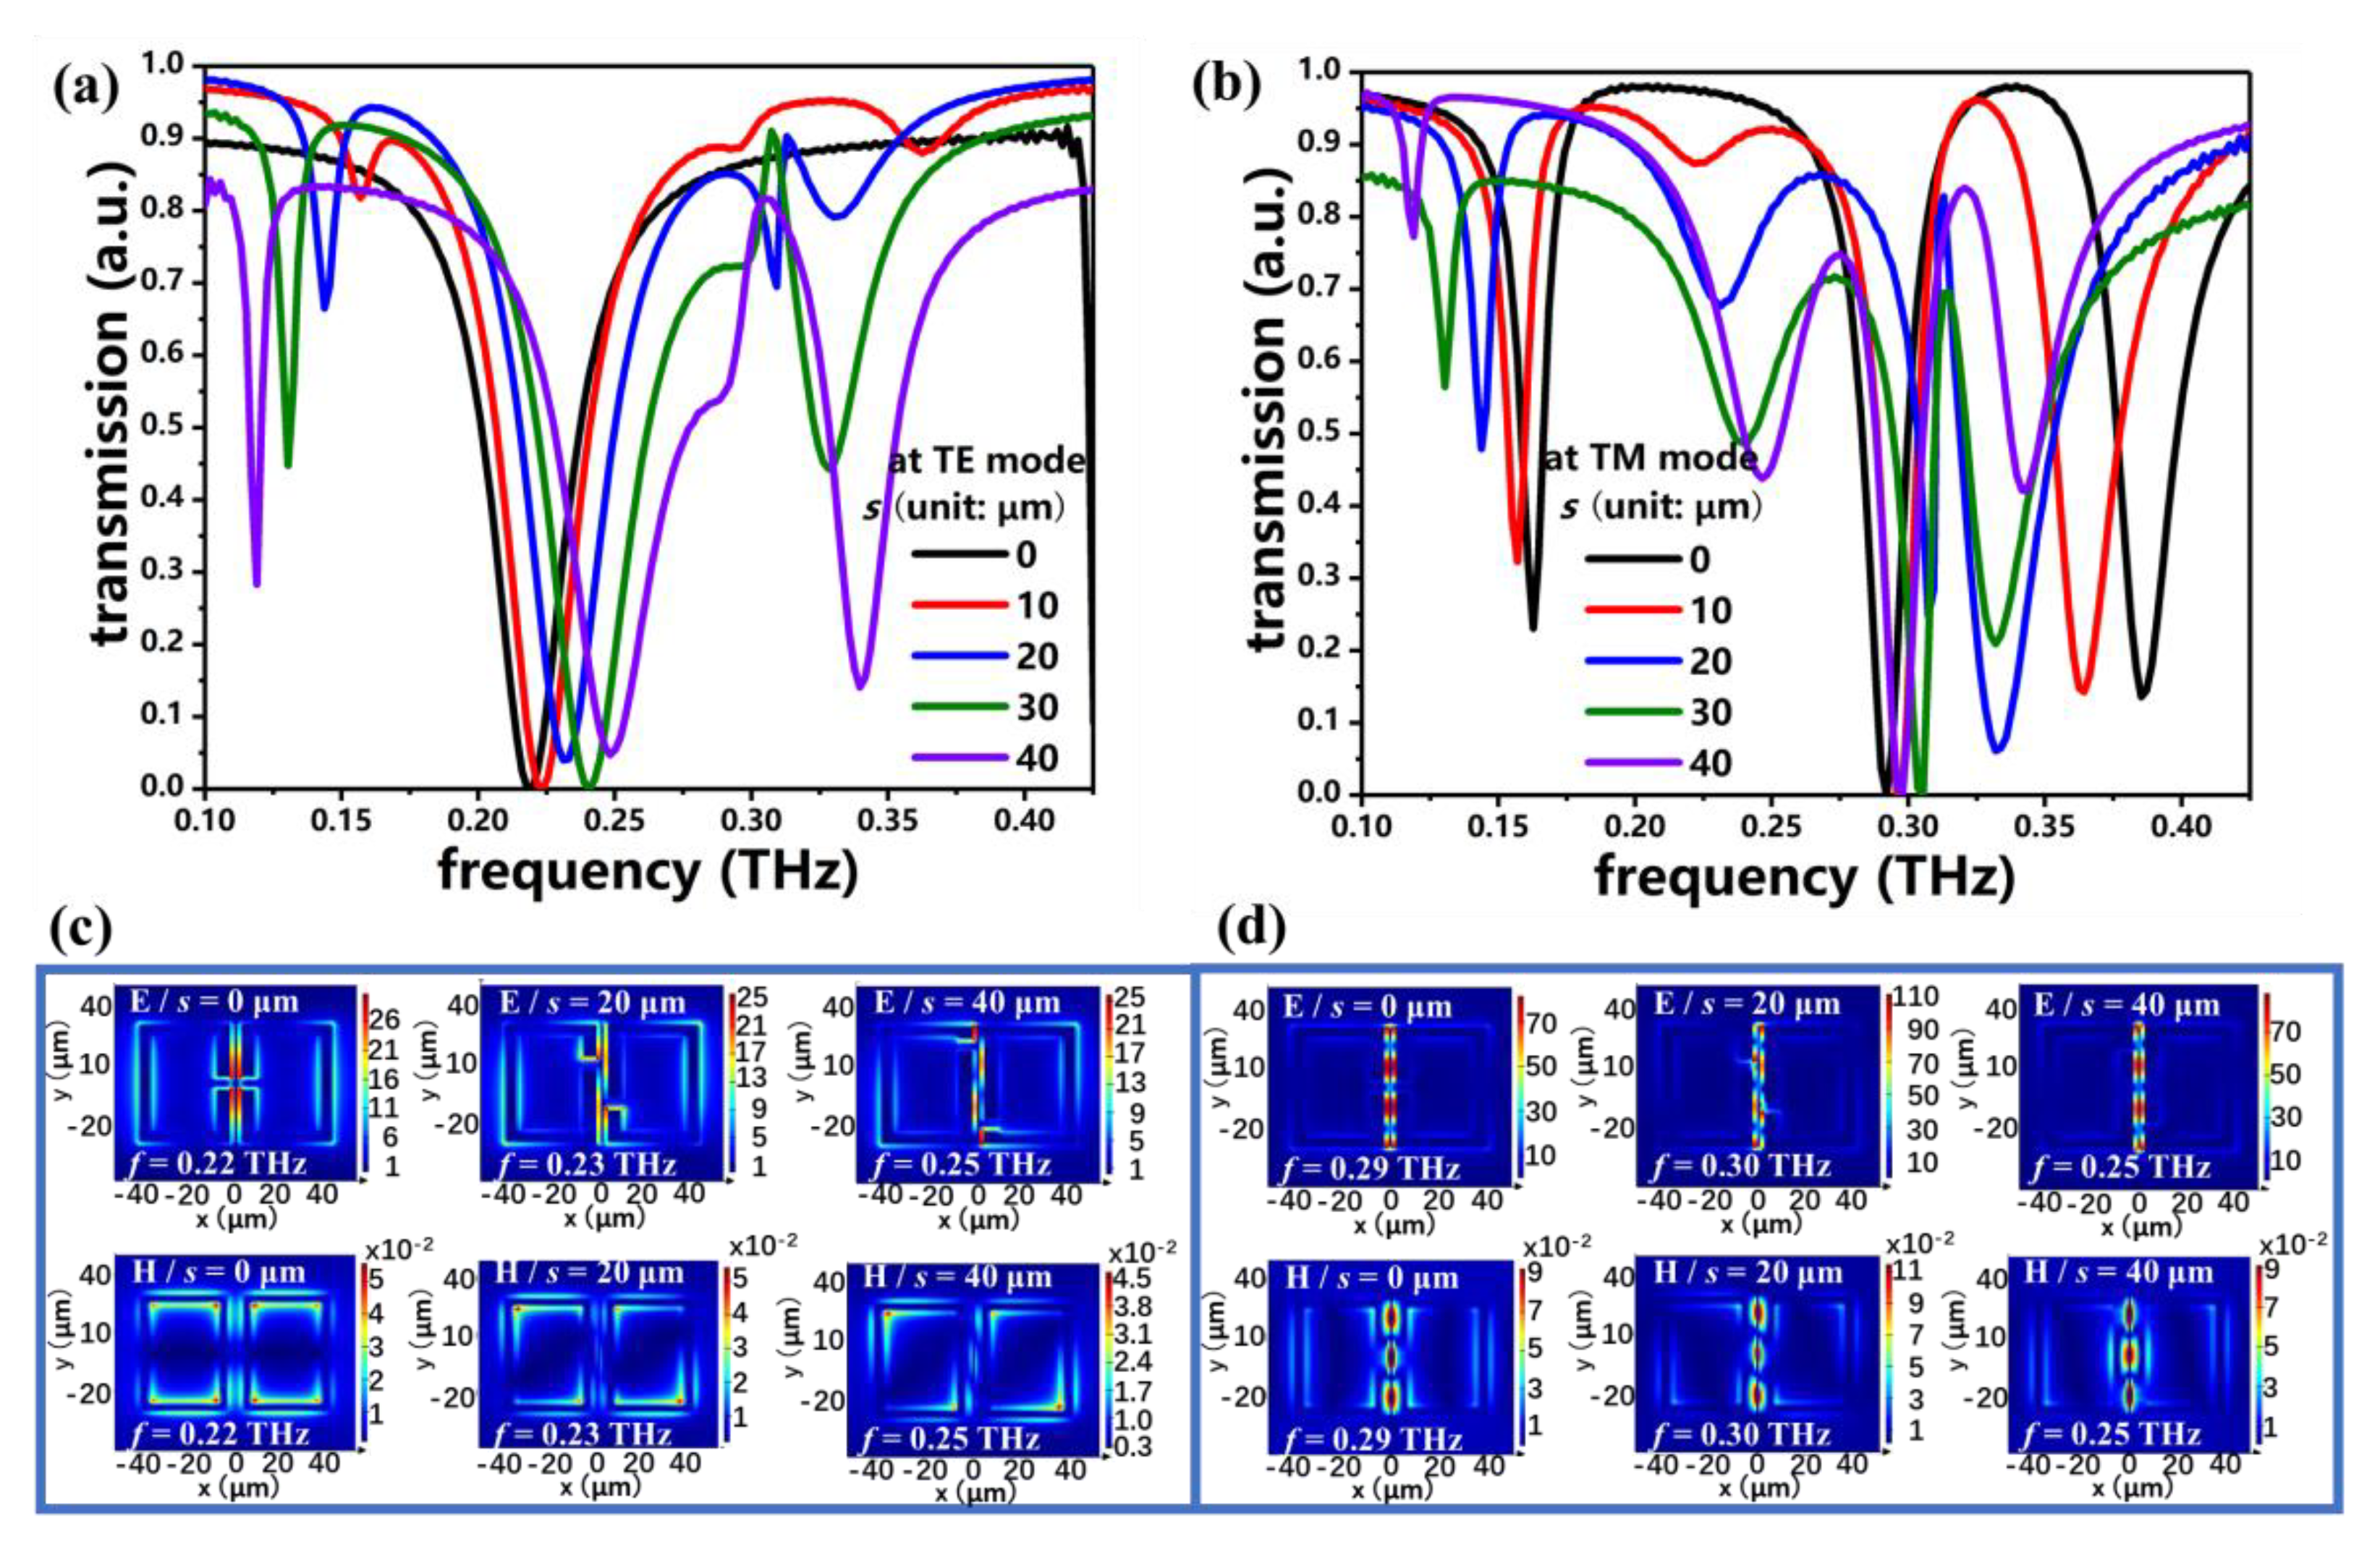
Figure 6a,b show the transmission spectra of PSM_2 by changing the s value from 0 μm to 40 μm at the TE and TM modes, respectively. The g, d, and a values are kept as g = 5 μm, d = 2 μm, and a = 1 μm. Evidently, the transmission spectra of PSM_2 by changing the s value at the TE mode shown in Figure 6a are similar to those of PSM_1 shown in Figure 4a. It can be explained by the E- and H-field distributions of PSM_2 in Figure 6c. It is obvious that the electromagnetic field distributions of PSM_2 at the TE mode are similar to those of PSM_1, shown in Figure 4c. Therefore, the resonances of 0.22 THz, 0.23 THz, and 0.25 THz at the TE mode are LSP resonances. At the TM mode, there are three resonances, at 0.16 THz, 0.29 THz, and 0.39 THz, at the initial state (s = 0 μm). By increasing the s value, the PSM_2 device can be switched from triple-resonance to quad-resonance. The E- and H-field distributions of PSM_2 with s = 0 μm, 20 μm, and 40 μm at the TM mode are summarized in Figure 6d. The electromagnetic fields are gathered in the CWR and are quite different from those of PSM_1, which are shown in Figure 4d. This causes the difference in the transmission spectra between PSM_1 and PSM_2 at the TM mode. It indicates that the LSP resonances of 0.29 THz for s = 0 μm, 0.30 THz for s = 20 μm, and 0.40 THz for s = 40 μm are generated by the CWR.
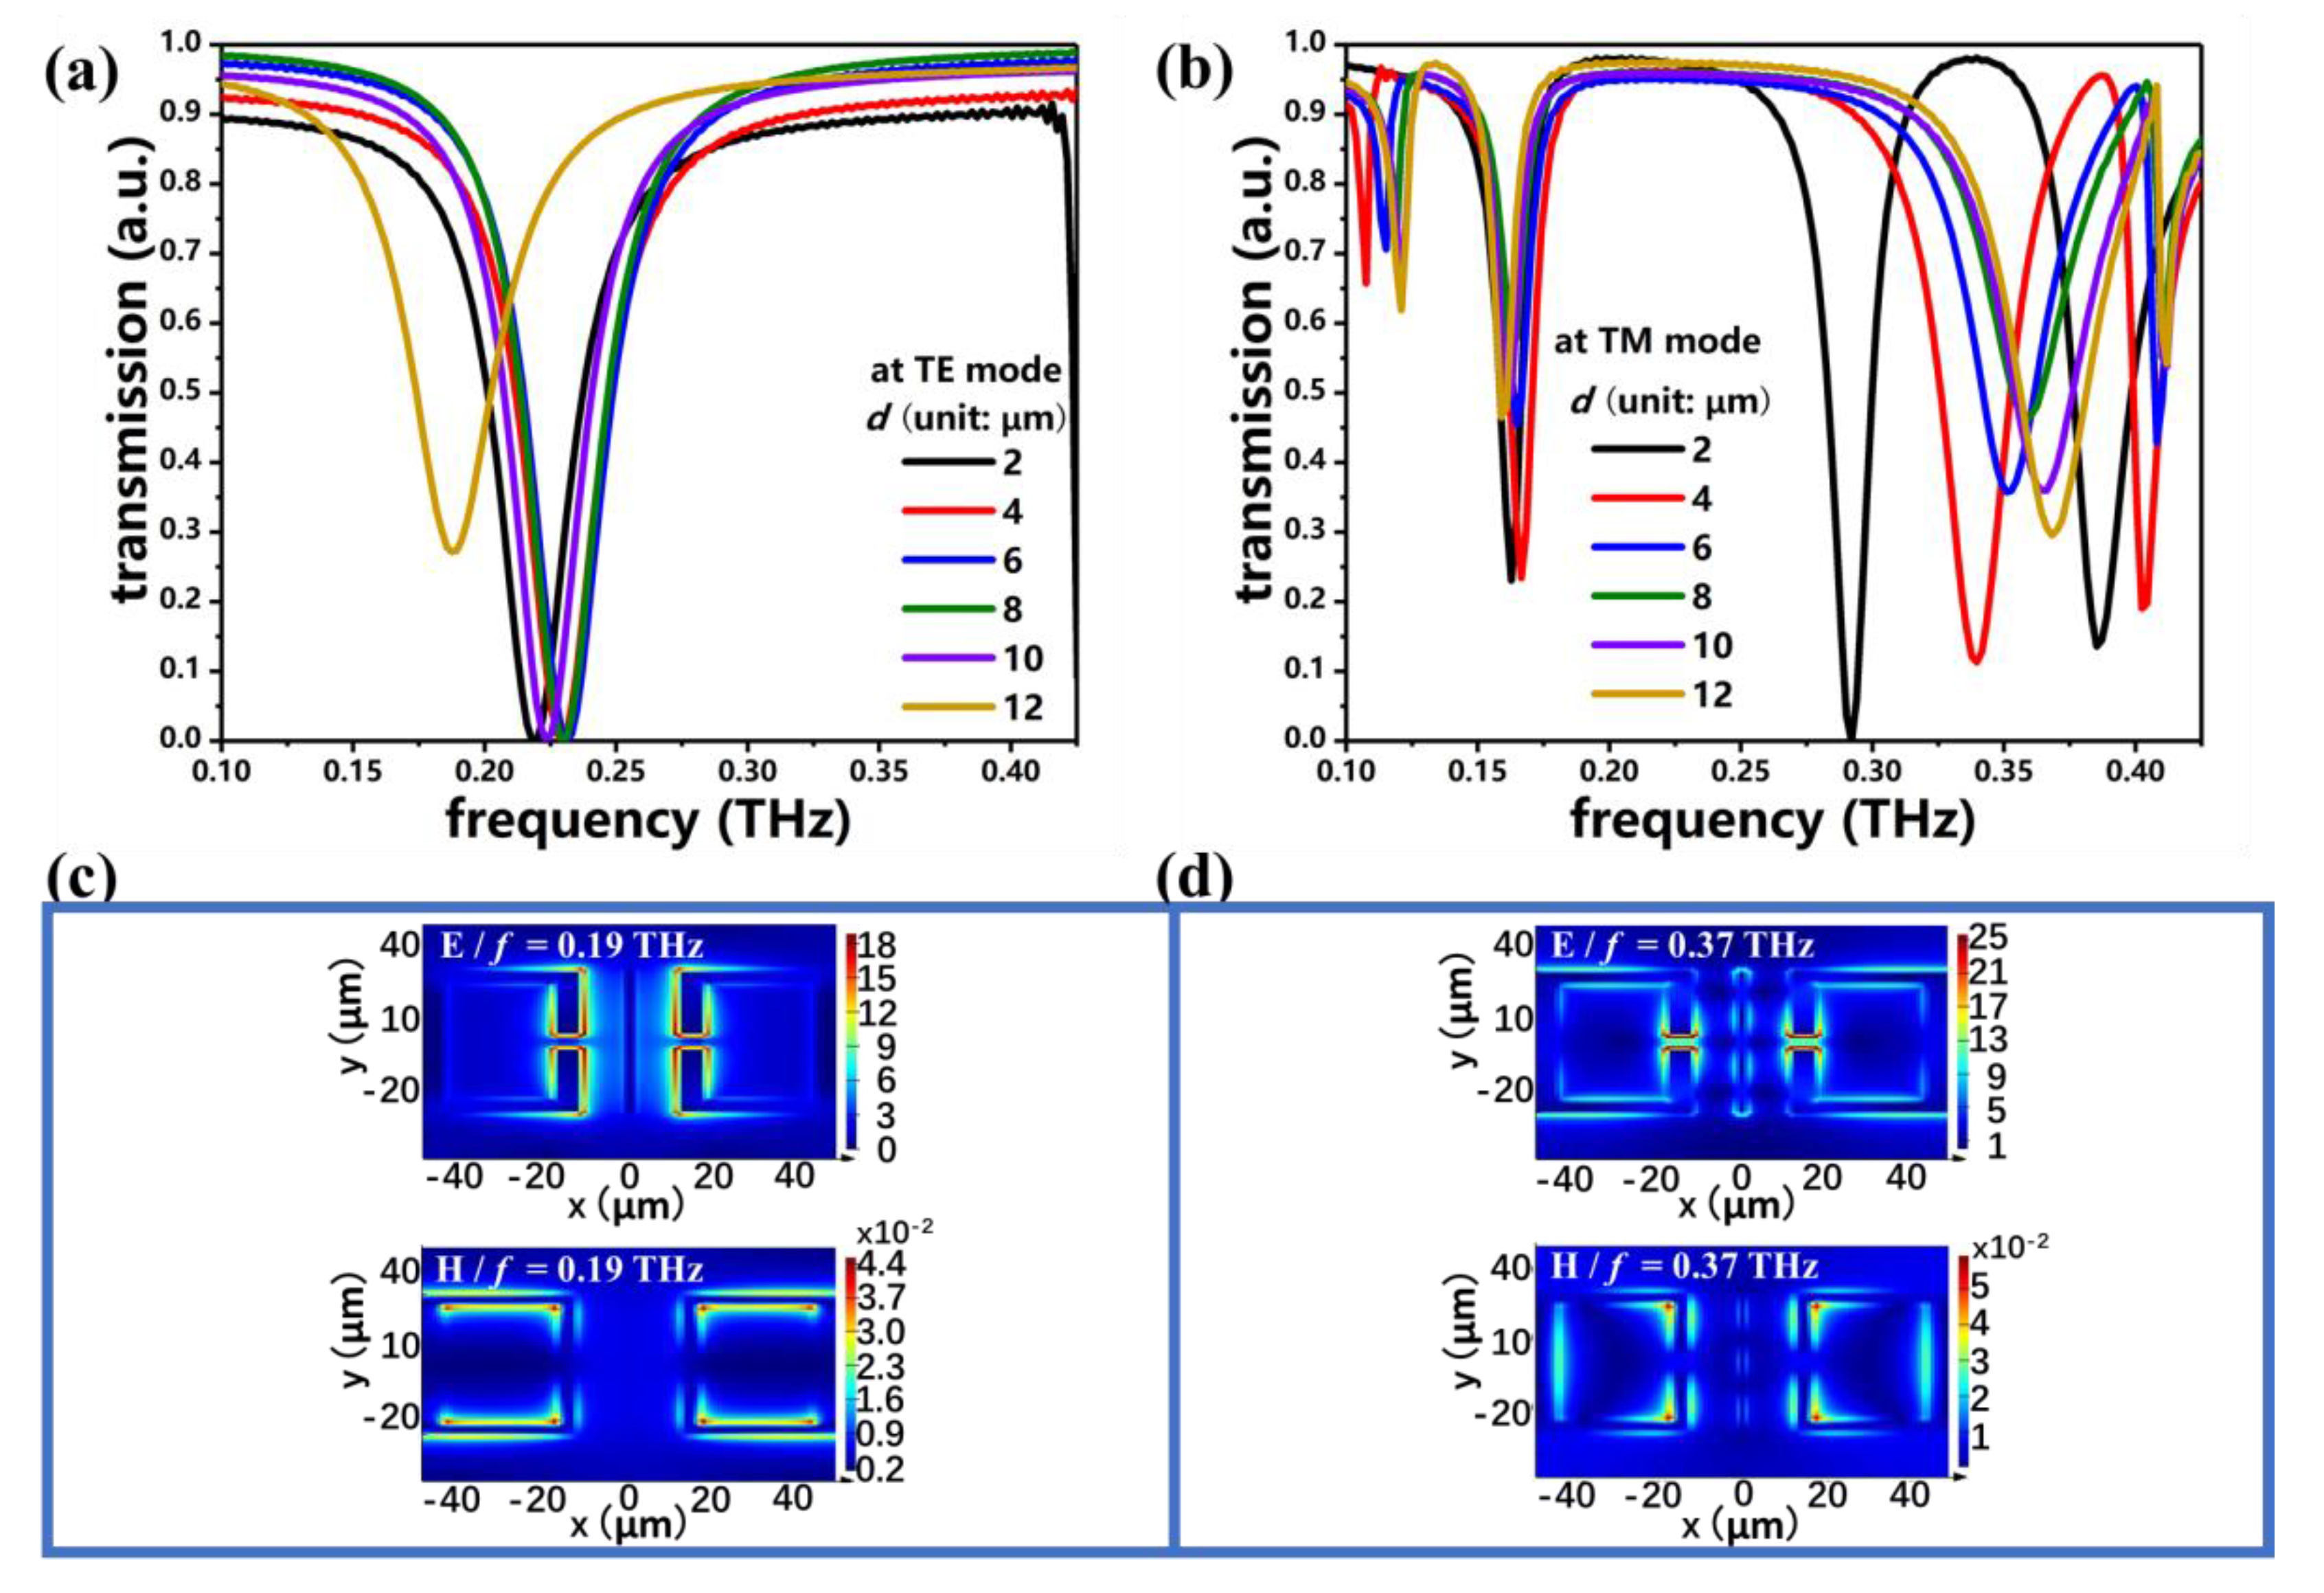
The transmission spectra of PSM_2 obtained by changing the d value and simultaneously keeping g = 5 μm, s = 0 μm, and a = 1 μm at the TE and TM modes are shown in Figure 7a,b, respectively. The electromagnetic responses indicate that the PSM_2 with different d values shows polarization-sensitivity. At the TE mode, the resonances are first blue-shifted from 0.22 THz to 0.24 THz when d increases from 2 μm to 8 μm, and they are then red-shifted from 0.24 THz to 0.19 THz when d increases from 8 μm to 12 μm. At the TM mode, there are three resonances: one is around the resonant frequency of 0.16 THz, one is blue-shifted from 0.29 THz to 0.37 THz, and the other is blue-shifted from 0.39 THz to 0.42 THz by increasing the d value. A resonance will be generated at 0.11 THz when d is 4 μm. By increasing the d value, this resonance is blue-shifted and the corresponding resonant intensity is larger. The corresponding E- and H-field distributions of PSM_2 with d = 12 μm at the TE and TM modes are shown in Figure 7c,d, respectively. The corresponding resonant frequencies are 0.19 THz at the TE mode and 0.37 THz at the TM mode. Compared with the electromagnetic field distributions of PSM_1 with d = 25 μm at 0.19 THz (at the TE mode) and 0.37 THz (at the TM mode) shown in Figure 3c,d, the E- and H-field distributions of PSM_2 with d = 12 μm indicate the influence of the CWR. It is obvious that the coupling effect generated by the CWR becomes weaker with the larger distance between the CWR and the SRRs. Therefore, the LSP resonances of 0.19 THz at the TE mode and 0.37 THz at the TM mode are generated by the SRRs.
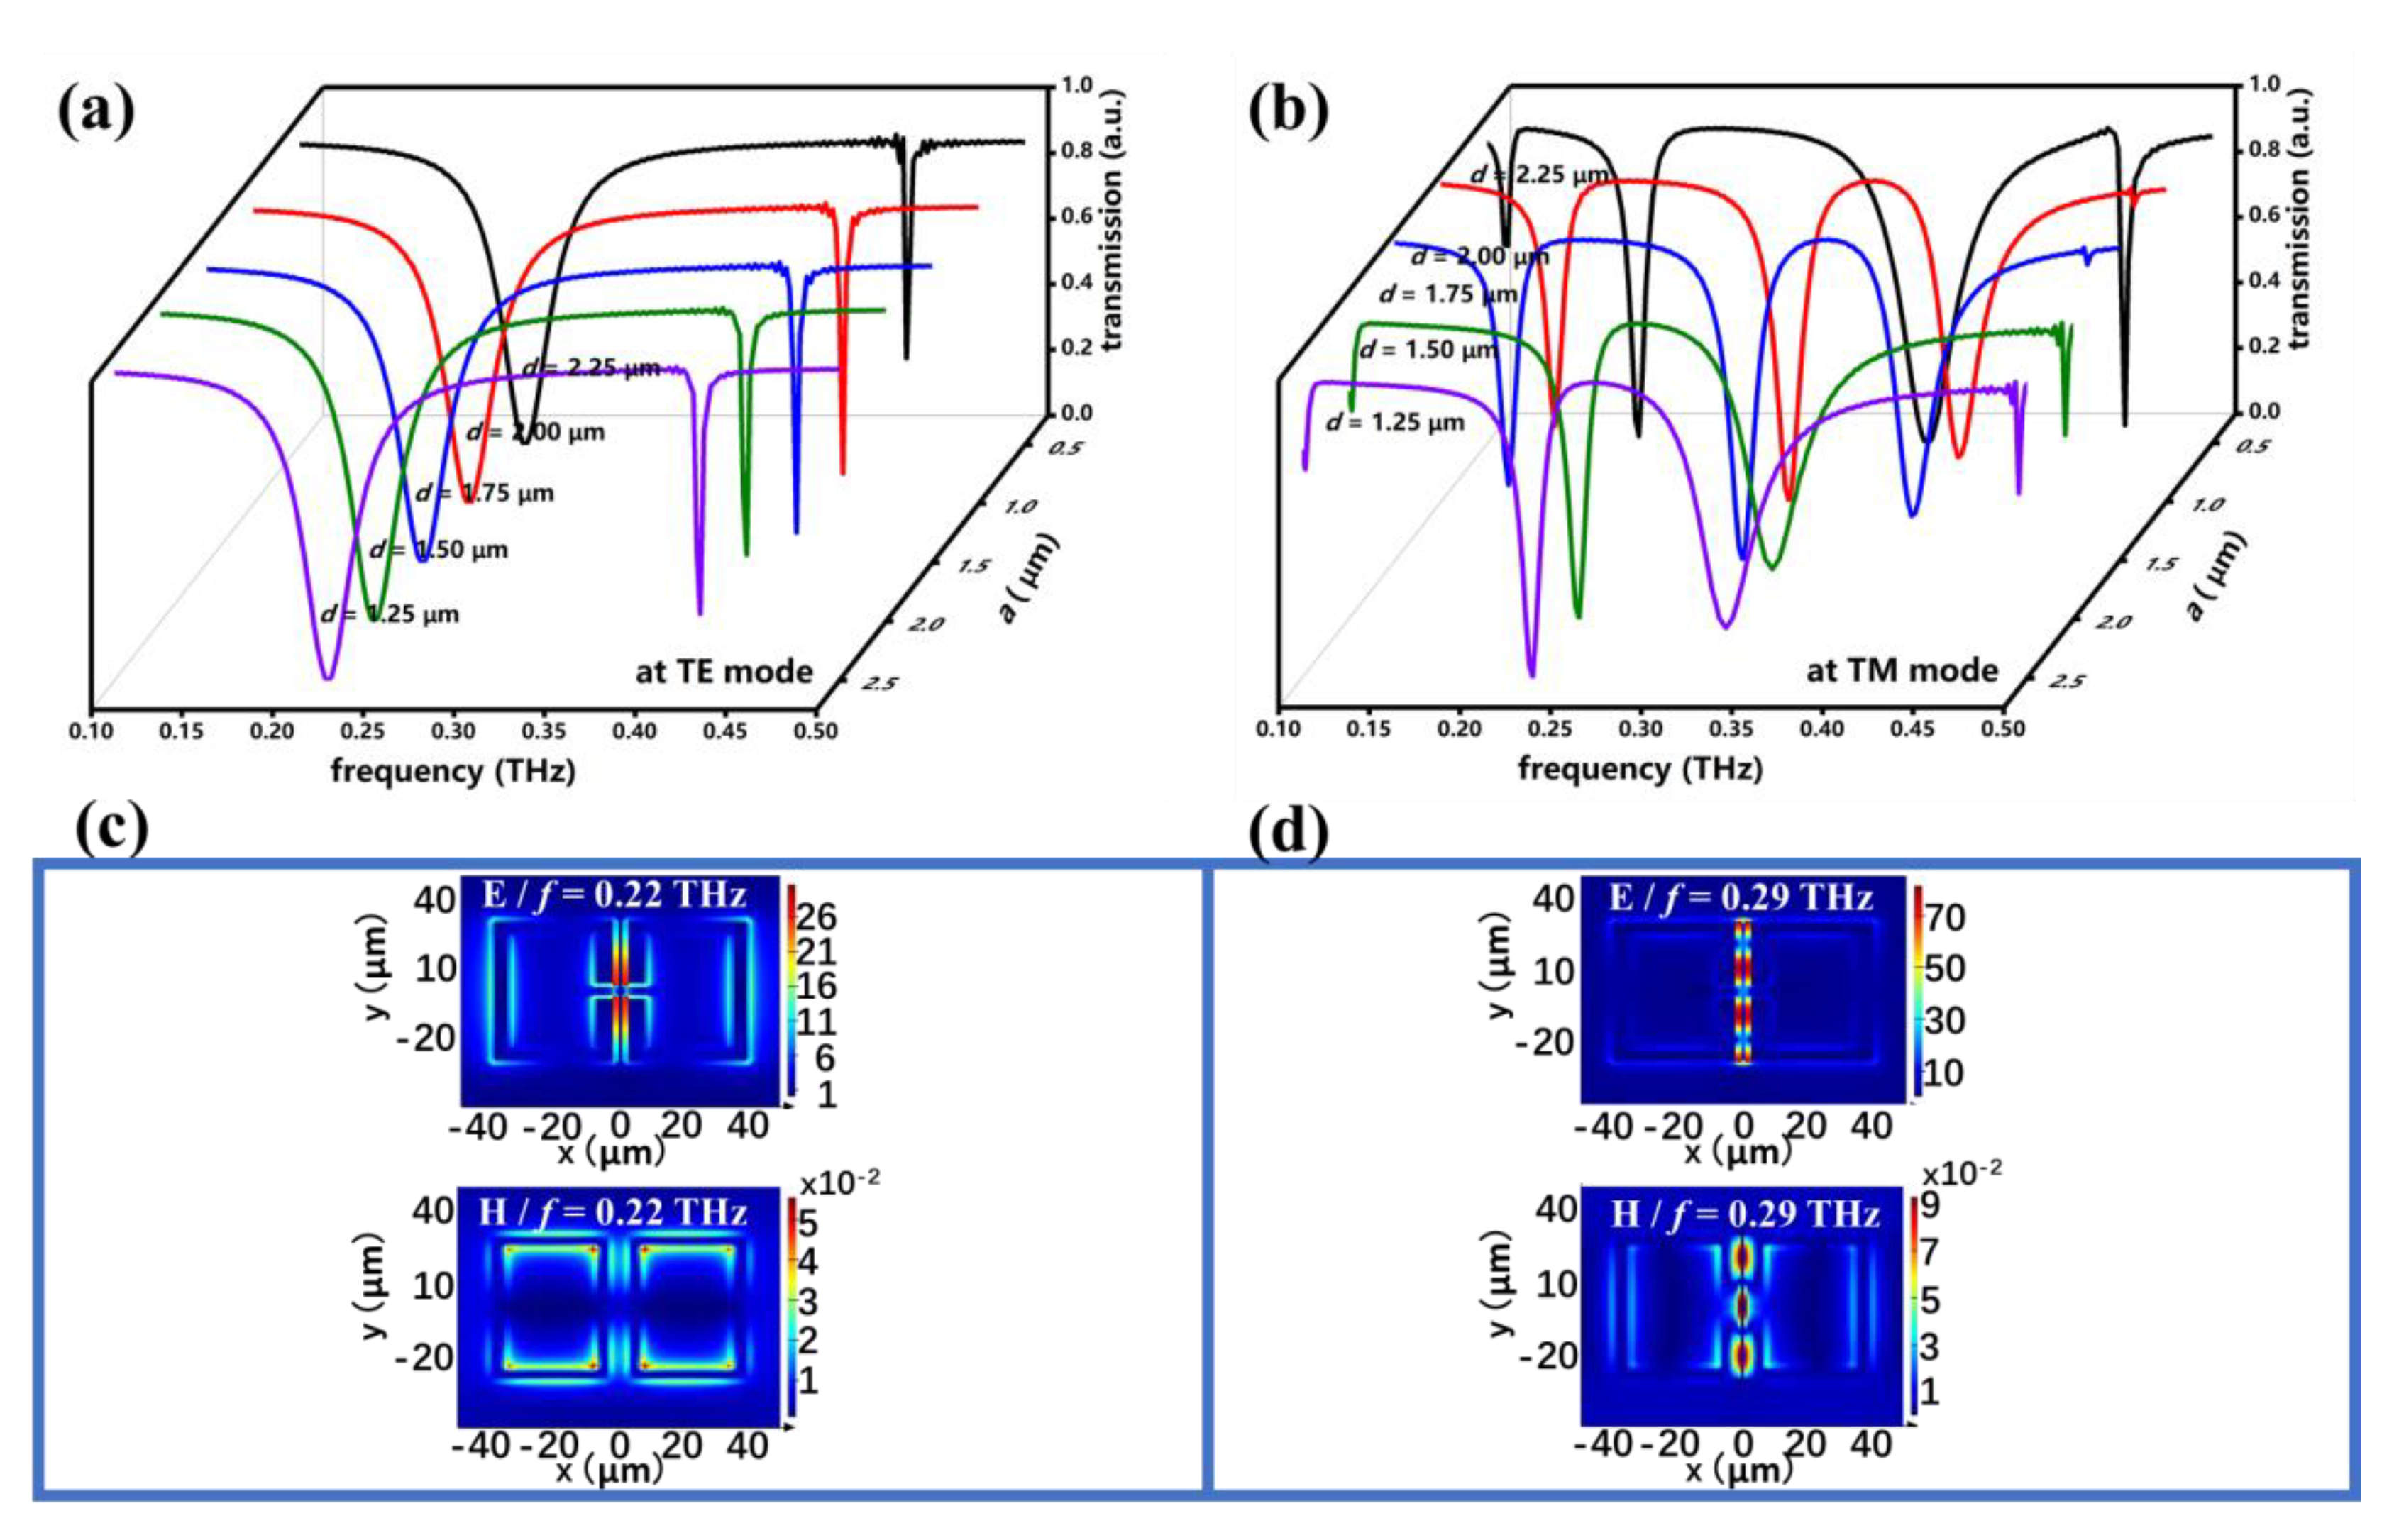
To investigate the coupling effect between the distance of the SRRs and the CWR and the width of the CWR and the incident THz wave, the transmission spectra of PSM_2, obtained by changing the d and a values at the TE mode and the TM mode, are shown in Figure 8a,b, respectively. The distance of the two SRRs is kept constant at 5 μm. By increasing the a value from 0.5 μm to 2.5 μm at the step of 0.5 μm, the d value will decrease accordingly from 2.25 μm to 1.25 μm. At the TE mode, there are two resonances, at 0.22 THz and 0.43 THz, which both show minor variations in resonant frequency and intensity by simultaneously changing the a and d values. This indicates the high stability obtained at the TE mode by changing the a and d values; the electromagnetic responses of PSM_2 are almost the same. In other words, the optical behavior of PSM_2 under the incident THz wave are identical when a and d are changed. At the TM mode, the electromagnetic characteristics show switchable electromagnetic behavior that can be switched from dual-resonance to quad-resonance by decreasing the a value. There are four resonances, at 0.11 THz, 0.18 THz, 0.34 THz, and 0.45 THz, for a = 0.5 μm and d = 2.25 μm, while three resonances are generated at 0.16 THz, 0.29 THz, and 0.38 THz under the conditions of a = 1.0 μm, d = 2.00 μm and a = 1.5 μm, d = 1.75 μm, and two resonances at 0.22 THz and 0.33 THz under the condition of a = 2.0 μm, d = 1.50 μm and a = 2.5 μm, d = 1.25 μm. The corresponding E- and H-field distributions of PSM_2 with a = 1.5 μm, d = 1.75 μm at the TE and TM modes are summarized in Figure 8c,d, respectively. At the TE mode, the E-field is distributed within the middle part of the CWR, except for the areas related to the gaps in the SRRs, and the H-field is distributed around the upper and lower conductor bars of the SRRs, as well as the apexes of the CWR. At the TM mode, the electromagnetic fields are restricted to the contour of the CWR. The electromagnetic field distributions of PSM_2 indicate that the resonances at 0.22 THz at the TE mode and 0.29 THz at the TM mode are LSP resonances. This clarifies that the CWR contributes more at the TM mode.

4. Conclusions

In conclusion, we have demonstrated two designs of PSM devices by modifying the corresponding parameters to investigate their superior electromagnetic properties in the THz wave. The resonances of both devices could be tuned to be blue-shifted or red-shifted by changing the geometrical parameters. By changing the g values, the tuning ranges of both PSMs at the TE mode were 50 GHz from 0.22 THz to 0.27 THz. The tuning ranges of PSM_1 were 40 GHz from 0.13 THz to 0.17 THz (the first resonance) and 100 GHz from 0.34 THz to 0.44 THz (the second resonance) at the TM mode, and those of PSM_2 were 50 GHz from 0.15 THz to 0.20 THz (the first resonance), 70 GHz from 0.29 THz to 0.36 THz (the second resonance), and 70 GHz from 0.37 THz to 0.44 THz (the third resonance). By changing the polarization angle between 0 degrees (TE mode) to 90 degrees (TM mode), the electromagnetic responses exhibited by PSM_1 could be manipulated from single-resonance (at the TE mode) to dual-resonance (at the TM mode), while the electromagnetic responses exhibited by PSM_2 could be switched from single-resonance (at the TE mode) to triple-resonance (at the TM mode). This indicates that both PSM devices show polarization switching characteristics. By changing the s value from 0 μm to 40 μm, the electromagnetic responses of PSM_1 show a switch characteristic that can be manipulated from single-resonance to triple-resonance at the TE mode and from dual-resonance to triple-resonance at the TM mode, and PSM_2 exhibits a switch characteristic that can be switched from single-resonance to triple-resonance at the TE mode and from dual-resonance to quad-resonance at the TM mode. Furthermore, PSM_2 shows stability at the TE mode and exhibits a switchable characteristic that can be manipulated between dual-resonance, triple-resonance, and quad-resonance at the TM mode by simultaneously changing the a and d values. The proposed PSM devices exhibit polarization-sensitive characteristics, which can be made more controllable and exhibit better optical performance. Such designs with multiband resonance are desirable for THz-wave applications, such as tunable polarizers, high-sensitive sensors, multispectral imagers, polarization-sensitive devices, multifunctional switches, and so on.

Author Contributions

Conceptualization, X.C. and Y.-S.L.; methodology, X.C. and Y.-S.L.; software, X.C.; validation, X.C. and Y.-S.L.; formal analysis, X.C. and Y.-S.L.; investigation, X.C. and Y.-S.L.; resources, X.C. and Y.-S.L.; data curation, X.C. and Y.-S.L.; writing—original draft preparation, X.C. and Y.-S.L.; writing—review and editing, X.C. and Y.-S.L.; visualization, X.C. and Y.-S.L.; supervision, Y.-S.L.; project administration, Y.-S.L.; funding acquisition, Y.-S.L. All authors have read and agreed to the published version of the manuscript.

Funding

This research was funded by the financial support from the National Key Research and Development Program of China (2019YFA0705000).

Conflicts of Interest

The authors declare no conflict of interest.

References

  1. Liu, Y.M.; Zhang, X. Metamaterials: A new frontier of science and technology. Chem. Soc. Rev. 2011, 40, 2494–2507. [Google Scholar] [CrossRef] [PubMed]
  2. Shelby, R.A.; Smith, D.R.; Schultz, S. Experimental verification of a negative index of refraction. Science 2001, 292, 77–79. [Google Scholar] [CrossRef] [PubMed] [Green Version]
  3. Smith, D.R.; Padilla, W.J.; Vier, D.C.; Nemat-Nasser, S.C.; Schultz, S. Composite medium with simultaneously negative permeability and permittivity. Phys. Rev. Lett. 2000, 84, 4184–4187. [Google Scholar] [CrossRef] [PubMed] [Green Version]
  4. Ou, H.; Lu, F.; Xu, Z.; Lin, Y.S. Terahertz Metamaterial with Multiple Resonances for Biosensing Application. Nanomaterials 2020, 10, 1038. [Google Scholar] [CrossRef] [PubMed]
  5. Ghanim, A.M.; Hussein, M.; Hameed, M.F.O.; Yahia, A.; Obayya, S.S.A. Highly Directive Hybrid Yagi-Uda Nanoantenna for Radition Emission Enhancement. IEEE Photonics J. 2016, 8, 12. [Google Scholar] [CrossRef]
  6. Cai, W.S.; Chettiar, U.K.; Kildishev, A.V.; Shalaev, V.M. Optical cloaking with metamaterials. Nat. Photonics 2007, 1, 224–227. [Google Scholar] [CrossRef] [Green Version]
  7. Xu, R.; Lin, Y.S. Characterizations of reconfigurable infrared metamaterial absorbers. Opt. Lett. 2018, 43, 4783–4786. [Google Scholar] [CrossRef]
  8. Tao, H.; Bingham, C.M.; Strikwerda, A.C.; Pilon, D.; Shrekenhamer, D.; Landy, N.I.; Fan, K.; Zhang, X.; Padilla, W.J.; Averitt, R.D. Highly flexible wide angle of incidence terahertz metamaterial absorber: Design, fabrication, and characterization. Phys. Rev. B 2008, 78, 4. [Google Scholar] [CrossRef]
  9. Xu, R.; Luo, J.; Sha, J.; Zhong, J.; Xu, Z.; Tong, Y.; Lin, Y.S. Stretchable IR metamaterial with ultra-narrowband perfect absorption. Appl. Phys. Lett. 2018, 113, 101907. [Google Scholar] [CrossRef]
  10. Mo, Y.; Zhong, J.; Lin, Y.S. Tunable Chevron-Shaped Infrared Metamaterial. Mater. Lett. 2020, 263, 127291. [Google Scholar] [CrossRef]
  11. Lu, F.; Ou, H.; Liao, Y.; Zhu, F.; Lin, Y.S. Actively Switchable Terahertz Metamaterial. Results Phys. 2019, 15, 102756. [Google Scholar] [CrossRef]
  12. Cheng, S.; Xu, Z.; Yao, D.; Zhang, X.; Zhang, Z.; Lin, Y.S. Electromagnetically induced transparency in terahertz complementary spiral-shape metamaterial. OSA Contin. 2019, 2, 2137–2144. [Google Scholar] [CrossRef]
  13. Lin, Y.S.; Liao, S.; Liu, X.; Tong, Y.; Xu, Z.; Xu, R.; Yao, D.; Yu, Y. Tunable terahertz metamaterial by using three-dimensional double split-ring resonators. Opt. Laser Technol. 2019, 112, 215–221. [Google Scholar] [CrossRef]
  14. Zhan, F.; Lin, Y.S. Tunable Multi-Resonance Using Complementary Circular Metamaterial. Opt. Lett. 2020, 45, 3633–3636. [Google Scholar] [CrossRef]
  15. Zhong, J.; Lin, Y.S. Electromechanically Rotatable Cross-Shaped Mid-IR Metamaterial. Crystals 2020, 10, 431. [Google Scholar] [CrossRef]
  16. Yang, W.; Lin, Y.S. Tunable metamaterial filter for optical communication in the terahertz frequency range. Opt. Express 2020, 28, 396602. [Google Scholar] [CrossRef]
  17. Lin, Y.S.; Dai, J.; Zeng, Z.; Yang, B.R. Metasurface Color Filters Using Aluminum and Lithium Niobate Configurations. Nanoscale Res. Lett. 2020, 15, 77. [Google Scholar] [CrossRef] [PubMed]
  18. Dai, J.; Xu, R.; Lin, Y.S.; Chen, C.H. Tunable electromagnetic characteristics of suspended nanodisk metasurface. Opt. Laser Technol. 2020, 128, 106214. [Google Scholar] [CrossRef]
  19. Huang, W.; Xu, R.; Lin, Y.S.; Chen, C.H. Three-Dimensional Pyramid Metamaterial with Tunable Broad Absorption Bandwidth. AIP Adv. 2020, 10, 035125. [Google Scholar] [CrossRef] [Green Version]
  20. Liu, P.; Liang, Z.; Lin, Z.; Xu, Z.; Xu, R.; Yao, D.; Lin, Y.S. Actively tunable terahertz chain-link metamaterial with bidirectional polarization-dependent characteristic. Sci. Rep. 2019, 9, 9917. [Google Scholar] [CrossRef]
  21. Xu, Z.; Lin, Y.S. A stretchable terahertz parabolic-shaped metamaterial. Adv. Opt. Mater. 2019, 7, 1900379. [Google Scholar] [CrossRef]
  22. Xu, Z.; Lin, Z.; Cheng, S.; Lin, Y.S. Reconfigurable and Tunable Terahertz Wrench-Shape Metamaterial Performing Programmable Characteristic. Opt. Lett. 2019, 44, 3944–3947. [Google Scholar] [CrossRef] [PubMed]
  23. Lin, Z.; Xu, Z.; Liu, P.; Liang, Z.; Lin, Y.S. Polarization-Sensitive Terahertz Resonator Using Asymmetrical F-shaped Metamaterial. Opt. Laser Technol. 2020, 121, 105826. [Google Scholar] [CrossRef]
  24. Shrekenhamer, D.; Chen, W.C.; Padilla, W.J. Liquid Crystal Tunable Metamaterial Absorber. Phys. Rev. Lett. 2013, 110, 5. [Google Scholar] [CrossRef] [PubMed]
  25. Shen, N.H.; Massaouti, M.; Gokkavas, M.; Manceau, J.M.; Ozbay, E.; Kafesaki, M.; Koschny, T.; Tzortzakis, S.; Soukoulis, C.M. Optically Implemented Broadband Blueshift Switch in the Terahertz Regime. Phys. Rev. Lett. 2011, 106, 4. [Google Scholar] [CrossRef]
  26. Zhang, C.H.; Zhou, G.H.; Wu, J.B.; Tang, Y.H.; Wen, Q.Y.; Li, S.X.; Han, J.G.; Jin, B.B.; Chen, J.; Wu, P.H. Active Control of Terahertz Waves Using Vanadium-Dioxide-Embedded Metamaterials. Phys. Rev. Appl. 2019, 11, 10. [Google Scholar] [CrossRef]
  27. Jin, B.B.; Zhang, C.H.; Engelbrecht, S.; Pimenov, A.; Wu, J.B.; Xu, Q.Y.; Cao, C.H.; Chen, J.A.; Xu, W.W.; Kang, L.; et al. Low loss and magnetic field-tunable superconducting terahertz metamaterial. Opt. Express 2010, 18, 17504–17509. [Google Scholar] [CrossRef] [PubMed] [Green Version]
  28. Hu, X.; Zheng, D.; Lin, Y.S. Actively Tunable Terahertz Metamaterial with Single-Band and Dual-Band Switching Characteristic. Appl. Phys. A-Mater. Sci. Process. 2020, 126, 110. [Google Scholar] [CrossRef]
  29. Zheng, D.; Hu, X.; Lin, Y.S.; Chen, C.H. Tunable Multi-Resonance of Terahertz Metamaterial Using Split-Disk Resonators. AIP Adv. 2020, 10, 025108. [Google Scholar] [CrossRef] [Green Version]
  30. Willets, K.A.; van Duyne, R.P. Localized surface plasmon resonance spectroscopy and sensing. Annu. Rev. Phys. Chem. 2007, 58, 267–297. [Google Scholar] [CrossRef] [Green Version]
Figure 1. Schematic drawings and the corresponding denotations of (a) PSM_1 and (b) PSM_2 unit cells.
Crystals 10 00611 g001
Figure 2. Transmission spectra of PSM_1 with different g values at the (a) TE and (b) TM modes. Here, (c) and (d) are the corresponding E-field and H-field distributions of PSM_1, with g = 30 μm at TE and TM modes, respectively (f is the monitored frequency).
Crystals 10 00611 g002
Figure 3. Transmission spectra of PSM_1 with different d values at the (a) TE and (b) TM modes. Here, (c) and (d) are the corresponding E-field and H-field distributions of PSM_1 with d = 25 μm at TE and TM modes, respectively (f is the monitored frequency).
Crystals 10 00611 g003
Figure 4. Transmission spectra of PSM_1 with different s values at the (a) TE and (b) TM modes. Here, (c) and (d) are the corresponding E-field and H-field distributions of PSM_1 with s = 0 μm, 20 μm, and 40 μm at TE and TM modes, respectively (f is the monitored frequency).
Crystals 10 00611 g004
Figure 5. Transmission spectra of PSM_2 by changing g value at the (a) TE and (b) TM modes. Here, (c) and (d) are the corresponding E-field and H-field distributions of PSM_2 with g = 30 μm at TE and TM modes, respectively (f is the monitored frequency).
Crystals 10 00611 g005
Figure 6. Transmission spectra of PSM_2 by changing s value the at (a) TE and (b) TM modes. Here, (c) and (d) are the corresponding E-field and H-field distributions of PSM_2 with s = 0 μm, 20 μm, and 40 μm at TE and TM modes, respectively (f is the monitored frequency).
Crystals 10 00611 g006
Figure 7. Transmission spectra of PSM_2 by changing d value at the (a) TE and (b) TM modes. Here, (c) and (d) are the corresponding E-field and H-field distributions of PSM_2 with d = 12 μm at TE and TM modes, respectively (f is the monitored frequency).
Crystals 10 00611 g007
Figure 8. Transmission spectra of PSM_2 by changing a and d values at the (a) TE and (b) TM modes. Here, (c) and (d) are the corresponding E-field and H-field distributions of PSM_2 with a = 1.5 μm, d = 1.75 μm at TE and TM modes, respectively (f is the monitored frequency).
Crystals 10 00611 g008

