Crystallization of GeO2–Al2O3–Bi2O3 Glass


Institute of Materials Engineering, Faculty of Science and Technology, University of Silesia, Katowice, 75 Pułku Piechoty Str. 1a, 41-500 Chorzów, Poland
*
Author to whom correspondence should be addressed.
Crystals 2020, 10(6), 522; https://doi.org/10.3390/cryst10060522
Submission received: 22 April 2020
/
Revised: 9 June 2020
/
Accepted: 11 June 2020
/
Published: 18 June 2020
(This article belongs to the Special Issue Transparent Glass Ceramics)
Abstract
:In the presented work, two kinds of germanium oxide glass with different compositions, namely GeO2 and GeO2–Al2O3–Bi2O3, were investigated. After controlled crystallization of a glassy sample, the emission in the NIR-range was determined (1165 nm with excitation at 470 nm). To better understanding the kinetics of the glass crystallization, the activation energy was also determined by applying the Kissinger method. The obtained results show that in the case of GeO2–Al2O3–Bi2O3, activation energy value was 400 and 477 kJ/mol, which means that such values are significantly larger than for pure GeO2 (254 kJ/mol). The investigations also show that two phases crystallized in the complex glass matrix: the mullite-like phase and germanium oxide.
1. Introduction
It is well known that glass–ceramic technology is based on controlled nucleation and growth of crystalline phases in some glass. The behavior of the glass crystallization process can be examined utilizing thermal analysis. Therefore, the thermogravimetric studies of glass are essential for scientific interest to identify barriers to crystallization. Usually, the practical range of glass is between the glass transition temperature, Tg, and the crystallization temperature, Tx. It is known that controlled crystallization in this area leads to the formation of small crystalline particles that are distributed in the glass matrix [1,2]. Such kinds of materials are also of prime importance for optics. This is due to the formation in the glass matrix of nanocrystals containing activators, which are the source of their crystalline environment. However, it is also possible that the activator species, like ions or metal nanoparticles, can be directly excited and made to emit light without it. It is typical for a glass-like laser gain, but in such glass, the emissivity can be reduced by induced crystallization.
The germanium oxide glass are well-known functional materials that have been used for different photonic devices, e.g., laser [3,4], amplifier [3,5], phosphors [6,7], and glass fiber [8]. For the phosphors, the host material (matrix) is usually made of GeO2 glass with different additions, for example, SiO2 and fluorides [9], BaO and Ga2O5 [10], CaO and Al2O3 [11,12], and B2O3 and ZnO [13].
The pure germanium dioxide, GeO2, has a structure that mainly consists of the form of tetrahedral units, similar to SiO2. These units are built by a network of four coordinated Ge atoms, which are interrupted by the presence of alkali metal oxides. In this way, there are six coordinated germanium ions [14]. The literature states that there are possible interactions with Al2O3 forms in the glassy networked blocks of TOx units (where T = Al, Ge, and the index for x = 4, 5, or 6) [15]. As a consequence, oxygen vacancies are created in the glass. It is also known that both rare earth metals, i.e., Ho, Tm, Yb [9], Nd [16], Ce [17], and Er [18] and the transition metals, such as Mn [13], Cr [12], and Bi [19,19,20,21,22], have been used as activators for the GeO2 glass-like matrix. Above all, bismuth especially plays an extraordinary role because it causes an IR emission in the glass-like matrix. On the other hand, it is astonishing that the Bi-ions, depending on the valency and the crystalline environment, are emitted in the VUV range (e.g., YPO4:Bi [23]), the VIS range (e.g., SrB4O7:Bi [24], GdVO4:Bi [25]), or in the near IR range (BaBPO4:Bi [26]).
The presented paper is focused on the development and characterization of GeO2–Al2O3–Bi2O3 glass. Therefore, our investigations show the crystallization process of pure GeO2 and complex GeO2–Al2O3–Bi2O3 glass. Both materials were prepared using standard melt quenching techniques and annealing processes, and for this reason, the accompanying structural and phase changes were evaluated. The kinetic aspects were recorded for both compositions obtained, and changes in the functional properties of these IR phosphors were explained. Moreover, the homogeneity and quality of the glass produced were also analyzed.
2. Materials and Methods
Preparation of the pure GeO2 glass as well the glass with a nominal composition of 93GeO2–6Al2O3–1Bi2O3 (given in mol%) was carried out in a 100 g batch in a corundum crucible (6 cm in diameter) for 1 h at 1250 °C. After melting at a temperature of 1250 °C, the glass became very viscous and not suitable for pouring. The temperature was then increased to 1500 °C (1 h), and the glass viscosity became low, enabling the glass to be poured onto a steel plate. Due to the contact of the liquid glass with the crucible walls, the glass composition may become enriched with aluminum. However, it can be assumed that the nominal glass composition was hardly changed, because the crucible walls did not react with the sample and, after cooling, showed only a substantial wetting with the glass. After cooling, the internal stresses were removed from the obtained glass by thermal treatment at a temperature of 400 °C. The GeO2 glass was colorless and transparent, while the complex 93GeO2–6Al2O3–1Bi2O3 glass had a dark red color.
It was observed that during thermal treatment in the range of 500–650 °C, the colored glass became dark or dark-brown, and after further crystallization at a temperature above ~850 °C, it took on the form of a powder that was white color and lost its transparency.
To study the crystallization process of GeO2 and 93GeO2–6Al2O3–1Bi2O3 glass, they were characterized by X-ray diffraction (XRD, Rigaku MiniFlex II) as well as by thermal analysis (NETZSCH STA 409). Full pattern identification was made by using the X’Pert HighScorePlus software package (created by PANalytical B.V.). Data from the PDF database (International Centre for Diffraction Data (ICDD®)) [27] were used as a reference for the structural analysis. The optical transmittance of prepared glass was measured over the wavelength region from 200 to 1000 nm using a spectrophotometer (Thermo Scientific Genisys 10S), and the emission with a spectrometer (Edinburgh Instruments FS920) with excitation of 470 nm. The morphologies of samples were investigated using scanning electron microscopy (SEM, HITACHI S-4700) with a system of microanalysis (EDXS-NORAN Vantage). The fractured surfaces of the glass were prearranged and coated with the graphite.
3. Results
3.1. Glass Characteristics
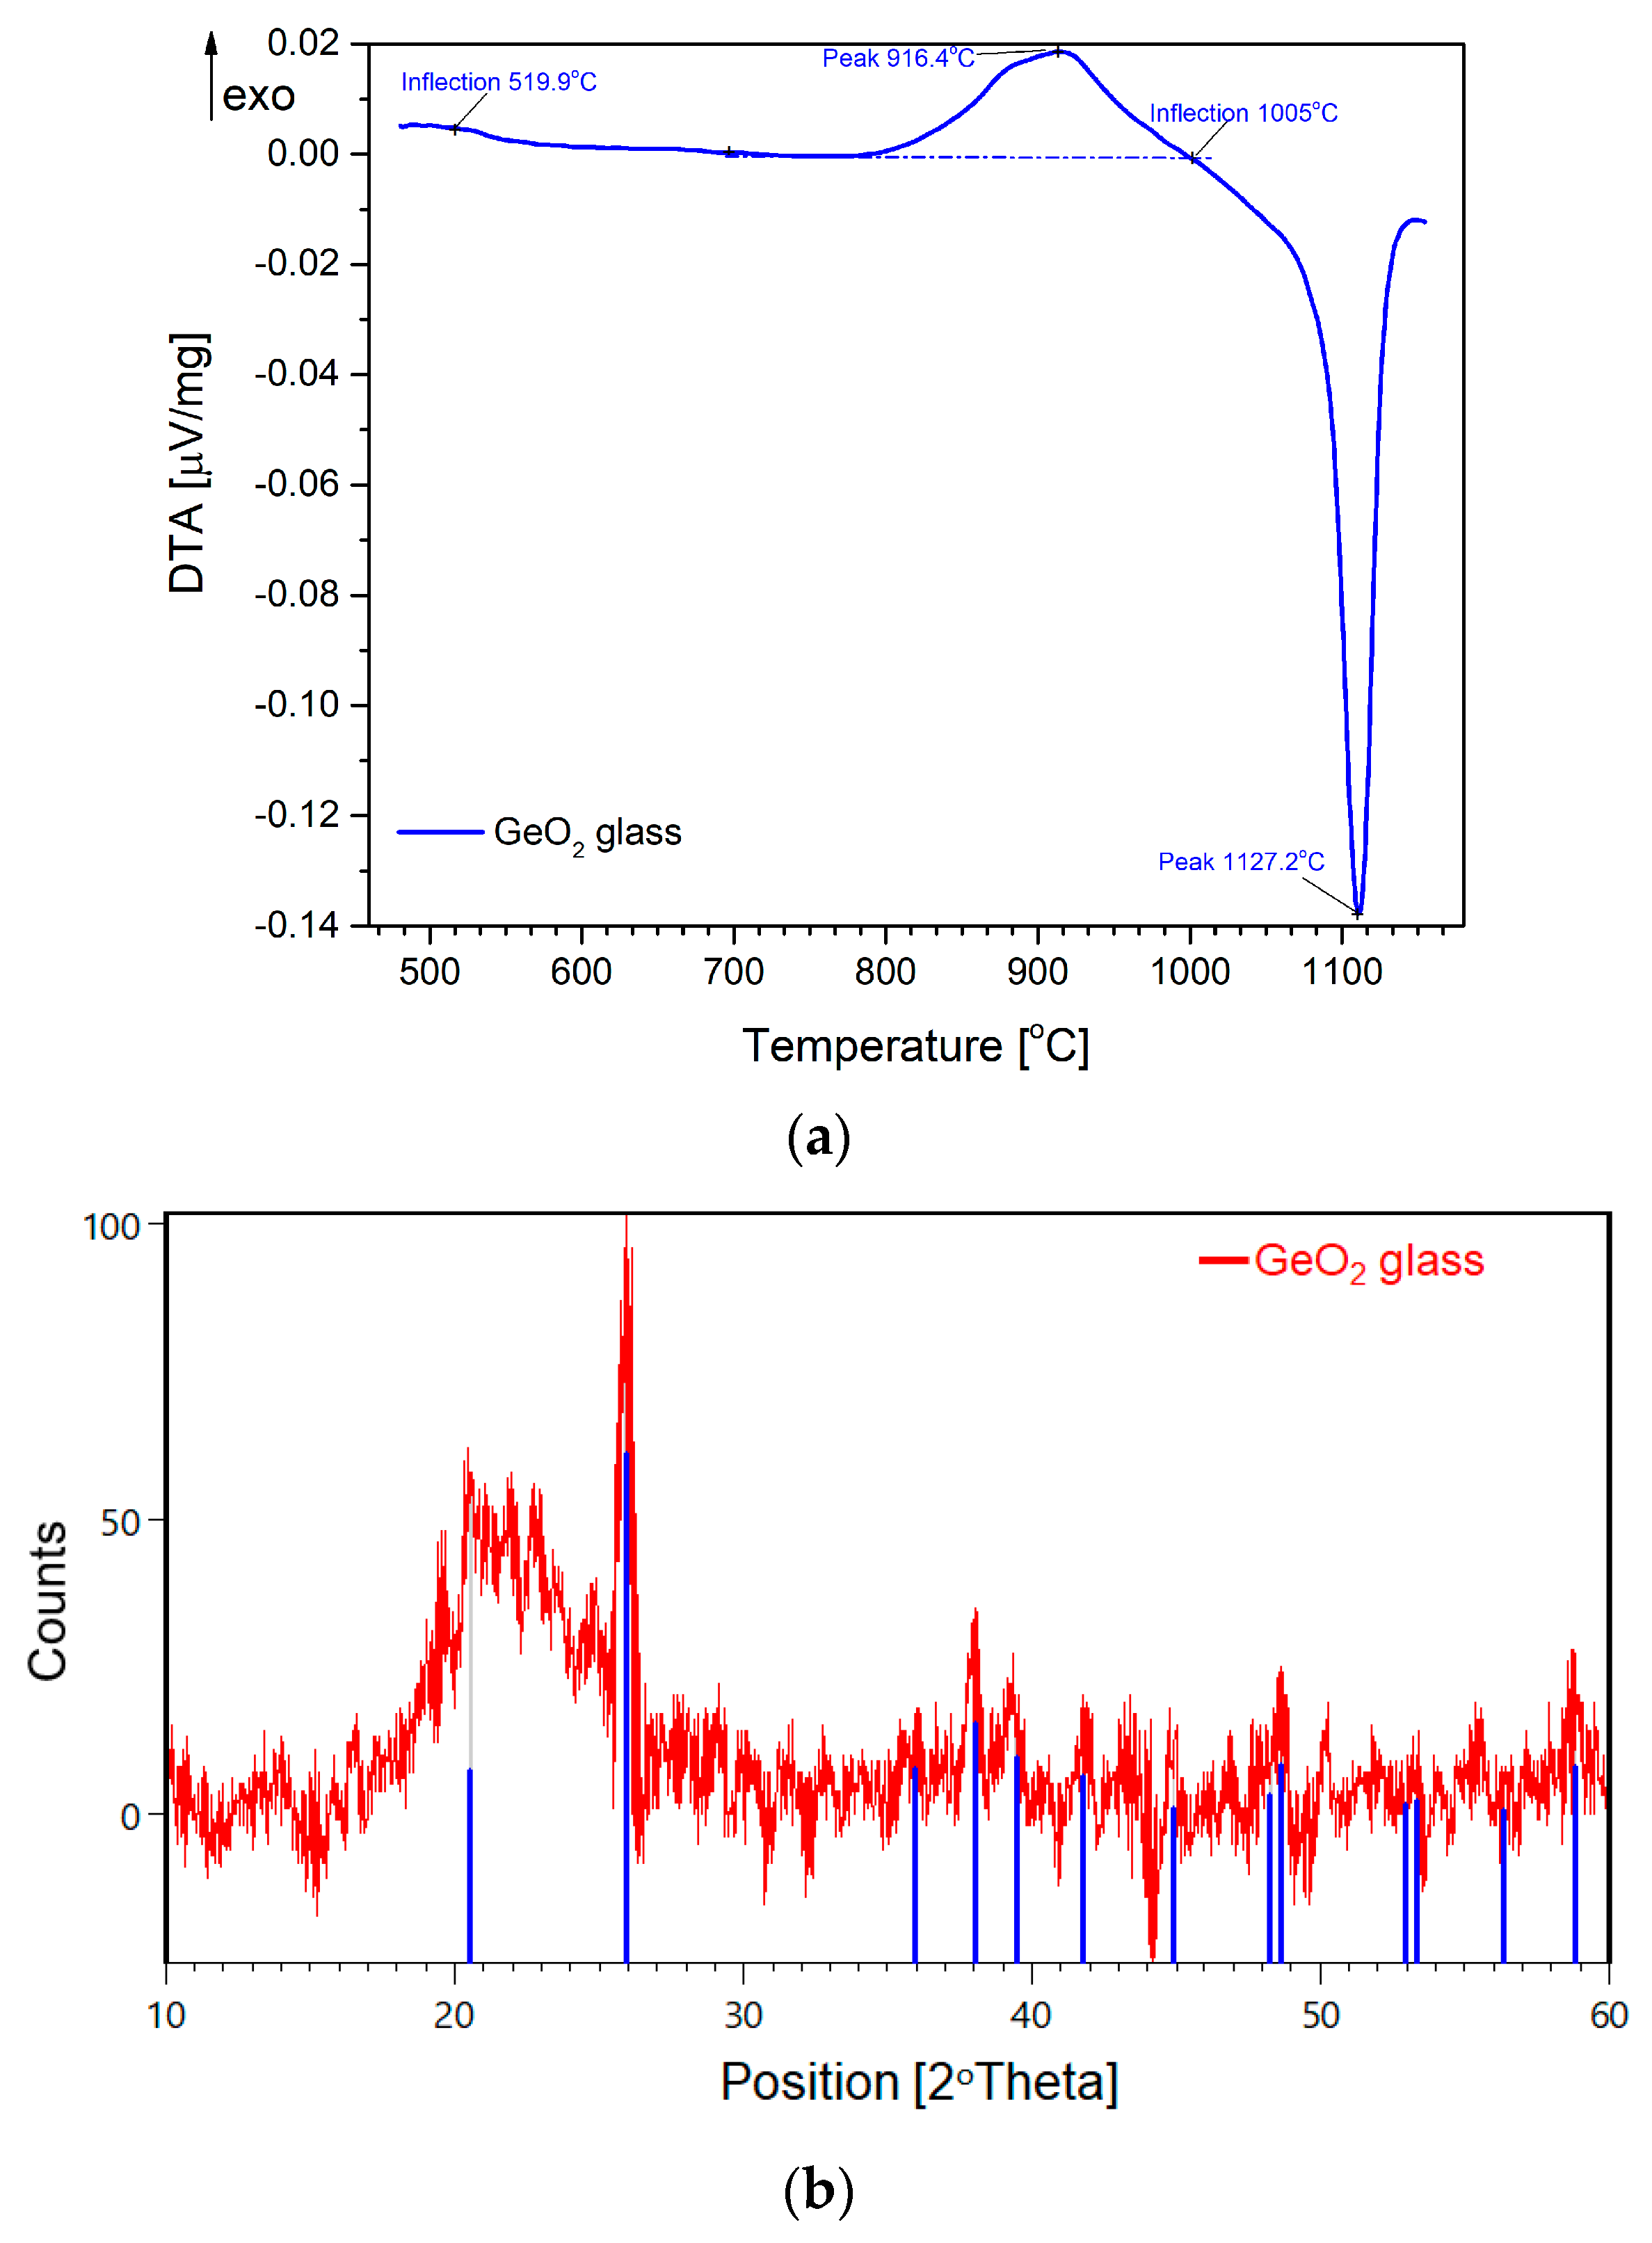
For a better understanding of the crystallization process of the 93GeO2–6Al2O3–1Bi2O3 system, some analyses were also performed for the pure germanium oxide glass. Figure 1 shows detailed information about GeO2 glass based on the differential thermal analysis (DTA) curve and for X-ray diffraction pattern data.
Thermal analysis of the pure GeO2 glass confirmed that it was crystallized above 700 °C (Figure 1a). The DTA curve showed an exothermic peak of the weak crystallization in the temperature range 750–1005 °C, with a Tx temperature of 916.4 °C. Above the temperature of 1005 °C, the beginning of the endothermic peak was observed, which can be explained as the melting of GeO2. For this reason, the quenched of pure glass had already contained a small amount of the crystalline phase, which was also observed on the XRD pattern (Figure 1b). The resulting phase of glass was identified as a hexagonal phase of GeO2 (ICDD® 01-083-2480).
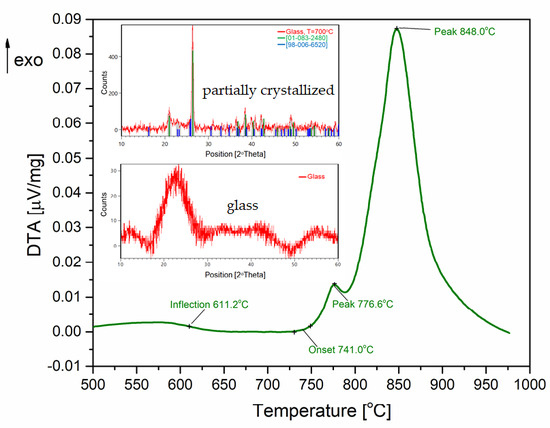
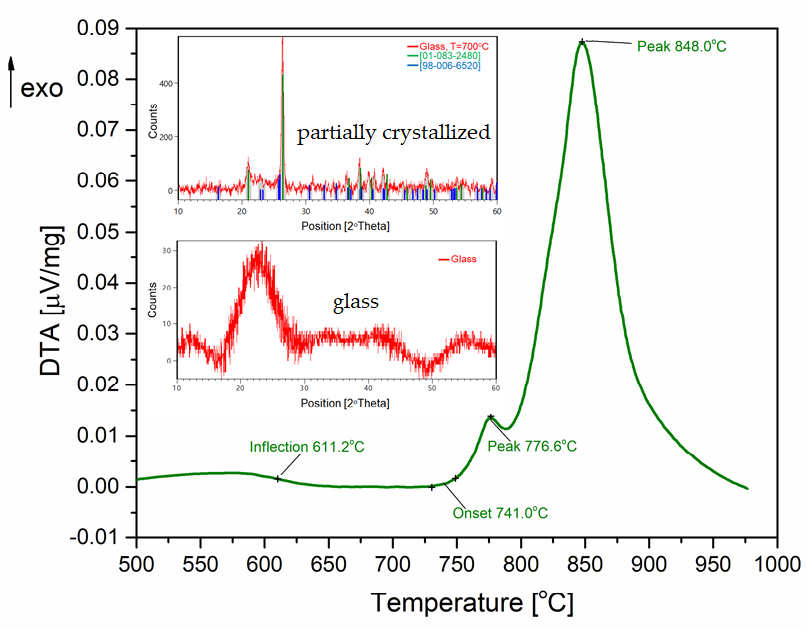
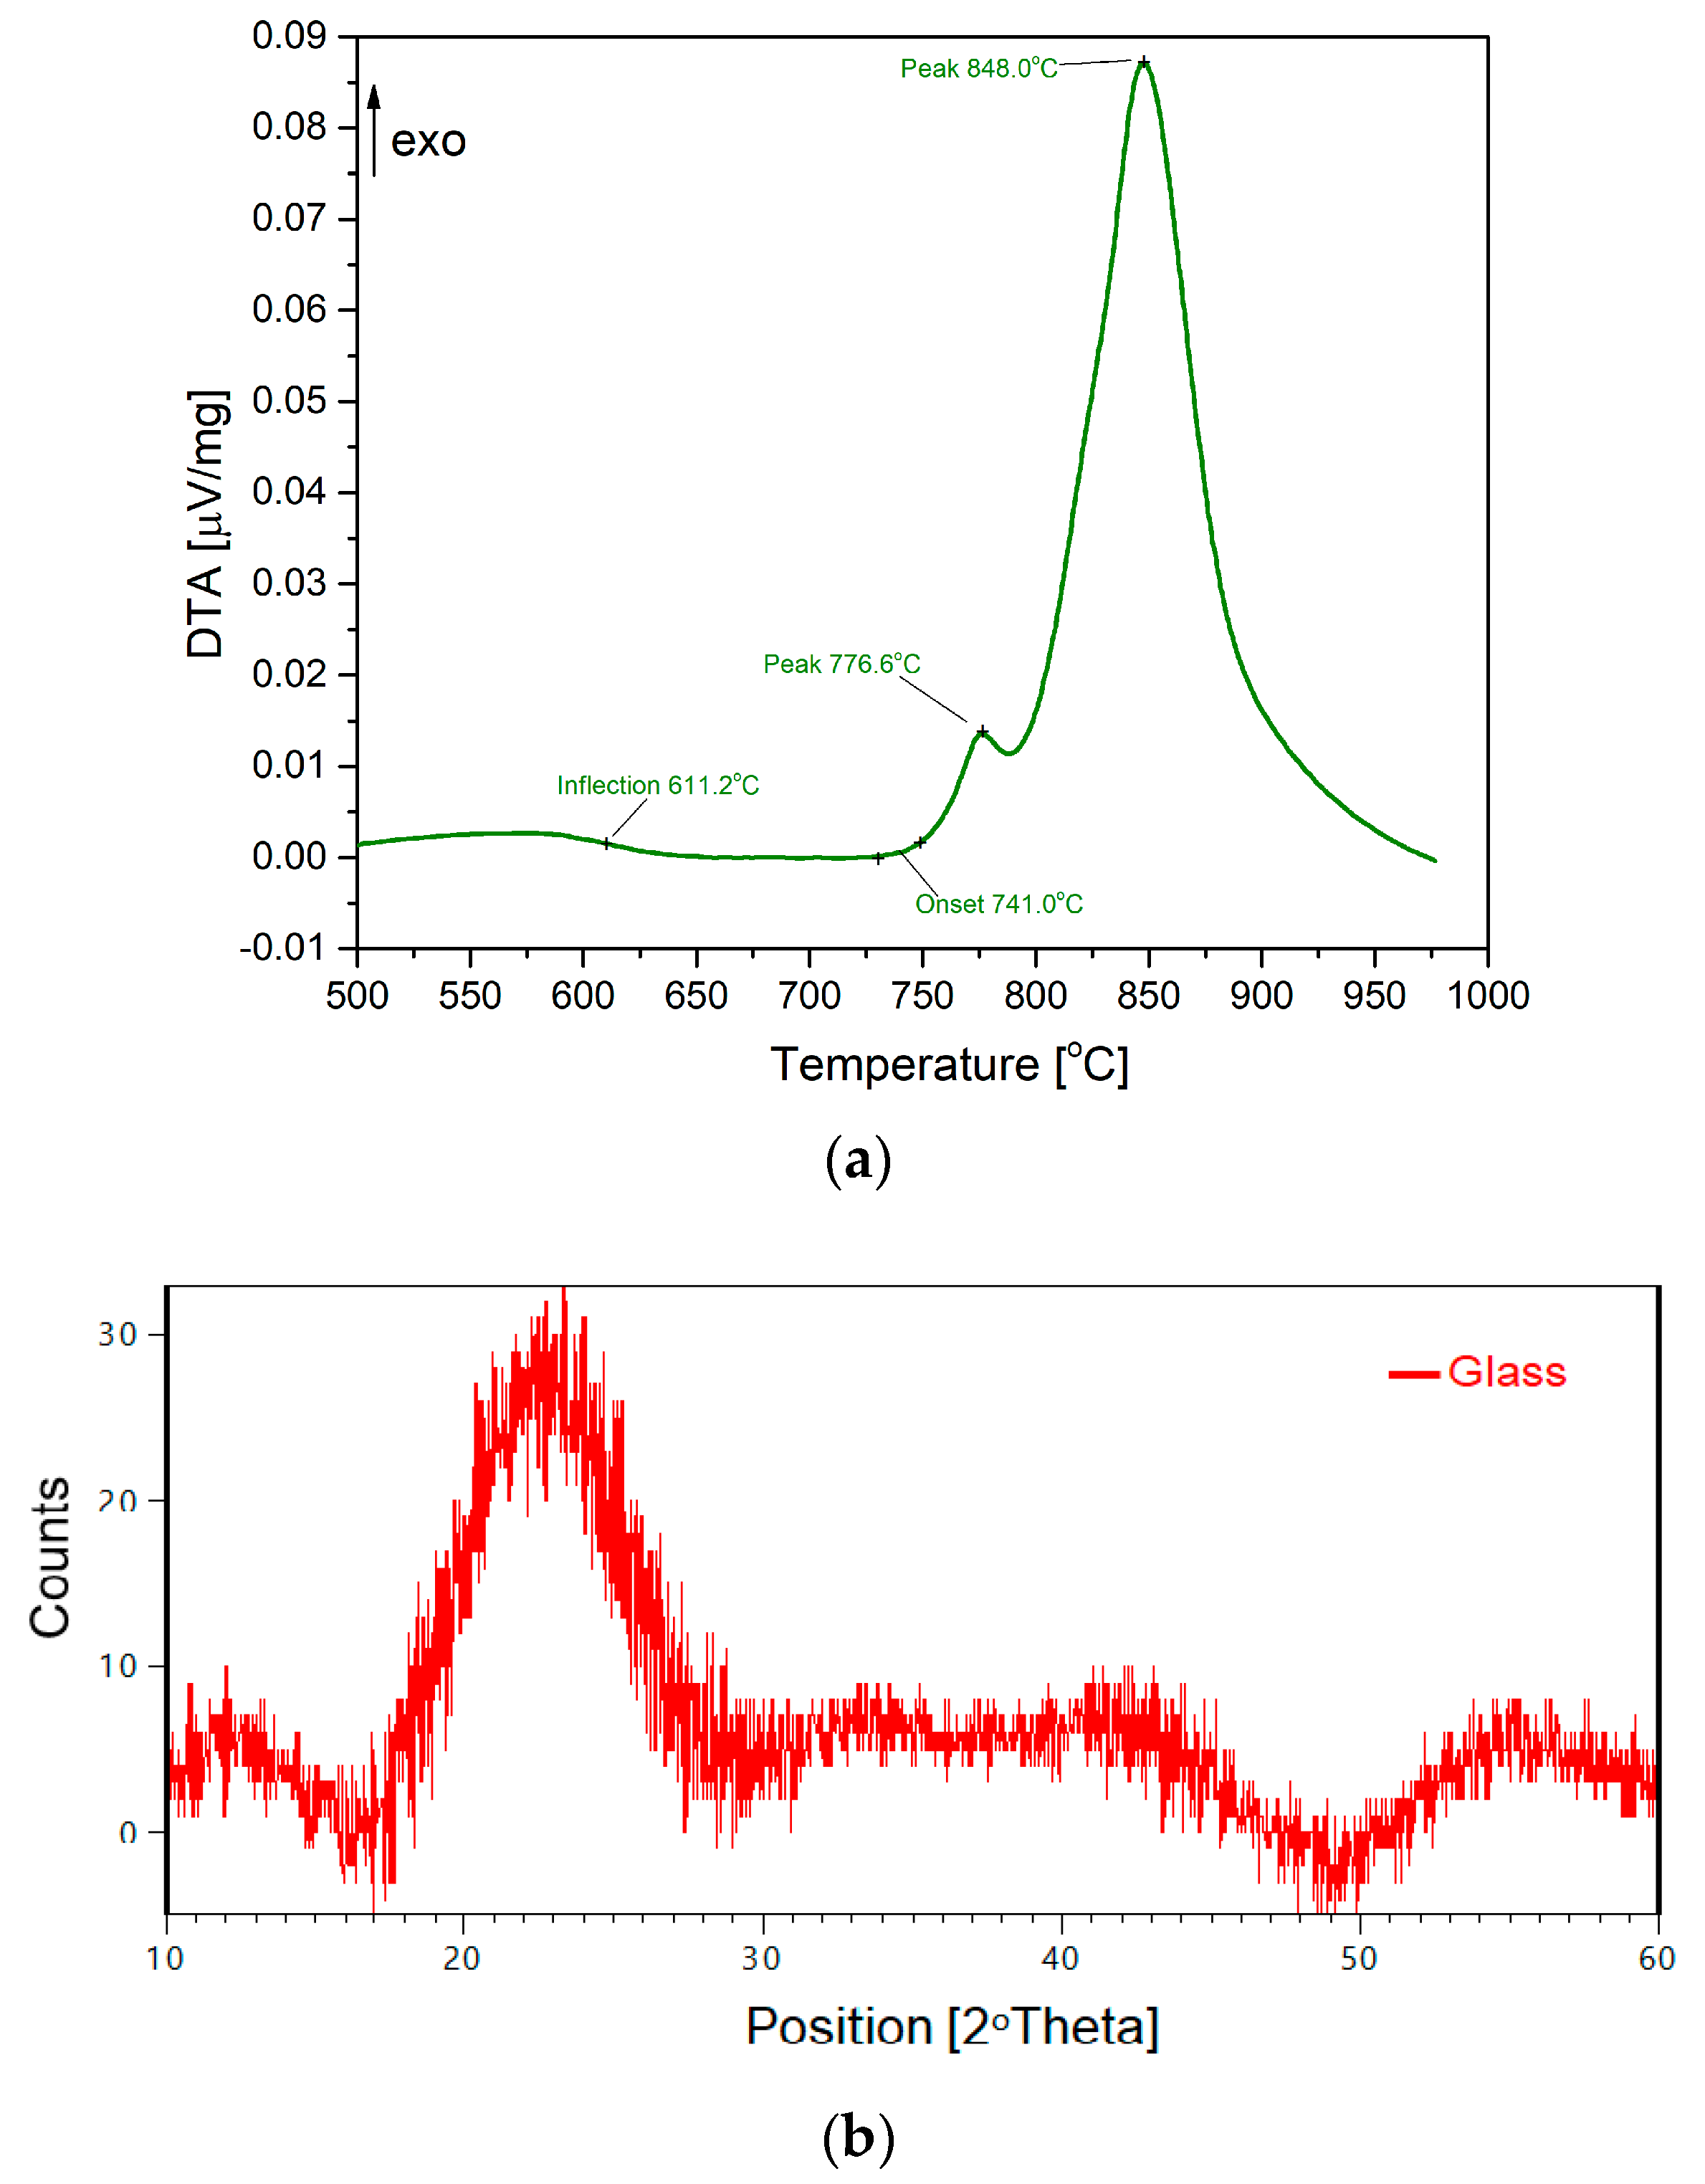
A similar analysis was done for 93GeO2–6Al2O3–1Bi2O3 glass. The characteristics obtained are shown in Figure 2.
The behavior of the glass during its heating was investigated using differential thermal analysis. On the DTA curve of the 93GeO2–6Al2O3–1Bi2O3 system (Figure 2a) the glass transition temperature of Tg = 611 °C, as well as the two crystallization effects at Tx1 = 776.8 °C and Tx2 = 848 °C were observed, where the heating rate was 10 °C/min.
As the X-ray diffraction analysis of the 93GeO2–6Al2O3–1Bi2O3 system shows, the examined glass was completely amorphous without sharp crystalline peaks (Figure 2b). The presence of a raised background in the range of 20–30°, a halo effect, indicates the lack of long-range order.
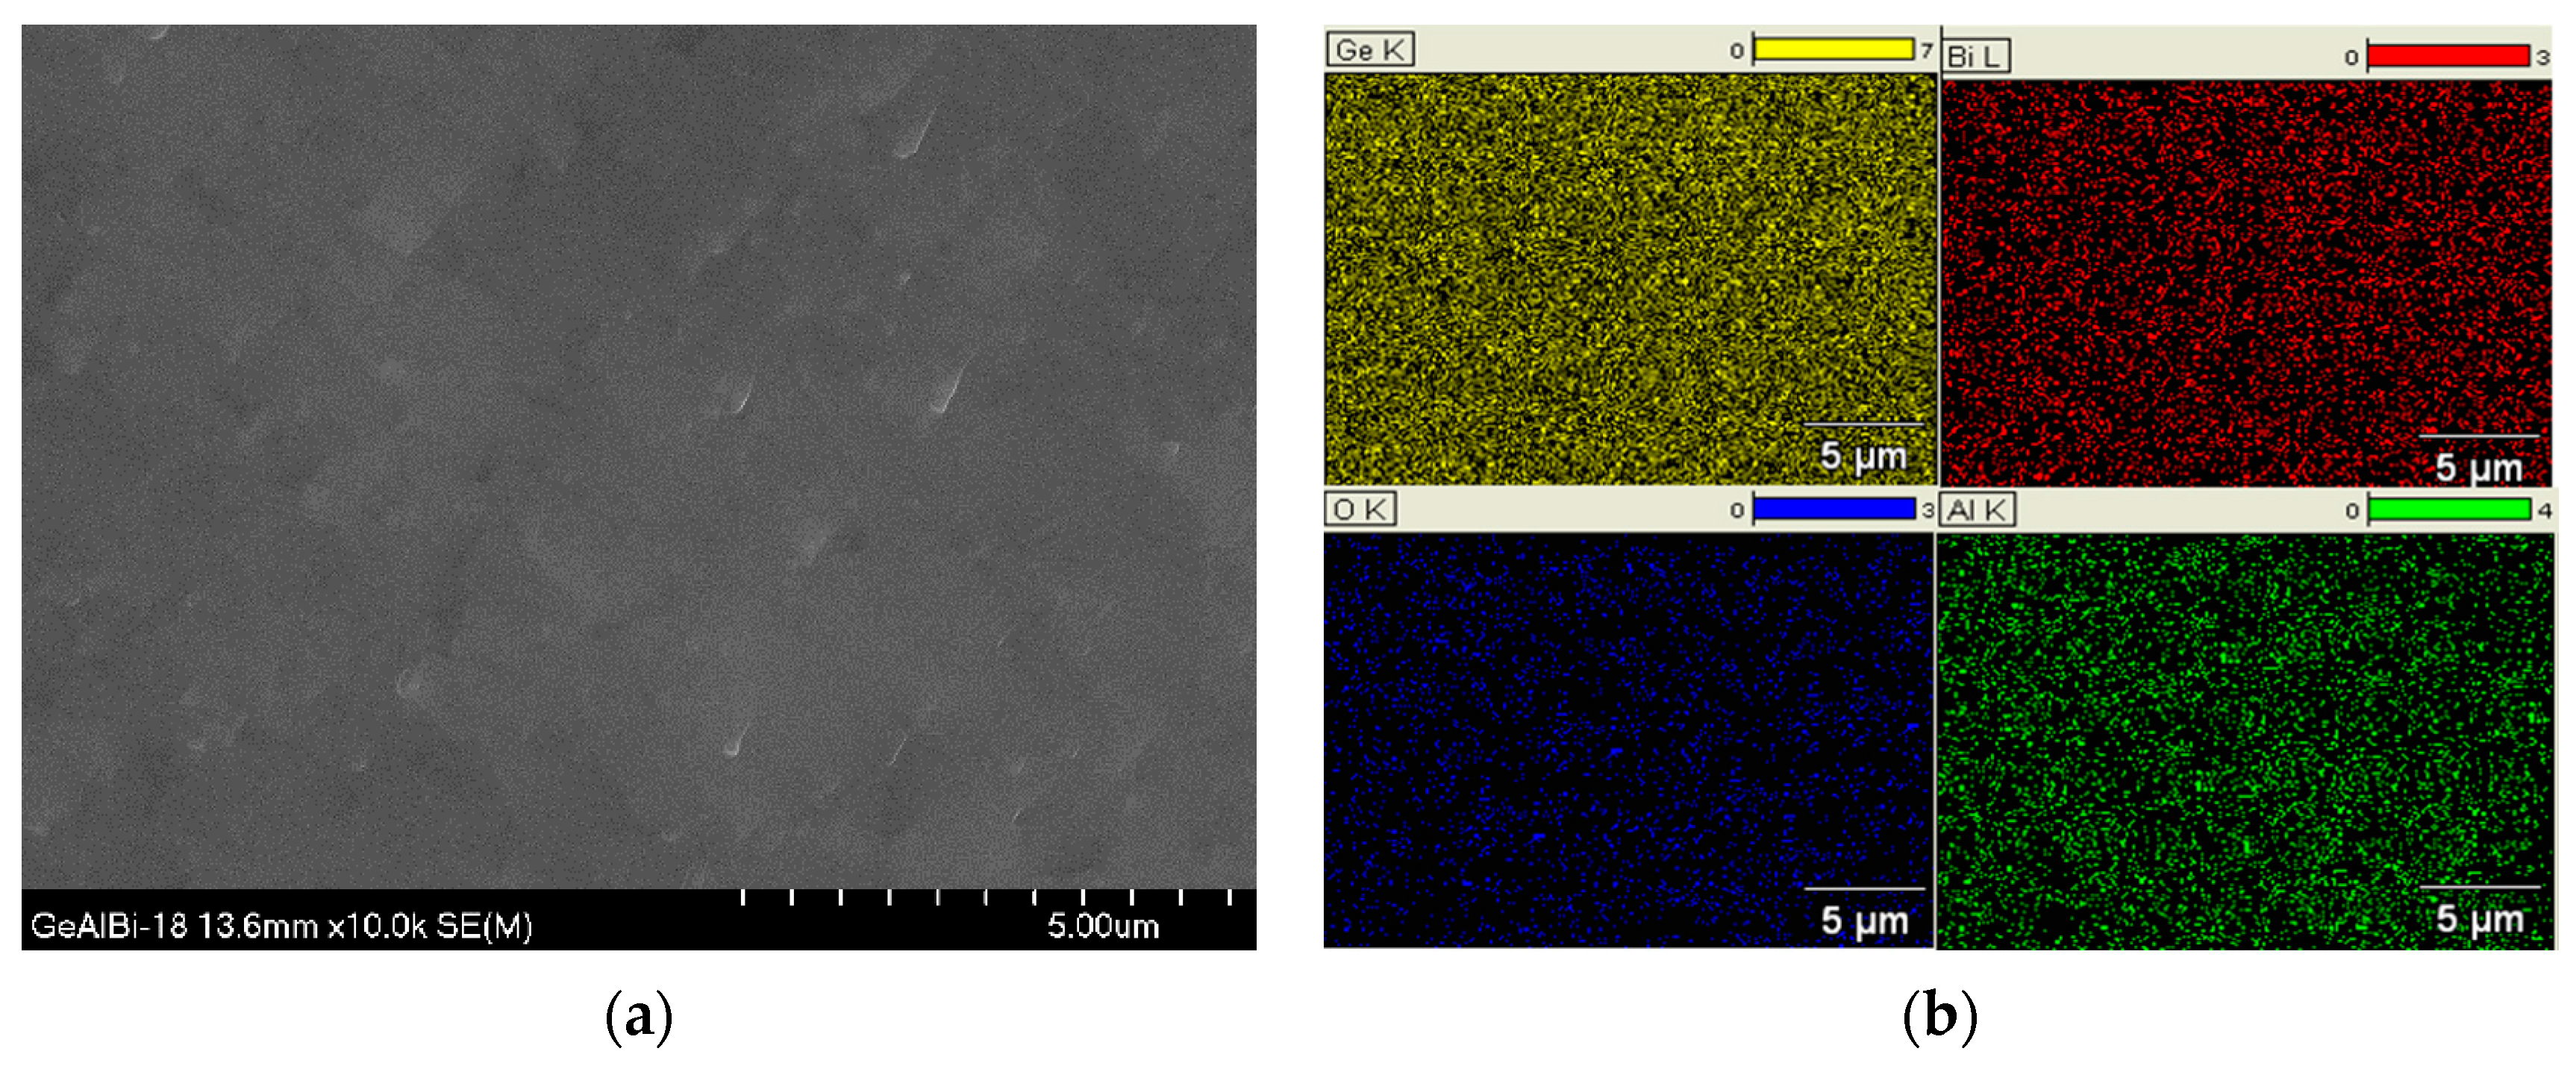
The observation under a scanning electron microscope (SEM) confirmed the amorphous and the homogenous nature of the glass material in the microscale. Figure 3a shows an example of the morphology of the fractured surface of the investigated sample. The EDXS elemental mapping analyses of concentrations of Ge, Al, Bi, and O confirmed they were homogeneously distributed within the whole samples (Figure 3b). The obtained results indicated that all elements, like germanium, aluminum, bismuth, and oxygen, were evenly dispersed in the glass and that germanium was the main element of the specimens investigated.
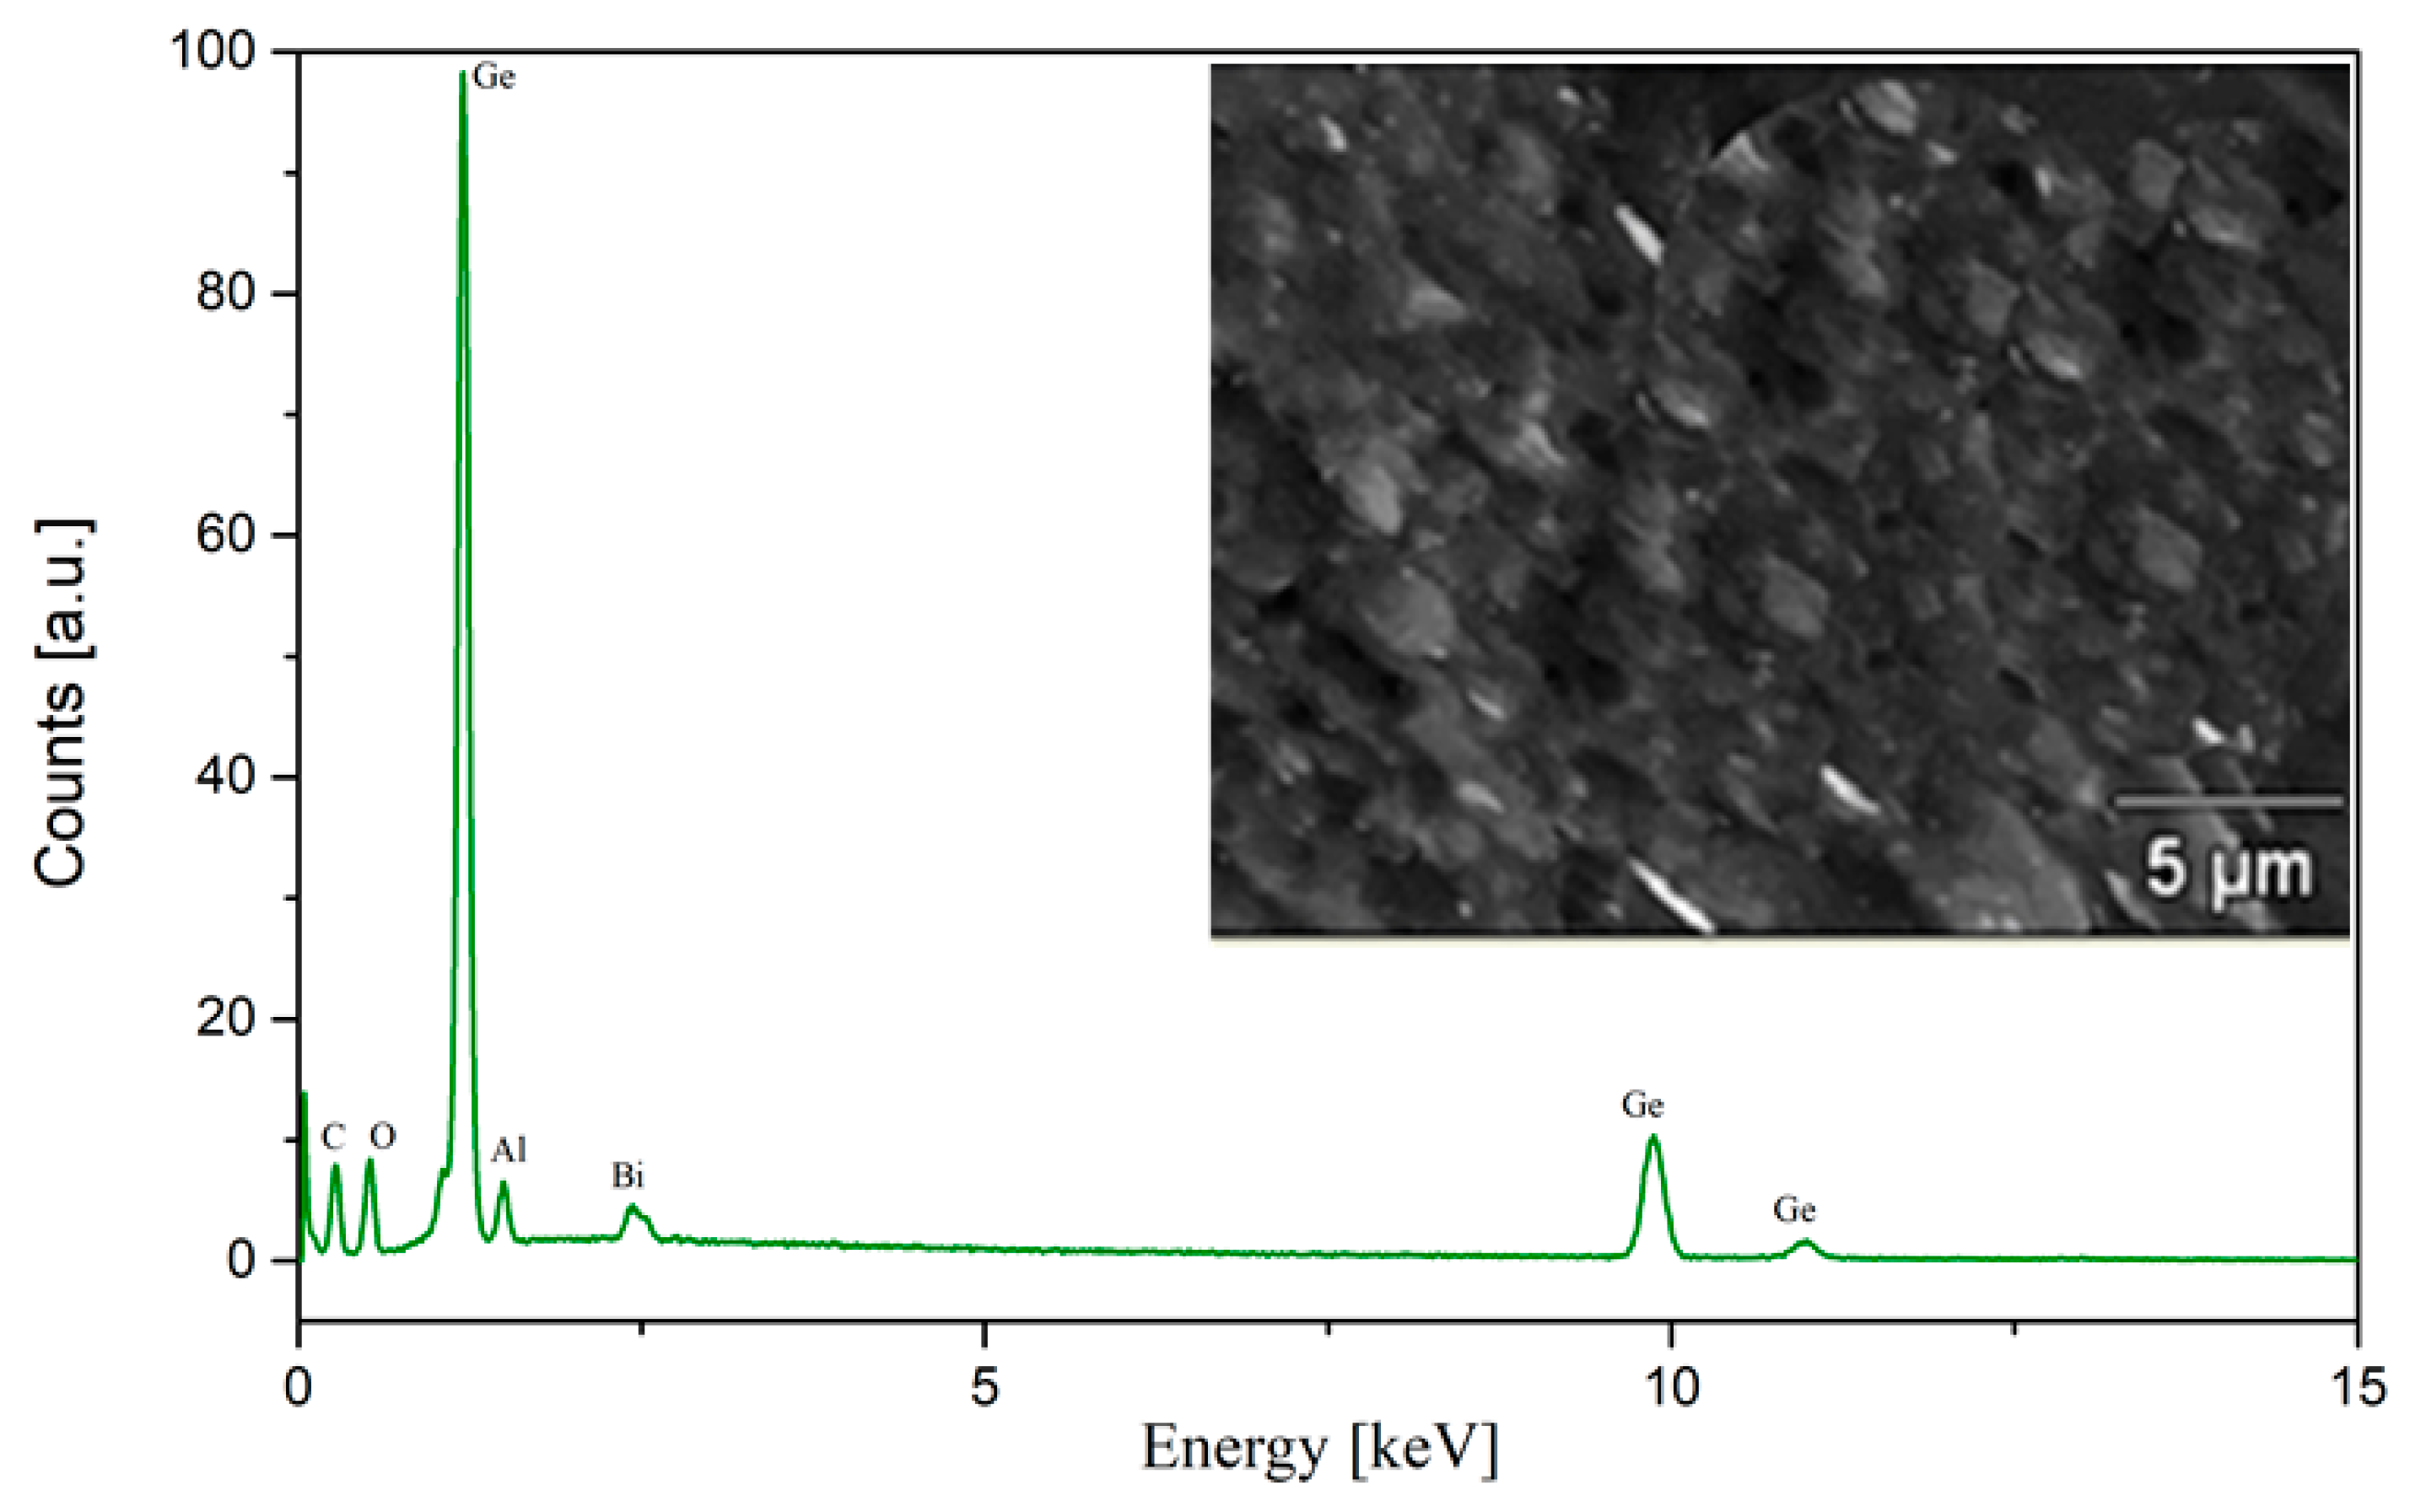
The qualitative and quantitative chemical compositions of 93GeO2–6Al2O3–1Bi2O3 material were confirmed via EDXS measurements. The chemical composition of samples deduced from the EDXS patterns allowed us to determine more precisely the chemical composition of samples, and they were taken from different parts of samples. An example of the EDXS analysis spectrum with the SEM micrograph of the examined glass is presented in Figure 4.
The EDXS measurements showed that the oxide content of the glass was equal, namely 7.279 ± 0.748% mol Al2O3, 91.348 ± 0.745% mol GeO2, and 1.373 ± 0.059% mol Bi2O3, in comparison to the nominal (output) content of the oxides, which was 6% mol Al2O3, 93% mol GeO2, and 1% mol Bi2O3. Such results indicated that changes in the chemical composition of fabricated glass probably resulted in the melting process in a corundum crucible at T = 1500 °C. As a consequence, glass composition enrichment with the aluminum oxide and bismuth oxide was obtained, although observation of the crucible after the melting process showed that it was not corroded but only coated with the glass. Considering the other possibilities of changing the composition, the evaporation of crucible components could be assumed. Generally, at the temperature of 1500 °C in the investigated glass system, germanium oxide had the highest vapor pressure, which was 10–5 bar [28].
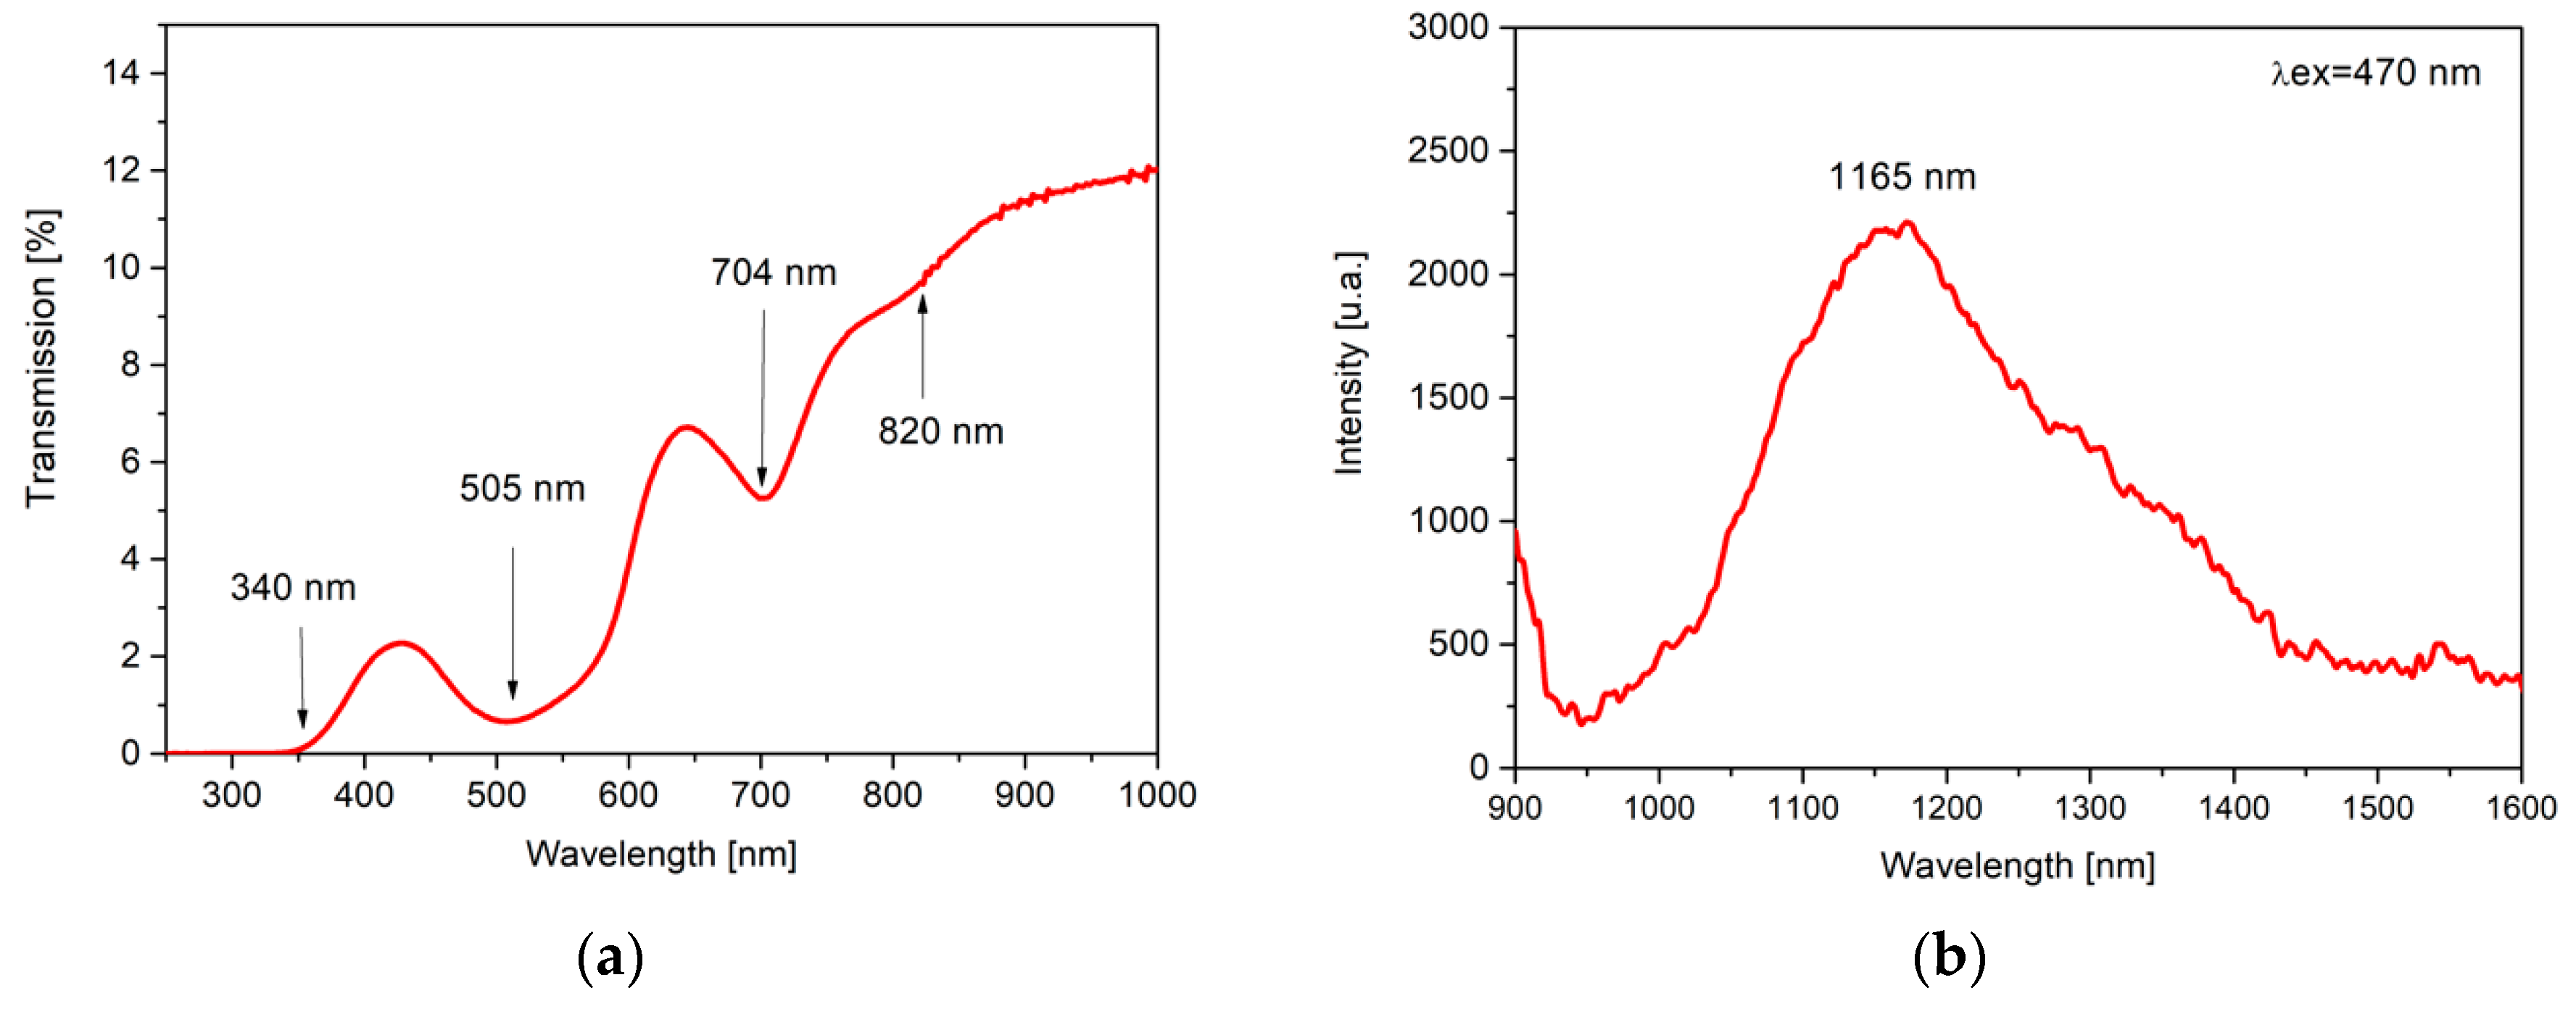
Subsequently, the optical transmission and the optical emission of the same glass were measured (Figure 5). The transmission spectra (Figure 5a) of the complex glass sample (thickness approx. 3 mm) showed a strong absorption in the UV range and the VIS range at approx. 505 nm and 704 nm. By excitation with blue light (470 nm), the glass emitted broadband with an emission maximum at 1165 nm (Figure 5b).
3.2. Analysis of the Glass Crystallization Kinetics
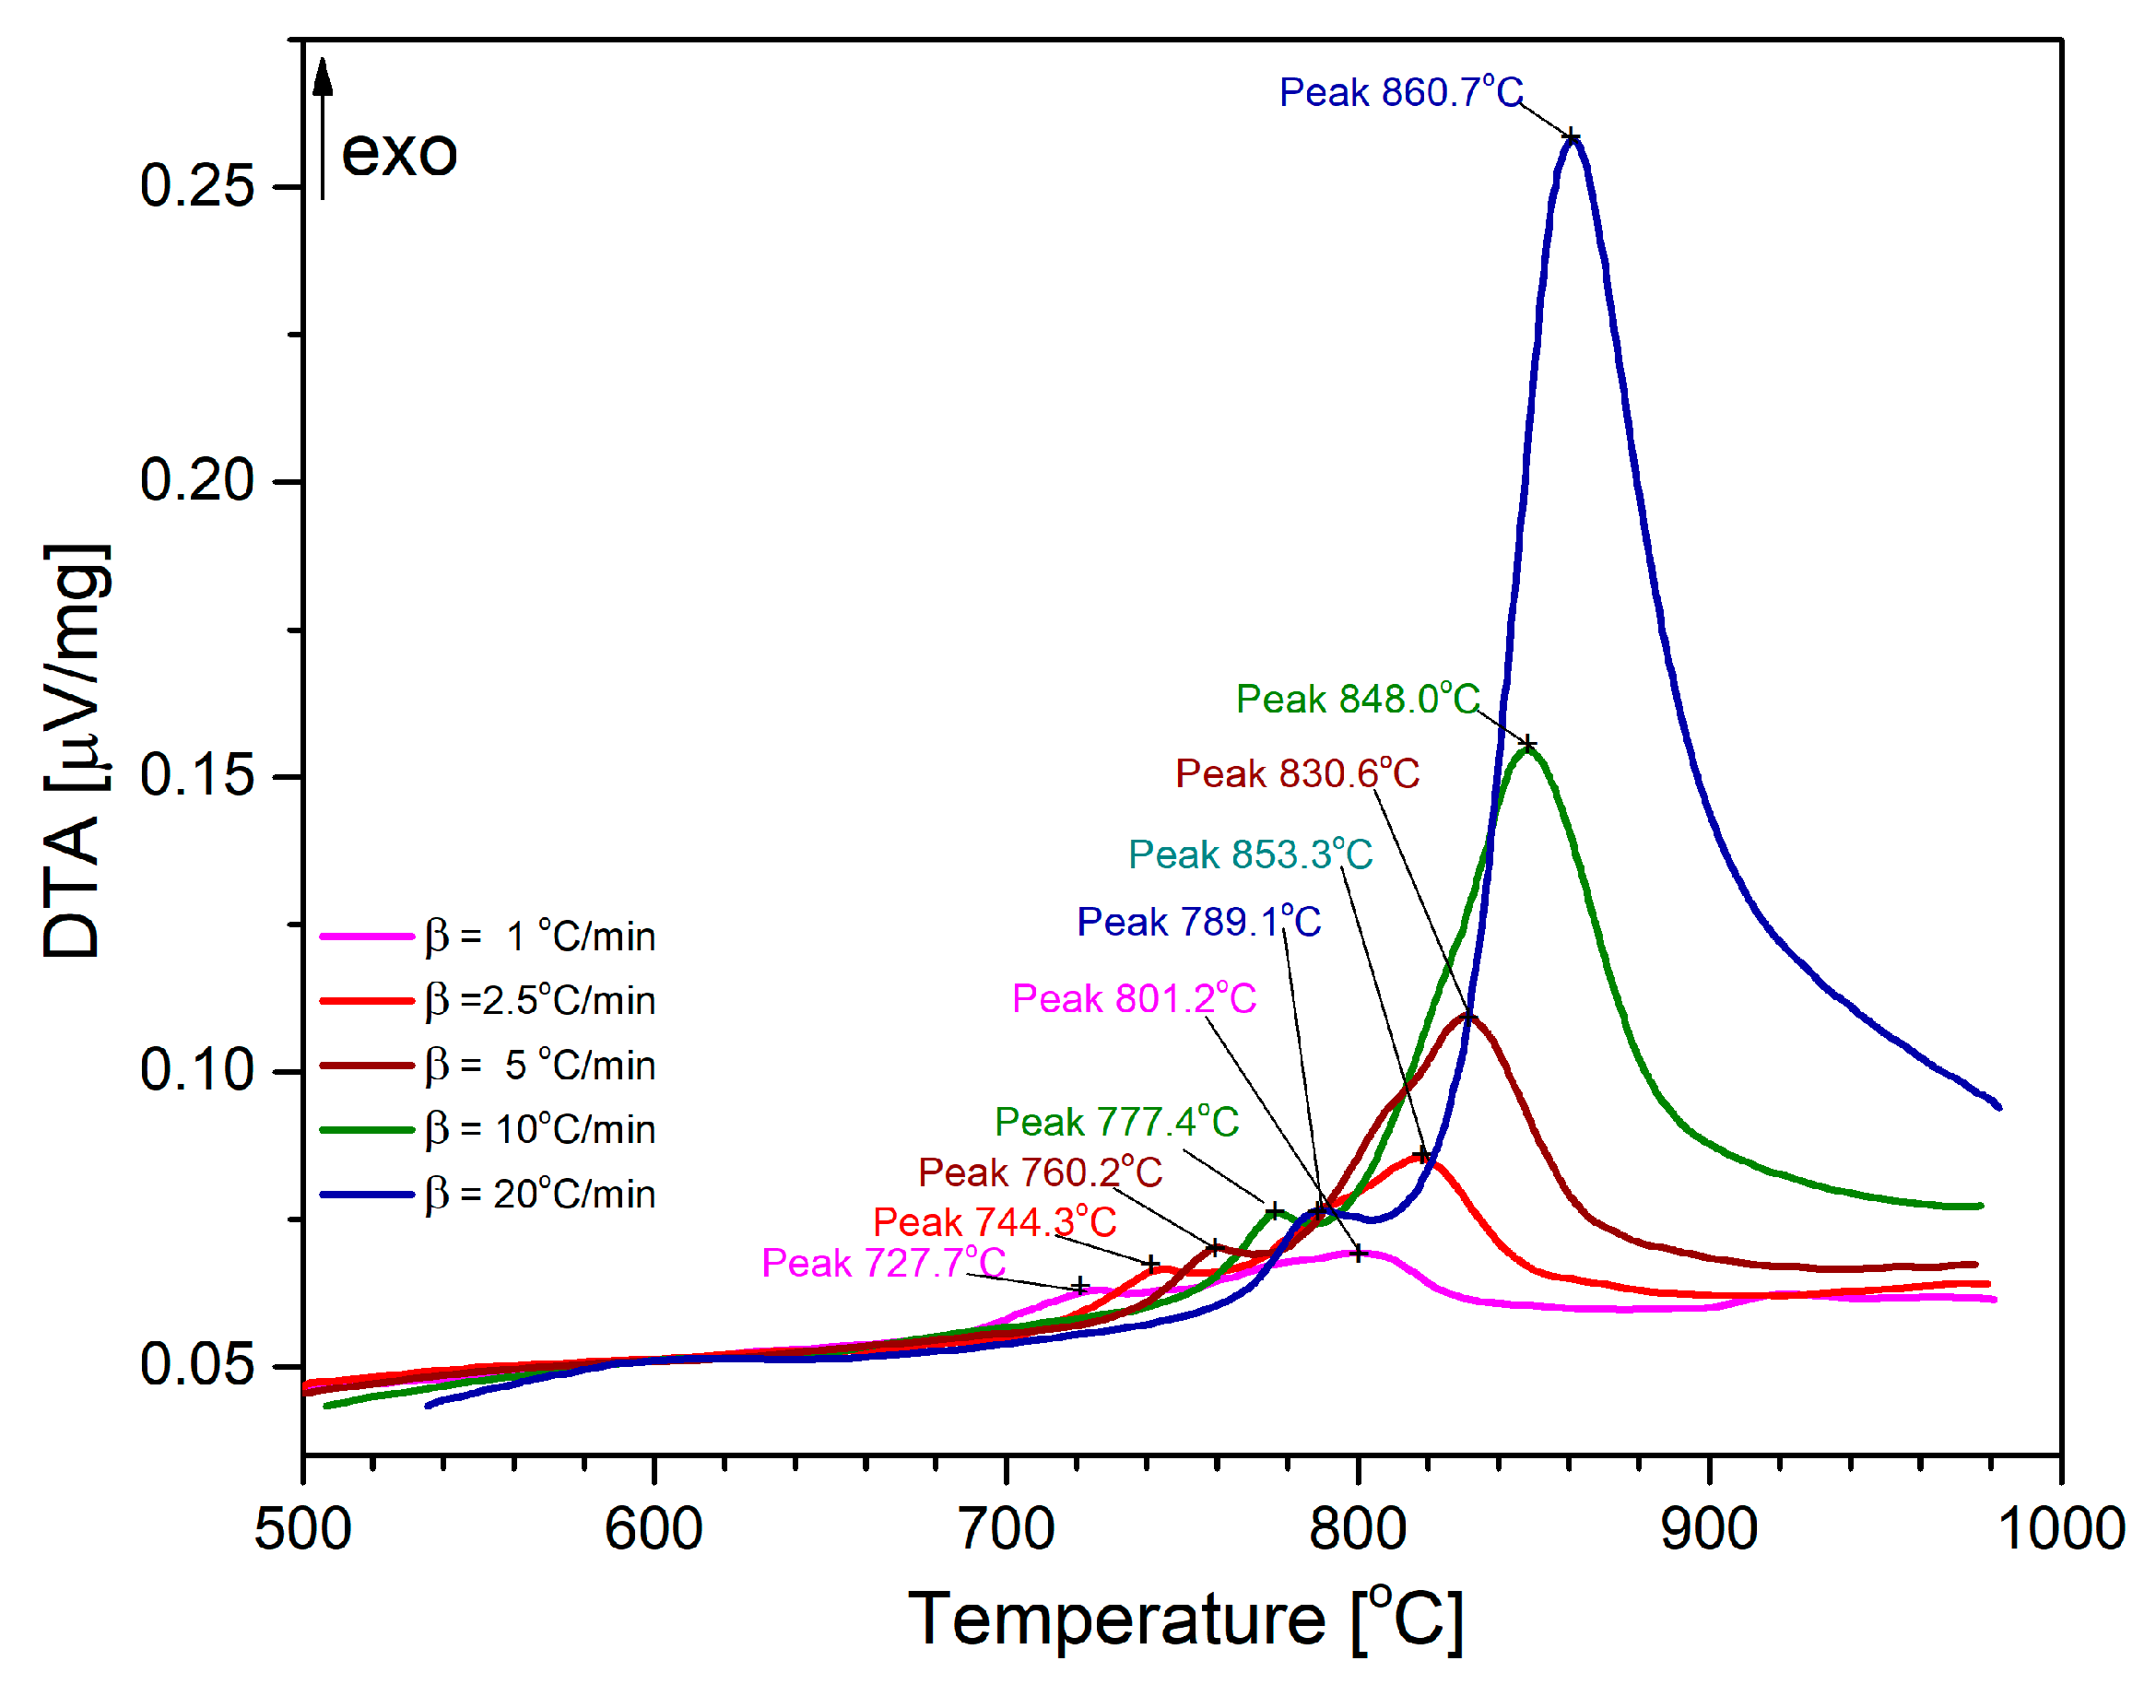
To the study of the kinetics aspect of the glass crystallization, thermal analysis was used. The glass making process was examined by the DTA measurements at the heating rate of β = 1, 2.5, 5, 10, and steps of 20 °C/min. Results are illustrated in Figure 6.
The DTA results obtained were illustrated by curves, which contained all three typical values of the characteristic temperatures: Tg, Tx1, and Tx2, even though in this comparison, the Tg values were deflection points that had weak values. The characteristic temperatures of recorded measurements are summarized in Table 1.
Due to the strength of the standard kinetics, based on the crystallization temperature Tx, it is possible to analyze a system where more than one phase crystallizes. In this case, the two Tx values were found in the DTA curves and related to the analysis. As was observed, the characteristic temperatures strongly depend on the heating rate.
Changes in the Tg value, with the heat rate β, can be described with Equation (1).
where β is the heat rate.
Based on this relationship, it was assumed that a temperature of 533.6 °C was a real Tg value.
In turn, Tx values were used for the kinetic evaluation of the crystallization process, by the Kissinger method (Equation (2)) [29].
where Ea is the apparent activation energy, R = 8.314 J/molK—the gas constant.
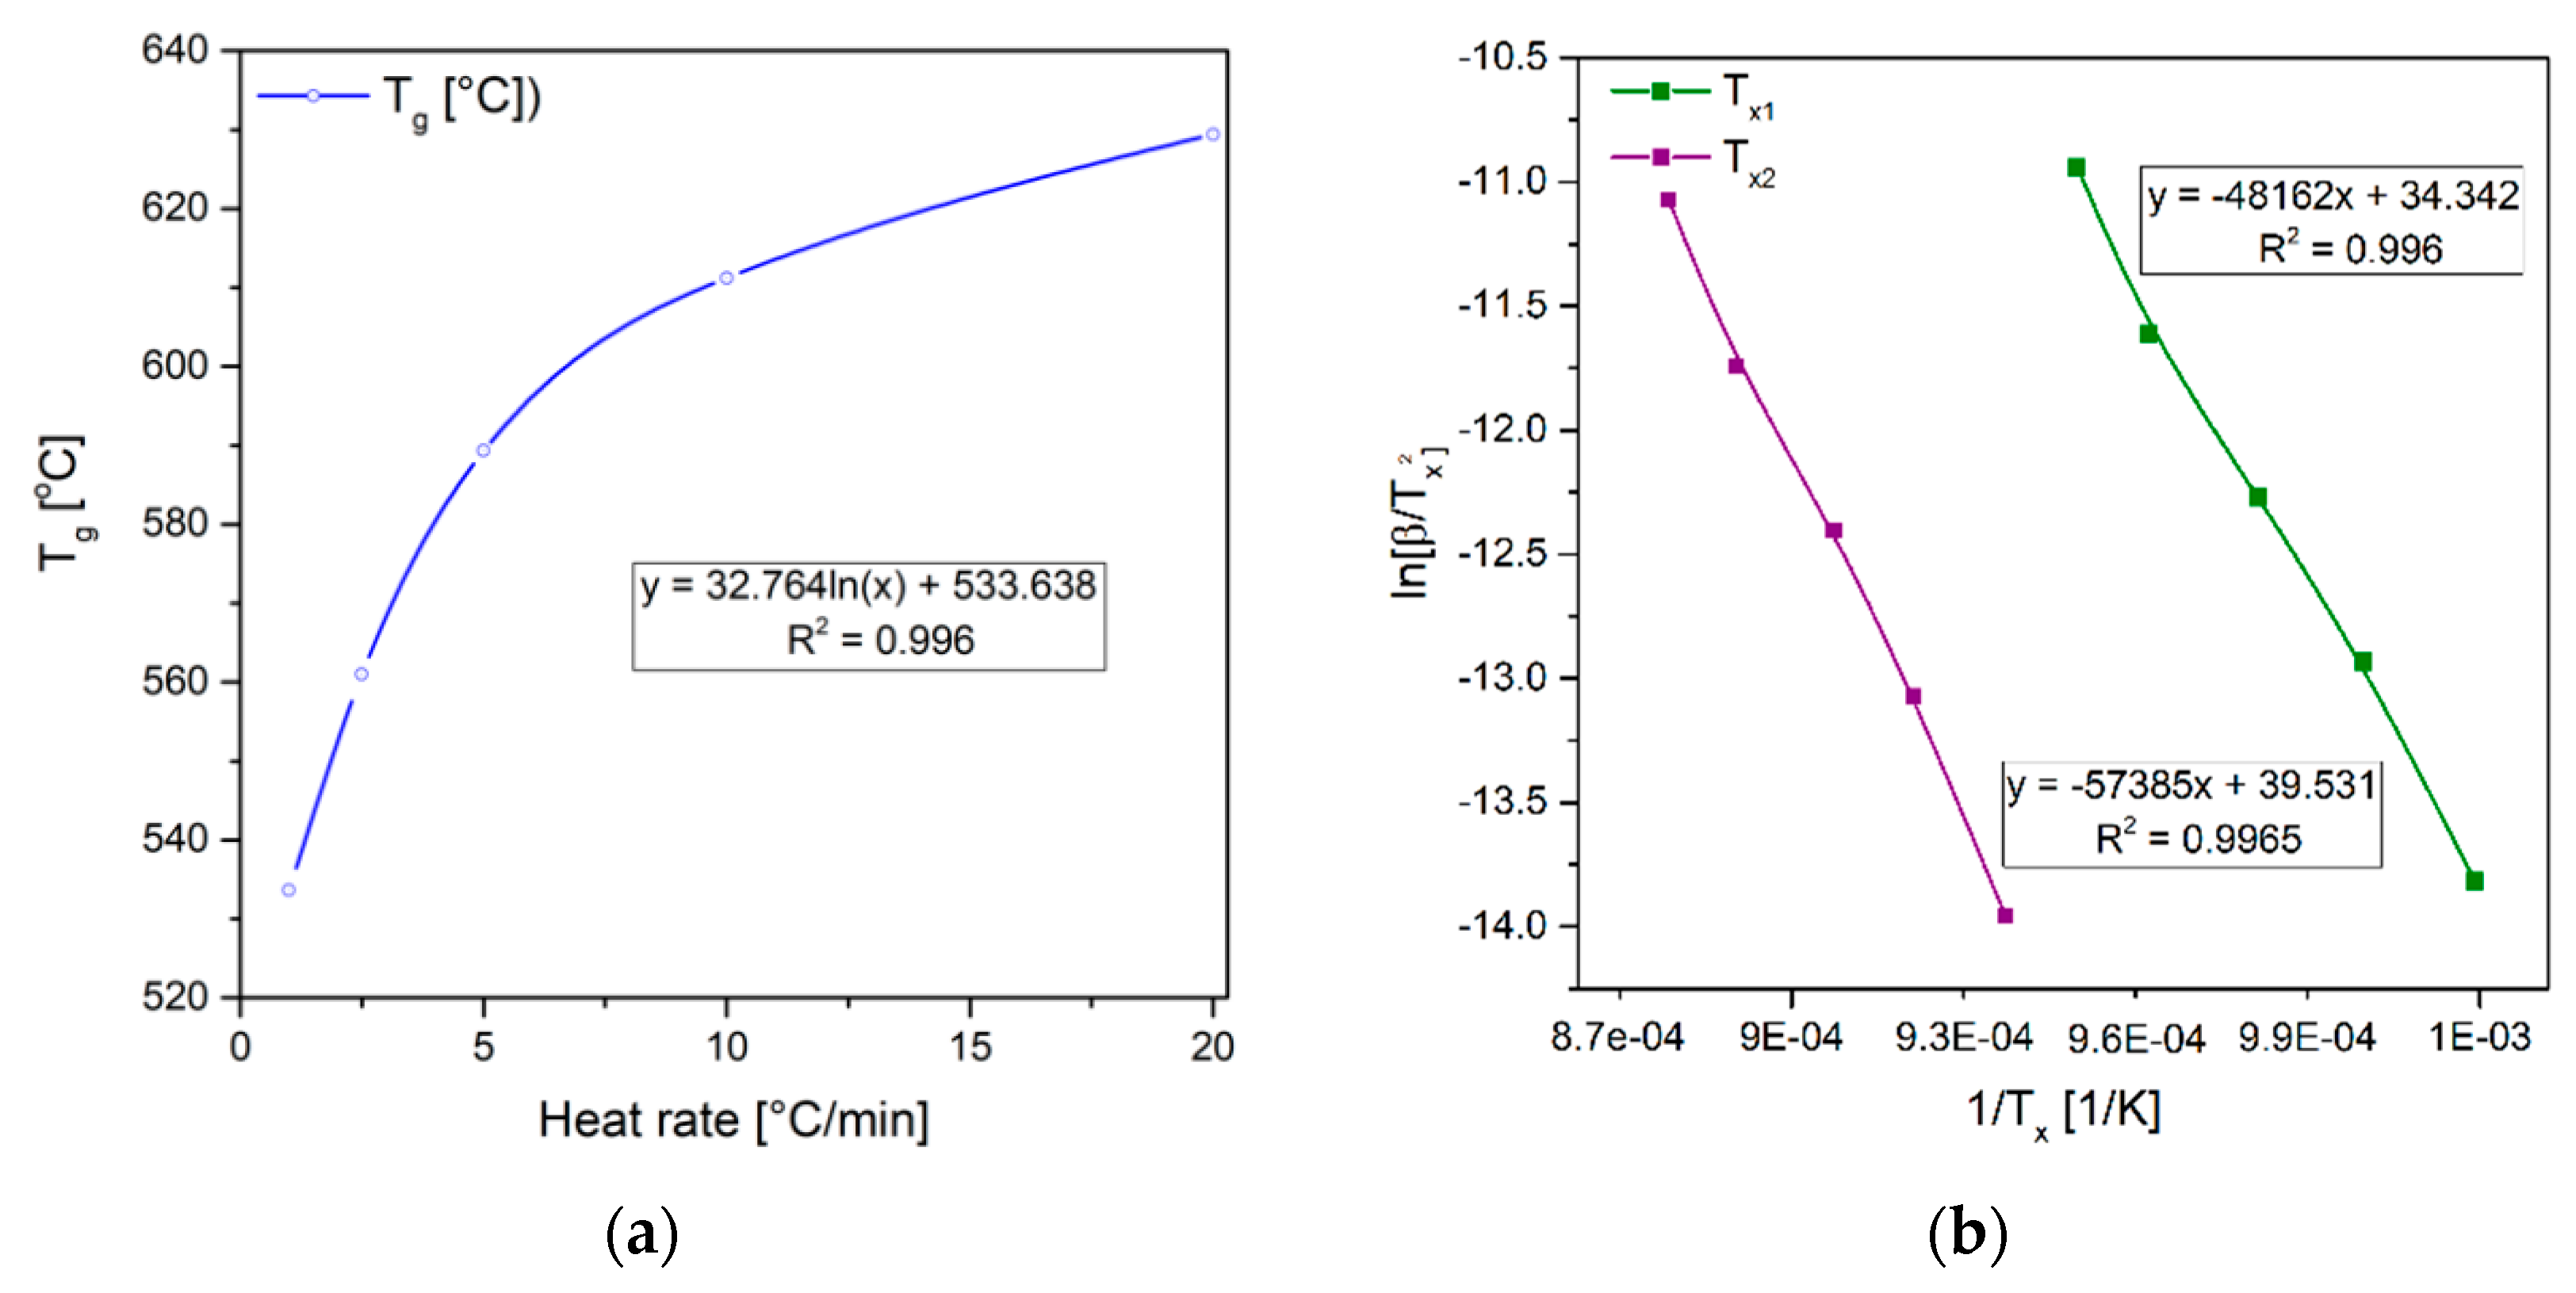
Figure 7 shows the glass transition temperature (Tg) as a function of the heating rate (β), and also the Kissinger function at temperatures Tx1 and Tx2 illustrating the mechanism of the crystallization of 93GeO2–6Al2O3–1Bi2O3 glass.
The obtained results showed that Ea values were determined to be about 400.4 kJ/mol for the first crystallization step (Tx1) and 477.1 kJ/mol for the second step (Tx2).
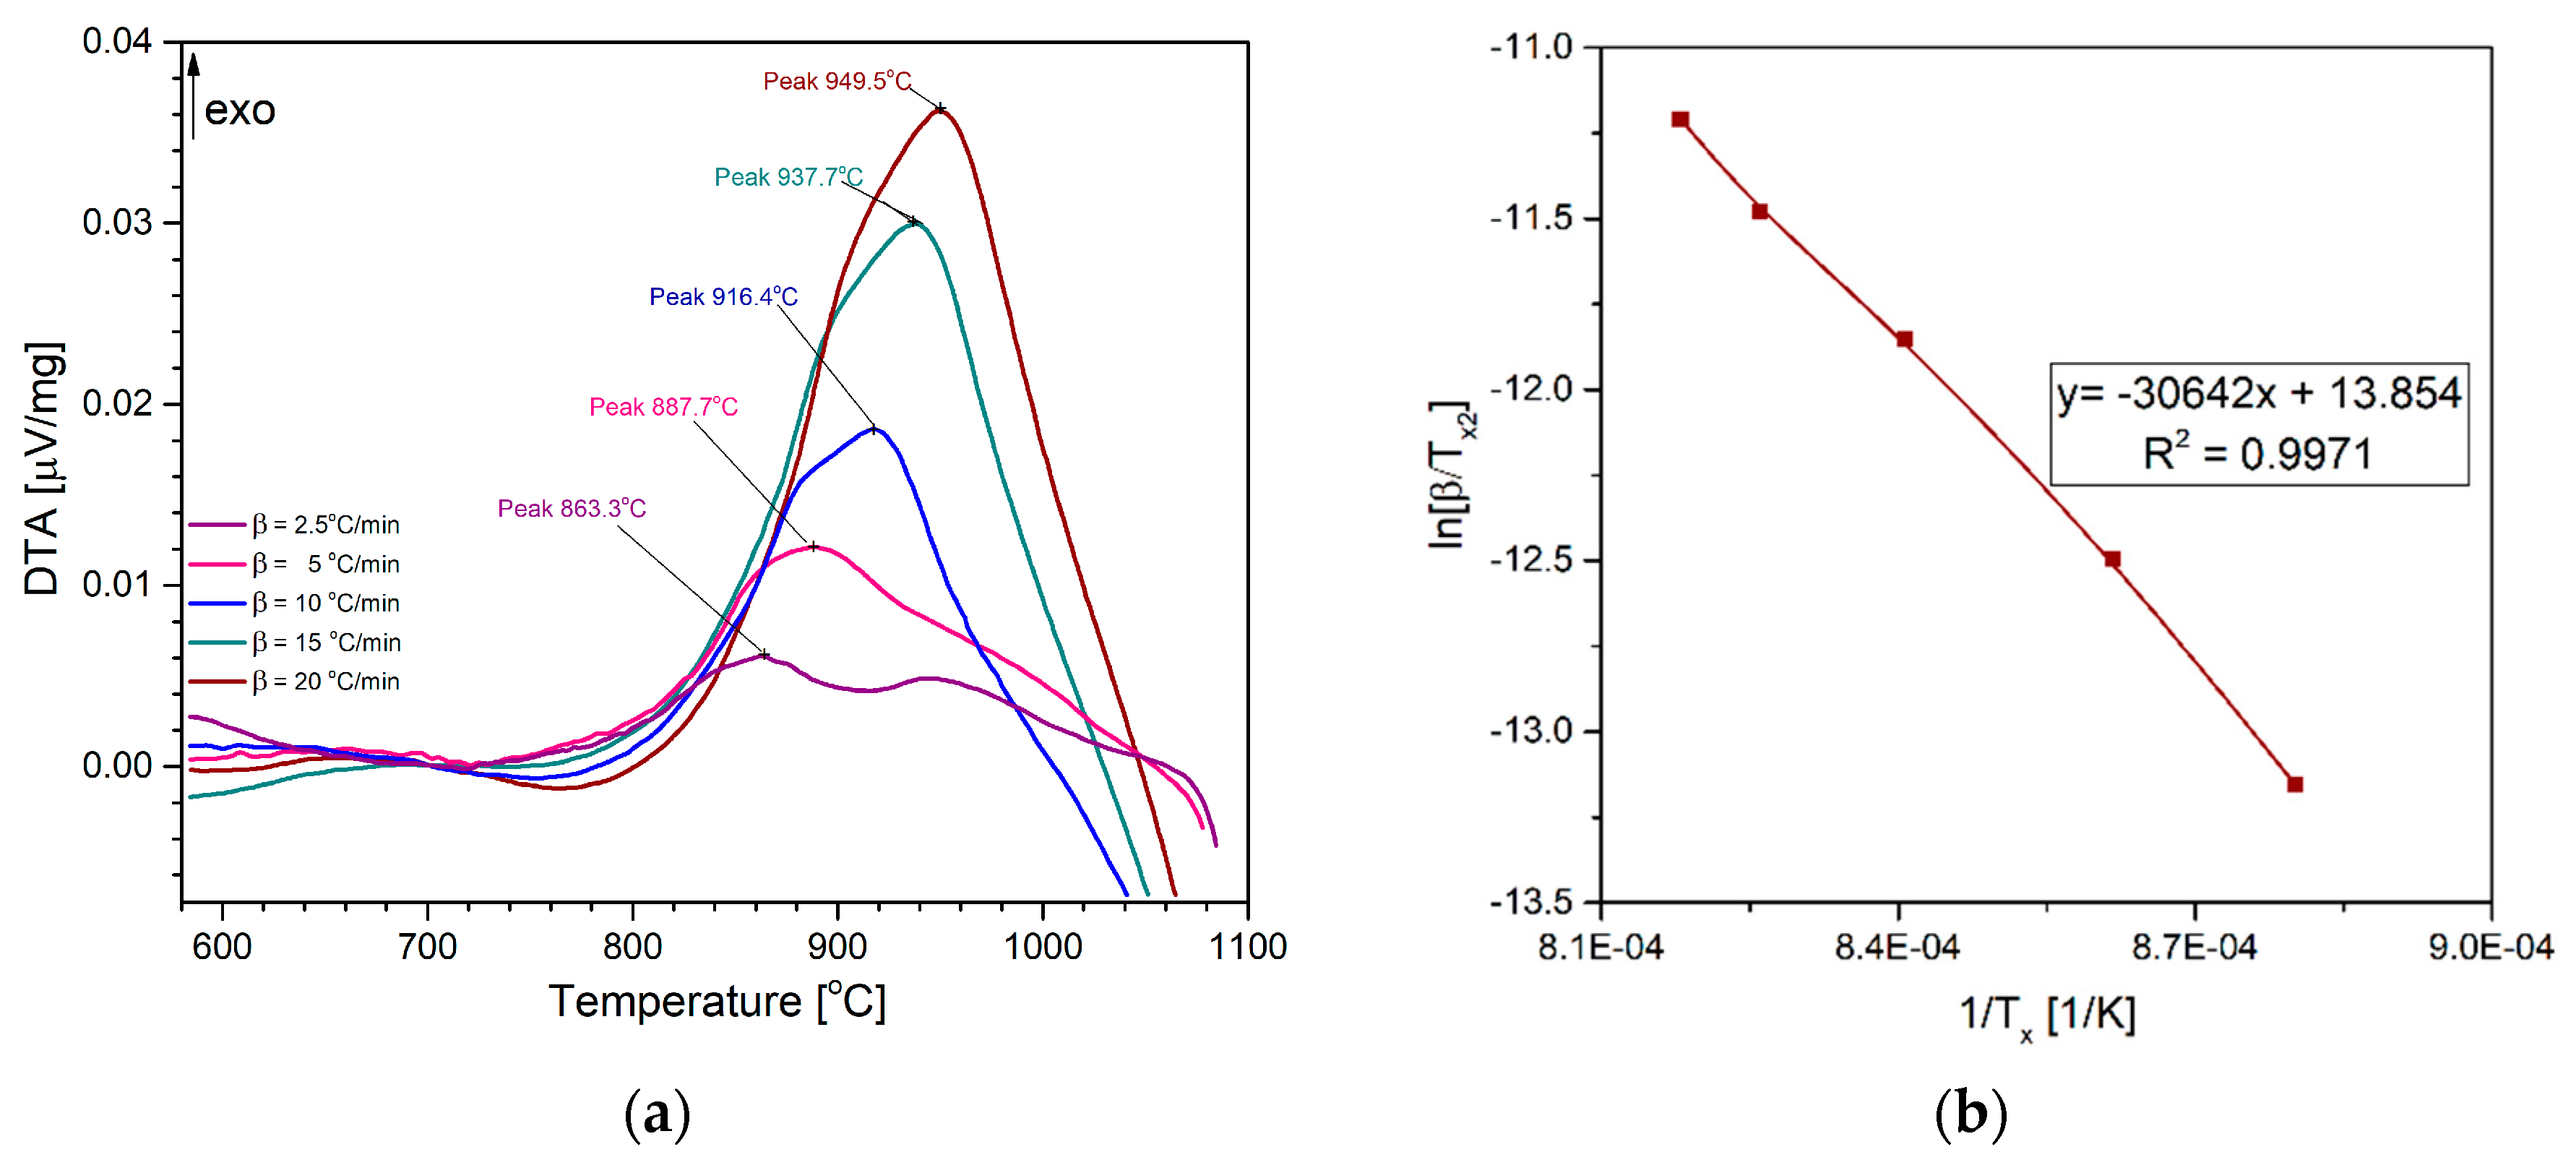
For comparison, similar investigations were made to define the kinetics mechanism of crystallization of pure GeO2 glass. Figure 8a shows that the crystallization peaks of this material were lower in comparison to the DTA peaks obtained for the 93GeO2–6Al2O3–1Bi2O3 glass (Figure 6). In this case, the apparent activation energy was also lower, and the value was 254.75 kJ/mol (Figure 8b).
3.3. Theoretical Interpretation of the Glass Crystallization Processes
It is known that the glass crystallization processes are described using the Johnson–Mehl–Avrami–Kolmogorov (JMAK) equation [30], which determines nucleation and crystal growth. In addition to the apparent activation energy, Ea, the other kinetic parameter, the so-called Avrami coefficient (n)—as a power in the equation JMAK—was founded. The Avrami coefficient is assumed to be the values 2 or 3 for two- or three-dimensional seeds [30,31]. The Avrami coefficient can be estimated using an equation from Augis–Bennett [32]:
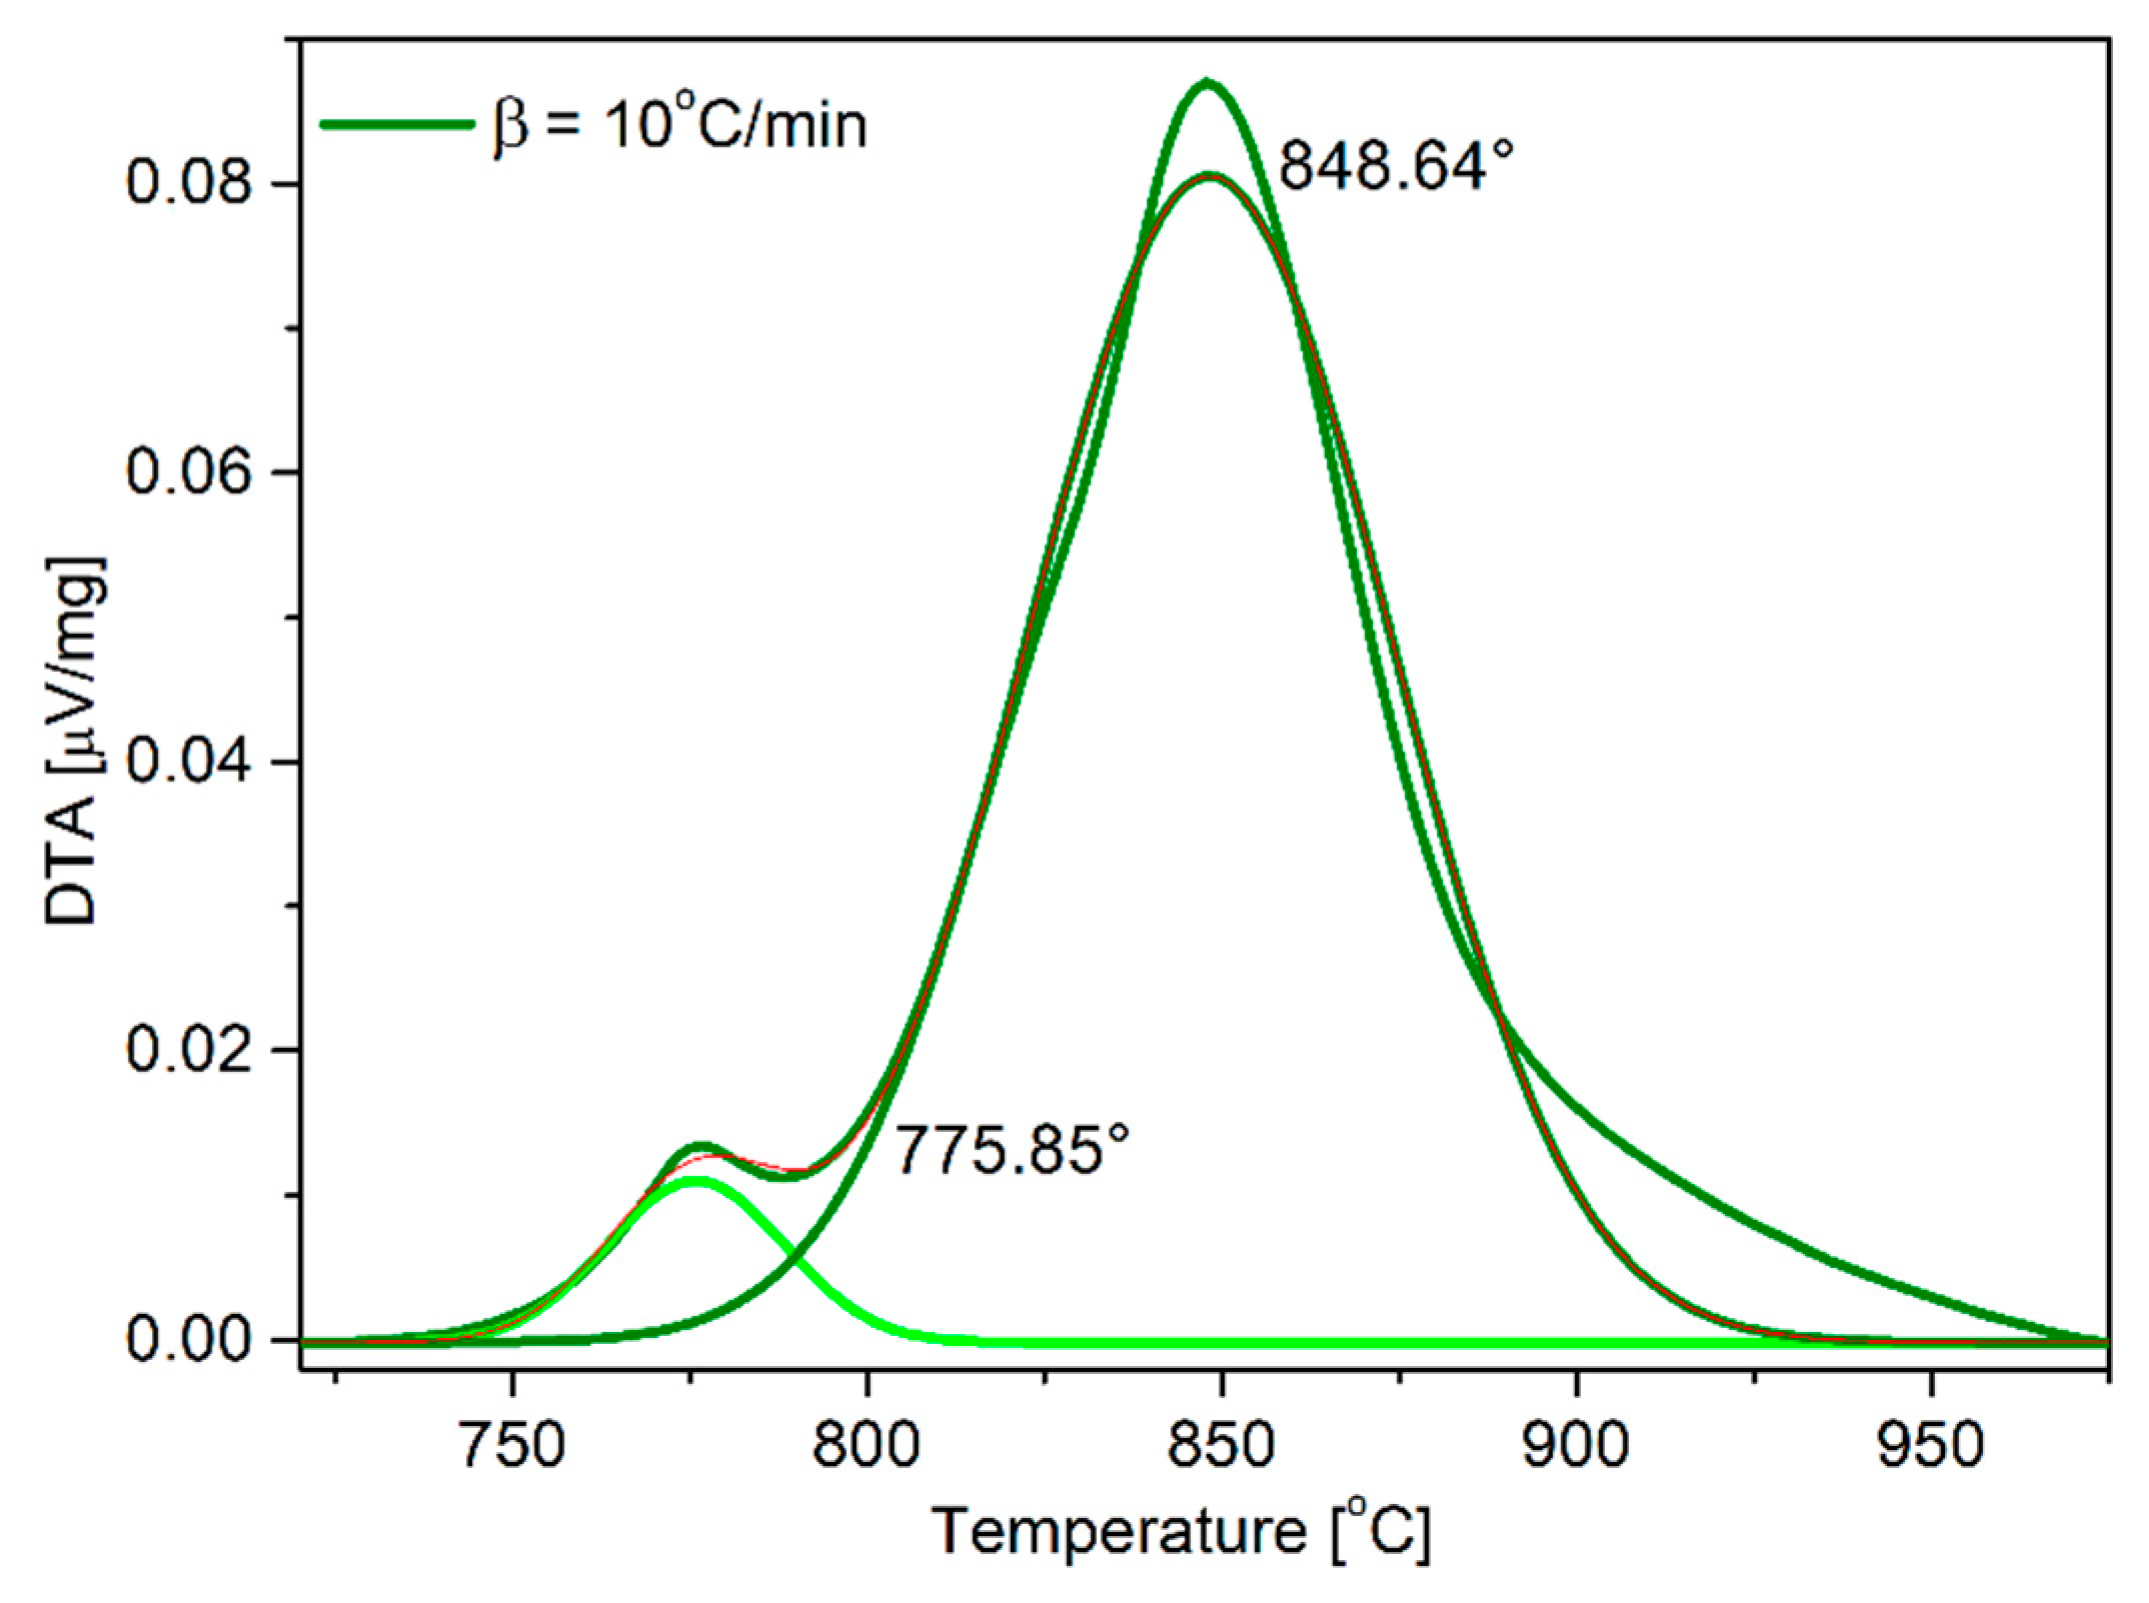
In this case, it is necessary to calculate some specific geometric sizes from the crystallization peak, or the peak width in a half-height (Δ∗T).
An example of the peak separation and the determined (Δ∗T) values and the Avrami coefficient (n) is shown in Figure 9. The characteristic temperatures of recorded measurements are summarized in Table 2. Since the two crystallization peaks overlap, a peak separation was carried out, and the required peak width was determined. For the two crystallization peaks, similar values of the Avrami coefficient n were calculated, which were in the range 1 < n < 2.
4. Discussion
As mentioned above, the prepared glass with the composition 93GeO2–6Al2O3–1Bi2O3 was transparent and had an intense dark red color. The obtained XRD pattern of this glass indicated no crystalline components, and in the transmission spectrum, four characteristic absorption bands were observed (at 340, 505, 704, and 820 nm). The band at 340 nm corresponds to the glass matrix [33], where the other areas are responsible for the excitation of the bismuth activators to the emission [19]. The NIR emission from bismuth has been known for a long time [33,34,35,36,37,38]. For this reason, the emission spectrum shows a burnable emission between 950 and 1450 nm with a maximum at 1165 nm.
Our investigations show that glass with a composition of 93GeO2–6Al2O3–1Bi2O3 has a relatively high glass transition temperature Tg of 533.6 °C. The Tg values for similar glass lie in the range from 469 °C [39] to 635 °C [40] and 651 °C [41]. A Tg value of 519 °C (Figure 1) was measured for the pure GeO2 glass, with the value of 513 °C being given in [41].
Another glass parameter, its stability, is defined as
where Tx0 is the onset temperature of the crystallization peak.
ΔT = Tx0 – Tg
ΔT is approx. 130 °C, when ΔT values greater than 100 °C are reached as favorable for such glass [39,40]. This means that the glass has little tendency to crystallize. For the transparent glass ceramics, the temperature range was used for partial crystallization. This is utilized to form a nanocrystalline species with activators in the host lattice [1,2].
The kinetic crystallization parameters obtained show activation energy values of approx. 400 kJ/mol and approx. 477 kJ/mol, as well as an Avrami coefficient n ≈ 1 and can be interpreted as follows: the higher values of the Ea can indicate a relatively strong barrier for the nucleation of the indicated crystallization process of 93GeO2–6Al2O3–1Bi2O3 glass. The n values of the Avrami parameter are closer to one, and n > 1 can serve as an indication of the formation of acicular nanocrystals for this glass.
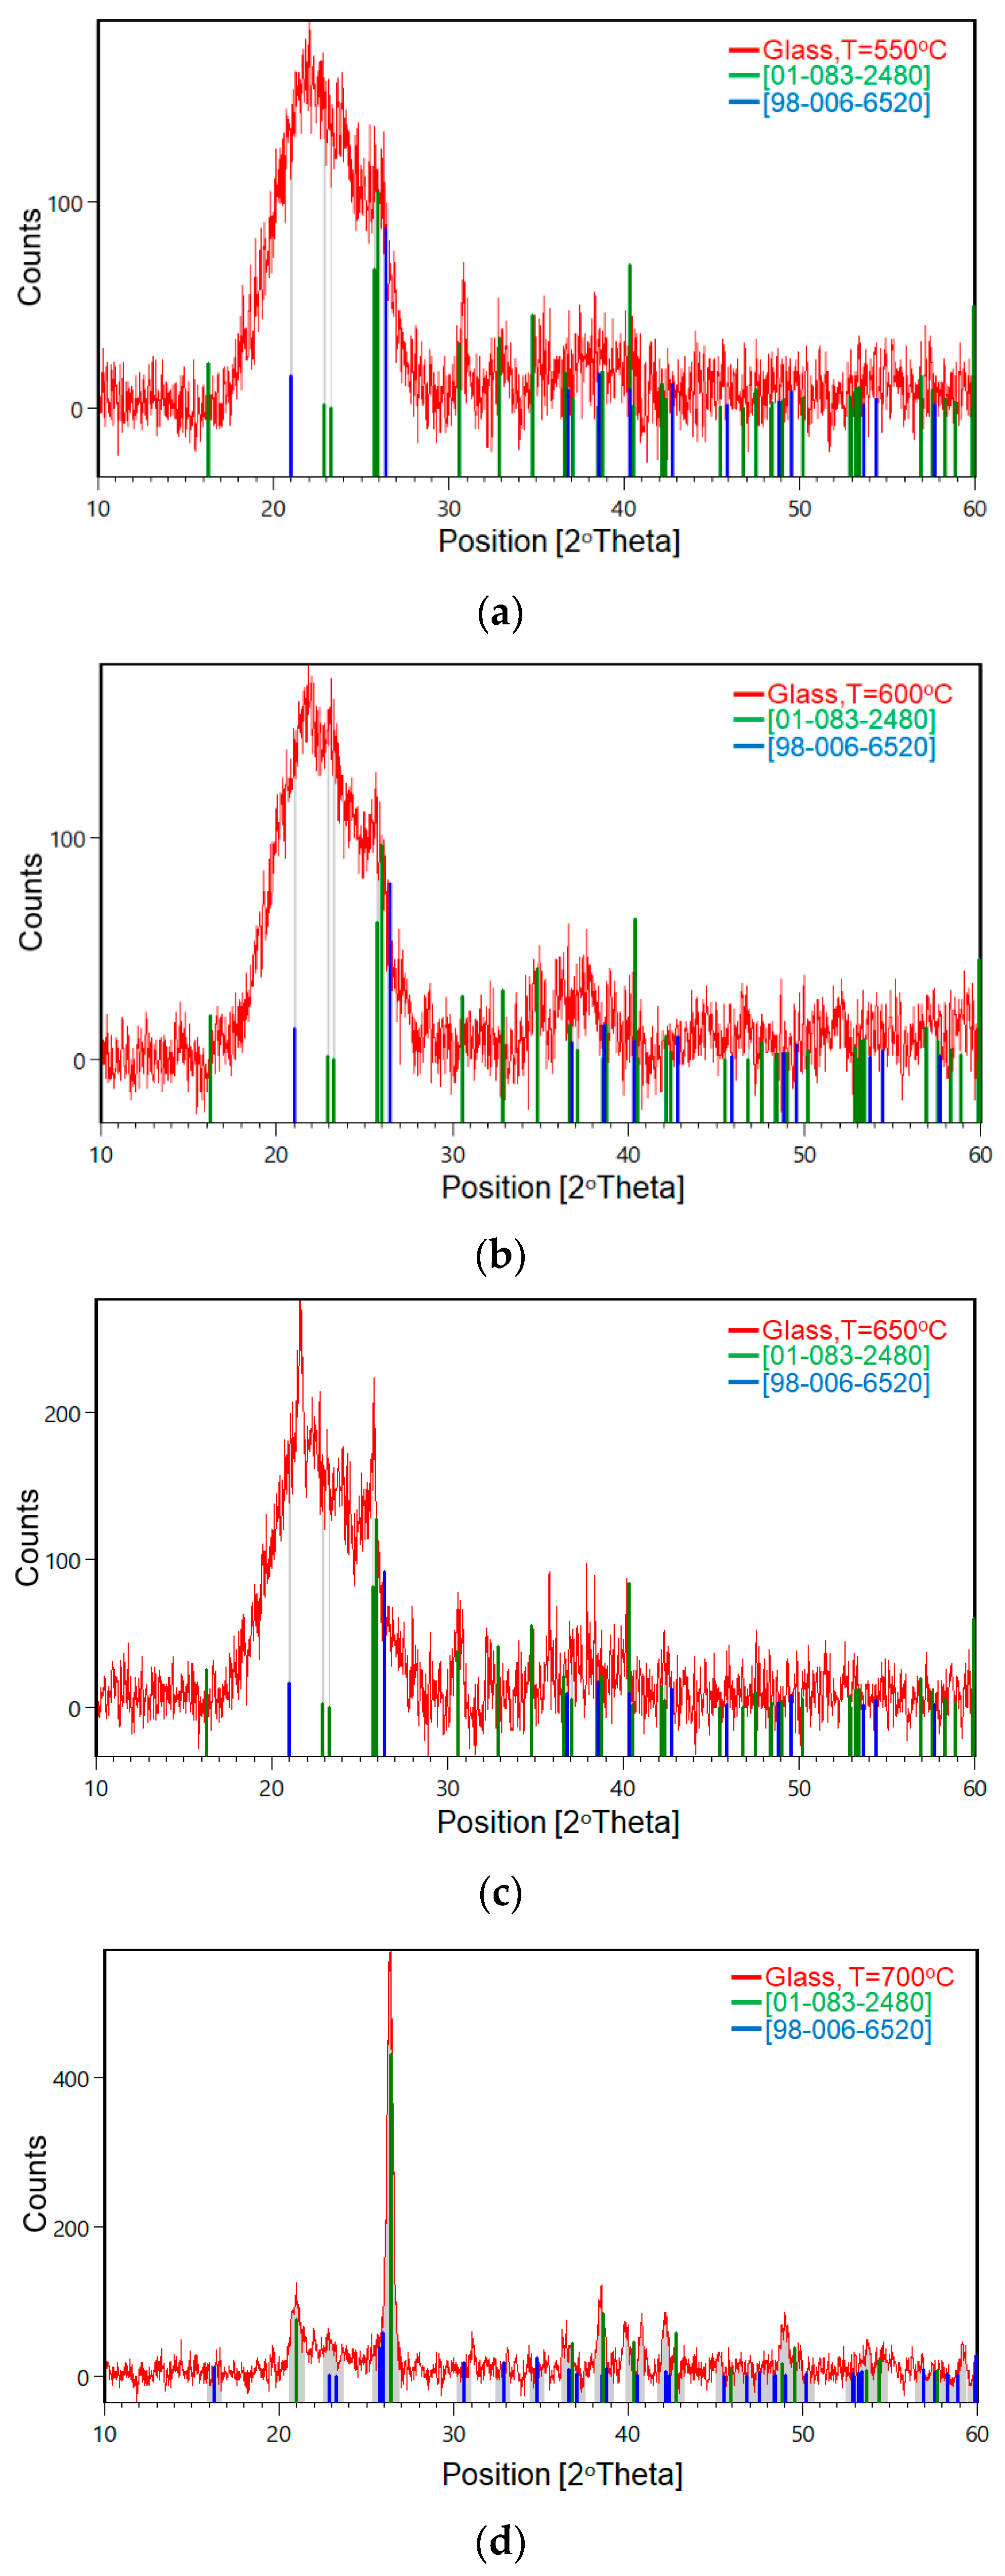
In order to determine the possibility of the partial phase crystallization in the glass matrix, some series of the XRD tests were performed. Measurements were recorded for selected temperatures used in the heat-treatment of the glass (at T = 550 °C, 600 °C, 650 °C, 700 °C/6h) (Figure 10a–d).
All results of the X-ray phase analysis, which were determined in different temperatures of the heat-treatment, were developed using X’Pert High Score Plus software. An evolution of sharp peaks was observed with an increase of heating temperature. It was found with a high probability that in the glass network, germanium oxide was crystallized into two species: GeO2 (ICDD®, reference code: 01-083-2480) and Al2,38Ge0.62O4.81 (ICDD® reference code: 98-006-6520). The second mullite-like phase, Al2,38Ge0.62O4.81, was observed in all investigated cases from the treatment temperatures above 600 °C.
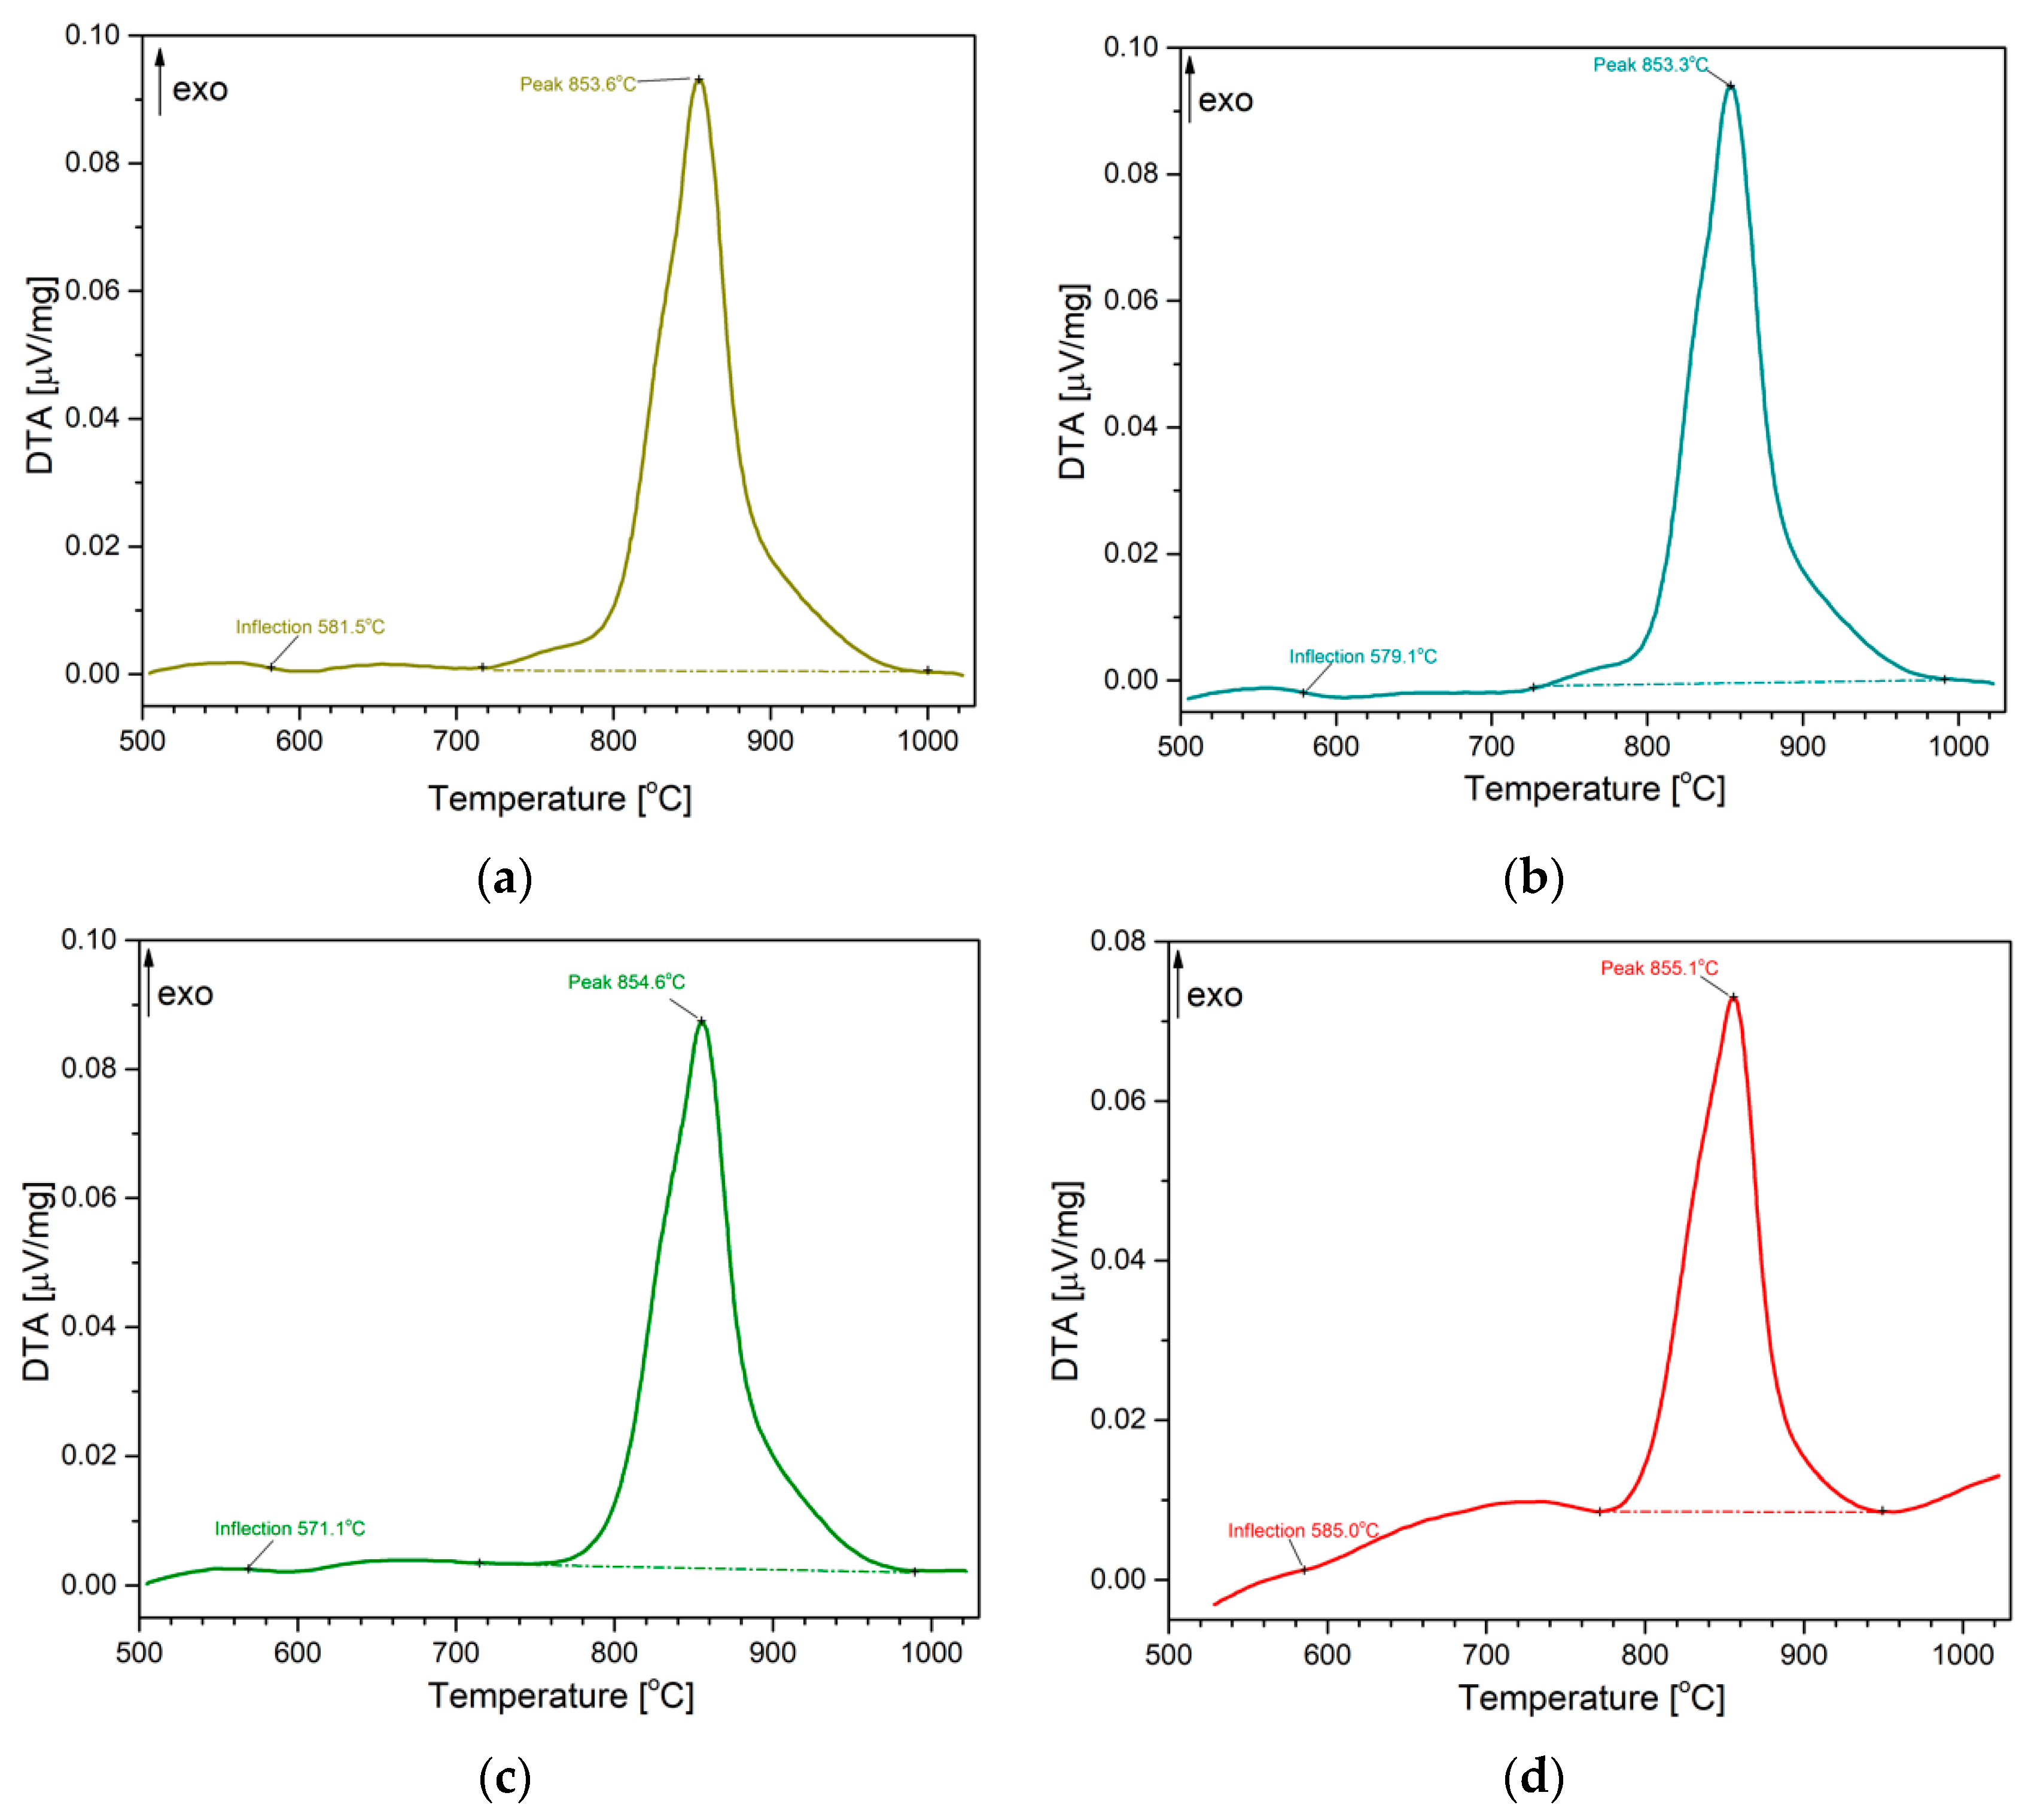
As was reported in [42] the mullite-like phases, such as the germanium-mullite types Al2GeO5, Al2,26Ge0,74O4,87, Al2,38Ge0,62O4,81, and Al2,4Ge0,6O4,8, tended to crystallize rapidly. These crystalline phases were dispersed in the amorphous phases of glass. Although the glass was heat-treated at 500–700 °C, it remained largely amorphous, as demonstrated by DTA analysis (Figure 11a–d).
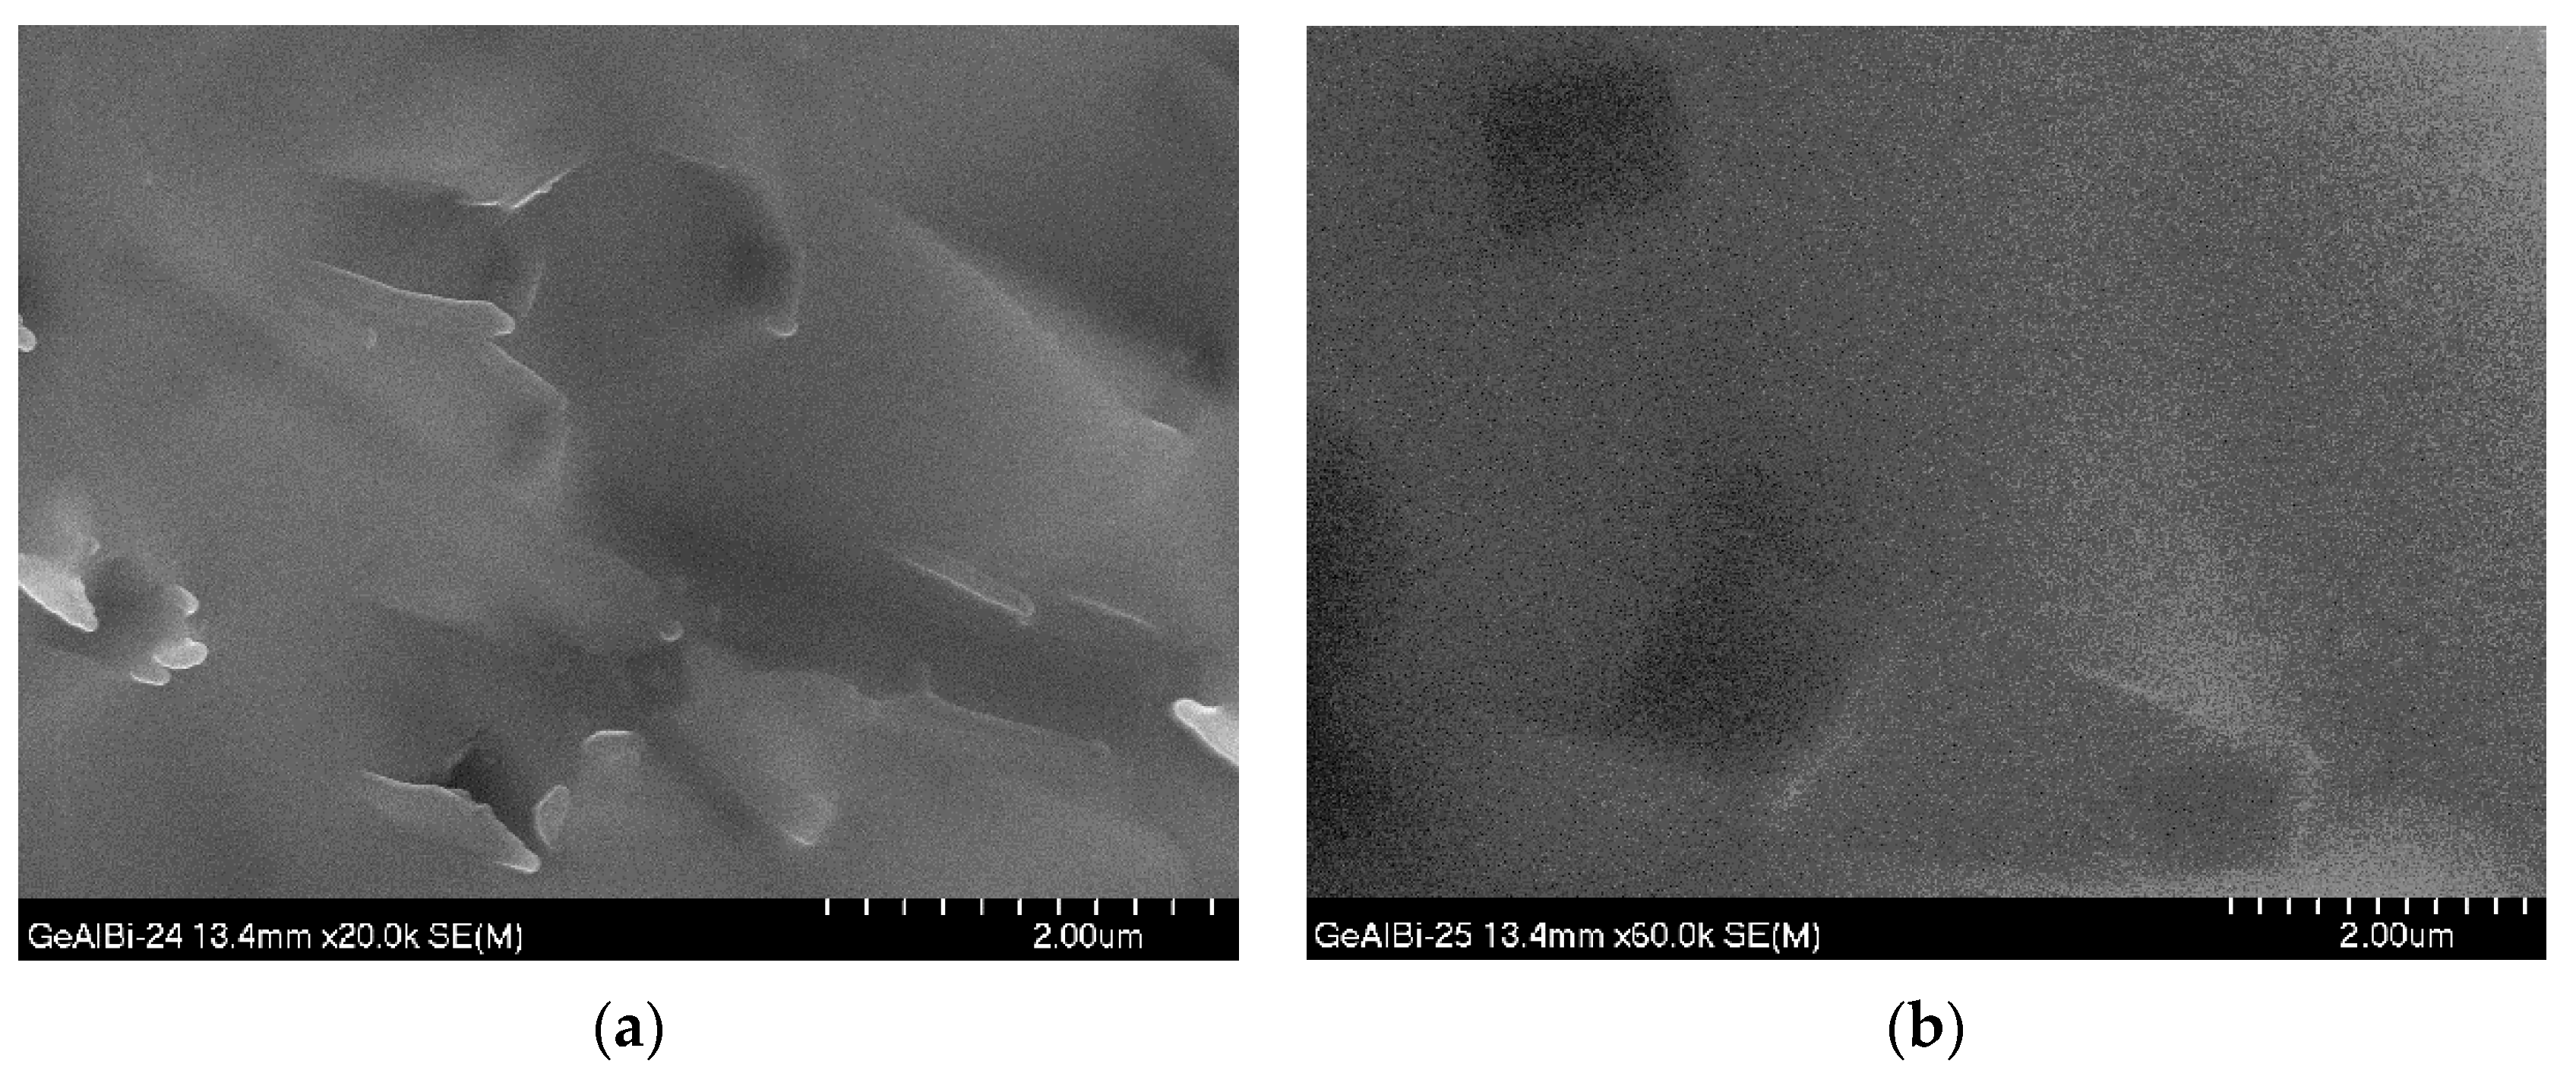
Except on the XRD and the DTA measurements after the heat-treatment of glass, all samples were studied under SEM microscopy. Figure 12 presents the fractured surface of the 93GeO2–6Al2O3–1Bi2O3 glass obtained at T = 600 °C. It was observed that the microstructure was reached in the form of crystalline objects (Figure 12a,b). These two types of crystalline objects had characteristic shapes, namely slack bars and square crystals. These elongated elements were identified as mullite-like phase crystals and square objects as a germanium oxide. It is known that the mullite phase crystallizes most often in the form of needles (prismatic needle shape).
5. Conclusions
Based on the investigation of the processing and characterization of the obtained GeO2–Al2O3–Bi2O3 material, we can summarize the results as follows.
Thermogravimetric investigations of the GeO2–Al2O3–Bi2O3 glass showed that the glass form existed between the glass transition (Tg = 611 °C) and the crystallization temperature (Tx = 848 °C).
Using formal kinetics, the apparent activation energy can be calculated at, respectively, Ea = 400 and Ea = 477 kJ/mol for the two crystallization peaks on the DTA curve. The apparent activation energy for the crystallization of pure GeO2 glass is Ea = 254 kJ/mol.
Although in the obtained glass, 93GeO2–6Al2O3–1Bi2O3, it is difficult to determine the phase of small crystals forming directly, it has been suggested that the crystalline species have a composition of GeO2 and Ge-mullite-like phase. The conclusions are based on the identification of the crystallized phase compositions and the shapes of the observed species of SEM images.
The tested glass shows emissions in the IR light range at 1165 nm.
Author Contributions
Conceptualization, J.P.; methodology, J.P. and M.P.; investigation, writing—original draft preparation, M.P. and J.P.; writing—review and editing, M.P. and J.P.; visualization, M.P. and J.P.; supervision, J.P. All authors have read and agreed to the published version of the manuscript.
Funding
This research received no external funding. The publishing process of this article was financed by the Polish Ministry of Science and Higher Education within statutory activity.
Acknowledgments
The experimental work was carried out at the University of Applied Sciences Muenster. Special thanks go to Anna Łatkiewicz for her cooperation and help in the research of the microstructure and composition of glass. SEM research was performed in the Laboratory of Scanning Electron Microscopy and Microanalysis, Institute of Geological Sciences, Jagiellonian University in Cracow.
Conflicts of Interest
The authors declare no conflict of interest.
References
- Fedorov, P.; Luginina, A.; Popov, A. Transparent oxyfluoride glass ceramics. J. Fluor. Chem. 2015, 172, 22–50. [Google Scholar] [CrossRef]
- Bocker, C.; Rüssel, C.; Avramov, I. Transparent Nano Crystalline Glass-Ceramics by Interface Controlled Crystallization. Int. J. Appl. Glas. Sci. 2013, 4, 174–181. [Google Scholar] [CrossRef]
- Laser Gain Media: A Diverse Family of Materials. Photonic Spectra. 2013. Available online: http://www.photonicsspectra-digital.com/photonicsspectra/may_2013?pg=57#pg57, (accessed on 16 June 2020).
- Fill, E.; Finckenstein, K. A comparison of the performance of different laser amplifier media. IEEE J. Quantum Electron. 1972, 8, 24–26. [Google Scholar] [CrossRef]
- Tanabe, S. Novel Oxide Glass and Glass Ceramic Materials for Optical Amplifier. Biomater. Sci. Process. Prop. Appl. V 2012, 2005, 1–16. [Google Scholar] [CrossRef]
- Fujita, N.; Lwao, M.; Fujita, S.; Ohji, M. Wavelength Conversion material “Phosphor-glass Composities” for high power soild-state lighting. Met. Powder Rep. 2008, 63, 11. [Google Scholar] [CrossRef]
- Masai, H. Preparation of rare-earth-free oxide glass phosphors. J. Ceram. Soc. Jpn. 2013, 121, 150–155. [Google Scholar] [CrossRef] [Green Version]
- Fleming, J.W. Dispersion in GeO2–SiO2 glasses. Appl. Opt. 1984, 23, 4486. [Google Scholar] [CrossRef]
- Liu, C.; Heo, J. Generation of white light from oxy-fluoride nano-glass doped with Ho3+, Tm3+ an Yb3+. Mater. Lett. 2007, 61, 3751–3754. [Google Scholar] [CrossRef]
- Bayya, S.S.; Sanghera, J.S.; Aggarwal, I.D.; Wojcik, J.A. Infrared Transparent Germanate Glass-Ceramics. J. Am. Ceram. Soc. 2004, 85, 3114–3116. [Google Scholar] [CrossRef]
- Lin, G.; Zhu, B.; Zhou, S.; Yang, H.; Qiu, J. Tunable luminescence of CaO-Al2O3-GeO2 glasses. Opt. Express 2007, 15, 16980–16985. [Google Scholar] [CrossRef]
- Qiu, J.; Igarashi, H.; Makishima, A. Long-lasting phosphorescence in Mn2+:Zn2GeO4 Crystallites precipitated in transparent GeO2–B2O3–ZnO glass-ceramics. Sci. Technol. Adv. Mater. 2005, 6, 431–434. [Google Scholar] [CrossRef] [Green Version]
- Sharonov, M.; Bykov, A.; Myint, T.; Petricevic, V.; Alfano, R. Spectroscopic study of chromium-doped transparent calcium germanate glass-ceramics. Opt. Commun. 2007, 275, 123–128. [Google Scholar] [CrossRef]
- Leadbetter, A.; Wright, A. Diffraction studies of glass structure. J. Non-Cryst. Solids 1972, 7, 37–52. [Google Scholar] [CrossRef]
- Hung, P.K.; Vinh, L.; Nhan, N.; Hong, N.; Mung, T. Local structure of liquids Al2O3 and GeO2 under densification. J. Non-Cryst. Solids 2008, 354, 3093–3097. [Google Scholar] [CrossRef]
- Chen, B.J.; Shen, L.F.; Pun, E.; Lin, H. Nd3+-doped ion-exchanged aluminum germanate glass channel waveguide. Opt. Mater. Express 2014, 5, 113. [Google Scholar] [CrossRef]
- Winterstein, A.; Manning, S.; Ebendorff-Heidepriem, H.; Wondraczek, L. Luminescence from bismuth-germanate glasses and its manipulation through oxidants. Opt. Mater. Express 2012, 2, 1320. [Google Scholar] [CrossRef] [Green Version]
- Dong, W.; Bin, T.; Calvez, L.; Xiang-Hua, Z.; Long, Z. Upconversion Luminescence of Er 3+ Ions in Transparent Germanate Glass Ceramics Containing CaF2 Nanocrystals. Chin. Phys. Lett. 2010, 27, 067804. [Google Scholar] [CrossRef]
- Zhao, Y.; Peng, M.; Mermet, A.; Zheng, J.; Qiu, J. Precise frequency shift of NIR luminescence from bismuth-doped Ta2O5-GeO2 Glass via composition modulation. J. Mater. Chem. C 2014, 2, 7830. [Google Scholar] [CrossRef]
- Sokolov, V.O.; Plotnichenko, V.G.; Dianov, E.M. Origin of near-IR luminescence in Bi2O3-GeO2 and Bi2O3-SiO2 glasses: First-principle study. Opt. Mater. Express 2014, 5, 163–168. [Google Scholar] [CrossRef]
- Fujimoto, Y. New Infrared Luminescence from Bi-doped Glasses. In Advances in Solid State Lasers Development and Applications; InTech: London, UK, 2010; Volume 2, pp. 25–44. [Google Scholar]
- Jiang, X.; Su, L.; Yu, P.; Guo, X.; Tang, H.; Xu, X.; Zheng, L.; Li, H.; Xu, J. Broadband photoluminescence of Bi2O3-GeO2 Binary systems: glass, glass-ceramics and crystals. Laser Phys. 2013, 23, 105812. [Google Scholar] [CrossRef]
- Jüstel, T.; Huppertz, P.; Mayr, W.; Wiechert, D. Temperature-dependent spectra of YPO4:Me (Me = Ce, Pr, Nd, Bi). J. Lumi. 2004, 106, 225–233. [Google Scholar] [CrossRef]
- De Jong, M.; Meijerink, A.; Barandiarán, Z.; Seijo, L. Structure and Hindered Vibration of Bi2+ in the Red-Orange Phosphor SrB4O7:Bi. J. Phys. Chem. C 2014, 118, 17932–17939. [Google Scholar] [CrossRef]
- Anitha, M.; Ramakrishnan, P.; Chatterjee, A.; Alexander, G.; Singh, H. Spectral properties and emission efficiencies of GdVO4 phosphors. Appl. Phys. A 2002, 74, 153–162. [Google Scholar] [CrossRef]
- Liu, B.-M.; Yong, Z.-J.; Yu, H.-M.; Sun, H.-T.; Zheng, L.; Zhou, Y.; Li, L.-N. Creation of near-infrared luminescent phosphors enabled by topotactic reduction of bismuth-activated red-emitting crystals. J. Mater. Chem. C 2016, 4, 9489–9498. [Google Scholar] [CrossRef] [Green Version]
- International Centre for Diffraction Data. Microsc. Today 2013, 21, 8. [CrossRef]
- Lamoreaux, R.H.; Hildenbrand, D.L.; Brewer, L. High?Temperature Vaporization Behavior of Oxides II. Oxides of Be, Mg, Ca, Sr, Ba, B, Al, Ga, In, Tl, Si, Ge, Sn, Pb, Zn, Cd, and Hg. J. Phys. Chem. Ref. Data 1987, 16, 419. [Google Scholar] [CrossRef]
- Kissinger, H.E. Variation of peak temperature with heating rate in differential thermal analysis. J. Res. Natl. Inst. Stand. Technol. 1956, 57, 217. [Google Scholar] [CrossRef]
- Málek, J. Kinetic analysis of crystallization processes in amorphous materials. Thermochim. Acta 2000, 355, 239–253. [Google Scholar] [CrossRef]
- Ray, C.S.; Huang, W.; Day, D.E. Crystallization Kinetics of a Lithia-Silica Glass: Effect of Sample Characteristics and Thermal Analysis Measurement Techniques. J. Am. Ceram. Soc. 1991, 74, 60–66. [Google Scholar] [CrossRef]
- Augis, J.A.; Bennett, J.E. Calculation of the Avrami parameters for heterogeneous solid state reactions using a modification of the Kissinger method. J. Therm. Anal. Calorim. 1978, 13, 283–292. [Google Scholar] [CrossRef]
- Qiu, J.; Peng, M.; Ren, J.; Meng, X.; Jiang, X.; Zhu, C. Novel Bi-doped glasses for broadband optical amplification. J. Non-Cryst. Solids 2008, 354, 1235–1239. [Google Scholar] [CrossRef]
- Reisfeld, R.; Boehm, L. Optical properties of bismuth in germanate, borax and phosphate glasses. J. Non-Cryst. Solids 1974, 16, 83–92. [Google Scholar] [CrossRef]
- Srivastava, A. Luminescence of divalent bismuth in M2+BPO5 (M2+ = Ba2+, Sr2+ and Ca2+). J. Lumi. 1998, 78, 239–243. [Google Scholar] [CrossRef]
- Peng, M.; Qiu, J.; Chen, D.; Meng, X.; Zhu, C. Superbroadband 1310 nm emission from bismuth and tantalum codoped germanium oxide glasses. Opt. Lett. 2005, 30, 2433–2435. [Google Scholar] [CrossRef]
- Muhammad, A.R.; Pinninty, H.R.; Jusoh, Z.; Yasin, M.; Haris, H.; Harun, S.W.; Halder, A.; Das, S.; Dhar, A.; Paul, M.C. Near infrared amplified spontaneous emission of bismuth doped fiber. J. Optoelectron. Biomed. Mater 2016, 8, 131–135. [Google Scholar]
- Xia, Y.; Wang, L.; Deng, X.; Li, D.; Zhu, X.; Cao, Y. Photocurrent response wavelength up to 1.1 μm from photovoltaic cells based on narrow-band-gap conjugated polymer and fullerene derivative. Appl. Phys. Lett. 2006, 89, 81106. [Google Scholar] [CrossRef]
- Tang, B.; Yang, Y.; Fan, Y.; Zhang, L. Barium Gallogermanate Glass Ceramics for Infrared Applications. J. Mater. Sci. Technol. 2010, 26, 558–563. [Google Scholar] [CrossRef]
- Peng, M.; Wang, C.; Chen, D.; Qiu, J.; Jiang, X.; Zhu, C. Investigations on bismuth and aluminum co-doped germanium oxide glasses for ultra-broadband optical amplification. J. Non-Cryst. Solids 2005, 351, 2388–2393. [Google Scholar] [CrossRef]
- Ojovan, M.I.; E Lee, W. Topologically disordered systems at the glass transition. J. Phys. Condens. Matter 2006, 18, 11507–11520. [Google Scholar] [CrossRef] [Green Version]
- Miller, J.L.; McCormick, G.R.; Ampian, S.G. Phase Equilibria in the System GeO2-Al2O3. J. Am. Ceram. Soc. 1967, 50, 268–269. [Google Scholar] [CrossRef]
Figure 1.
Results of the investigations: (a) crystallization and melting on the DTA curve (at step 10 °C/min); and (b) X-ray diffraction pattern of pure GeO2 glass.
Figure 1.
Results of the investigations: (a) crystallization and melting on the DTA curve (at step 10 °C/min); and (b) X-ray diffraction pattern of pure GeO2 glass.

Figure 2.
Results of investigations: (a) crystallization and melting on the DTA curve (at step 10 °C/min); and (b) X-ray diffraction pattern of 93GeO2–6Al2O3–1Bi2O3 glass (T = 20 °C).
Figure 2.
Results of investigations: (a) crystallization and melting on the DTA curve (at step 10 °C/min); and (b) X-ray diffraction pattern of 93GeO2–6Al2O3–1Bi2O3 glass (T = 20 °C).

Figure 3.
Example of (a) SEM micrograph fractured surfaces (magnification x10k) and (b) results of EDX mapping analysis of the of 93GeO2–6Al2O3–1Bi2O3 glass.
Figure 3.
Example of (a) SEM micrograph fractured surfaces (magnification x10k) and (b) results of EDX mapping analysis of the of 93GeO2–6Al2O3–1Bi2O3 glass.

Figure 4.
An example of EDXS analysis spectrum with SEM micrograph of examined glass.

Figure 5.
Optical transmission (a) and optical emission spectra (b) of 93GeO2–6Al2O3–1Bi2O3 glass.

Figure 6.
DTA curves illustrating the crystallization of 93GeO2–6Al2O3–1Bi2O3 glass in an air atmosphere when the heating rate was β = 1, 2.5, 5, 10 at steps of 20 °C/min.
Figure 6.
DTA curves illustrating the crystallization of 93GeO2–6Al2O3–1Bi2O3 glass in an air atmosphere when the heating rate was β = 1, 2.5, 5, 10 at steps of 20 °C/min.

Figure 7.
(a) Glass transition temperature Tg as a function of the heating rate β and (b) the Kissinger function for the crystallization of 93GeO2–6Al2O3–1Bi2O3 at temperatures Tx1 and Tx2.
Figure 7.
(a) Glass transition temperature Tg as a function of the heating rate β and (b) the Kissinger function for the crystallization of 93GeO2–6Al2O3–1Bi2O3 at temperatures Tx1 and Tx2.

Figure 8.
DTA crystallization curves (a) (heating rate: 2.5, 5, 10, 15 with steps of 20 °C/min) and the interpretation of kinetic evaluation with the Kissinger equation (b) of pure GeO2 glass.
Figure 8.
DTA crystallization curves (a) (heating rate: 2.5, 5, 10, 15 with steps of 20 °C/min) and the interpretation of kinetic evaluation with the Kissinger equation (b) of pure GeO2 glass.

Figure 9.
Example of the peak separation and the determined (Δ*T) values and the Avrami coefficient (n).
Figure 9.
Example of the peak separation and the determined (Δ*T) values and the Avrami coefficient (n).

Figure 10.
XRD patterns recorded at different temperature of heat-treatment (a) 550 °C, (b) 600 °C, (c) 650 °C, and (d) 700 °C, for 93GeO2–6Al2O3–1Bi2O3 glass.
Figure 10.
XRD patterns recorded at different temperature of heat-treatment (a) 550 °C, (b) 600 °C, (c) 650 °C, and (d) 700 °C, for 93GeO2–6Al2O3–1Bi2O3 glass.

Figure 11.
DTA curves of partially crystallized 93GeO2–6Al2O3–1Bi2O3 glass at temperatures: (a) 550 °C, (b) 600 °C, (c) 650 °C, and (d) 700 °C, examined for 6 h.
Figure 11.
DTA curves of partially crystallized 93GeO2–6Al2O3–1Bi2O3 glass at temperatures: (a) 550 °C, (b) 600 °C, (c) 650 °C, and (d) 700 °C, examined for 6 h.

Figure 12.
SEM micrographs of the 93GeO2–6Al2O3–1Bi2O3 glass fractured surface after being heated at 600 °C observed with different magnification: (a) 20k, (b) 60k.
Figure 12.
SEM micrographs of the 93GeO2–6Al2O3–1Bi2O3 glass fractured surface after being heated at 600 °C observed with different magnification: (a) 20k, (b) 60k.


Table 1.
The characteristic temperatures of the crystallization of 93GeO2–6Al2O3–1Bi2O3 glass.
| β, °C/min | Tg °C | Tx1 °C | Tx2 °C |
|---|---|---|---|
| 1 | 533.6 | 727.7 | 801.2 |
| 2.5 | 561.0 | 744.3 | 816.7 |
| 5 | 589.3 | 760.2 | 830.6 |
| 10 | 611.2 | 777.4 | 848.0 |
| 20 | 629.4 | 789.1 | 860.7 |
Table 2.
Determined values of (Δ∗Tx1), (Δ∗Tx2), and the Avrami coefficient n(x1) and n(x2).
| β, °C/min | Δ∗Tx1 °C | n(x1) | Δ∗Tx2 °C | n(x1) |
|---|---|---|---|---|
| 1 | 48.7 | 0.895 | 76.4 | 0.784 |
| 2.5 | 40.3 | 1.118 | 68.9 | 0.894 |
| 5 | 46.6 | 0.998 | 52.2 | 1.211 |
| 10 | 29.8 | 1.613 | 58.2 | 1.119 |
| 20 | 27.5 | 1.785 | 38.1 | 1.751 |
| Average | 1.282 | 1.153 | ||
| STD | 0.333 | 0.263 |
© 2020 by the authors. Licensee MDPI, Basel, Switzerland. This article is an open access article distributed under the terms and conditions of the Creative Commons Attribution (CC BY) license (http://creativecommons.org/licenses/by/4.0/).
Share and Cite
MDPI and ACS Style
Płońska, M.; Plewa, J. Crystallization of GeO2–Al2O3–Bi2O3 Glass. Crystals 2020, 10, 522. https://doi.org/10.3390/cryst10060522
AMA Style
Płońska M, Plewa J. Crystallization of GeO2–Al2O3–Bi2O3 Glass. Crystals. 2020; 10(6):522. https://doi.org/10.3390/cryst10060522
Chicago/Turabian StylePłońska, Małgorzata, and Julian Plewa. 2020. "Crystallization of GeO2–Al2O3–Bi2O3 Glass" Crystals 10, no. 6: 522. https://doi.org/10.3390/cryst10060522
Note that from the first issue of 2016, this journal uses article numbers instead of page numbers. See further details here.