Article

Effects of Various Inhibitors on the Nucleation of Calcium Oxalate in Synthetic Urine

1
Department of Urology, Chang Gung Memorial Hospital Linkou, Taoyuan 333, Taiwan
2
Department of Chemical and Materials Engineering, Chang Gung University, Taoyuan 333, Taiwan
*
Author to whom correspondence should be addressed.
Crystals 2020, 10(4), 333; https://doi.org/10.3390/cryst10040333
Submission received: 30 March 2020 / Revised: 22 April 2020 / Accepted: 22 April 2020 / Published: 23 April 2020
(This article belongs to the Special Issue Crystal Nucleation and Growth Kinetics)

Abstract

:
A new synthetic urine was adopted in this work to study the nucleation kinetics of calcium oxalate using a batch crystallizer for various supersaturations at 37 °C. In the studied new synthetic urine, three additional components (urea, uric acid and creatinine) within the normal physiological ranges were added to the commonly-used synthetic urine to simulate human urine more closely. The interfacial energy for the nucleation of calcium oxalate was determined based on classical nucleation theory using the turbidity induction time measurements. The effects of various inhibitors, including magnesium, citrate, hydroxycitrate, chondroitin sulfate, and phytate, on the nucleation of calcium oxalate were investigated in detail. Scanning electron microscopy was used to examine the influences of these inhibitors on the preferential nucleation of the different hydrates of calcium oxalate crystals.

Graphical Abstract

1. Introduction

Renal lithiasis is a common health problem and affects about 10% of the global population [1]. Although renal stones are composed of organic and inorganic biomineral matrices, calcium oxalate (CaOx) is the most common crystalline composition found in clinical stone formation [2]. Three hydrates can be formed by CaOx crystallization, including the thermodynamically stable monoclinic monohydrate (COM) [3], the metastable tetragonal dihydrate (COD) [4] and the thermodynamically unstable triclinic trihydrate (COT) [5]. As COM has the strongest affinity for renal tubule cell membranes among the three hydrates, COM more easily forms urinary stones than COT or COD [6].
Many inorganic and organic substances—e.g., magnesium, citrate, hydroxycitrate, chondroitin sulfate, phytate, etc.—are known to inhibit stone formation, while low urine volume, calcium, oxalate and urate can promote stone formation [7,8,9,10,11,12]. A deficiency of inhibitors in the urine can facilitate stone formation. As storing real urine is difficult and real urine generally does not meet the dosage test requirements, a number of synthetic urines which are different in their compositions and concentrations have been adopted in the study of renal stone formation. However, the relative importance of inhibitors in renal stone formation remains unclear due to the wide variety of urine adopted in the test systems [13,14,15,16,17,18,19,20,21,22].
The induction time in a crystallization system is defined as the time between the creation of the supersaturation and the appearance of detectable nuclei. The nucleation rate is generally reported to be inversely proportional to the induction time in the nucleation process [23]. The synthetic urine adopted in some previous research [21,22] is modified in this work to study the effects of various inhibitors, including magnesium, citrate, hydroxycitrate, chondroitin sulfate, and phytate, on the nucleation of CaOx based on the induction time data using a batch crystallizer. The solution conditions are controlled to simulate real physiological conditions. In addition, scanning electron microscopy (SEM) is used to identify the different hydrates of calcium oxalate crystals and hence examine the influences of the inhibitors on the preferential nucleation of the different hydrates.

2. Experimental

The experimental apparatus consisted of a 250 mL crystallizer immersed in a programmable thermostatic water bath, as shown in Figure 1. The crystallizer was equipped with a magnetic stirrer with a constant stirring rate of 350 rpm. Chemicals of analytical reagent grade purity were dissolved in the deionized water to prepare the desired solutions. The solutions were filtered through 0.45 µm pore filters before use.
By comparing various different synthetic urine formulas, Chutipongtanate and Thongboonkerd [24] suggested a new formula for in vitro cellular study (see Table S1 in Supplementary Materials). In this work, three additional components (urea, uric acid and creatinine) within the normal physiological ranges suggested by Chutipongtanate and Thongboonkerd [24] were added to the synthetic urine adopted by Robertson and Scurr [21] and Grases et al. [22] (see Table S2 in Supplementary Materials) to simulate human urine more closely. The synthetic urine adopted in this work is listed in Table 1.
The induction time experiments were performed at 37 °C. At the beginning of the experiments, 100 mL of solution 1 and 100 mL of solution 2 were mixed to prepare the synthetic urine for the current study. Subsequently, 3 mL of solution 3 (sodium oxalate) at the predetermined concentration (25.6 mM, 32.4 mM, 40.0 mM, and 57.6 mM) was added into the 200 mL mixed urine solution to achieve the desired supersaturation, S, of CaOx. The final concentrations of all the components for the solutions formed at the point of mixing are listed in Table 2. Fresh solutions were prepared for each experiment.
In consideration of the activity values for the calcium and oxalate ions in the urinary solutions, Finlayson [25] proposed the following relation to determine the supersaturation based on the urinary ion equilibrium:
S = 3.756 + 6.796 × [ C a 2 + ] [ O x 2 ] ( [ C a 2 + ]   a n d   [ O x 2 ]   i n   m M )
As the solubilities for the different hydrates of calcium oxalate are not available in the literature, the supersaturation calculated from Equation (1) was adopted in this work regardless of the different hydrates formed in the supersaturated urinary solutions. Thus, S varied with [ O x 2 ] while [ C a 2 + ] was kept the same at 2.46 mM during the experiments. For example, [ O x 2 ] = 0.38   m M leads to S = 10.09 while [ O x 2 ] = 0.59   m M leads to S = 13.65 .
The desired concentrations of inhibitors, including potassium phytate, sodium chondroitin sulfate, potassium hydroxycitrate monohydrate, trisodium citrate dihydrate and magnesium sulfate heptahydrate, were added to solution 2 before mixing. For the final solutions formed at the point of mixing, the inhibitor concentration, C i , for magnesium sulfate heptahydrate ranged from 200 ppm to 1000ppm, C i for trisodium citrate dihydrate ranged from 200 ppm to 800 ppm, C i for potassium hydroxycitrate monohydrate ranged from 100 ppm to 600 pp, C i for sodium chondroitin sulfate ranged from 10 ppm to 60 ppm, and C i for potassium phytate ranged from 0.5 ppm to 1.5 ppm,. Note that 1   p p m = 1   m g / L = 10 3   K g / m 3 .
Sodium sulfate decahydrate (Na2SO4·10H2O, purity 99%), calcium chloride anhydrous (CaCl2, purity 96%), urea (CH4N2O, purity 99%), uric acid (C5H4N4O3, purity >99%), creatinine (C4H7N3O, purity >99%), sodium oxalate (Na2C2O4, purity >95%) and sodium chondroitin sulfate (C14H22NNaO15S, purity >95%) were purchased from Acros. Ammonium chloride (NH4Cl, purity 99%), potassium chloride (KCl, purity 99.5%), sodium chloride (NaCl, purity 99.5%), trisodium citrate dihydrate (Na3C6H5O7·2H2O, purity 99%) and magnesium sulfate heptahydrate (MgSO4·7H2O, purity 100%) were purchased from Showa. Sodium phosphate monobasic dihydrate (NaH2PO4·2H2O, purity 100%) and sodium phosphate dibasic dodecahydrate (Na2HPO4·12H2O, purity >98%) were purchased from Aencore. Potassium phytate (C6H16O24P6K2, purity >95%) and potassium hydroxycitrate monohydrate (C6H5K3O8·H2O, purity >95%) were purchased from Sigma (St. Louis, USA).
A turbidity probe (Crystal Eyes, manufactured by HEL limited, Hertford, UK) was used in the experiments to measure the induction time for each condition at a constant temperature of 37 °C. The mixed synthetic urine solution was kept at a pH of 6.5 during the induction time measurements, which is close to the pH value of human urine. At the end of the experiments, the final dried crystals were examined using SEM (Hitachi, SU8220, Tokyo, Japan) to determine the polymorphic forms of CaOx crystals.

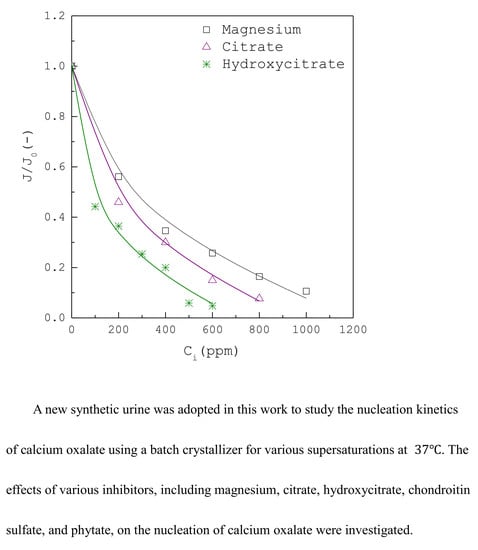
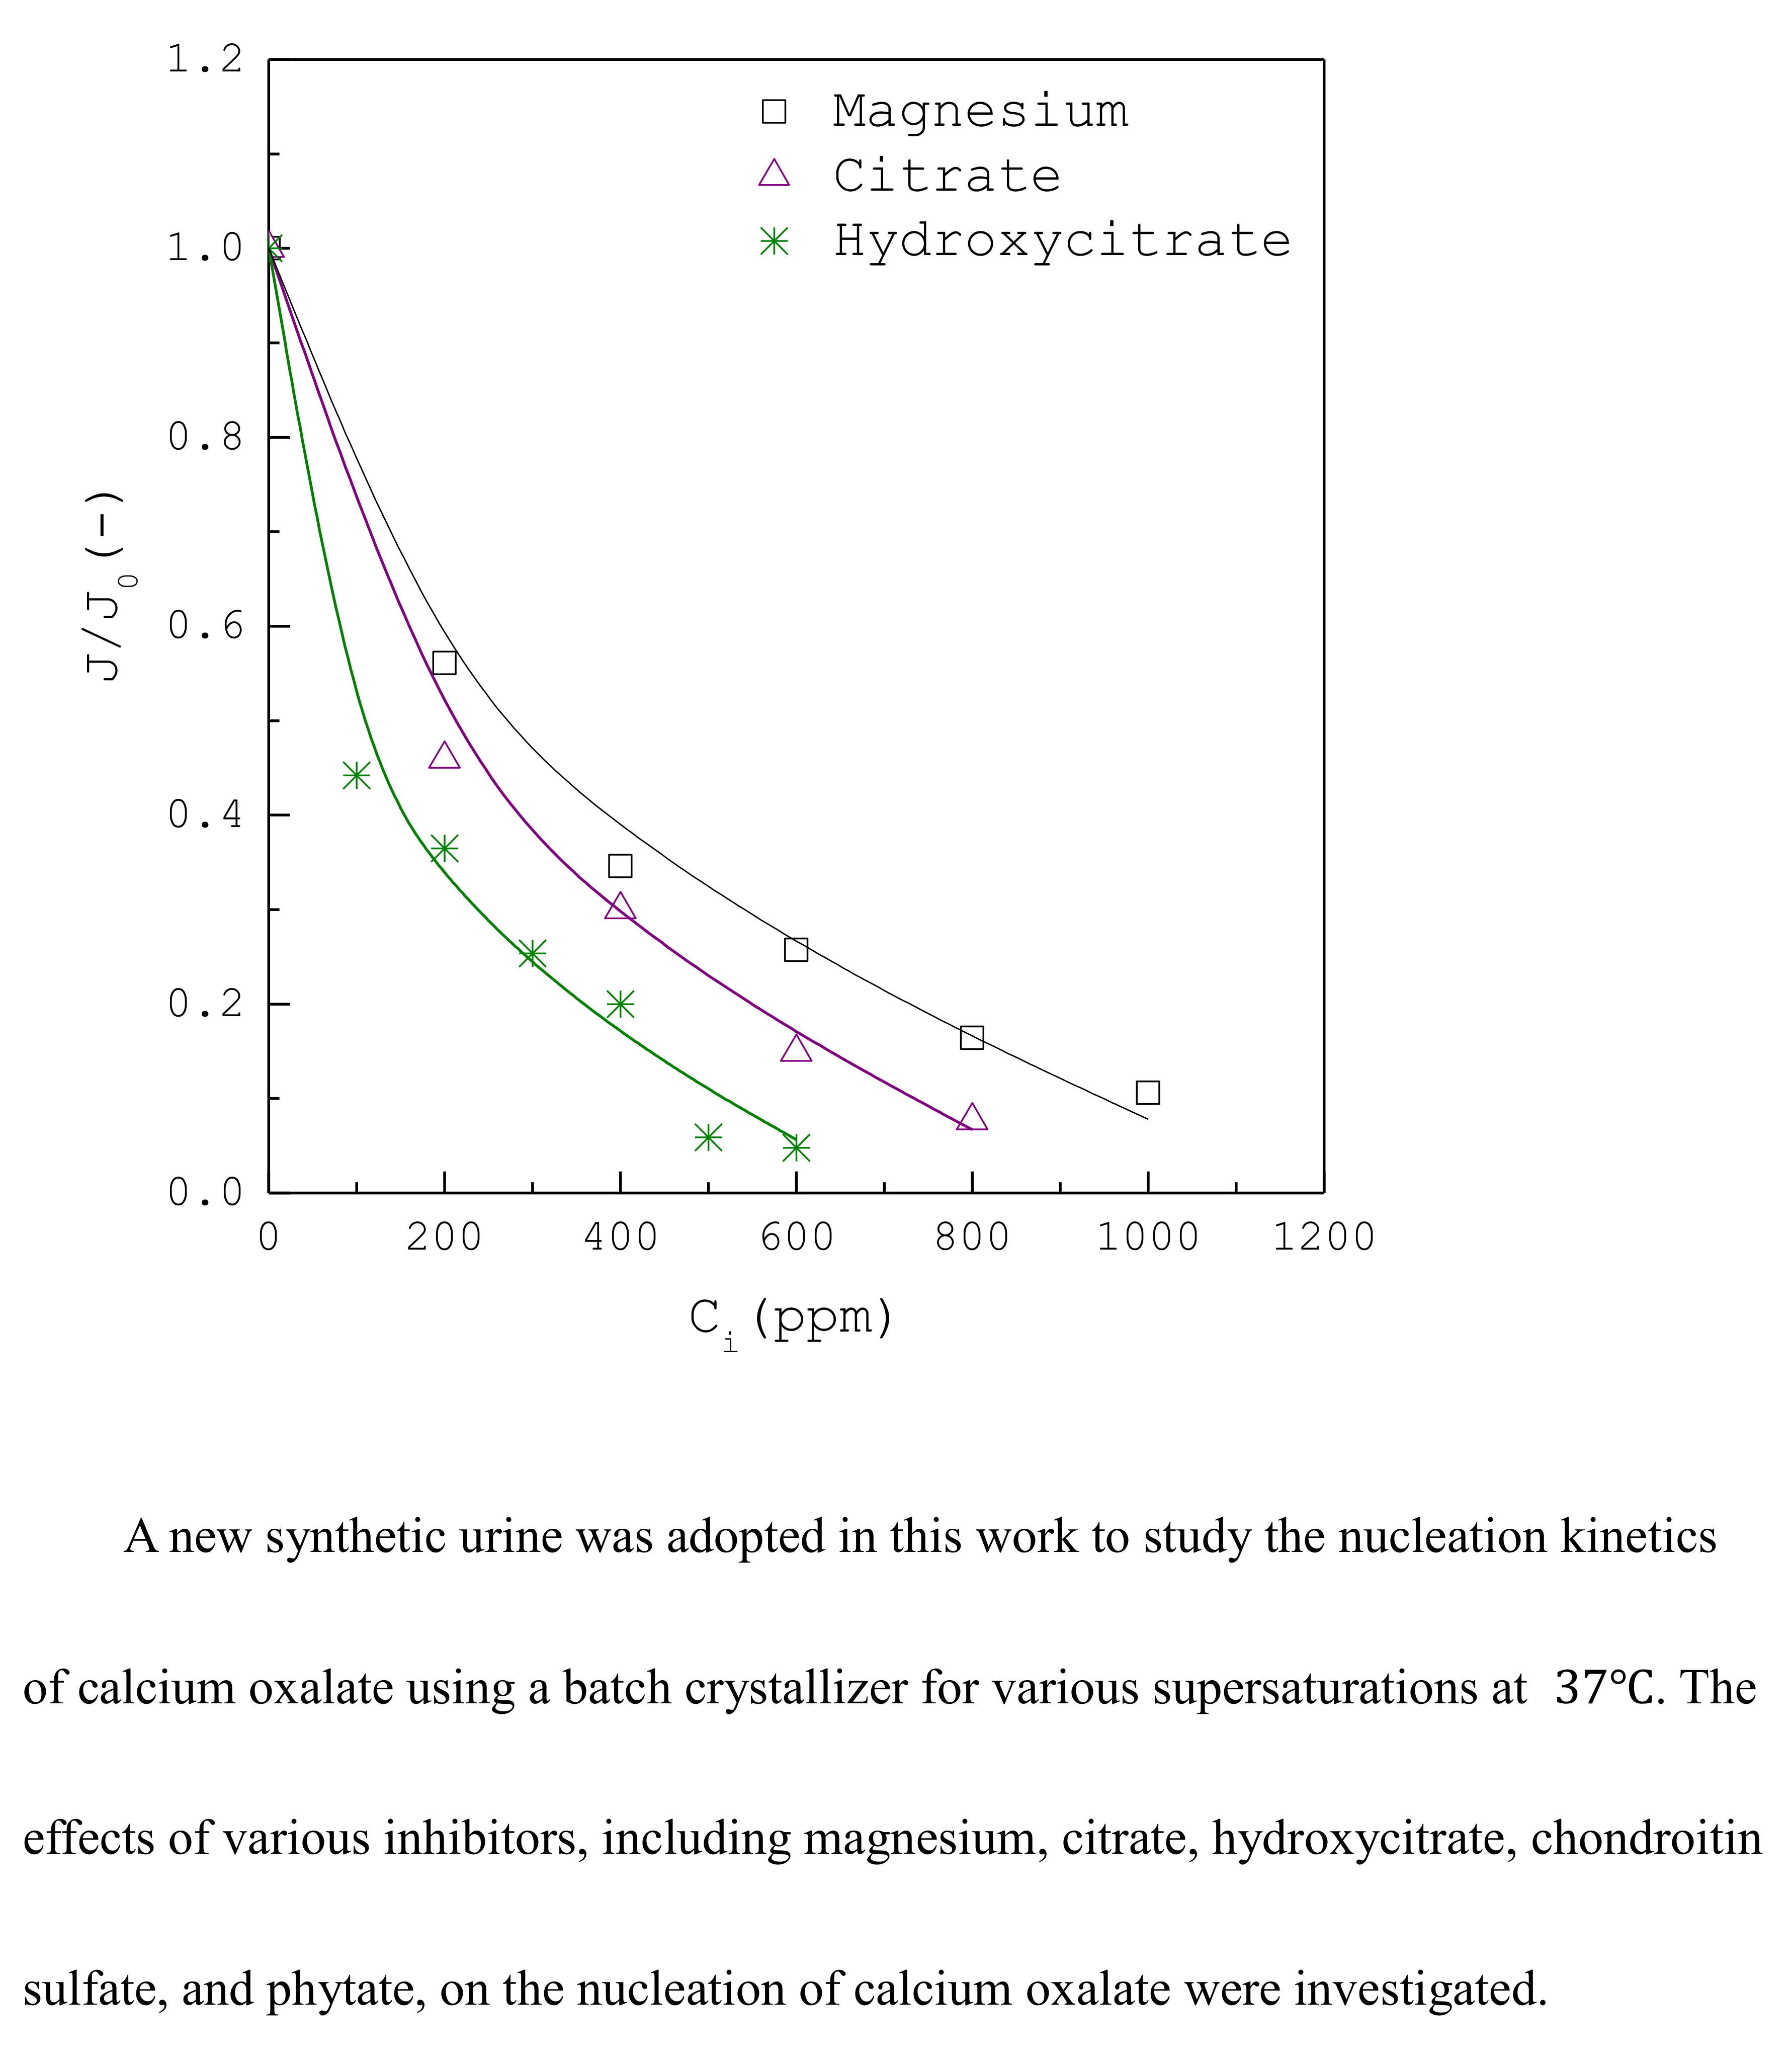
3. Results and Discussion

The measured induction time data for various supersaturations at 37 °C in the solutions without inhibitors are listed in Table S3 (see Supplementary Materials). The measured induction time data for S = 13.65 at 37 °C in the solutions in the presence of various inhibitors are listed in Tables S4–S8 (see Supplementary Materials). Each condition was carried out three times to obtain the average induction time. The nucleation rate based on classical nucleation theory (CNT) is expressed as [23]
J = A J   e x p [ 16 π v 2 γ 3   3 k B 3 T 3 l n 2 S ]
where A J is the nucleation pre-exponential factor, γ is the interfacial energy, k B is the Boltzmann constant, S = C C e q is the supersaturation, and v = M w ρ c N A is the molecular volume. Note that M w = 0.146   k g / m o l , ρ C = 2200   k g / m 3 and v = 1.103 × 10 28   m 3 for CaOx monohydrate.
For simplicity, the induction time at a constant supersaturation level is often assumed to correspond to a point at which the total number density of the nuclei has reached a certain value, f N , in the induction time measurements [26,27,28,29,30]. Thus, one can derive, at the induction time t i ,
f N = J   t i
where f N depends on the sensitivity of the detector. Equation (3) is consistent with the common method that the nucleation rate is assumed to be inversely proportional to the induction time, as stated in the literature [23].
Substituting Equation (2) into Equation (3) yields
ln ( 1 t i ) = ln ( A J f N ) 16 π v 2 γ 3 3 k B 3 T 3 l n 2 S
A plot of ln ( 1   t i ) versus 1 l n 2 S at a constant temperature should give a straight line, the slope and intercept of which permit the determination of A J f N and γ , respectively. If the value of f N is available, A J can be determined.
Based on the study of 28 solutions undergoing nucleation, Mersmann and Bartosch [31] concluded that the minimum detectable volume fraction of nuclei in solution corresponds to f V = 10 4 10 3 with the minimum detectable size of 10 100   μ m . As the intermediate value, f V = 4 × 10 4 , was adopted at the detection of the nucleation point for the Lasentec focus beam reflectance measurements reported by Lindenberg and Mazzotti [32] and for the turbidity measurements reported by Shiau and Lu [28], this value was also adopted in this study. Based on f V = 4 × 10 4 for spherical nuclei with L d = 10   μ m and k V = π 6 , it leads to f N = 7.64 × 10 11   m 3 [30].
Figure 2 shows the increase of J J 0 with increasing S for the solutions without inhibitors at 37 °C, where J 0 represents the nucleation rate for S = 13.65 . Note that J J 0 = t i , 0 t i based on Equation (3), where t i , 0 represents the induction time for S = 13.65 . For example, J J 0 = 1.7 for S = 18 , and J J 0 = 0.5 for S = 12 . Thus, as S increases, J increases due to decreasing t i .
Figure 3 shows the induction time data of ln ( 1 t i ) versus 1 l n 2 S for the solutions without inhibitors at 37 °C fitted to Equation (4), leading to γ = 22.7   m J / m 2 and A J f N = 0.336   s 1 . Based on f N = 7.64 × 10 11   m 3 , we can obtain A J = 2.57 × 10 11   m 3   s 1 . This value of γ is consistent with the values reported in the literature [25,33,34]. Generally, the higher the value of the interfacial energy, the more difficult it is for the solute to crystallize. It should be noted that γ and A J f N are determined first without the knowledge of f N . Consequently, γ is not influenced by the chosen value of f N although A J needs to be determined based on f N . For example, if the chosen value of f N is increased by ten times, A J is increased by ten times while γ remains unchanged.
Figure 4 shows the decrease of J J 0 with increasing inhibitor concentration for the solutions in the presence of magnesium, citrate and hydroxycitrate for S = 13.65 at 37 °C. Figure 5 shows the decrease of J J 0 with increasing inhibitor concentration for the solutions in the presence of chondroitin sulfate for S = 13.65 at 37 °C. Figure 6 shows the decrease of J J 0 with increasing inhibitor concentration for the solutions in the presence of phytate for S = 13.65 at 37 °C. In Figure 4, Figure 5 and Figure 6, J 0 and J represent the nucleation rate for S = 13.65 without inhibitors and in the presence of inhibitors, respectively.
As compared in Figure 4, Figure 5 and Figure 6 for S = 13.65 , the inhibition on nucleation rate of CaOx increases in the order magnesium < citrate < hydroxycitrate < chondroitin sulfate < phytate. For example, Figure 4 shows that the amount of inhibitor required to reach the inhibition of J J 0 = 0.2 is 800 ppm magnesium, as opposed to 600 ppm citrate or 400 ppm hydroxycitrate. Figure 5 shows that the amount of chondroitin sulfate required to reach the inhibition of J J 0 = 0.2 is 40 ppm. Figure 6 shows that the amount of phytate required to reach the inhibition of J J 0 = 0.2 is 1 ppm. Although small amounts of phytate can significantly reduce the nucleation rate of CaOx, the ingestion of phytate may affect the bioavailability and levels of iron, zinc and calcium in humans [35].
Figure 7 displays the polymorphic forms of CaOx crystals obtained under various conditions for S = 13.65 using SEM. Based on the known morphologies of the different hydrates for CaOx crystals shown in Figure 8 [36], COM is formed without inhibitors (Figure 7a) and in the presence of 1000 ppm magnesium (Figure 7b). Note that, although COM is formed in the presence of 800 ppm citrate (Figure 7c), some crystals do not have the COM morphology, and at least one crystal has the COD morphology. The presence of 500 ppm hydroxycitrate (Figure 7d) can induce the formation of COT, while the presence of 1.5 ppm phytate (Figure 7e) or 20 ppm chondroitin sulfate (Figure 7f) can induce the formation of COD. As COM more easily forms urinary stones than COT or COD, hydroxycitrate, phytate and chondroitin sulfate can be used to inhibit the formation of COM.

4. Conclusions

Three additional components (urea, uric acid and creatinine) within the normal physiological ranges were added to the commonly-used synthetic urine to simulate human urine more closely. The nucleation kinetics of calcium oxalate without inhibitors and in the presence of inhibitors were compared at 37 °C based on CNT using the turbidity induction time data. The results indicated that COM was formed for supersaturation in the range 10.09 to 18.01 without inhibitors and the solid–liquid interfacial energy for the formation of COM is 22.7 m J m 2 based on CNT. The induction times were generally prolonged in the presence of inhibitors, leading to slower nucleation rates. The inhibition of the nucleation rate of calcium oxalate for supersaturation of 13.65 increases in the order magnesium < citrate < hydroxycitrate < chondroitin sulfate < phytate. The influences of these inhibitors on the preferential nucleation of the different hydrates were examined by SEM. The results indicated that COM is formed without inhibitors and in the presence of 1000 ppm magnesium or 800 ppm citrate. The presence of 500 ppm hydroxycitrate can induce the formation of COT, while the presence of 1.5 ppm phytate or 20 ppm chondroitin sulfate can induce the formation of COD. As COM forms urinary stones more easily than COT or COD, hydroxycitrate, chondroitin sulfate and phytate can be used to inhibit the formation of COM.

Supplementary Materials

The following are available online at https://www.mdpi.com/2073-4352/10/4/333/s1, Table S1: The new formula of synthetic urine for in vitro cellular study, adopted by Chutipongtanate and Thongboonkerd [24]. Table S2: The synthetic urine adopted by Robertson and Scurr [21] and Grases et al. [22]. Table S3: The measured induction time data for the synthetic urine without inhibitors at 37 °C. Each condition was carried out three times to obtain the average induction time. Table S4: The measured induction time data for the synthetic urine in the presence of magnesium for S = 13.65 at 37 °C. Each condition was carried out three times to obtain the average induction time. Table S5: The measured induction time data for the synthetic urine in the presence of citrate for S = 13.65 at 37 °C. Each condition was carried out three times to obtain the average induction time. Table S6: The measured induction time data for the synthetic urine in the presence of hydroxycitrate for S = 13.65 at 37 °C. Each condition was carried out three times to obtain the average induction time. Table S7: The measured induction time data for the synthetic urine in the presence of chondroitin sulfate for S = 13.65 at 37 °C. Each condition was carried out three times to obtain the average induction time. Table S8: The measured induction time data for the synthetic urine in the presence of phytate for S = 13.65 at 37 °C. Each condition was carried out three times to obtain the average induction time.

Author Contributions

Conceptualization, L.-D.S.; methodology, L.-D.S.; validation, Y.-C.H.; formal analysis, Y.-C.H. and Y.-H.L.; investigation, Y.-C.H. and Y.-H.L.; data curation, Y.-C.H. and Y.H.L; writing—original draft preparation, L.-D.S.; writing—review and editing, L.-D.S.; All authors have read and agreed to the published version of the manuscript.

Funding

The authors would like to thank Chang Gung Memorial Hospital (CMRPD2G0241) and Ministry of Science and Technology of Taiwan (MOST106-2221-E-182-053) for financial support of this research.

Conflicts of Interest

The authors declare no conflict of interest.

Notation

A J Nucleation kinetic parameter ( m 3 s 1 )
C i Concentration of inhibitor ( m g / L )
J Nucleation rate ( m 3 s 1 )
f N Minimum detectable number density of nuclei ( m 3 )
k B Boltzmann constant ( = 1.38 × 10 23 J K 1 )
M W Molar mass ( k g   m o l 1 )
N A Avogadro number ( = 6.02 × 10 23   m o l 1 )
S Supersaturation ( )
T Temperature ( K )
t i Induction time ( s )
γ Interfacial energy ( J / m 2 )
ρ C Crystal density ( k g / m 3 )
v   Volume of the solu te molecule ( m 3 )

References

  1. Scales, C.D.; Smith, A.C.; Hanley, J.M.; Saigal, C.S. Prevalence of kidney stones in the United States. Eur. Urol. 2012, 62, 160–165. [Google Scholar] [CrossRef] [PubMed] [Green Version]
  2. Nakagawa, Y.; Abram, V.; Coe, F.L. Isolation of calcium oxalate crystal growth inhibitor from rat kidney and urine. Am. J. Physiol. 1984, 247, 765–772. [Google Scholar] [CrossRef] [PubMed]
  3. Ogbuji, L.U.; Batich, C.D. Ultrastructure of whewellite kidney stones: Electron-analytical investigation. J. Ultrastruct Res. 1985, 90, 1–8. [Google Scholar] [CrossRef]
  4. Kaloustian, J.; El-Moselhy, T.F.; Portugal, T.F. Determination of calcium oxalate (mono-and dihydrate) in mixtures with magnesium ammonium phosphate or uric acid: The use of simultaneous thermal analysis in urinary calculi. Clin. Chim. Acta 2003, 334, 117–129. [Google Scholar] [CrossRef]
  5. Opalko, F.J.; Adair, J.H.; Khan, S.R. Heterogeneous nucleation of calcium oxalate trihydrate in artificial urine by constant composition. J. Cryst. Growth 1997, 181, 410–417. [Google Scholar] [CrossRef]
  6. Rabinovich, Y.I.; Esayanur, M.; Daosukho, S.; Byer, K.J.; El-Shall, H.E.; Khan, S.R. Adhesion force between calcium oxalate monohydrate crystal and kidney epithelial cells and possible relevance for kidney stone formation. J. Colloid Interface Sci. 2006, 300, 131–140. [Google Scholar] [CrossRef]
  7. Li, M.K.; Blacklock, N.J.; Garside, J. Effects of magnesium on calcium oxalate crystallization. J. Urol. 1985, 133, 123–125. [Google Scholar] [CrossRef]
  8. Pak, C.Y. Citrate and renal calculi: New insights and future directions. Am. J. Kidney Dis. 1991, 17, 420–425. [Google Scholar] [CrossRef]
  9. Grases, F.; Isern, B.; Sanchis, P.; Perello, J.; Torres, J.J.; Costa-Bauza, A. Phytate acts as an inhibitor in formation of renal calculi. Front Biosci. 2007, 12, 2580–2587. [Google Scholar] [CrossRef]
  10. Chung, J.; Granja, I.; Taylor, M.G.; Mpourmpakis, G.; Asplin, J.R.; Rimer, J.D. Molecular modifiers reveal a mechanism of pathological crystal growth inhibition. Nature. 2016, 536, 446–450. [Google Scholar] [CrossRef]
  11. Rodgers, A.L.; Jackson, G.E. Determination of thermodynamic parameters for complexation of calcium and magnesium with chondroitin sulfate isomers using isothermal titration calorimetry: Implications for calcium kidney-stone research. J. Cryst. Growth 2017, 463, 14–18. [Google Scholar] [CrossRef]
  12. Kim, D.; Rimer, J.D.; Asplin, J.R. Hydroxycitrate: A potential new therapy for calcium urolithiasis. Urolithiasis 2019, 47, 311–320. [Google Scholar] [CrossRef] [PubMed]
  13. Ito, H.; Coe, F.L. Acidic peptide and polyribonucleotide crystal growth inhibitors in human urine. Am. J. Physiol. 1977, 233, 455–463. [Google Scholar] [CrossRef] [PubMed]
  14. Drach, G.W.; Randolph, A.D.; Miller, J.D. Inhibition of calcium oxalate dihydrate crystallization by chemical modifiers. I. Pyrophosphate and methylene blue. J. Urol. 1978, 119, 99–103. [Google Scholar] [CrossRef]
  15. Hallson, P.C.; Rose, G.A. Uromucoids and urinary stone formation. Lancet 1979, 1, 1000–1002. [Google Scholar] [CrossRef]
  16. Randolph, A.D.; Drach, G.W. Some measurements of calcium oxalate nucleation and growth rates in urine-like liquors. J. Cryst. Growth 1981, 53, 195–201. [Google Scholar] [CrossRef]
  17. Robertson, W.G.; Scurr, D.S. Factors influencing the crystallization of calcium oxalate-a critique. J. Cryst. Growth 1981, 53, 182–194. [Google Scholar] [CrossRef]
  18. Ryall, R.L.; Harnett, R.M.; Marshall, V.R. The effect of urine, pyrophosphate, citrate, magnesium and glycosaminoglycans on the growth and aggregation of calcium oxalate crystals in vitro. Clin. Chim. Acta 1981, 112, 349–356. [Google Scholar] [CrossRef]
  19. Nakagawa, Y.; Abram, V.; Kezdy, F.J.; Kaiser, E.T.; Coe, F.L. Purification and characterization of the principal inhibitor of calcium oxalate crystal growth in human urine. J. Biol. Chem. 1983, 258, 12594–12600. [Google Scholar]
  20. Robertson, W.G.; Scurr, D.S.; Sergeant, V.J. Ionic and macromolecular modifiers of crystallization of calcium salts in urine. Fortschr. Urol. Nephrol. 1985, 23, 1–11. [Google Scholar]
  21. Robertson, W.G.; Scurr, D.S. Modifiers of calcium oxalate crystallization found in urine. I. Studies with a continuous crystallizer using an artificial urine. J. Urol. 1986, 86, 1322–1326. [Google Scholar] [CrossRef]
  22. Grases, F.; Rodriguez, A.; Costa-Bauza, A. Efficacy of mixtures of magnesium, citrate and phytate as calcium oxalate crystallization inhibitors in urine. J. Urol. 2015, 194, 812–819. [Google Scholar] [CrossRef]
  23. Mullin, J.W. Crystallization; Butterworth-Heinemann: Oxford, UK, 1993. [Google Scholar]
  24. Chutipongtanate, S.; Thongboonkerd, V. Systematic comparisons of artificial urine formulas for in vitro cellular study. Anal. Biochem. 2010, 402, 110–112. [Google Scholar] [CrossRef]
  25. Finlayson, B. Calcium stones: Some physical and clinical aspects, Chapter 10. In Calcium Metabolism in Renal Failure and Nephrolithiasis; David, D.S., Ed.; John Wiley & Sons: New York, NY, USA, 1977. [Google Scholar]
  26. Kubota, N. A new interpretation of metastable zone widths measured for unseeded solutions. J. Cryst. Growth 2008, 310, 629–634. [Google Scholar] [CrossRef]
  27. Kobari, M.; Kubota, N.; Hirasawa, I. Deducing primary nucleation parameters from metastable zone width and induction time data determined with simulation. CrystEngComm 2013, 15, 1199–1209. [Google Scholar] [CrossRef]
  28. Shiau, L.D.; Lu, T.S. A model for determination of the interfacial energy from the induction time or metastable zone width data based on turbidity measurements. CrystEngComm 2014, 16, 9743–9752. [Google Scholar] [CrossRef]
  29. Shiau, L.D. Comparison of the interfacial energy and pre-exponential factor calculated from the induction time and metastable zone width data based on classical nucleation theory. J. Cryst. Growth 2016, 450, 50–55. [Google Scholar] [CrossRef]
  30. Shiau, L.D. Determination of the nucleation and growth kinetics of aqueous L-glycine solutions from the turbidity induction time data. Crystals 2018, 8, 403. [Google Scholar] [CrossRef] [Green Version]
  31. Mersmann, A.; Bartosch, K. How to predict the metastable zone width. J. Cryst. Growth 1998, 183, 240–250. [Google Scholar] [CrossRef]
  32. Lindenberg, C.; Mazzotti, M. Effect of temperature on the nucleation kinetics of α L-glutamic acid. J. Cryst. Growth 2009, 311, 1178–1184. [Google Scholar] [CrossRef]
  33. Antinozzi, P.A.; Brown, C.M.; Purich, D.L. Calcium oxalate monohydrate crystallization: Citrate inhibition of nucleation and growth steps. J. Cryst. Growth 1992, 125, 215–222. [Google Scholar] [CrossRef]
  34. Brown, C.M.; Ackermann, D.K.; Purich, D.L.; Finlayson, B. Nucleation of calcium oxalate monohydrate: Use of turbidity measurements and computer-assisted simulations in characterizing early events in crystal formation. J. Cryst. Growth 1991, 108, 455–464. [Google Scholar] [CrossRef]
  35. Schlemmer, U.; Frolich, W.; Prieto, R.M.; Grases, F. Phytate in foods and significance for humans: Food sources, intake, processing, bioavailability, protective role and analysis. Mol. Nutr. Food Res. Suppl. 2009, 53, S330–S375. [Google Scholar] [CrossRef] [PubMed]
  36. Yu, H.; Sheikholeslami, R.; Doherty, W.O.S. The effects of silica and sugar on the crystallographic and morphological properties of calcium oxalate. J. Cryst. Growth 2004, 265, 592–603. [Google Scholar] [CrossRef]
Figure 1. Schematic diagram of the experimental apparatus: (1) 250 mL crystallizer; (2) magnetic stirrer; (3) constant temperature water bath; (4) turbidity probe; (5) temperature probe; (6) computer.
Crystals 10 00333 g001
Figure 2. The increase of J J 0 with increasing S for calcium oxalate without inhibitors at 37 °C. The solid line is a visual guide.
Crystals 10 00333 g002
Figure 3. The induction time data of calcium oxalate at 37 °C fitted to Equation (4).
Crystals 10 00333 g003
Figure 4. The decrease of J J 0 with increasing inhibitor concentration for the solutions in the presence of magnesium, citrate and hydroxycitrate for S = 13.65 at 37 °C. Solid lines are visual guides.
Crystals 10 00333 g004
Figure 5. The decrease of J J 0 with increasing inhibitor concentration for the solutions in the presence of chondroitin sulfate for S = 13.65 at 37 °C. The solid line is a visual guide.
Crystals 10 00333 g005
Figure 6. The decrease of J J 0 with increasing inhibitor concentration for the solutions in the presence of phytate for S = 13.65 at 37 °C. The solid line is a visual guide.
Crystals 10 00333 g006
Figure 7. The polymorphic forms of calcium oxalate crystals obtained under various conditions using scanning electron microscopy (SEM): (a) monoclinic monohydrate (COM) without inhibitors; (b) COM in the presence of 1000 ppm magnesium; (c) COM in the presence of 800 ppm citrate; (d) triclinic trihydrate (COT) in the presence of 500 ppm hydroxycitrate; (e) tetragonal dipyramidal dihydrate (COD) in the presence of 1.5 ppm phytate; (f) COD in the presence of 20 ppm chondroitin sulfate.
Crystals 10 00333 g007aCrystals 10 00333 g007b
Figure 8. The morphologies of the different hydrates for CaOx crystals: (a) monoclinic prismatic monohydrate (COM); (b) tetragonal dipyramidal dihydrate (COD); (c) triclinic trihydrate (COT) [36].
Crystals 10 00333 g008
Table 1. The initial concentrations of all the components in solution 1, solution 2 and solution 3, respectively, before mixing for the synthetic urine adopted in this study.
CompositionConcentration (mM)
Solution 1 (100 mL):
Na2SO4·10H2O9.67
NH4Cl43.37
KCl81.30
CaCl25.00
Solution 2 (100 mL):
NaH2PO4·2H2O7.73
Na2HPO4·12H2O7.82
NaCl111.54
Urea200
Uric acid1.00
Creatinine4.00
Solution 3 (3 mL):
Na2C2O425.6, 32.4, 40.0, 57.6
Table 2. The final concentrations of all the components at the point of mixing for the synthetic urine adopted in this study.
CompositionConcentration (mM)
Na2SO4·10H2O4.76
NH4Cl21.36
KCl40.05
CaCl22.46
NaH2PO4·2H2O3.81
Na2HPO4·12H2O3.85
NaCl54.95
Urea98.52
Uric acid0.49
Creatinine1.97
Na2C2O40.38, 0.48, 0.59, 0.85

