Article

Effect of Zirconia Polymorph on Vapor-Phase Ketonization of Propionic Acid

Collaborative Innovation Center of Chemical Science and Engineering, School of Chemical Engineering and Technology, Tianjin University, Tianjin 300072, China
*
Author to whom correspondence should be addressed.
Catalysts 2019, 9(9), 768; https://doi.org/10.3390/catal9090768
Submission received: 26 August 2019 / Revised: 11 September 2019 / Accepted: 11 September 2019 / Published: 13 September 2019
(This article belongs to the Section Biomass Catalysis)

Abstract

:
Vapor-phase ketonization of propionic acid derived from biomass was studied at 300–375 °C over ZrO2 with different zirconia polymorph. The tetragonal ZrO2 (t-ZrO2) are more active than monoclinic ZrO2 (m-ZrO2). The results of characterizations from X-ray diffraction (XRD) and Raman suggest m-ZrO2 and t-ZrO2 are synthesized by the solvothermal method. NH3 and CO2 temperature-programmed desorption (NH3-TPD and CO2-TPD) measurements show that there were more medium-strength Lewis acid base sites with lower coordination exposed on m-ZrO2 relative to t-ZrO2, increasing the adsorption strength of propionic acid. The in situ DRIFTS (Diffuse reflectance infrared Fourier transform spectroscopy) of adsorbed propionic acid under ketonization reaction reveal that as the most abundant surface intermediates, the monodentate propionates are more active than bidentate propionates. In comparison with m-ZrO2, the t-ZrO2 surface favors monodentate adsorption over bidentate adsorption. Additionally, the adsorption strength of monodentate propionate is weaker on t-ZrO2. These differences in adsorption configuration and adsorption strength of propionic acid are affected by the zirconia structure. The higher surface concentration and weaker adsorption strength of monodentate propionates contribute to the higher ketonization rate in the steady state.

Graphical Abstract

1. Introduction

The depletion of fossil fuels and the increase in environmental issues are leading researchers to search for alternative energy sources [1,2,3]. Thus, investigations of biomass have been widely carried out. Biomass can be easily converted to bio-oil via fast pyrolysis [1,4]. Carboxylic acid constitutes an important component of bio-oil, which possesses acidity and instability. Therefore, during the upgrading of bio-oil, the efficient conversion of carboxylic acid is an important step in reducing corrosiveness and enhance stability. In comparison to other reactions of carboxylic acid [5,6], their ketonization is an attractive one due to there being no H2 consumption. This leads to two carboxylic acid molecules achieving C–C coupling, dehydration and decarboxylation, forming ketone, water and CO2. In addition, the product of ketone, possessing higher energy content, can be further converted into longer chain hydrocarbons via aldol condensation [7,8].
The ketonization reaction can be performed on two types of catalysts, metal oxide [9,10,11,12,13,14] and zeolite [15,16], in the vapor phase and aqueous phase. The amphoteric metal oxides show higher catalytic activity, such as MnO2, TiO2, ZrO2, CeO2, etc. [12,17,18,19,20,21,22]. The reaction activity of carboxylic acid ketonization is strongly influenced by the surface structure of metal oxides [23,24,25,26,27]. Kim et al. performed carboxylic acid reaction on the TiO2 single-crystal surface [23]. The carboxylic acid was converted to produce ketene through unimolecular dehydration on the (011) surface and to form ketone via bimolecular reaction on the (114) surface. They attributed this difference of products to the different coordination of Ti4+ cations exposed on the surface. Stubenrauch et al. studied the reaction of formic acid and acetic acid on CeO2 (111) and (100) surface [24]. On both surfaces, CH2CO was produced through acetic acid dehydration near 600 K. However, acetone was detected only on the (111) surface during acetic acid decomposition at 600 K. This result is different from that obtained by Kim et al., since Ce4+ cations of (111) surface possess one vacancy relative to the Ce4+ cations in the bulk. Wang et al. carried out ketonization of carboxylic acid on anatase and rutile TiO2, monoclinic and tetragonal ZrO2 at 503–533 K [25,26]. They showed that the reaction activity of acetic acid was higher over anatase TiO2 than that over rutile TiO2, and attributed that to the more reactive monodentate acetate present on anatase TiO2, whereas unreactive bidentate acetate was present on rutile TiO2. The effect of different nanocrystals (nanocubes, nanorods and nanopolyhedra) of CeO2 on acetic acid ketonization was studied by Snell et al. at 503 K in the condensed phase and at 623 K in the vapor phase [27]. They found that the crystal of CeO2 was disrupted in the condensed phase with the formation of metal carboxylate, whereas the bulk structure was maintained during the vapor phase reaction. They suggested that the morphology of CeO2 did not have a critical influence on the reaction activity in the condensed and vapor phase. Although some work has been done on the influence of the structure, no consensus has been reached. This may be due to the different reaction conditions (condensed phase and vapor phase) via the different reaction mechanisms or different metal oxides used.
As the higher activity catalyst in the ketonization of carboxylic acid, ZrO2 and the modified ZrO2 catalysts have been studied using experimental measurements and density functional theory calculations (DFT) [28,29,30,31,32,33,34,35]. Wu et al. performed acetic acid ketonizaion over carbon promoted ZrO2 catalysts and on the Zr/Mn mixed oxides at 340 °C in the aqueous-phase ketonization [28,29]. They found that carbon promoted ZrO2 with tetragonal phase was more active than that possessing monoclinic phase, and the different carbon species and carbon content resulted in different stability. They suggested that carbonization degree leading to the crystal phase transformation between tetragonal ZrO2 (t-ZrO2) and monoclinic ZrO2 (m-ZrO2), and the interaction strength between carbons species and ZrO2 both influenced the reactivity. During the study of acetic acid ketonization on the Zr/Mn mixed oxides, they suggested that the incorporation of Mn resulted in monoclinic phase disappearing and acidity improved accompanying the formation of t-ZrO2/MnOx solid solution, which increased ketonization activity. Lopez-Ruiz et al. reported that the catalytic activity and stability of LaxZryOz were enhanced relative to ZrO2 for acetic acid ketonization at 568 K in the aqueous condensed phase [30]. Under the condensed-phase hydrothermal reaction conditions, ZrO2 and LaxZryOz catalysts could be restructured. ZrO2 possessed a mixed phase, with monoclinic and tetragonal; whereas LaxZryOz displayed a tetragonal phase. This indicated that the improvement of stability was caused by the phase transformation, and the higher activity was due to the greater acetic acid surface concentration.
The study of carboxylic acid ketonization over ZrO2 and the modified ZrO2 catalysts was also performed in the vapor phase [26,31,34,36,37]. Parida et al. studied acetic acid ketonization over alkali-metal cations promoted ZrO2 at 623–698 K [31]. They reported that Na was the most effective promoter, probably due to the crystal phase conversion from m-ZrO2 to t-ZrO2 through adding Na. Shutilov et al. reported that 10 wt% CeO2 supported on ZrO2 showed the highest activity of pentanoic acid ketonization at 355 °C among 5–20 wt% CeO2/ ZrO2 [36]. The modification by CeO2 led to the formation of Ce-Zr solid solution based on t-ZrO2. They proposed that all acid sites and lattice oxygen atoms played a role in the reaction. Recently, we investigated propionic acid ketonization on CexZr1–xO2 mixed oxides at 270–350 °C through adjusting the Ce/Zr molar ratios [37]. The results showed that the reaction rate reached maximum at a medium-strength acid-base ratio of ~1.07 on Ce0.1Zr0.9O2 with tetragonal phase, suggesting that the balanced medium-strength acid-base sites was an important factor in the ketonization.
Analysis of the above studies indicates that ZrO2 (and the modified ZrO2) based on the tetragonal phase is more active than that with the monoclinic phase during carboxylic acid ketonization. However, the structure-activity relationship for ZrO2 is unclear. Hence, in this work, the effect of zirconia polymorph on propionic acid ketonization in the vapor phase has been studied. Monoclinic and tetragonal zirconia were prepared by solvothermal method using water and methanol as solvents, respectively, and tested for ketonization of propionic acid at 300–375 °C. A series of characterizations demonstrated that two zirconia morphologies were formed. The greater number of medium-strength Lewis acid-base sites with lower coordination exposed on the m-ZrO2 surface are in contrast with the values obtained for t-ZrO2. The in situ DRIFTS showed that the monodentate propionates are much more active than the bidentate propionates during ketonization. In comparison with m-ZrO2, t-ZrO2 favored monodentate adsorption over bidentate adsorption, and weakened adsorption strength of monodentate propionates, which led to the ketonization rate of propionic acid enhanced on t-ZrO2.

2. Results and Discussion

2.1. Catalyst Characterizations

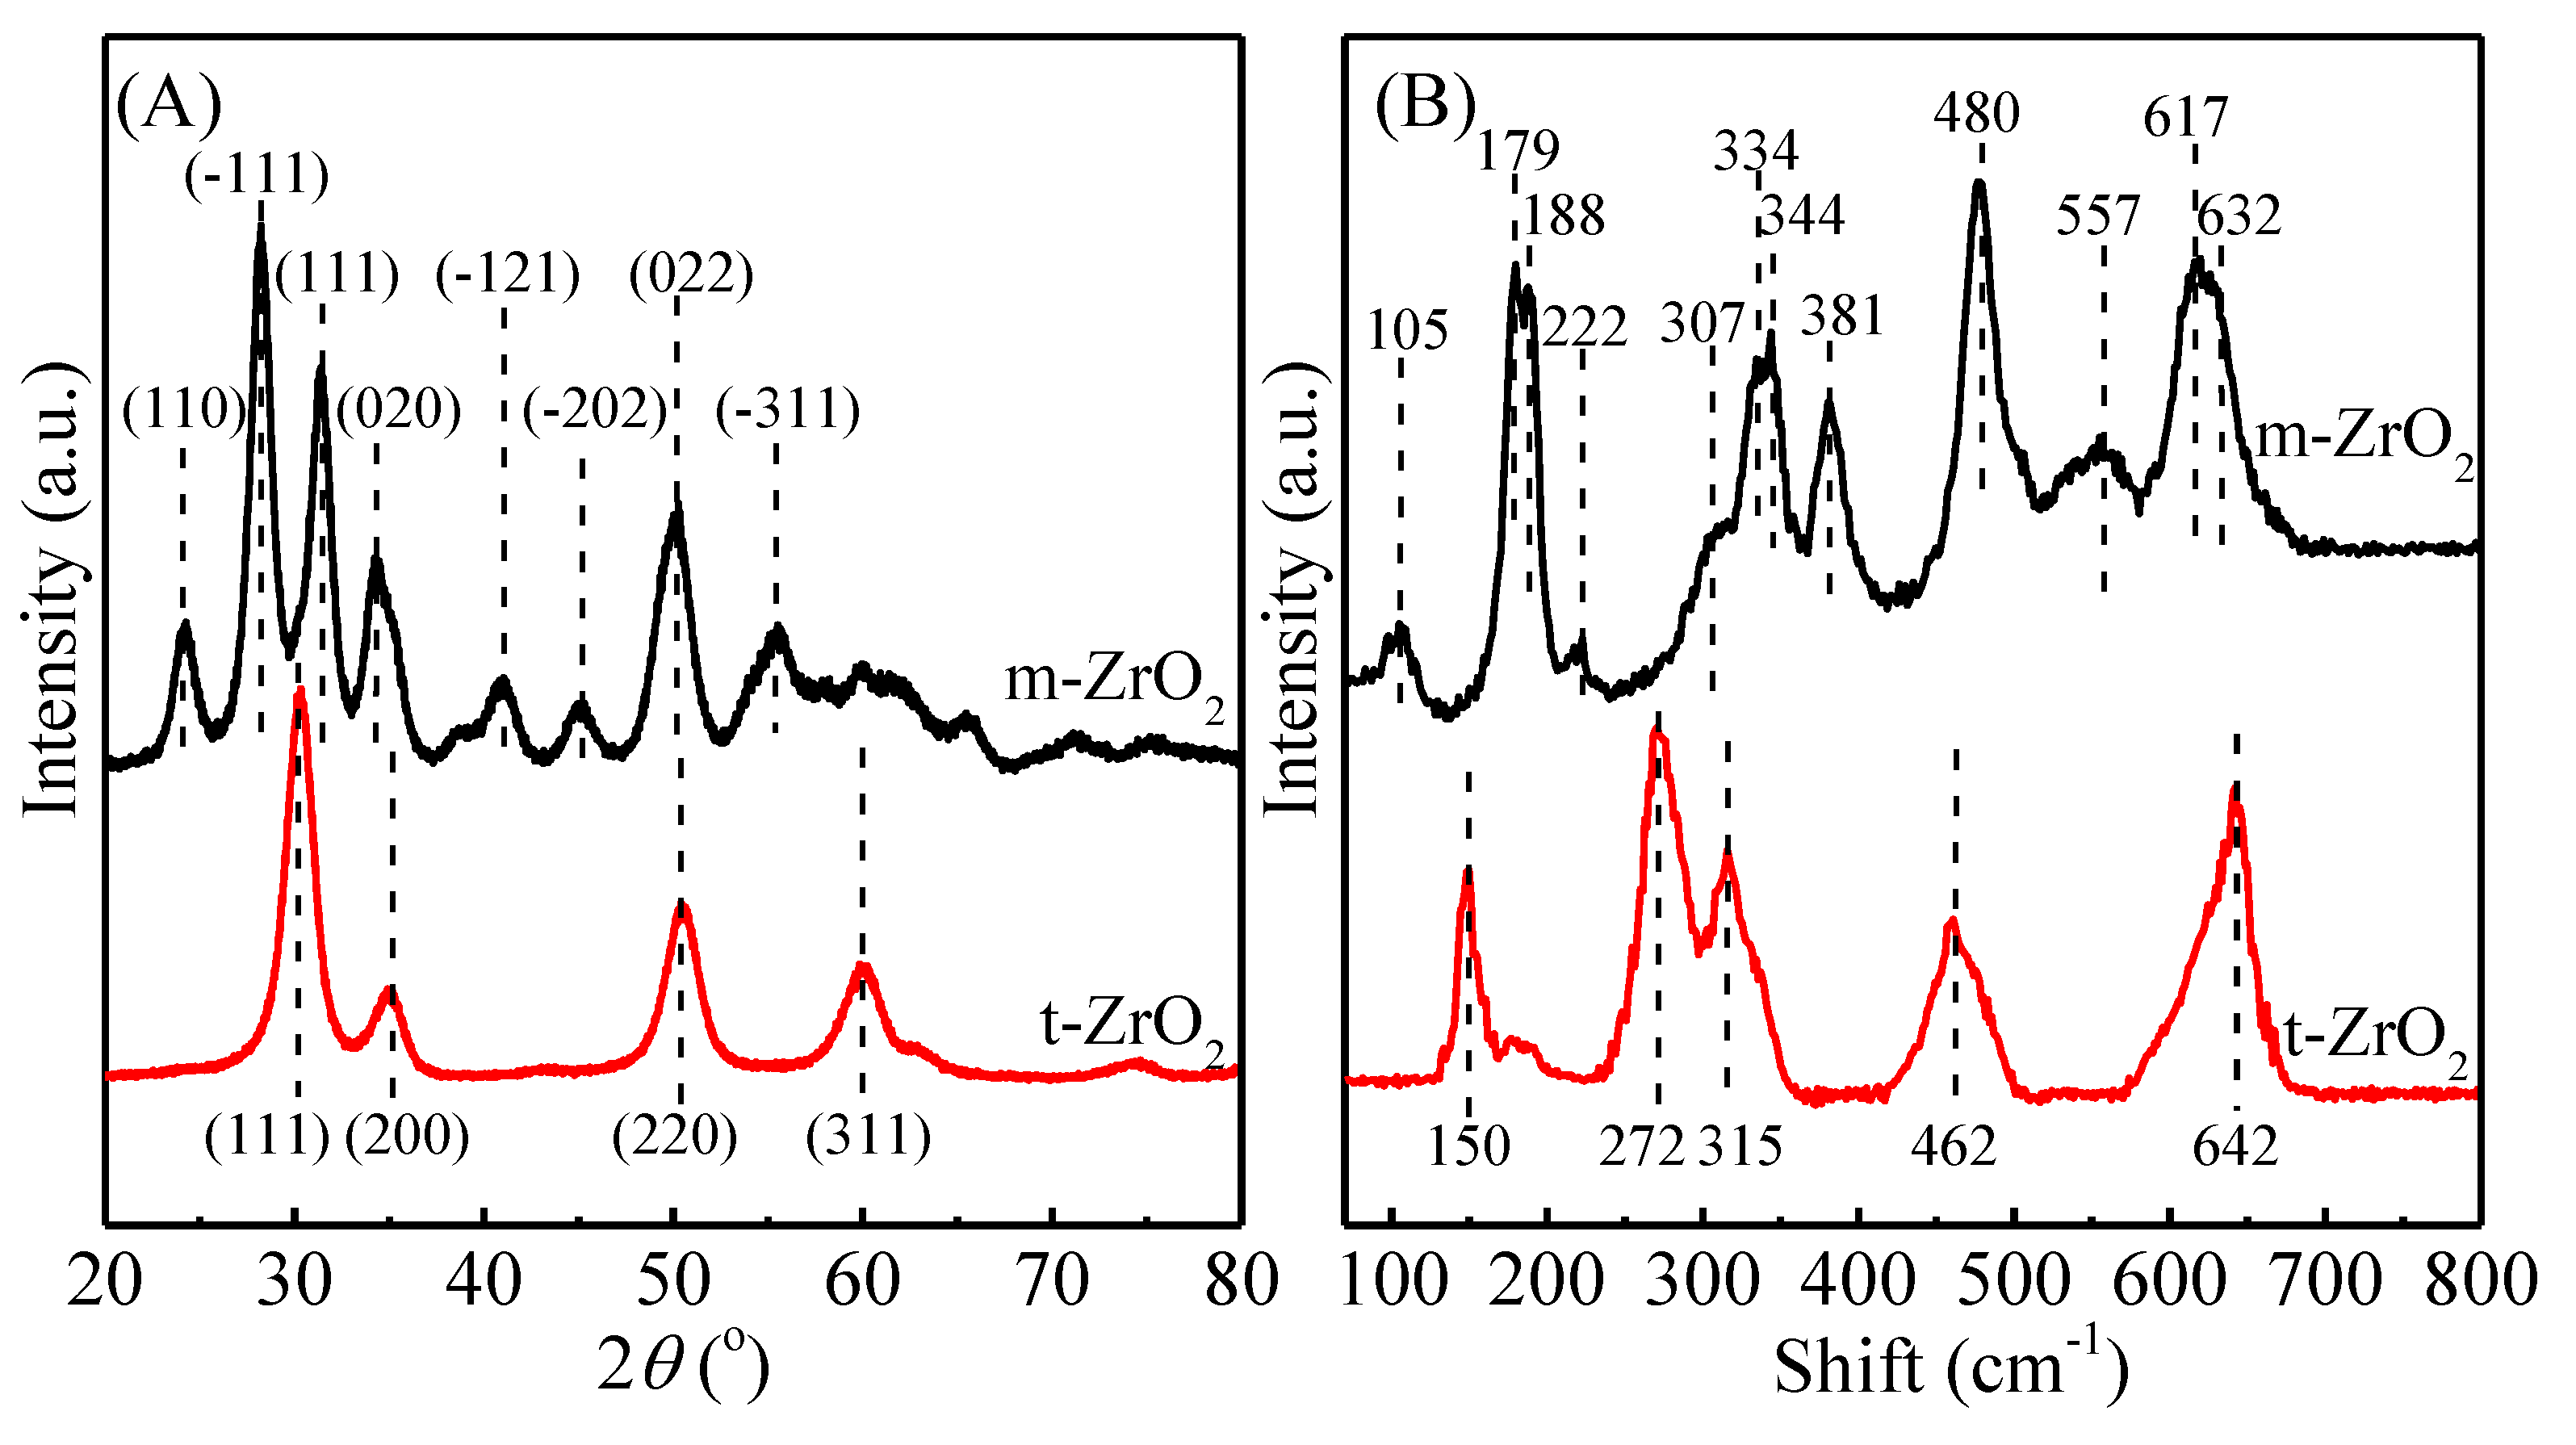
2.1.1. Structure Identification

The XRD patterns of ZrO2 are shown in Figure 1A. The main peaks at 24.2, 28.2, 31.4, 40.8, 45.0, 50.0 and 55.6° are assigned to the monoclinic phase of ZrO2 (m-ZrO2, JCPDS cards no. 37-1484) [38,39]. While the four peaks at 30.2, 35.2, 50.4 and 60.0° belong to the tetragonal phase of ZrO2 (t-ZrO2, JCPDS cards no. 17-0923). The crystallite size and lattice distance were both measured by XRD, listed in Table 1. The calculation results using the Scherrer equation show that the crystallite size of m-ZrO2 is 9.5 nm, which is larger than that of t-ZrO2 (8.4 nm). The lattice distance is 0.3164 nm and 0.2987 nm, corresponding to the (-111) plane of m-ZrO2 and the (111) plane of t-ZrO2, respectively. Considering the similar diffractograms between the tetragonal and cubic zirconia phases (t-ZrO2 or c-ZrO2), the Raman spectra of ZrO2 were performed to distinguish their structures, as shown in Figure 1B. The Raman spectra of ZrO2 shows vibration bands at 105, 179, 188, 222, 307, 334, 344, 381, 480, 557, 617, and 632 cm−1, which are assigned to the m-ZrO2 [39,40]. Meanwhile, the vibration bands at 150, 272, 315, 462 and 642 cm−1 belong to t-ZrO2 [39,40]. The XRD and Raman characterizations both confirm that m-ZrO2 and t-ZrO2 have been synthesized using solvothermal method. In addition, the polymorph of two catalysts presented no changes after propionic acid ketonization at 350 °C for 1 h (Figure S1). The BET surface area and pore volume of ZrO2 were measured by the N2 adsorption-desorption. As shown in Figure S2, the N2 sorption isotherms correspond to the type IV, suggesting the stacking of crystallites results in the formation of mesoporous. The surface area of m-ZrO2 (103 m2/g) is smaller than that of t-ZrO2 (127 m2/g), which is consistent with the larger crystallite size of m-ZrO2.

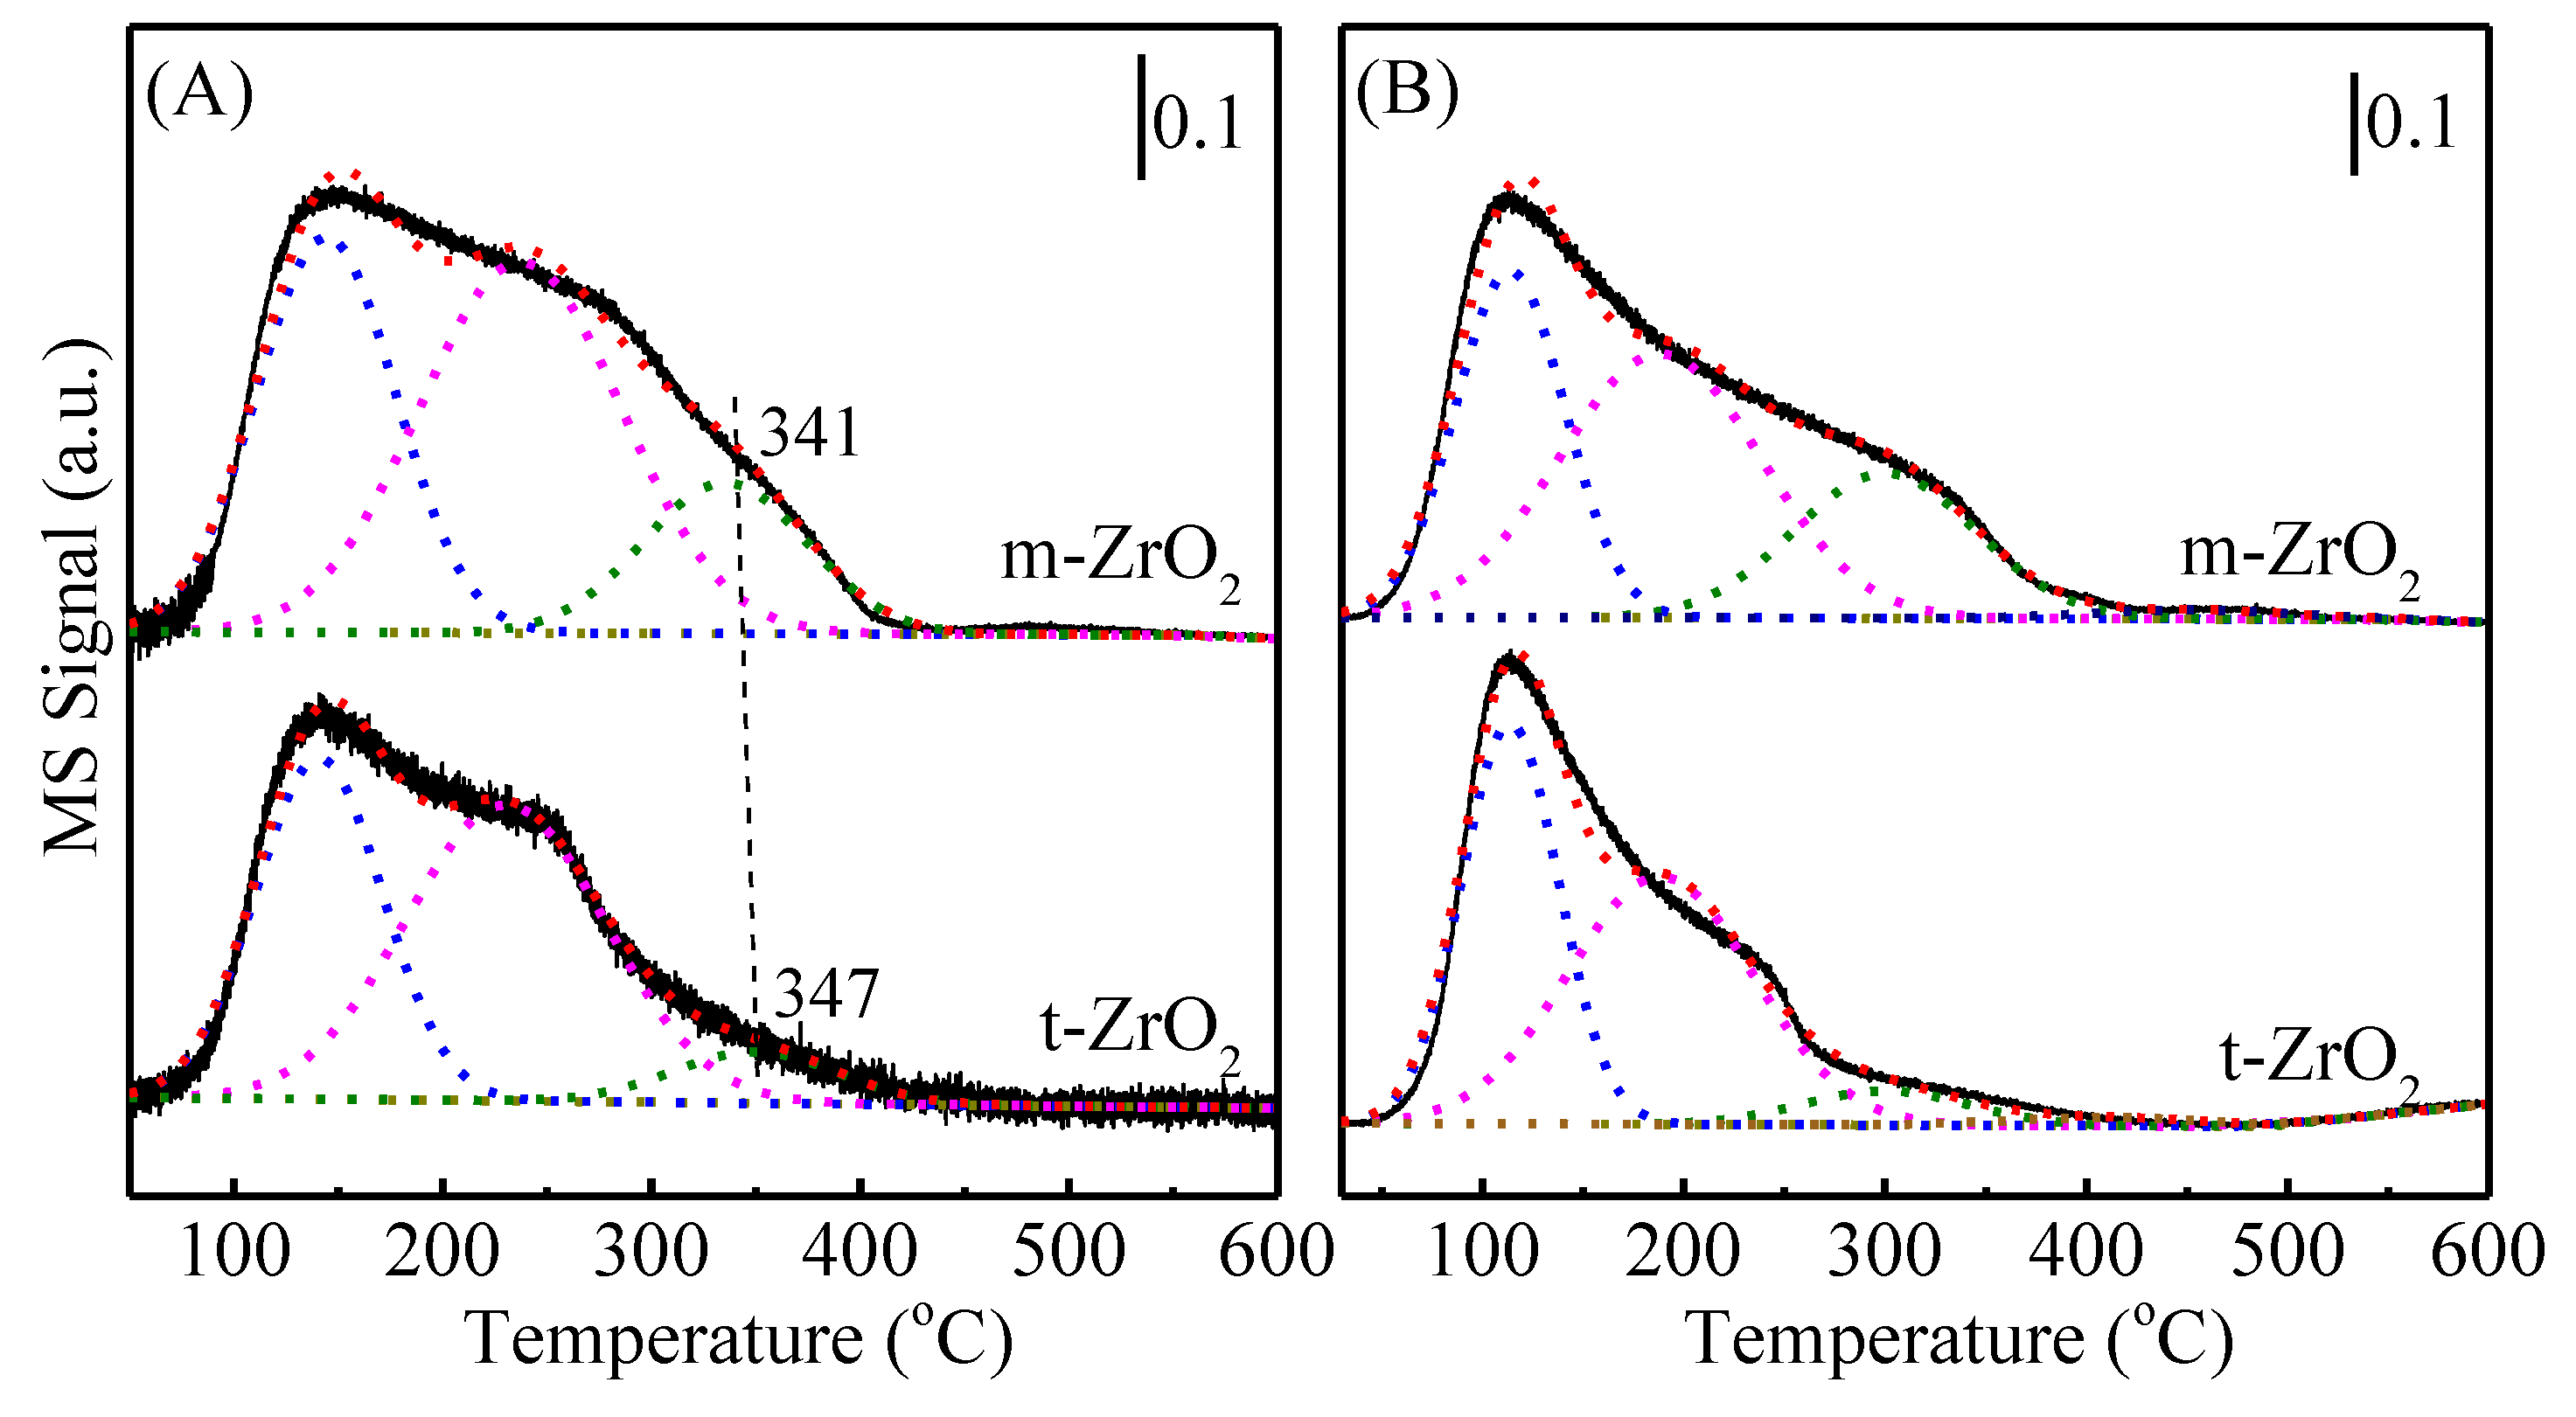
2.1.2. Surface Properties

The surface chemistry properties were investigated by XPS analysis. Figure 2 shows the XPS spectra of Zr 3d and O 1s regions of ZrO2. The Zr 3d spectra exhibit two peaks of Zr 3d3/2 and 3d5/2 [30,41]. For t-ZrO2, the binding energy at Zr 3d3/2 and 3d5/2 are 184.18 and 181.74 eV, respectively, which both shift slightly to the higher binding energy by 0.14 eV compared to that of m-ZrO2. This result indicates that the electrons become deficient on t-ZrO2. The O 1s spectra were fitted by two peaks. The lower binding energy at ~529.9 eV is ascribed to the lattice oxygen (O-I), whereas the higher binding energy at ~531.9 eV is attributed to the oxygen ions with lower coordination or hydroxyl-like groups (O-II) [41,42]. The area ratios of O-II and O-I are similar, and are 0.16 on m-ZrO2 and 0.18 on t-ZrO2.
The surface acidity and basicity of ZrO2 were characterized using DRIFTS of pyridine adsorption, temperature-programmed desorption of NH3 and CO2 (NH3-TPD and CO2-TPD). Figure S3 displays that the DRIFTS of pyridine adsorption on m-ZrO2 is similar to that on t-ZrO2. The bands at 1604 1575, 1487, and 1442 cm−1 are assigned to the pyridine adsorbed on the coordinatively unsaturated Zr4+ cations (Lewis acid sites), the band at 1592 cm−1 is attributed to the pyridine adsorbed on the hydrogen of hydroxyl group [43,44]. It should be noted that the bands corresponding to the Brønsted acid sites are not observed on the surface of ZrO2. Thus, the results of DRIFTS of pyridine adsorption imply there are only Lewis acid sites present on the surface of m-ZrO2 and t-ZrO2.
NH3-TPD was performed to further investigate the acidity of ZrO2, displayed in Figure 3A. In addition, the densities of acid sites were calculated and listed in Table 2. The acidity of Lewis acid sites is dependent on their coordination. According to the broad and asymmetric features of NH3-TPD profiles, the profiles were fitted into three peaks. In accordance with previous studies [39,45], the centers of desorption peak adsorbed on the weak acid site, the medium strength acid site and the strong acid site are below 200 °C, between 200 and 400 °C, and above 400 °C, respectively. The densities of weak acid sites are same on the two ZrO2 catalysts. There are no strong acid sites present on the two catalysts surface. The third desorption peak shifts slightly from 341 °C on m-ZrO2 to 347 °C on t-ZrO2, which corresponds to the adsorption on the lower coordination Zr4+ cations assigned to the medium strength acid site. This implies that the acid strength of the medium strength acid site increases slightly on t-ZrO2, which is consistent with the change of binding energies of Zr 3d. However, the intensity of that peak on t-ZrO2 is much lower than that on m-ZrO2, suggesting the more Zr4+ cations with lower coordination existence on m-ZrO2.
CO2-TPD was used to probe the basicity of ZrO2. The profiles of CO2 desorption and densities of base sites calculated are shown in Figure 3B and Table 2. For metal oxides, the coordinatively unsaturated oxygen ions act as base sites, whose basicity is also related to the coordination [26]. The profiles were divided into three regions according to the desorption temperature. The desorption peak (<200 °C) is assigned to CO2 adsorption on the weak base site (surface -OH group) with the formation of bicarbonate, the desorption peak (200 ~ 400 °C) is attributed to CO2 adsorption on the medium-strength base site (Mx+-O2− pair) along with the formation of bidentate carbonate, and the desorption peak (>400 °C) is ascribed to CO2 adsorption on the strong base site (low-coordination O2−) accompanying the formation of unidentate or polydentate carbonate [34,45]. Few strong base sites are present on the catalysts, 0.02 μmol/m2 on m-ZrO2 and 0.03 μmol/m2 on t-ZrO2. In contrast with t-ZrO2, on the surface of m-ZrO2, the concentration of weak base sites is smaller, but the amount of medium-strength base sites is higher. This result indicates that a greater number of low-coordination O2− ions of Mx+-O2− pairs is exposed on the m-ZrO2 surface. NH3-TPD and CO2-TPD suggest that there are more medium-strength Lewis acid base sites with lower coordination exposed on m-ZrO2 than on t-ZrO2, which is related to the different structures of m-ZrO2 and t-ZrO2. In addition, those sites possess stronger acid-base properties, and thus strengthen propionic acid adsorption [26].

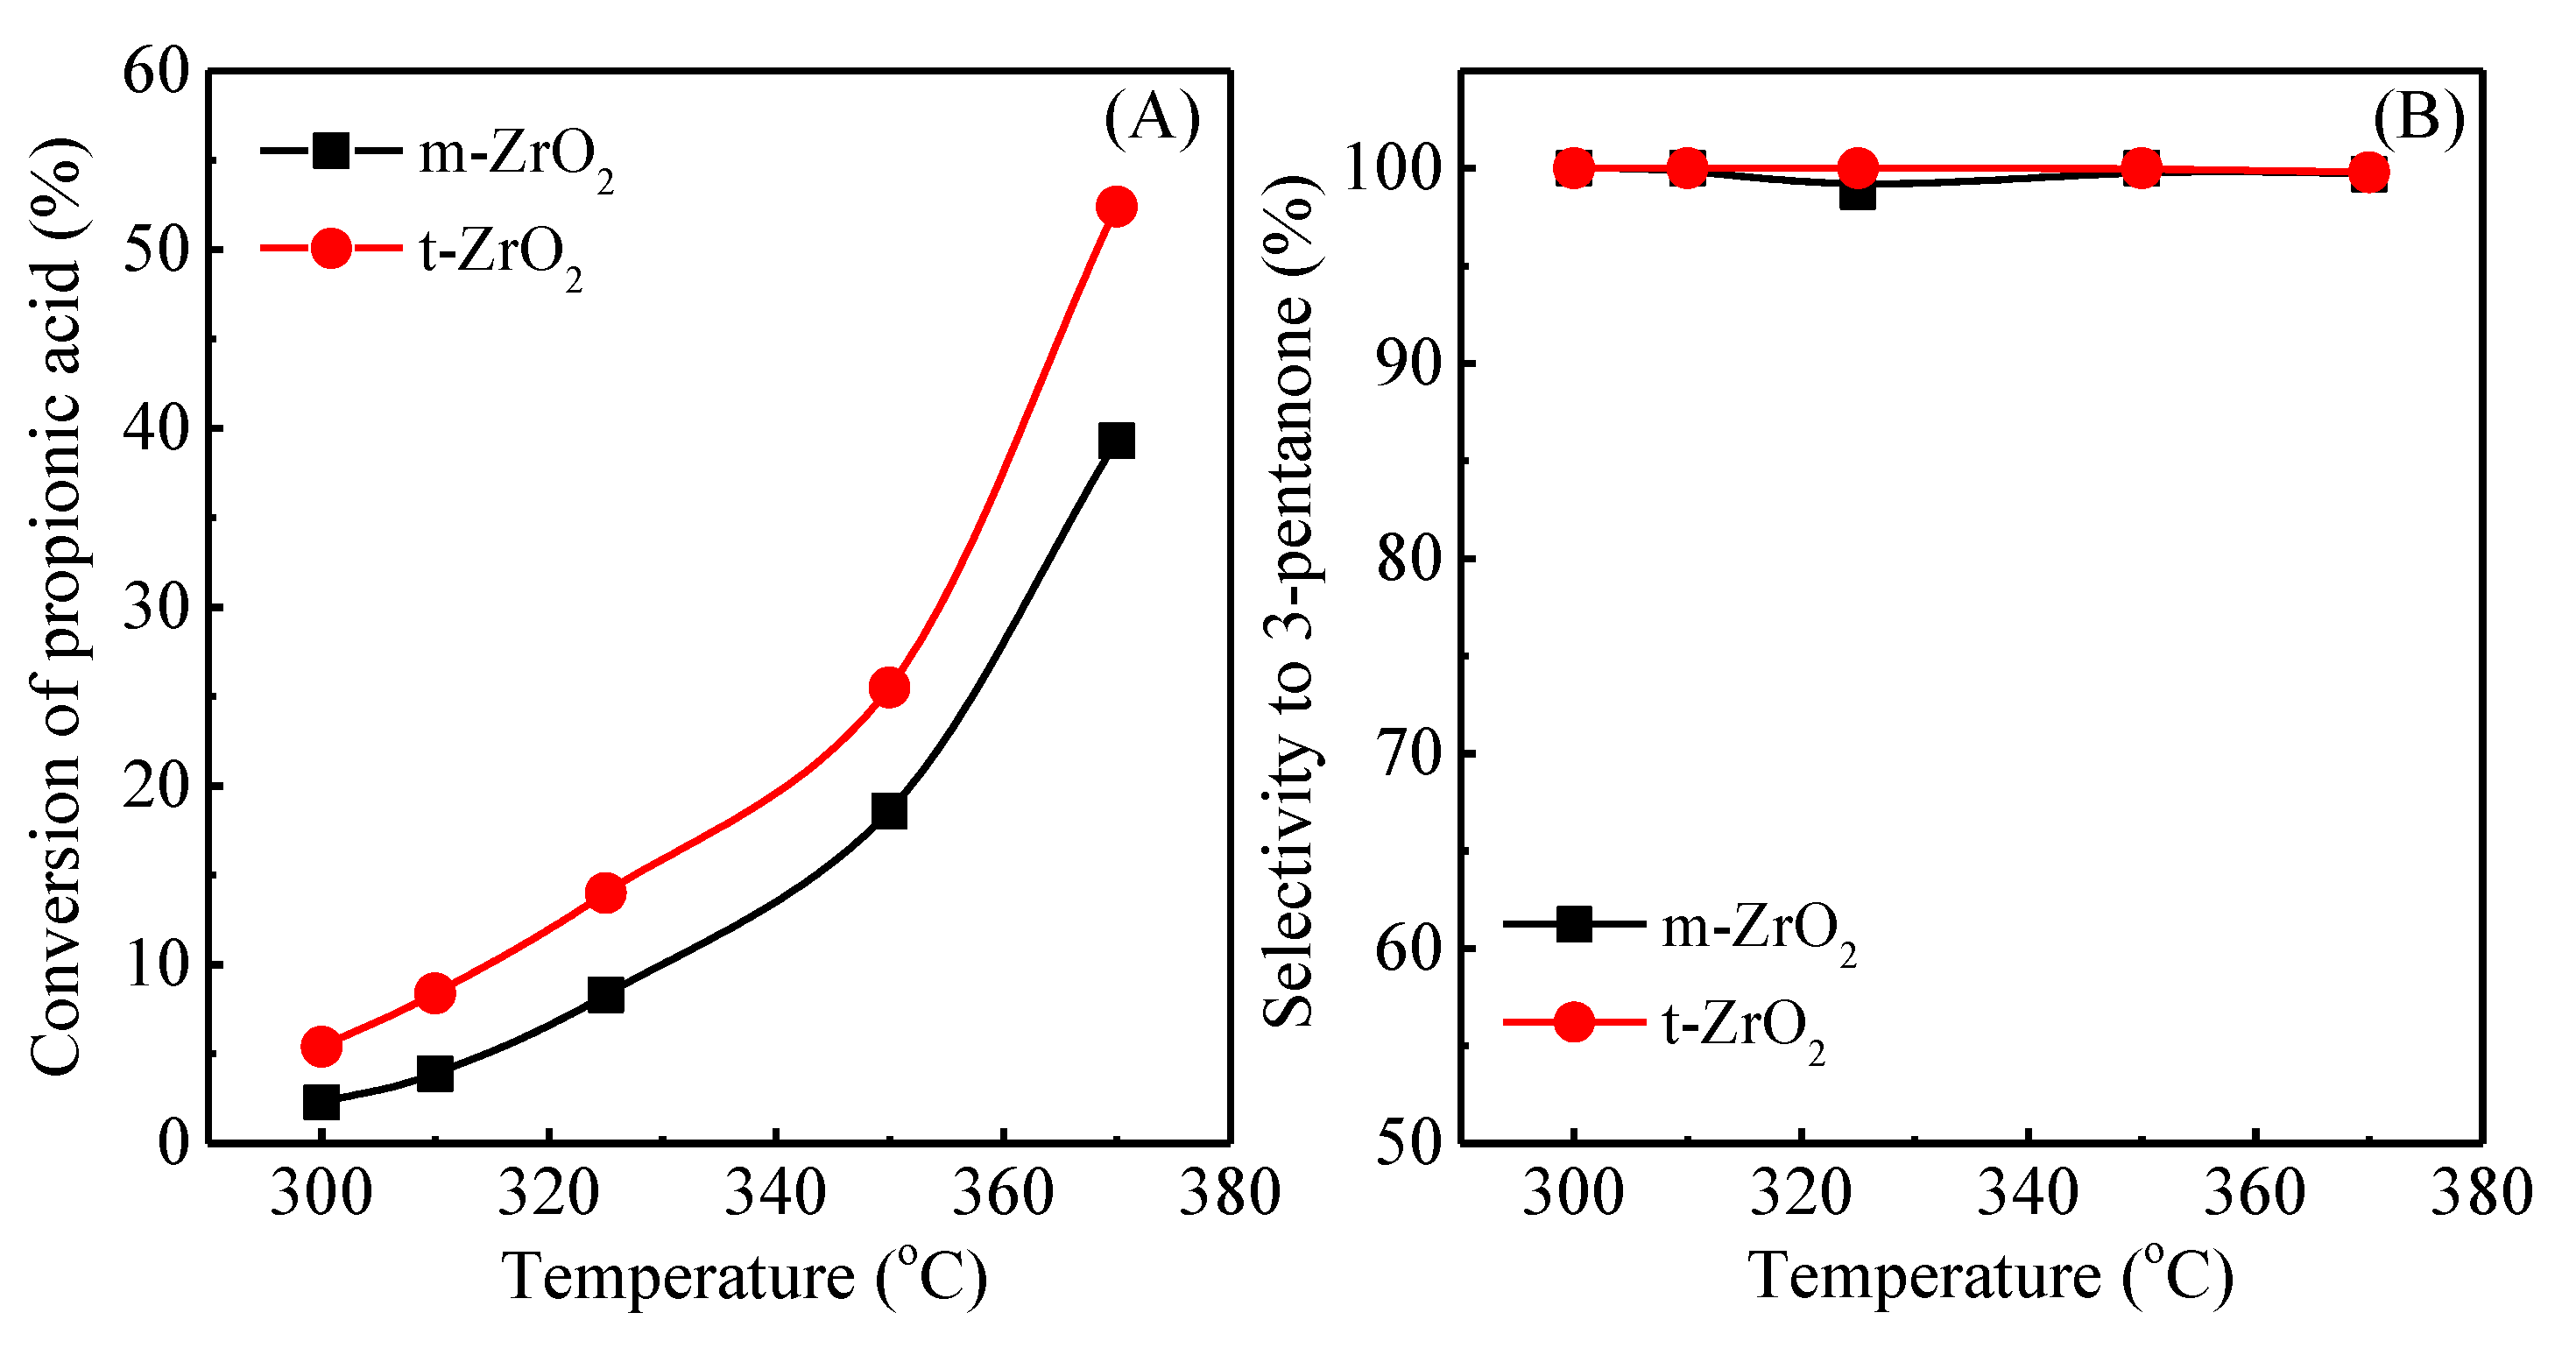
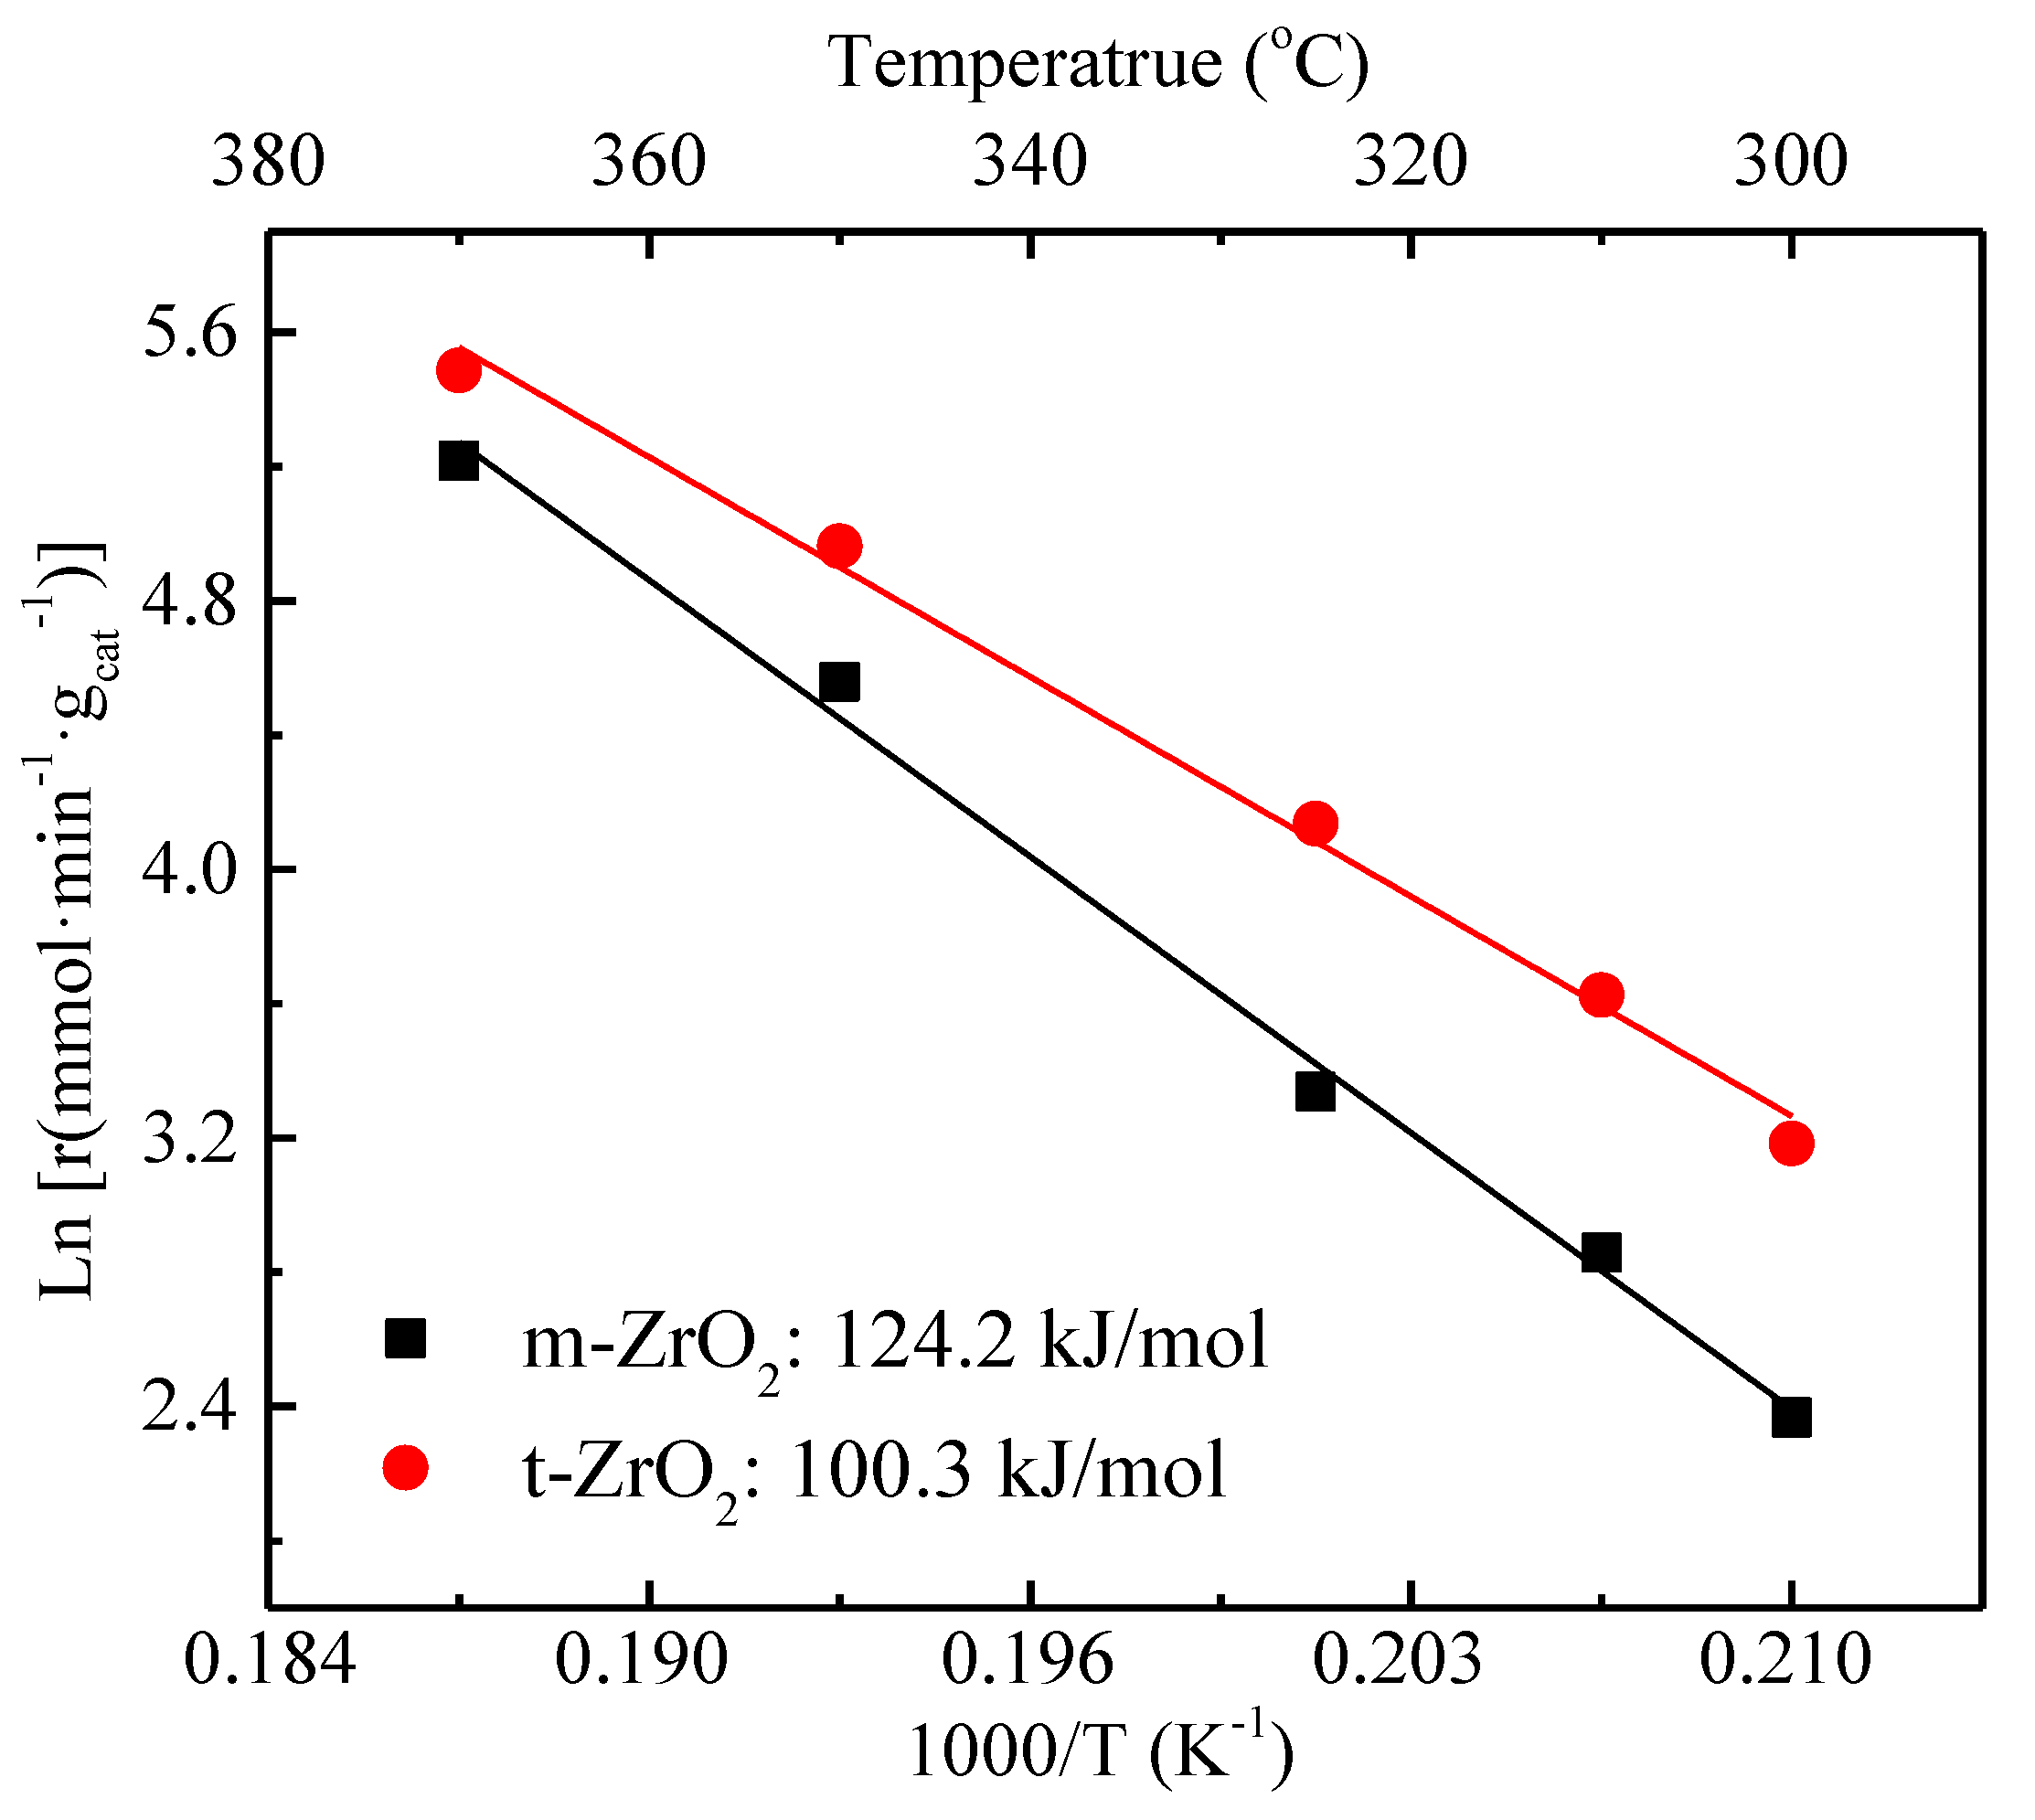
2.2. Catalytic Performance

The catalytic activity of m-ZrO2 and t-ZrO2 for propionic acid ketonization were studied at 300–375 °C and atmospheric pressure in the integral fixed-bed reactor with the same space time (W/F, defined as ratio of catalyst weight and propionic acid flow rate, gcat·gfeed−1·h) of 0.05 h, as shown in Figure 4. The conversion of propionic acid is enhanced with increasing the temperature from 300 °C to 375 °C (Figure 4A). The main product is 3-pentanone, the selectivity of which is higher than 97.5% on the two catalysts (Figure 4B), and the minor products include methylketene, propionic anhydride and propanal, in accordance with others’ reports on ZrO2 [25,26]. The surface-based intrinsic reaction rate of propionic acid is higher on t-ZrO2 than that on m-ZrO2 in the temperature range of 300–375 °C (Figure 5), which is consistent with previous studies on acetic acid ketonization [28,31].
Figure 6 shows the Arrhenius plots of propionic acid conversion on ZrO2 at 300–375 °C. The apparent activation energy (Ea) for propionic acid ketonization is 124.2 kJ/mol on m-ZrO2, and 100.3 kJ/mol on t-ZrO2, which is consistent with a previous report of 117 kJ/mol on m-ZrO2 [18] and 103–109 kJ/mol on ZrO2 with mixed phase [21]. Please note that the variation trend of Ea is in accordance with that of propionic acid ketonization rate, where the higher Ea causes a lower ketonization rate.

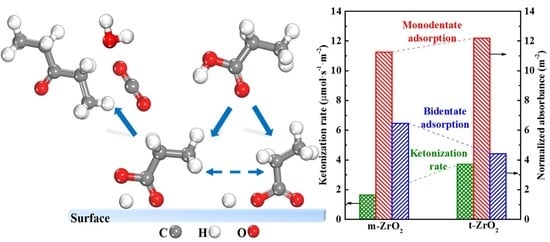
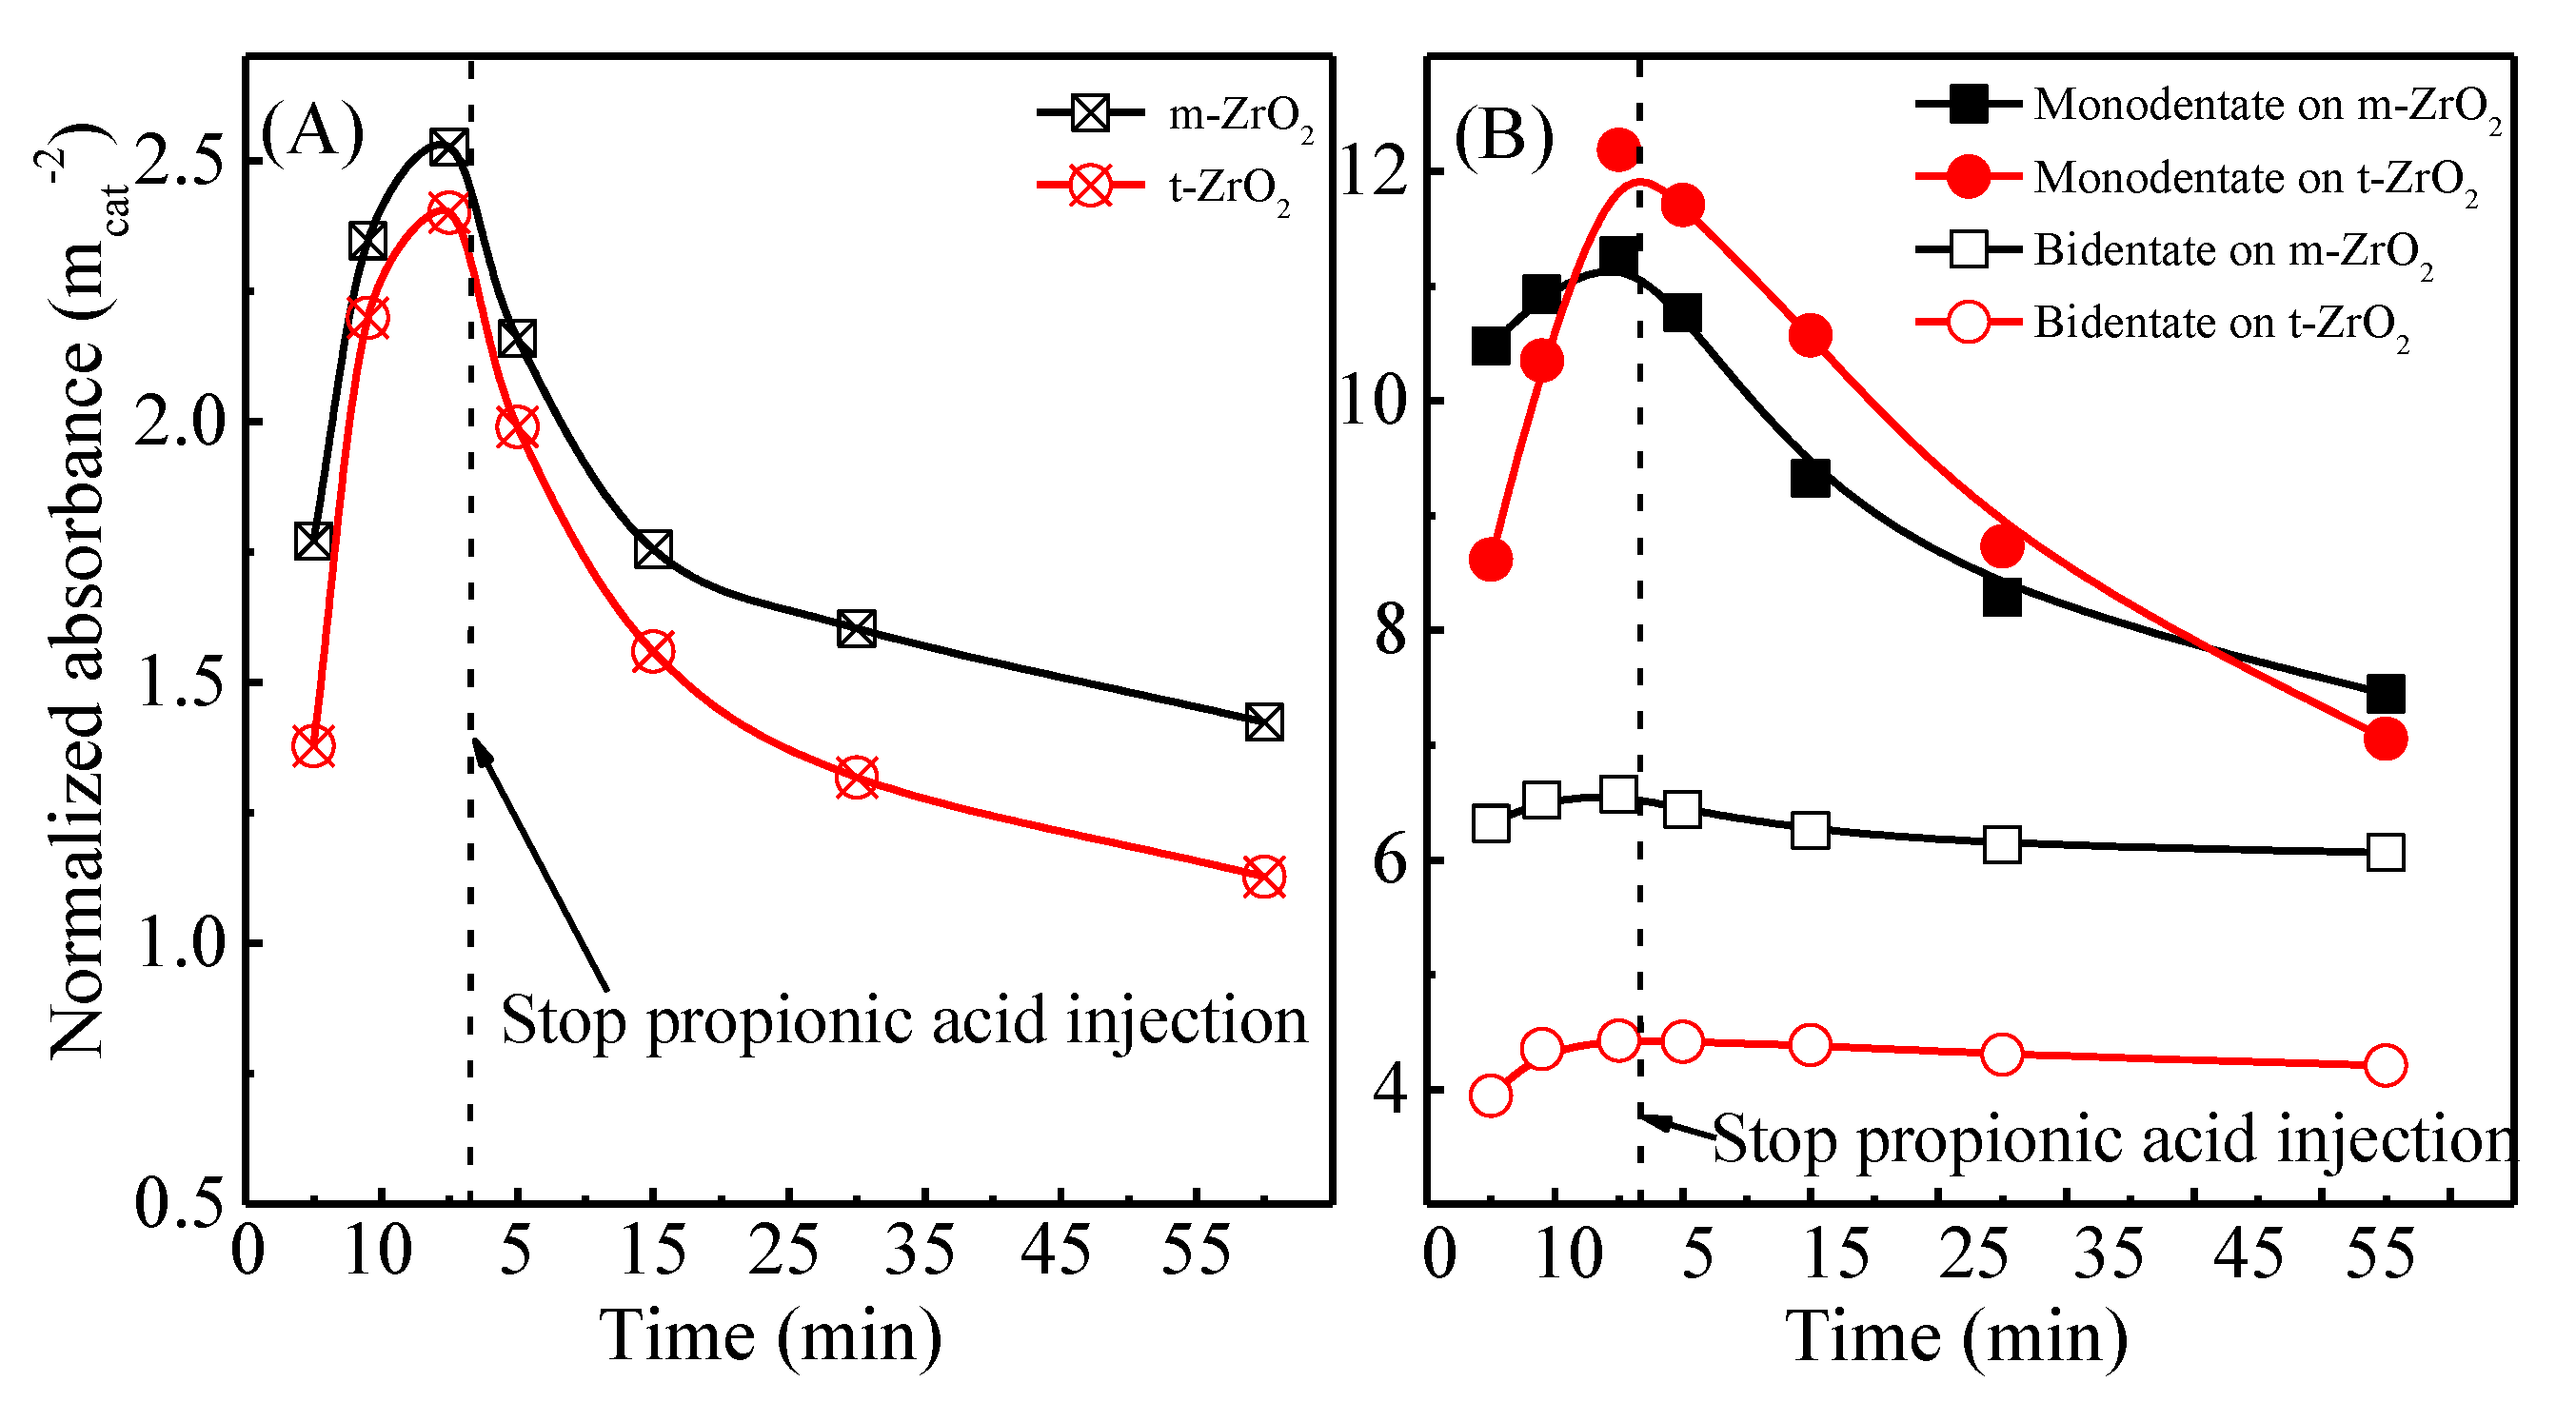
2.3. DRIFTS Study of Propionic Acid and 3-Pentanone Adsorption on the Surface of ZrO2

To elucidate the influence factors on the different reaction activity of propionic acid over m-ZrO2 and t-ZrO2, the propionic acid adsorption was investigated under reaction conditions using DRIFTS. Figure 7 and Figure S4 display the spectra recorded. The peaks at 1789 and 1769 cm−1 are assigned to the C=O stretching vibration (νC=O) of vapor-phase propionic acid (C2H5COOH) [37,46]. Based on the literature [5,46,47], the bands at 2981, 2944, and 2887 cm−1 are ascribed to the C–H stretching vibration (νC–H), the bands at 1374 and 1294 cm−1 are attributed to the C–H bending vibration (δC–H), and the band at 1080 cm−1 belongs to the C–H in-plane rocking vibration (ρC–H). The dissociated adsorption configurations of propionic acid (Scheme 1) can be distinguished through the △νOCOass, frequency separation between the asymmetric vibration (νas) and the symmetric vibration (νs) of OCO bonds). In addition, △νOCO follows the order of monodentate > free ionic > bidentate [48,49], and the ionic △ν of sodium propionate is 158 cm−1 [37]. Thus, the monodenate propionates (C2H5COO*) are detected on m-ZrO2 and t-ZrO2, locating at 1590, 1417 cm−1 and 1597, 1414 cm−1, respectively. Besides those, two kind bidentate propionates (*C2H5COO*) are observed on m-ZrO2 and t-ZrO2, including chelating bidentate propionates (1556, 1560 cm−1) and bridging bidentate propionates (1512, 1470 cm−1; 1511, 1470 cm−1) [5,16,47]. The peaks of 1597 and 1560 cm−1 on t-ZrO2 shift to the lower wavenumber on m-ZrO2 (1590 and 1556 cm−1), indicating the stronger adsorption of propionic acid on m-ZrO2. With increasing the time of propionic acid fed, the intensity of C2H5COOH peaks increases, then decreases rapidly and disappears after the removal of propionic acid in the vapor phase. During propionic acid fed, a peak at 2358 cm−1 is detected on t-ZrO2 surface (Figure S4C), which belongs to the asymmetric stretching mode of CO2 binding with coordinatively unsaturated Zr4+ cations [50]. However, a tiny CO2 peak is observed on the m-ZrO2 surface (Figure S4A). This result indicates that less CO2 is produced on m-ZrO2 than on t-ZrO2, which is consistent with the lower ketonization rate of propionic acid on m-ZrO2 (Section 2.2).
To clearly distinguish the variations of C2H5COO* and *C2H5COO* on the two catalysts, the spectra were fitted using Lorentzian and/or Gaussian function sums. Figure S5 displays the examples of fitted spectra of adsorbed propionic acid, which correspond to 15 min spectra of Figure 7A,C. Figure 8 shows the fit results. The peak area of 1080 cm−1, 1590 cm−1, and the sum of 1560 and 1510 cm−1 were used to represent the total concentration of adsorbed propionic acid, the density of C2H5COO* and *C2H5COO* on the catalysts surface, respectively [47]. As shown in Figure 8A, the total concentration of adsorbed propionic acid increases until near saturation coverages over the both catalysts with increasing adsorption time. After the removal of propionic acid in the vapor phase, the amount of total adsorbed propionic acid decreases with the extension of time. In accordance with the report by Foraita et al., the total concentration of adsorbed propionic acid on m-ZrO2 is more than that on t-ZrO2 [47], due to the more acid-base sites existence. The change trends of C2H5COO* concentration are obvious and similar with that of total adsorbed propionic acid (Figure 8B). At the lower coverage of propionic acid, there are more C2H5COO* on m-ZrO2 than on t-ZrO2, which may be due to the stronger adsorption of propionic acid and the lower activity of m-ZrO2. However, the C2H5COO* becomes more on t-ZrO2 relative to on m-ZrO2 when the ketonization reaches a steady state at 15 min. The amount of C2H5COO* on m-ZrO2 and t-ZrO2 decreases gradually with time after stopping propionic acid fed because of reaction and desorption. More *C2H5COO* is adsorbed onto the m-ZrO2 surface than onto t-ZrO2 (Figure 8B). The slight changes of *C2H5COO* are observed on the two catalysts throughout the whole process. Furthermore, the *C2H5COO* decreases slowly and there is less contrast with C2H5COO* after the removal of propionic acid, owing to the stronger binding with catalysts surface. The *C2H5COO* may even be converted to C2H5COO*, directly proceeding ketonization, or be desorbed [19,25,26,32].
Based on the above analysis of DRIFTS, the C2H5COO* is much more active than the *C2H5COO*, as has been demonstrated by Wang et al. using DFT and experiments [25,26]. Additionally, the ratio of monodentate to bidentate propionate on t-ZrO2 is smaller than that on m-ZrO2. The adsorption strength of propionic acid on m-ZrO2 is stronger than that on t-ZrO2, which is caused by the more medium-strength acid-base sites with lower coordination exposing on the m-ZrO2 surface. The stronger adsorption of propionic acid is not of benefit to improving ketonization activity. These differences in adsorption strength and adsorption configurations of propionic acid on the two catalysts are related to the different structures of m-ZrO2 and t-ZrO2. Thus, the higher surface concentration and weaker adsorption of C2H5COO* on t-ZrO2 contribute to the higher ketonization rate of propionic acid on t-ZrO2 versus on m-ZrO2 during the steady-state ketonization.
Scheme 2 displays the possible surface reaction of propionic acid ketonization over ZrO2 based on the in situ DRIFTS results and the previous reports [19,25,26]. Propionic acid dissociative adsorbs on the acid-base site as monodentate and bidentate adsorption modes, then forms enolate through α-H abstraction by the vicinal base site. After that, enolate and neighboring propionic acid proceed C–C coupling, dehydration and decarboxylation forming 3-pentanone, H2O and CO2.
The adsorption of 3-pentanone as the main product was also studied by DRIFTS. Figure 9 shows the result of 3-pentanone adsorption. At 50 °C, the carbonyl stretching vibration (νC=O) is located at 1694 cm−1 on both catalysts, suggesting that the oxygen atom of carbonyl binds with the coordinatively unsaturated metal cations of metal oxide in an η1 configuration [37,51]. The intensity of the peak on m-ZrO2 is higher than that on t-ZrO2, which indicates that more 3-pentanone is adsorbed onto m-ZrO2 owing to the greater number of acid sites present. When increasing the temperature from 50 to 250 °C, the peaks at 1694 cm−1 decrease and disappear. Meanwhile, they shift to a lower wavenumber with decreasing peaks. In the DRIFTS of adsorbed propionic acid, the carbonyl stretching vibration of 3-petanone was not observed maybe because of the rapid desorption and low coverage of 3-petanone on the catalysts surface [13].

3. Experiments and Methods

3.1. Catalyst Preparation

The monoclinic zirconia (m-ZrO2) and tetragonal zirconia (t-ZrO2) were prepared by the solvothermal method [52] using water and methanol (Tianjin Kemiou Chemical, Tianjin, China) as solvent, respectively. 25.76 g of Zr(NO3)4·5H2O (Admas Reagent, Shanghai, China) was added to 100 mL water or methanol to prepare the water or methanolic solution (0.6 mol/L). Then, the amount of urea (Tianjin Kemiou Chemical) was mixed with water or methanolic solution with a urea/Zr4+ molar ratio of 5 under stirring at room temperature. After that, the mixtures were added to the stainless-steel autoclave with a Teflon liner at 160 °C for 21 h. The resulting precipitates were washed with water or methanol several times, and dried for 12 h at 110 °C. Finally, the powders were calcined at 400 °C for 4 h with a heating rate of 2 °C/min.

3.2. Catalyst Characterization

The Brunauer–Emmet–Teller (BET) surface area of ZrO2 was performed using a Micrometrics Tristar 3000 with a liquid nitrogen bath (Norcross, GA, USA). All the catalysts were pretreated at 300 °C for 3 h under the atmospheric pressure prior to analysis.
The phase structure of ZrO2 was investigated by powder X-ray diffraction (XRD) on a Rigaku D/Max-2500 V/Pc diffractometer (Tokyo, Japan) under ambient conditions using a filtered Cu Kα radiation source (λ = 1.54056 Å) operated at 40 kV and 20 mA. Data was collected in the angle range of 20–100° with a scanning rate of 4°/min.
The Raman spectra were collected using a Renishaw Raman spectrometer (Wotton-under-Edge, UK) with the Ar+ laser (532 nm) being the exciting light source. The focusing spot size was about 1 μm. The spectra were collected at a resolution of 2 cm−1 with an acquisition time of 10 s/scan at room temperature.
X-ray photoelectron spectroscopy (XPS) data were recorded on a Physical Electronics PHI 1600 (Chanhassen, MN, USA) with monochromatic Al Kα X-rays (1486.6 eV) operated at 250W and 15 kV in a chamber pumped down to a pressure of approximately 1.6×10⁻⁸ Pa. The correction of the binding energy (BE) employed the C 1s peak of adventitious carbon at 284.6 eV.
Temperature-programmed desorption of NH3 and CO2 (NH3-TPD, CO2-TPD) was measured using a Cirrus 200 mass spectrometer (MKS, Austin, TX, USA) [37]. The ZrO2 (200 mg, 40–60 mesh) was loaded into a quartz tube reactor, pretreated at 350 °C in He (30 mL/min) for 60 min, then cooling to 50 °C (30 °C). After pretreatment, ZrO2 was saturated at 50 °C with 2% NH3-He (at 30 °C with 5% CO2-He) for 30 min (50 mL/min), and then subsequently purged with He (30 mL/min) for 60 min to remove all the physisorption NH3 (CO2). The desorption of chemisorbed NH3 (CO2) was carried out in the He flow (30 mL/min) with ramping temperature from 50 °C (30 °C) to 600 °C at a rate of 10 °C /min. The measurement of NH3 (CO2) evolution was studied through a TCD detector, and the desorption peak of NH3 (CO2) was quantified by calibrating the area using a 2% NH3-He (5% CO2-He) with a six-port valve.
Diffuse reflectance infrared Fourier transform spectroscopy (DRIFTS) was performed using the PerkinElmer Frontier spectrometer (Waltham, MA, USA) with the DTGS detector. 40 mg samples were pressed into self-supporting wafers, then mounted into the in situ cell. Before the test, the samples were pretreated at 350 °C in He (30 mL/min) for 60 min, then cooled to the adsorption temperature. The DRIFTS of the pretreated samples were used as background. For the adsorption of pyridine, 0.5 kPa pyridine was injected at 30 °C for 30 min under He (30 mL/min), then purged for 60 min. Following that, the DRIFTS of pyridine adsorption were recorded. The adsorption of propionic acid was measured at 300 °C. 3.9 kPa propionic acid was injected with He (30 mL/min) as carrier gas. The system reached a steady state after 15 min. Then, propionic acid was stopped and purged with He (30 mL/min) for 120 min. The TPD of adsorbed 3-pentanone was carried out. The adsorption process was similar with that of propionic acid. After reaching saturated adsorption of 3-pentanone at 50 °C, the in situ cell was purged under He (30 mL/min) for 60 min, then increased from 50 to 250 °C at a heating rate of 5 °C/min. All the DRIFTS were recorded at a resolution of 4 cm−1, with 32 scans in the range of 4000–1000 cm−1.

3.3. Catalytic Activity

Vapor ketonization of propionic acid was measured in a fixed-bed quartz tube reactor at 300–375 °C and atmospheric pressure [37]. Catalysts with 40–60 mesh were loaded in the center of reactor between the two layers of quartz wool, and pretreated at 350 °C for 30 min in Ar as carrier gas, controlled by the mass flow; then, the temperature was decreased to the reaction temperature. A K-type thermocouple was placed in the reactor for the measurement of the catalysts bed temperature. Propionic acid was introduced by a syringe pump (KDS100, kd scientific, Holliston, MA, USA). The molar ratio of Ar and propionic acid was 25. All lines were heated at 220 °C to avoid any condensation of reactants and products. The products were quantified online using a gas chromatograph (GC, 7890B, Agilent, Santa Clara, CA, USA). Finally, the products were collected by the methanol in the ice water bath. The conversion and selectivity are reported in Mol of carbon %.

4. Conclusions

The ketonization rate of propionic acid in the vapor phase was affected by the zirconia polymorph. The t-ZrO2 catalysts show higher activity on propionic acid ketonization than m-ZrO2 at 300–375 °C. There are more medium-strength acid base sites with lower coordination exposed on the m-ZrO2 surface in comparison to t-ZrO2, strengthening propionic acid adsorption, although they are not of benefit in terms of increasing the reaction rate. The in situ DRIFTS of adsorbed propionic acid during reaction conditions demonstrate that monodentate and bidentate propionates are the most abundant surface intermediates. In addition, the monodentate propionates are much more active over bidentate propionates. Relative to m-ZrO2, t-ZrO2 favors monodentate adsorption over bidentate adsorption, and diminish the adsorption strength of monodentate propionates, which are related to the zirconia polymorph. The higher ketonization rate obtained on t-ZrO2 is due to the higher surface concentration and weaker adsorption of monodentate propionates contrast with that over m-ZrO2.

Supplementary Materials

The following are available online at https://www.mdpi.com/2073-4344/9/9/768/s1, Figure S1: X-ray diffraction patterns of ZrO2 used at 350 °C in the ketonization of propionic acid, Figure S2: N2 sorption isotherm curves of ZrO2 catalysts, Figure S3: DRIFT spectra of adsorbed pyridine at 30 °C on ZrO2 catalysts, Figure S4: DRIFT spectra of propionic acid adsorption on m-ZrO2 (A,B) and t-ZrO2 (C, D) during ketonization at 300 °C, Figure S5: Fitted DRIFT spectra of propionic acid adsorption for 15 min on ZrO2 catalysts at 300 °C.

Author Contributions

S.D. contributed to catalysts synthesis and characterizations, results analysis and paper writing; J.Z. contributed to results discussion and writing of the paper; Q.Y. contributed to catalysts synthesis.

Funding

This research was funded by the National Natural Science Foundation of China, grant number 21676194 and 21576204.

Conflicts of Interest

The authors declare no conflict of interest.

References

  1. George, S.I.; Huber, W.; Corma, A. Synthesis of transportation fuels from biomass: Chemistry, catalysts, and engineering. Chem. Rev. 2006, 106, 4044–4098. [Google Scholar]
  2. Goyal, H.B.; Seal, D.; Saxena, R.C. Bio-fuels from thermochemical conversion of renewable resources: A review. Renew. Sustain. Energ. Rev. 2008, 12, 504–517. [Google Scholar] [CrossRef]
  3. Corma, A.; Iborra, S.; Velty, A. Chemical routes for the transformation of biomass into chemicals. Chem. Rev. 2007, 107, 2411–2502. [Google Scholar] [CrossRef] [PubMed]
  4. Perez, R.F.; Soares, O.S.G.P.; de Farias, A.M.D.; Pereira, M.F.R.; Fraga, M.A. Conversion of hemicellulose-derived pentoses over noble metal supported on 1D multiwalled carbon nanotubes. Appl. Catal. B Environ. 2018, 232, 101–107. [Google Scholar] [CrossRef]
  5. Chen, L.; Zhu, Y.; Zheng, H.; Zhang, C.; Li, Y. Aqueous-phase hydrodeoxygenation of propanoic acid over the Ru/ZrO2 and Ru–Mo/ZrO2 catalysts. Appl. Catal. A Gen. 2012, 411–412, 95–104. [Google Scholar] [CrossRef]
  6. Rachmady, W.; Vannice, M.A. Acetic acid reduction by H2 over supported Pt catalysts: A DRIFTS and TPD/TPR study. J. Catal. 2002, 207, 317–330. [Google Scholar] [CrossRef]
  7. Al-Auda, Z.; Al-Atabi, H.; Hohn, K.L. Metals on ZrO2: Catalysts for the aldol condensation of methyl ethyl ketone (MEK) to C8 ketones. Catalyst 2018, 8, 622. [Google Scholar] [CrossRef]
  8. Faba, L.; Díaz, E.; Ordóñez, S. Gas phase acetone self-condensation over unsupported and supported Mg–Zr mixed-oxides catalysts. Appl. Catal. B Environ. 2013, 142–143, 387–395. [Google Scholar] [CrossRef]
  9. Mekhemer, G.; Halawy, S.; Mohamed, M.; Zaki, M. Ketonization of acetic acid vapour over polycrystalline magnesia: In situ Fourier transform infrared spectroscopy and kinetic studies. J. Catal. 2005, 230, 109–122. [Google Scholar] [CrossRef]
  10. Bennett, J.A.; Parlett, C.M.A.; Isaacs, M.A.; Durndell, L.J.; Olivi, L.; Lee, A.F.; Wilson, K. Aetic acid ketonization over Fe2O3/SiO2 for pyrolysis bio-oil upgrading. ChemCatChem 2017, 9, 1648–1654. [Google Scholar] [CrossRef]
  11. Snell, R.W.; Shanks, B.H. CeMOx-promoted ketonization of biomass-derived carboxylic acids in the condensed phase. ACS Catal. 2014, 4, 512–518. [Google Scholar] [CrossRef]
  12. Nagashima, O.; Sato, S.; Takahashi, R.; Sodesawa, T. Ketonization of carboxylic acids over CeO2-based composite oxides. J. Mol. Catal. A Chem. 2005, 227, 231–239. [Google Scholar] [CrossRef]
  13. Pham, T.N.; Shi, D.; Sooknoi, T.; Resasco, D.E. Reaction kinetics and mechanism of ketonization of aliphatic carboxylic acids with different carbon chain lengths over Ru/TiO2 catalyst. J. Catal. 2014, 314, 149–158. [Google Scholar] [CrossRef]
  14. Lu, F.; Jiang, B.; Wang, J.; Huang, Z.; Liao, Z.; Yang, Y. Insights into the improvement effect of Fe doping into the CeO2 catalyst for vapor phase ketonization of carboxylic acids. Mol. Catal. 2018, 444, 22–33. [Google Scholar] [CrossRef]
  15. Gumidyala, A.; Sooknoi, T.; Crossley, S. Selective ketonization of acetic acid over HZSM-5: The importance of acyl species and the influence of water. J. Catal. 2016, 340, 76–84. [Google Scholar] [CrossRef] [Green Version]
  16. Wang, X.; Ding, S.; Wang, H.; Liu, X.; Han, J.; Ge, Q.; Zhu, X. Conversion of propionic acid and 3-pentanone to hydrocarbons on ZSM-5 catalysts: Reaction pathway and active site. Appl. Catal. A Gen. 2017, 545, 79–89. [Google Scholar] [CrossRef]
  17. Martinez, R. Ketonization of acetic acid on titania-functionalized silica monoliths. J. Catal. 2004, 222, 404–409. [Google Scholar] [CrossRef]
  18. Ignatchenko, A.V.; Kozliak, E.I. Distinguishing Enolic and Carbonyl Components in the Mechanism of Carboxylic Acid Ketonization on Monoclinic Zirconia. ACS Catal. 2012, 2, 1555–1562. [Google Scholar] [CrossRef]
  19. Cai, Q.; Lopez-Ruiz, J.A.; Cooper, A.R.; Wang, J.; Albrecht, K.O.; Mei, D. Aqueous-phase acetic acid ketonization over monoclinic zirconia. ACS Catal. 2017, 8, 488–502. [Google Scholar] [CrossRef]
  20. Snell, R.W.; Shanks, B.H. Insights into the ceria-catalyzed ketonization reaction for biofuels applications. ACS Catal. 2013, 3, 783–789. [Google Scholar] [CrossRef]
  21. Almutairi, S.T.; Kozhevnikova, E.F.; Kozhevnikov, I.V. Ketonisation of acetic acid on metal oxides: Catalyst activity, stability and mechanistic insights. Appl. Catal. A Gen. 2018, 565, 135–145. [Google Scholar] [CrossRef]
  22. Liu, C.; Karim, A.M.; Lebarbier, V.M.; Mei, D.; Wang, Y. Vapor phase ketonization of acetic acid on ceria based metal oxides. Top. Catal. 2013, 56, 1782–1789. [Google Scholar] [CrossRef]
  23. Kim, K.S.; Barteau, M.A. Structure and composition requirements for deoxygenation, dehydration, and ketonization reactions of carboxylic acids on TiO2 (001) single-crystal surfaces. J. Catal. 1990, 125, 353–375. [Google Scholar] [CrossRef]
  24. Stubenrauch, J.; Brosha, E.; Vohs, J.M. Reaction of carboxylic acids on CeO2 (111) and CeO2 (100). Catal. Today 1996, 28, 431–441. [Google Scholar] [CrossRef]
  25. Wang, S.; Iglesia, E. Experimental and theoretical assessment of the mechanism and site requirements for ketonization of carboxylic acids on oxides. J. Catal. 2017, 345, 183–206. [Google Scholar] [CrossRef]
  26. Wang, S.; Iglesia, E. Experimental and theoretical evidence for the reactivity of bound intermediates in ketonization of carboxylic acids and consequences of acid–base properties of oxide catalysts. J. Phys. Chem. C 2017, 121, 18030–18046. [Google Scholar] [CrossRef]
  27. Snell, R.W.; Hakim, S.H.; Dumesic, J.A.; Shanks, B.H. Catalysis with ceria nanocrystals: Bio-oil model compound ketonization, Appl. Catal. A Gen. 2013, 464–465, 288–295. [Google Scholar] [CrossRef]
  28. Wu, K.; Yang, M.; Pu, W.; Wu, Y.; Shi, Y.; Hu, H. Carbon promoted ZrO2 catalysts for aqueous-phase ketonization of acetic acid. ACS Sustain. Chem. Eng. 2017, 5, 3509–3516. [Google Scholar] [CrossRef]
  29. Wu, K.; Yang, M.; Chen, Y.; Pu, W.; Hu, H. Aqueous-phase ketonization of acetic acid over Zr/Mn mixed oxides. AICHE J. 2017, 63, 2958–2967. [Google Scholar] [CrossRef]
  30. Lopez-Ruiz, J.A.; Cooper, A.R.; Li, G.; Albrecht, K.O. Enhanced hydrothermal stability and catalytic activity of LaxZryOz mixed oxides for the ketonization of acetic acid in the aqueous condensed phase. ACS Catal. 2017, 7, 6400–6412. [Google Scholar] [CrossRef]
  31. Parida, K.; Mishra, H.K. Catalytic ketonisation of acetic acid over modified zirconia 1 effect of alkali-metal cations as promoter. J. Mol. Catal. A Chem 1999, 139, 73–80. [Google Scholar] [CrossRef]
  32. Pulido, A.; Oliver-Tomas, B.; Renz, M.; Corma, A. Ketonic decarboxylation reaction mechanism: A combined experimental and DFT study. ChemSusChem 2013, 6, 141–151. [Google Scholar] [CrossRef] [PubMed]
  33. Ignatchenko, A.V.; DeRaddo, J.S.; Marino, V.J.; Mercado, A. Cross-selectivity in the catalytic ketonization of carboxylic acids. Appl. Catal. A Gen. 2015, 498, 10–24. [Google Scholar] [CrossRef] [Green Version]
  34. Gaertner, C.A.; Serrano-Ruiz, J.C.; Braden, D.J.; Dumesic, J.A. Catalytic coupling of carboxylic acids by ketonization as a processing step in biomass conversion. J. Catal. 2009, 266, 71–78. [Google Scholar] [CrossRef]
  35. Tosoni, S.; Pacchioni, G. Acetic acid ketonization on tetragonal zirconia: Role of surface reduction. J. Catal. 2016, 344, 465–473. [Google Scholar] [CrossRef]
  36. Shutilov, A.A.; Simonov, M.N.; Zaytseva, Y.A.; Zenkovets, G.A.; Simakova, I.L. Phase composition and catalytic properties of ZrO2 and CeO2-ZrO2 in the ketonization of pentanoic acid to 5-nonanone. Kinet. Catal. 2013, 54, 184–192. [Google Scholar] [CrossRef]
  37. Ding, S.; Wang, H.; Han, J.; Zhu, X.; Ge, Q. Ketonization of propionic acid to 3-pentanone over CexZr1–xO2 catalysts: The importance of acid–base balance. Ind. Eng. Chem. Res. 2018, 57, 17086–17096. [Google Scholar] [CrossRef]
  38. Baylon, R.A.L.; Sun, J.; Kovarik, L.; Engelhard, M.; Li, H.; Winkelman, A.D.; Wang, Y. Structural identification of ZnxZryOz catalysts for cascade aldolization and self-deoxygenation reactions. Appl. Catal. B Environ. 2018, 234, 337–346. [Google Scholar] [CrossRef]
  39. Albuquerque, E.M.; Borges, L.E.P.; Fraga, M.A.; Sievers, C. Realtionship between acid-base properties and the activity of ZrO2-based catalysts for the cannizzaro reaction of pyruvaldehyde to lactic acid. ChemCatChem 2017, 9, 2675–2683. [Google Scholar] [CrossRef]
  40. Rhodes, M.D.; Bell, A.T. The effects of zirconia morphology on methanol synthesis from CO and H2 over Cu/ZrO2 catalysts Part I. steady-state studies. J. Catal. 2005, 233, 198–209. [Google Scholar] [CrossRef]
  41. Nelson, A.E.; Schulz, K.H. Surface chemistry and microstructural analysis of CexZr1−xO2−y model catalyst surfaces. Appl. Surf. Sci. 2003, 210, 206–221. [Google Scholar] [CrossRef]
  42. Silva, L.P.C.; Terra, L.E.; Coutinho, A.C.S.L.S.; Passos, F.B. Sour water-gas shift reaction over Pt/CeZrO2 catalysts. J. Catal. 2016, 341, 1–12. [Google Scholar] [CrossRef]
  43. Zaki, M.I.; Hasan, M.A.; Al-Sagheer, F.A.; Pasupulety, L. In situ FTIR spectra of pyridine adsorbed on SiO2-Al2O3, TiO2, ZrO2 and CeO2: General considerations for the identification of acid sites on surfaces of finely divided metal oxides. Colloids Surf. A Physicochem. Eng. Asp. 2001, 190, 261–274. [Google Scholar] [CrossRef]
  44. Sun, J.; Zhu, K.; Gao, F.; Wang, C.; Liu, J.; Peden, C.H.F.; Wang, Y. Direct conversion of bio-ethanol to isobutene on nanosized ZnxZryOz mixed oxides with balanced acid-base sites. J. Am. Chem. Soc. 2011, 133, 11096–11099. [Google Scholar] [CrossRef] [PubMed]
  45. Prymak, I.; Kalevaru, V.N.; Wohlrab, S.; Martin, A. Continuous synthesis of diethyl carbonate from ethanol and CO2 over Ce-Zr-O catalysts. Catal. Sci. Technol. 2015, 5, 2322–2331. [Google Scholar] [CrossRef]
  46. Hasan, M.A.; Zaki, M.I.; Pasupulety, L. Oxide-catalyzed conversion of acetic acid into acetone: An FTIR spectroscopic investigation. Appl. Catal. A Gen. 2003, 243, 81–92. [Google Scholar] [CrossRef]
  47. Foraita, S.; Fulton, J.L.; Chase, Z.A.; Vjunov, A.; Xu, P.; Barath, E.; Camaioni, D.M.; Zhao, C.; Lercher, J.A. Impact of the oxygen defects and the hydrogen concentration on the surface of tetragonal and monoclinic ZrO2 on the reduction rates of stearic acid on Ni/ZrO2. Chem. Eur. J. 2015, 21, 2423–2434. [Google Scholar] [CrossRef] [PubMed]
  48. Li, C.; Domen, K.; Maruya, K.I.; Onishi, T. Spectroscopic identification of adsorbed species derived from adsorption and decomposition of formic acid, methanol, and formaldehyde on cerium oxide. J. Catal. 1990, 125, 445–455. [Google Scholar] [CrossRef]
  49. Pei, Z.-F.; Ponec, V. On the intermediates of the acetic acid reactions on oxides: An IR study. Appl. Surf. Sci. 1996, 103, 171–182. [Google Scholar] [CrossRef]
  50. Pokrovski, K.; Jung, K.T.; Bell, A.T. Investigation of CO and CO2 adsorption on tetragonal and monoclinic Zirconia. Langmuir 2001, 17, 4297–4303. [Google Scholar] [CrossRef]
  51. Zaki, M.I.; Hasan, M.A.; Pasupulety, L. Surface Reactions of acetone on Al2O3, TiO2, ZrO2 and CeO2: IR Spectroscopic assessment of impacts of the surface acid-base properties. Langmuir 2001, 17, 768–774. [Google Scholar] [CrossRef]
  52. Li, W.; Huang, H.; Li, H.; Zhang, W.; Liu, H. Facile synthesis of monoclinic and tetragonal zirconia nanoparticles and their phase effects on the behavior of supported molybdena catalysts for methanol-selective oxidation. Langmuir 2008, 24, 8358–8366. [Google Scholar] [CrossRef] [PubMed]
Figure 1. X-ray diffraction patterns of ZrO2 (A), and Raman spectra of ZrO2 (B).
Catalysts 09 00768 g001
Figure 2. XPS spectra of ZrO2. (A) Zr 3d and (B) O 1s. Dashed line, experimental data; solid lines, curve fittings.
Catalysts 09 00768 g002
Figure 3. NH3-TPD profiles (A) and CO2-TPD profiles (B) of ZrO2. Solid line, experimental data; short dash lines, curve fittings.
Catalysts 09 00768 g003
Figure 4. Reaction activity of propionic acid ketonization on ZrO2 as a function of temperature. (A) Conversion of propionic acid; (B) selectivity to 3-pentanone. Reaction conditions: Pacid = 3.9 kPa, Ptotal = 101.325 kPa, W/F = 0.05 h, Ar/propionic acid = 25, time on stream is 30 min for each temperature.
Catalysts 09 00768 g004
Figure 5. The area-based intrinsic ketonization rate on ZrO2. Reaction conditions: T = 300–375 °C, Ptotal = 101.325 kPa, Pacid = 3.9 kPa, Ar/Propionic acid = 25, Time on stream is 30 min, the conversion is < 18% by adjusting the space time (W/F).
Catalysts 09 00768 g005
Figure 6. Arrhenius plots of propionic acid ketonization on ZrO2. Reaction conditions: T = 300–370 °C, Ptotal = 101.325 kPa, Pacid = 3.9 kPa, Ar/Propionic acid = 25, time on stream is 30 min, the conversion is < 18% by adjusting the space time (W/F).
Catalysts 09 00768 g006
Figure 7. DRIFT spectra of propionic acid adsorption on m-ZrO2 (A,B) and t-ZrO2 (C,D) during ketonization at 300 °C: (A,C) under propionic acid feed; (B,D) after the removal of propionic acid in vapor phase.
Catalysts 09 00768 g007
Scheme 1. Adsorption configurations of carboxylic acid on ZrO2. R = CH3CH2.
Catalysts 09 00768 sch001
Figure 8. The total amount of adsorbed propionic acid (peak area of 1080 cm−1) (A), the amount of monodentate propionate (peak area of 1590–1597 cm−1) and bidentate propionate (peak area of 1560 and 1510 cm−1) (B) on ZrO2 normalized by surface area.
Catalysts 09 00768 g008
Scheme 2. Proposed surface reaction of propionic acid ketonization over ZrO2.
Catalysts 09 00768 sch002
Figure 9. TPD-DRIFT spectra of 1.0 kPa 3-pentanone adsorption on m-ZrO2 (A) and t-ZrO2 (B).
Catalysts 09 00768 g009
Table 1. BET surface area, pore volumes and crystal structure of ZrO2.
CatalystSurface Area (m2/g)Pore Volume (cm3/g)Lattice Spacing a (nm)Crystallite Size a (nm)
m-ZrO21030.3070.31649.5
t-ZrO21270.1600.29578.4
a The calculations of lattice distance and crystallite size were carried out by using peaks of (-111) for m-ZrO2 (2θ = 28.2°, monoclinic phase), and (111) for t-ZrO2 (2θ = 30.2°, tetragonal phase).
Table 2. Quantification of acid sites and base sites.
CatalystsAcid Site a (μmol/m2)Base Site b (μmol/m2)
TotalWeakMediumTotalWeakMediumStrong
m-ZrO22.210.791.421.550.491.030.02
t-ZrO21.890.741.151.450.610.810.03
a Derived from NH3-TPD. b Derived from CO2-TPD.

