Article

Influence of MoS2 on Activity and Stability of Carbon Nitride in Photocatalytic Hydrogen Production

1
Leibniz Institute for Catalysis at the University of Rostock, Albert-Einstein-Str. 29a, 18059 Rostock, Germany
2
Department of Chemistry, Technical University Berlin, Hardenbergstr. 40, 10623 Berlin, Germany
*
Authors to whom correspondence should be addressed.
Catalysts 2019, 9(8), 695; https://doi.org/10.3390/catal9080695
Submission received: 9 July 2019 / Revised: 14 August 2019 / Accepted: 15 August 2019 / Published: 17 August 2019
(This article belongs to the Special Issue Catalysts for Solar Fuels)

Abstract

:
MoS2/C3N4 (MS-CN) composite photocatalysts have been synthesized by three different methods, i.e., in situ-photodeposition, sonochemical, and thermal decomposition. The crystal structure, optical properties, chemical composition, microstructure, and electron transfer properties were investigated by X-ray diffraction, UV-vis diffuse reflectance spectroyscopy, X-ray photoelectron spectroscopy, electron microscopy, photoluminescence, and in situ electron paramagnetic resonance spectroscopy. During photodeposition, the 2H MoS2 phase was formed upon reduction of [MoS4]2− by photogenerated conduction band electrons and then deposited on the surface of CN. A thin crystalline layer of 2H MoS2 formed an intimate interfacial contact with CN that favors charge separation and enhances the photocatalytic activity. The 2H MS-CN phase showed the highest photocatalytic H2 evolution rate (2342 μmol h−1 g−1, 25 mg catalyst/reaction) under UV-vis light irradiation in the presence of lactic acid as sacrificial reagent and Pt as cocatalyst.

Graphical Abstract

1. Introduction

Increasing concerns about energy demand and environmental pollution have stimulated research to find and utilize renewable energy resources as an alternative to fossil fuels such as coal, petroleum and natural gas [1]. Photocatalytic water reduction using sunlight is a method for the direct conversion of solar energy into hydrogen, which is a practical and storable energy carrier [2,3,4,5,6]. So far, a wide variety of semiconductors has been explored as photocatalysts for H2 production, among them pure oxides such as TiO2, ZnO, Nb2O5 or Ta2O5, titanates, niobates, and tantalates of group I and II elements, as well as nitride and sulfide based materials, to name just a few [7,8]. A newer generation of semiconducting materials, including metal-organic frameworks, polyoxometalates, conducting polymers and metal free semiconductors is also being introduced as potential candidates for H2 production [9,10,11]. Unfortunately, many of these materials work efficiently only with UV light and/or need a cocatalyst to raise their limited light absorption capability and/or to suppress fast recombination of photogenerated electron hole pairs [12]. To improve these properties, composite photocatalysts based on carbon nitride are promising systems with facilitated separation of electron hole pairs and extended light absorption in the visible region [13,14,15].
Carbon nitride (also termed “C3N4” even though the exact stoichiometry is synthetically hard to achieve [11]) is a two dimensional (2D) layered polymeric metal free semiconductor, which has been widely investigated in light driven transformations such as water splitting, CO2 reduction, and degradation of organic pollutants [11]. It exhibits favorable properties like earth abundance, non-toxicity, synthetic accessibility, and chemical stability [16]. Additionally, it has a suitable band structure with a band gap of 2.70 eV which allows for the absorption of light in the visible region [17]. These beneficial properties render carbon nitride a potentially suitable alternative to TiO2 [11]. However, bulk C3N4 shows low photocatalytic activity due to its low surface area, low electrical conductivity, and high recombination rate of photogenerated electron and hole pairs [18]. Therefore, a number of modification techniques have been developed in recent years to improve the photocatalytic activity of C3N4, such as morphology control, porous structure formation, composite formation with other semiconductors, doping with metal or non-metal elements, loading with noble metal particles, as well as coupling with carbon dots, carbon nanotubes, graphene, conducting polymers, or metal organic frameworks [11,19]. One of these modifications can be done by preparing nanocomposites of C3N4 with other semiconductors to create synergistic heterojunctions that may advance charge separation and thus improve photocatalytic efficiency [20,21].
Layered C3N4 nanosheets coupled with another semiconductor can lead to three types of heterojunctions such as 0D/2D (point-to-face contact), 1D/2D (line-to-face contact) and 2D/2D (face-to-face contact) [22]. Since the contact area between 2D/2D heterojunctions is much higher than in the other two composites, those materials can boost the charge separation and enhance the photocatalytic efficiency [23]. Moreover, the layered junction decreases the diffusion length which could improve the separation efficiency of photogenerated electrons and holes thereby enhancing the photocatalytic performance [14]. Hence, it is very useful to couple C3N4 nanosheets with another 2D semiconductor to construct an efficient photocatalyst. Two dimensional (2D) MoS2 is one of these suitable semiconductors due to its beneficial structural, electronic, optical, chemical, and thermal properties, which render it very attractive for H2 production applications [24,25]. 2D MoS2 is composed of hexagonal layers, in which Mo atoms are sandwiched between two layers of S atoms. The layered structure of MoS2 can form two different polymorphs, a 2H phase (trigonal prismatic coordination of S around Mo) and a 1T phase (octahedral coordination of S around Mo) [26]. The 2H phase is semiconducting, whereas the 1T phase is metallic [26]. The structure of the 2H phase can be described by two S-Mo-S layers composed of edge-shared MoS6 trigonal prisms, whereas the structure of the 1T phase is described by a single S-Mo-S layer built from edge-sharing MoS6 octahedra [25,27]. In recent work, the 1T MoS2 phase is considered as more active in electrocatalytic H2 production than the 2H phase, mainly because it is metallic and exposed more active sites [26], however, there is still an ongoing debate about this issue.
Despite the fact that carbon nitride turned out to be a suitable photocatalyst for visible-light driven H2 production, one major problem is fast recombination of photogenerated electron-hole pairs in pristine C3N4 which limits the overall photocatalytic efficiency [12]. Inspired by the advantageous properties of MoS2 nanosheets and by previous investigations (Table S1), we were aiming at the creation of a heterojunction with sol-gel derived C3N4 (CN) to improve electron-hole pair separation and stability during photocatalytic hydrogen evolution. Recently, we found an increased charge separation by the formation of a heterojunction between CN and AgIn5S8 (AIS), in which the latter formed non-uniform particles with sizes of up to 100 nm [28]. Moreover, triethanolamine was used as sacrificial agent in this case, which caused a structural alteration and migration of the Pt nanoparticles into the bulk phase of CN, leading to activity loss.
In this work, we used MoS2 since we expected that, due to its 2D structure, it may cover the CN surface with a thin layer rather than forming big particles, which could lead to a more effective heterojunction. Moreover, lactic acid was used instead of triethanolamine as sacrificial agent to prevent structural changes of the CN phase observed in basic medium. To this end, composites of different MoS2 (MS) phases with CN, 2H MS-CN and 1T MS-CN, have been synthesized by three different methods, i.e., photodeposition (PD), thermal decomposition (TD) and sonochemical (SC) treatment and tested in photocatalytic H2 production from water in the presence of lactic acid. The catalysts have been characterized by a variety of methods, comprising X-ray diffraction (XRD), scanning transmission electron microscopy with high-angle annular dark-field imaging (STEM-HAADF), X-ray photoelectron spectroscopy (XPS), and UV-vis-diffuse reflectance spectroscopy. Moreover, the charge separation and electron transfer during photocatalytic H2 production have been investigated by in situ-EPR and photoluminescence spectroscopy. Based on these investigations, the influence of the preparation procedure on the structural features and the catalytic performance of the materials is discussed.

2. Results and Discussion

2.1. Catalytic Activity

Figure 1a depicts the photocatalytic H2 production activity of MoS2-free Pt/CN in the presence of lactic acid under UV-vis light (black line), under only visible light (λ > 420 nm, blue line) and upon irradiation with λ > 420 nm after 4 h of UV-vis light irradiation (red line).
2.7 wt% Pt nanoparticles (NPs) were deposited as a cocatalyst on the surface of the photocatalysts by in situ photoreduction of H2PtCl6, since no photocatalytic activity was observed with pristine CN (Figure 1b). Pt/CN exhibits significantly higher photocatalytic activity under UV-vis than under pure visible light (2178.7 μmol h−1 g−1 compared to 333.7 μmol h−1 g−1, Figure 1a). This is due to the higher number of absorbed photons that excite more electrons from the valence to the conduction band [28]. Comparison of the blue and the red line in Figure 1a suggests that formation of Pt particles active for proton reduction under visible light is not a limiting factor since the slope of both curves is the same. Moreover, Pt/CN is stable under the acidic conditions used in this test, in contrast to previous tests performed with TEOA as sacrificial reagent [28].
As evident from Figure 1b, all composite catalysts showed remarkable H2 production activity within 24 h while no H2 evolution was observed with Pt/2H MS, for which the 2H phase MoS2 was prepared by a hydrothermal method (HT) without CN. While Pt/2H MS-CN (PD) exhibits a higher H2 production rate (2342 μmol h−1 g−1) than Pt/CN (2178.7 μmol h−1 g−1), the photocatalytic activity in the composite materials Pt/2H MS-CN (SC), Pt/1T MS-CN (SC) and Pt/2H MS-CN (TD) was lower than that of Pt/CN. This implies a considerable influence of the preparation procedure on the catalyst properties and in turn on the catalytic performance, which has been elucidated by thorough catalyst characterization (vide infra).

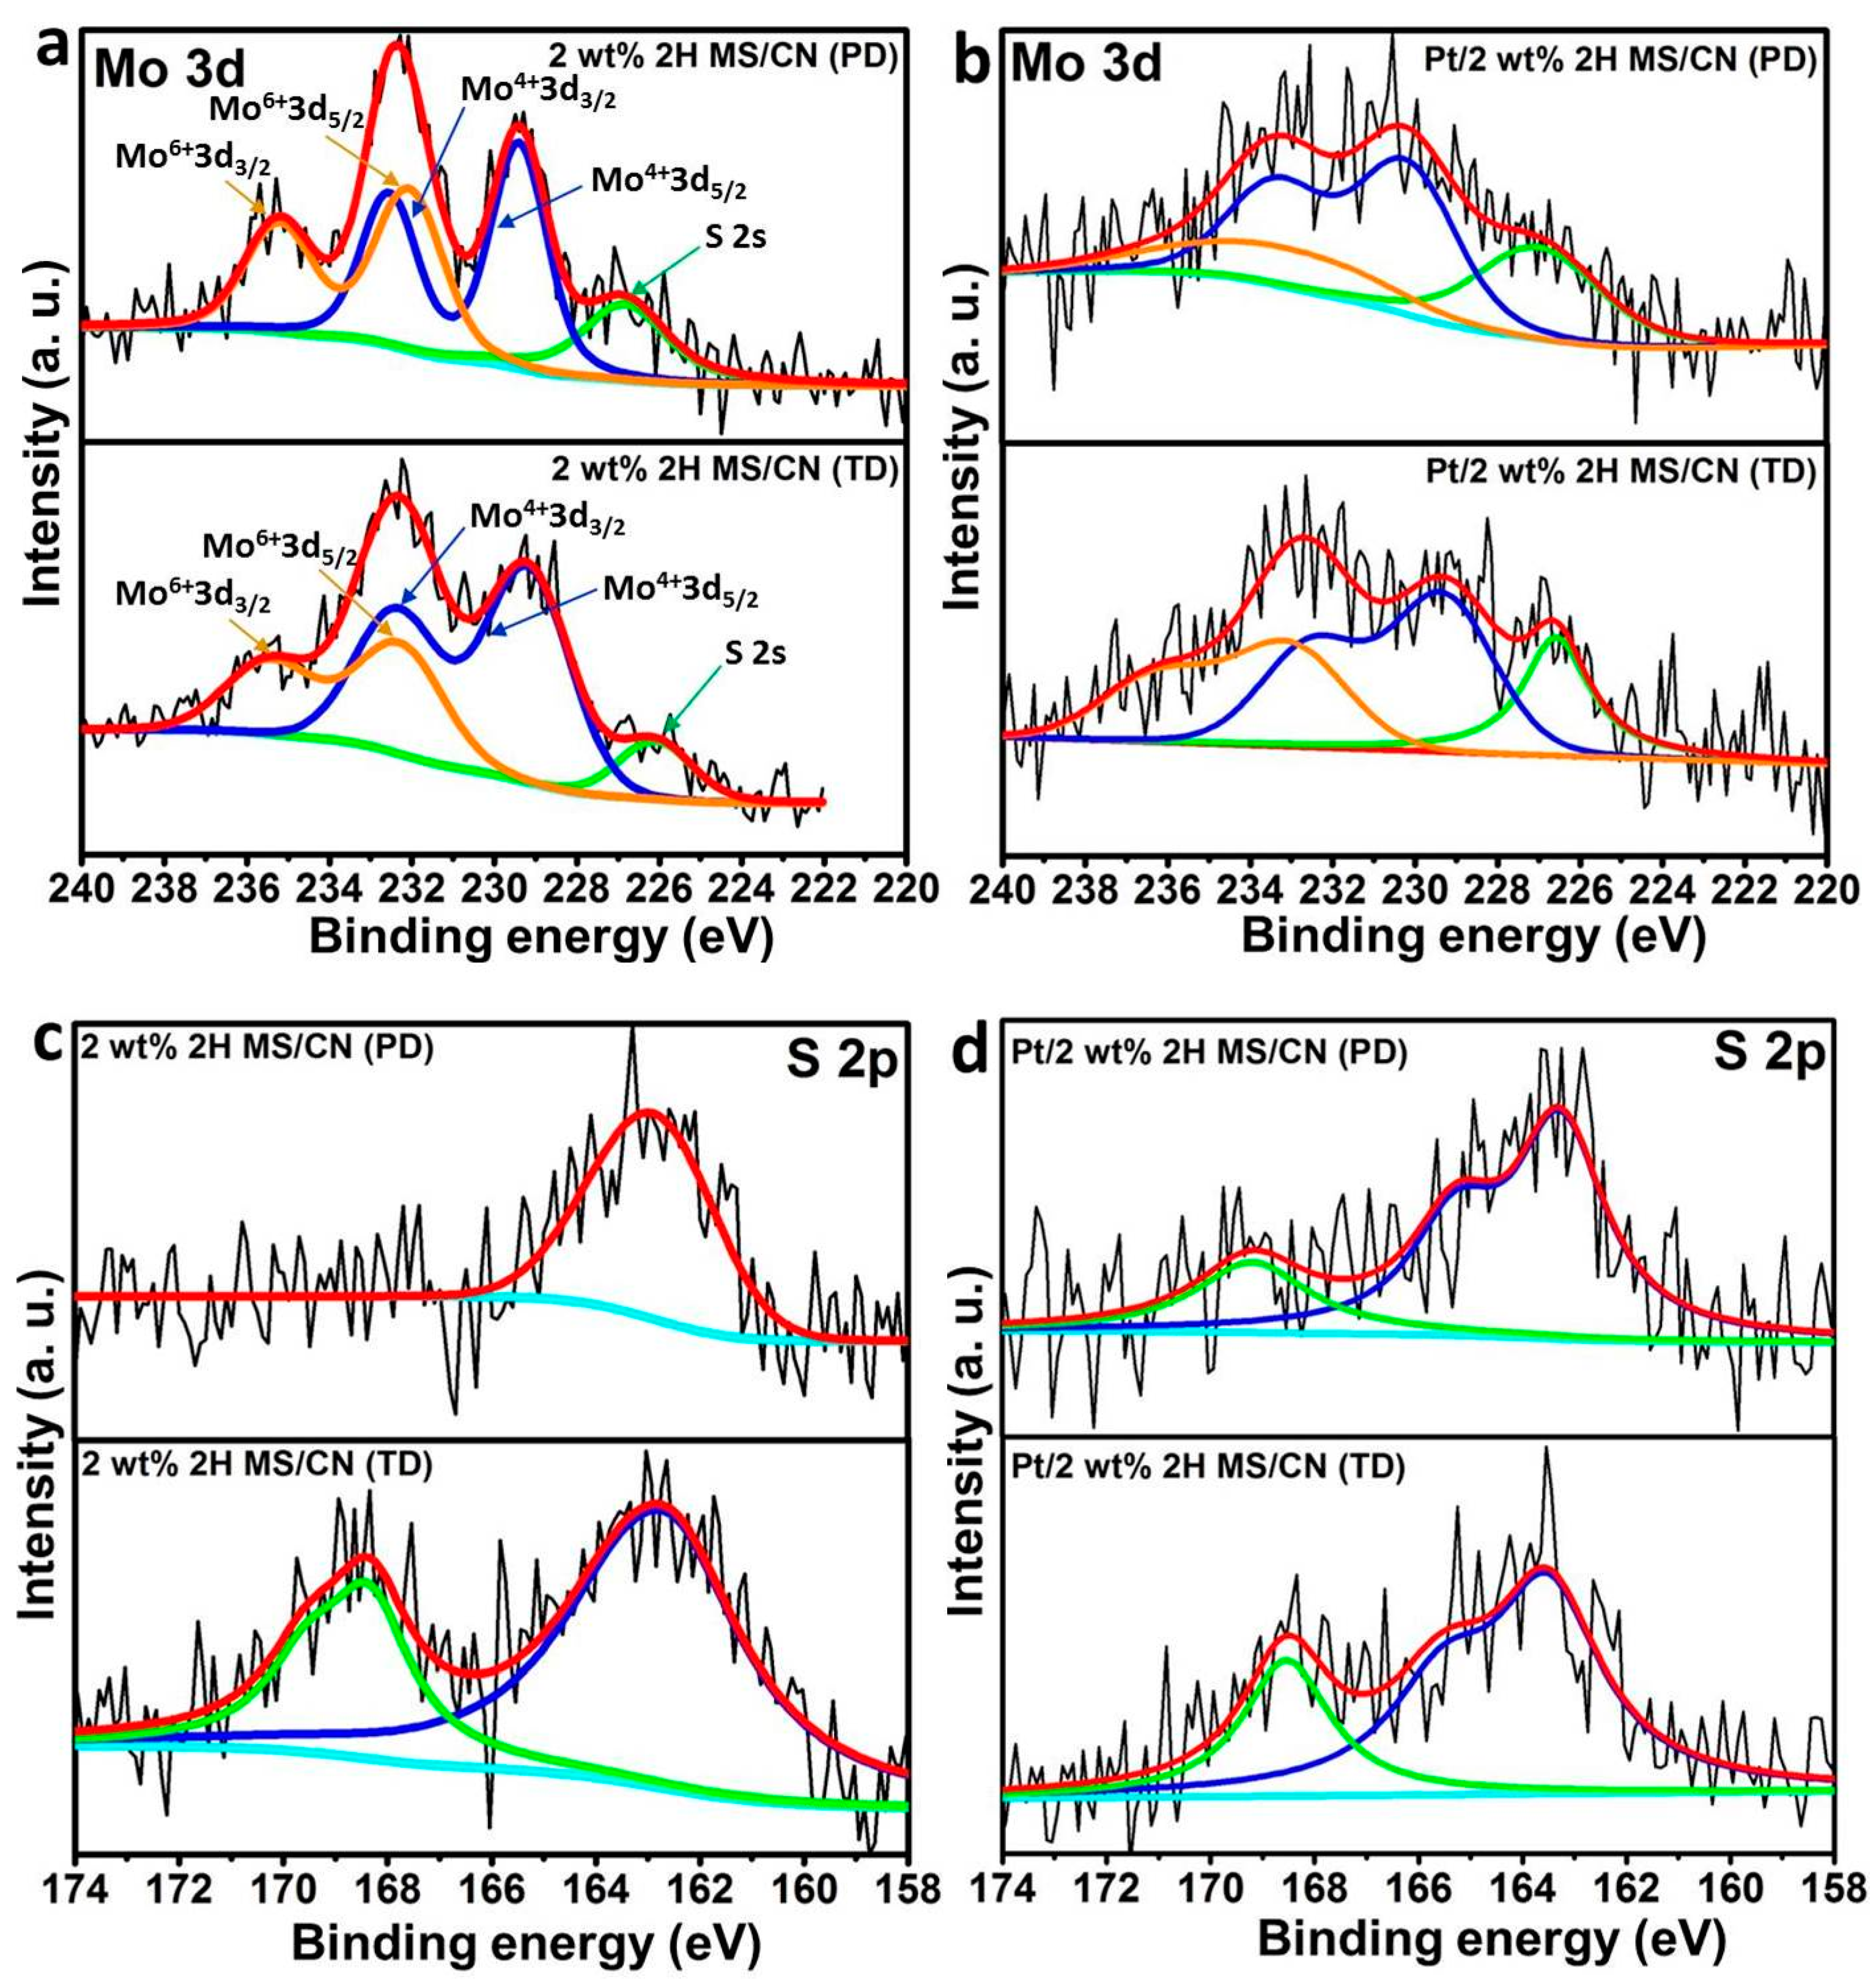
2.2. Characterization of Fresh and Used Catalysts

The powder XRD patterns of MoS2 prepared by solvothermal (ST), hydrothermal (HT) and thermal decomposition (TD) methods and of MS-CN composites are depicted in Figure 2a,b.
The 2H phase of MoS2 exhibits diffraction peaks at 14.1°, 32.9°, 39.5°, 43.3°, 49.4°, 58.8° and 69.2° which are attributed to the (002), (100), (103), (006), (105), (110) and (108) reflection planes of the hexagonal crystal system (ICDD: 01-075-1539) (Figure 2a) [26]. In the 1T MoS2 phase (ST), the (002) diffraction peak is shifted to a lower value of 2θ (9.9°) (Figure 2a) [29]. Pure CN exhibits two diffraction peaks for the interlayer stacking reflection of polymeric melon sheets (27.5°) and an in-plane structural motif between nitride pores (13.2°) (ICDD: 00-066-0813) (Figure 2b) [28,30]. The XRD patterns of the MS-CN composites show the main peaks of CN (Figure 2b). In the composites 2H MS-CN (SC) and 2H MS-CN (TD), the (002) peak of the 2H phase is superimposed on the (100) peak of CN at 13.2° leading to slight asymmetry. The powder XRD patterns of the used catalysts recovered after 6 h from the reaction mixture show a small diffraction peak at 2θ = 39.9° for Pt (111) confirming the in situ-photodeposition of Pt NPs (Figure S1) which was also evidenced by scanning transmission electron microscopy (STEM, vide infra). The (002) diffraction peak of 1T MS-CN (SC) at 2θ = 14.1° disappeared after 6 h use, possibly due to a phase transition from 1T to 2H MoS2 during the reaction [26] (compare Figure 2b and Figure S1).
The light absorption properties of as synthesized pure C3N4 and MS-CN composites were analyzed by diffuse reflectance UV-vis spectroscopy (Figure 3). Pure CN exhibits absorption wavelengths from UV to visible region up to 600 nm, indicating its ability to absorb visible light [28]. Pure MoS2 is black and absorbs light in the whole wavelength range (Figure S2). Hence, the color becomes darker when CN forms a composite with 2 wt% of MoS2 (Figure 3a). Surprisingly, a decrease of the absorption bands of CN is observed after loading of MoS2 on the surface of CN. This may be due to a shielding effect caused by wrapping of the MoS2 nanosheets around the CN nanosheets (see also STEM results below). Accordingly, absorbance of MS-CN composites in the range of 650–1000 nm increases slightly, which is related to MoS2 and has been also observed after loading of MoS2 on BiOI [31]. Moreover, the catalytically most active sample Pt/2H MS-CN (PD) (cf. Figure 1) shows the lowest decrease of the CN absorption band around 500 nm. The origin of this band is most likely due to an increase of the degree of polymerization and π-plane conjugation [32]. The presence of this band also indicates that determination of a quantum yield at a specific wavelength is an intricate issue because it does not reflect the absorption features and capability of a certain material at other wavelengths. However, for reasons of comparability we determined exemplarily the apparent quantum yield of Pt/2H MS-CN (SC) to be 1.49% at an irradiation wavelength of 415 nm. A more detailed discussion about this issue can be found in the supporting information.
STEM-HAADF micrographs of Pt/CN, recovered after 6 h reaction time show a uniform distribution of Pt NPs (single atoms, clusters and particles <5 nm) on the surface of CN (Figure 4a, Figure S3a plots l-r and Figure S5) which is similar to that observed for Pt/CN in the presence of TEOA as a sacrificial agent [28].
In the used composite Pt/2H MS-CN (PD) (Figure 4b and Figure S3b, plots l-r), bright areas of MoS2 can be seen in contact with less intense areas of C3N4. The MS phase consists of small units with a certain short range order (Figure S3b, plots m and r). These units agglomerate in a disordered manner as opposed to the structures achieved by the other preparation method. The Pt NPs are more or less equally distributed on the CN and MS phase with a slight tendency to be more enriched on the CN phase. This is also supported by EDX measurements (Figure S6). In the other three samples Pt/2H MS-CN (SC), Pt/1T MS-CN (SC) and Pt/2H MS-CN (TD) markedly larger MS particles are formed (Figure 4c–e and Figure S3c–e) in which even the layered crystalline structure of the 2H MoS2 phase can be seen (Figure 4c, Figures S3c and S4). This agrees well with the fact that the XRD patterns of sample Pt/2H MS-CN (SC) shows peak of the MS phase while these are not evident in sample Pt/2H MS-CN (PD). The formation of smaller and higher dispersed MS particles in sample Pt/2H MS-CN (PD) may have been promoted by the photodeposition procedure of MoS2 since this is known to create a very high dispersion of the photodeposited species [33]. The Pt NPs in samples Pt/2H MS-CN (SC), Pt/1T MS-CN (SC) and Pt/2H MS-CN (TD) are even more enriched on the CN phase while the MS phase contains much less Pt. This is also evident from EDX analysis (Figures S4 and S7–S9). This is different from our previously studied AgIn5S8/C3N4 composites, in which Pt NPs were deposited preferentially on the sulphide phase [28]. A possible reason may be too fast charge recombination in big MoS2 particles that hinders diffusion of photoexcited electrons to the surface of MoS2 where they would be needed to reduce the Pt4+ precursor to metallic particles. An indication for such fast charge recombination in MoS2 is also evident from PL measurements discussed below.
As shown in our previous work, the surface of the composites is prone to changes under photocatalytic conditions [28]. Therefore, we performed XPS analysis on the most active catalyst 2H MS-CN (PD) and the least active sample 2H MS-CN (TD) before and after use in the catalytic reaction, i.e., without and with deposited Pt particles to elucidate the surface elemental composition and valence states (Figure 5 and Figures S10–S13).
The 3d3/2 and 3d5/2 peaks of Mo4+ in the Mo 3d spectra of both samples fall at binding energies characteristic for the 2H phase of MoS2 (233.4 and 230.3 eV, Figure 5a) [34]. Besides, a Mo 3d doublet for Mo6+ is observed at 235.2 and 232.1 eV [34]. This arises most probably from partial oxidation of MoS2 to MoO3 at the surface [35]. There is not much difference between the Mo 3d spectra of both samples. Comparison of the experimental atomic percentages found by XPS with the theoretical values assuming a homogeneous elemental distribution in the whole sample shows that the relative proportion of Mo on the surface is almost the same as in the bulk phase, suggesting a similar distribution of Mo in the bulk and on the surface of both fresh samples (Table S3). This holds true also for the proportion of sulfur (S:Mo ratio) in the most active sample 2H MS-CN (PD). However, in the least active sample 2H MS-CN (TD) the surface S content is considerably higher. While the S 2p spectra of the former sample show only one peak around 163.5 eV associated with MoS2 [25,36], a second feature at about 169 eV is visible in the S 2p spectrum of sample 2H MS-CN (TD). This is characteristic of surface sulfate species, likely formed during preparation of 2H MS-CN (TD), which included a thermal decomposition step (Figure 5c). Though this was performed in argon, traces of oxygen might have promoted formation of surface sulfate that is also described in the literature [37].
After use in the photocatalytic reaction, the weight percentage of both Mo and S in the whole sample (determined by ICP-OES, Table S2) decreased. This indicates some leaching of Mo and, to a smaller extent, also of S during reaction. The decrease of Mo on the surface is especially pronounced, leading to a strong increase of the S:Mo surface ratio in the used catalysts (Table S3). Moreover, the sulfate XPS peak is more pronounced after use in sample Pt/2H MS-CN (TD) and it is stronger compared to the more active sample Pt/2H MS-CN (PD), in which this peak appears for the first time after use (Figure 5d). The oxidation of sulfur species during photocatalysis is not uncommon and also exploited e.g., in the photocatalytic oxidative desulfurization [37]. The formed sulfate, however, could interact with the surface Pt species and reduce their activity for proton reduction.
During the photocatalytic reaction, Pt is deposited on the surface of both samples. The Pt4f spectra in Figure S13 show signals from Pt0 (72.6 and 75.7 eV) and Pt2+ (74.9 and 77.7 eV). Interestingly, these values are somewhat higher compared with literature values for surfaces of bulk samples (71.1 and 74.4 eV for Pt0; 72.4 and 76.0 eV for Pt2+) [38]. This may be due to the very small particle size (evidenced also by TEM) [39,40,41,42]. Another reason for this may be strong metal-support interaction, which is known to induce shifts in binding energy values [43,44]. Such shifts have also been observed by other authors in related substrates [45,46,47,48]. The total surface Pt content is highest for the least active sample Pt/2H MS-CN (TD) (Table S3), suggesting that not every Pt center is catalytically active or accessible by the reactants. Comparing the TEM investigations, a partial coverage of CN by MoS2 particles may account for this. Interestingly, in the most active sample Pt/2H MS-CN (PD) the percentage of Pt2+ is by far lowest and the amount of surface Pt0 is somewhat higher than in Pt/CN. This suggests, that it might be the Pt0 centers that are active for hydrogen generation. On the other hand, the amount of Pt0 is highest in the least active sample Pt/2H MS/CN (TD). This suggests that the surface percentage of Pt0 is one of but not the only property that governs catalytic activity. It will be demonstrated below that the amount of reactive photolelectrons is another crucial factor for high photocatalytic performance (vide infra, EPR and photoluminescence spectroscopy).

2.3. Monitoring Charge Separation and Transfer

In our previous work we have shown that in situ-EPR spectroscopy is a unique method to analyze separation and transfer of photoexcited electrons in oxidic semiconductors [49] or carbon nitrides [15,28]. All C3N4 containing samples exhibit a narrow isotropic EPR signal with Lorentzian line shape at a g-value of 2.0047 already in the dark (Figure S15). This is attributed to single electrons that are trapped at surface sp2 carbon atoms of heptazine units [50]. Upon photoirradiation, more electrons are excited from the valence to the conduction band (formed of N 2p and C 2p orbitals, respectively [17]) and trapped at carbon defects [51]. This causes an intensity increase of this EPR signal, which is reversible upon light switch off due to the recombination of the charges (Figure 6a). Thus, the increase of the EPR signal intensity of bare CN under light irradiation (Figure 6b, open black circle) is a measure for the total number of electrons that can be excited and trapped in pure C3N4 while the EPR intensity after light switch-off (red open circle in Figure 6b) reflects electrons that do not immediately recombine.
As shown in Figure 1b, the photocatalytic H2 production activity is negligible when bare CN is used as photocatalyst. Therefore, Pt NPs were photodeposited on top of CN to provide active sites with sufficient potential for H2 production. To prove the impact of those Pt NPs on electron transfer during the photocatalytic reaction, Pt/CN has been removed from the photocatalytic reactor after 6 h and characterized by EPR spectroscopy with and without UV-vis irradiation. As can be seen in Figure 6b the EPR signal intensity of Pt/CN under light irradiation is much smaller than that of bare CN (compare the black hollow and solid circles). This is due to fast transfer of CB e from CN to Pt where they can react with H+ to give H2 [15].
When MoS2 is deposited on the surface of C3N4, a similar drop of the CB e EPR signal intensity is observed already without Pt NPs (hollow black circles in Figure 6b). This suggests that those electrons are quickly transferred via the phase boundary to MoS2. However, catalytic tests revealed that Pt-free MS-CN materials are not active in photocatalytic H2 evolution. This implies that exited electrons transferred from the conduction band of C3N4 to that of MoS2 return too quickly to the valence band of the latter so that they cannot be used for proton reduction, which is also supported by photoluminescence results discussed below.
Depositon of Pt NPs onto the MS-CN composites leads to a further drop of intensity, due to electron transfer from the CN and/or MS phase to Pt NPs (black solid circles in Figure 6b). This intensity drop is strongest, indicating the highest number of CB e transferred to Pt, for the most active sample Pt/2H MS-CN (PD) and decreases as catalytic activity is reduced (compare Figure 1b). A much smaller decrease in intensity is observed for the less active samples Pt/2H MS-CN (SC), Pt/1T MS-CN (SC) and Pt/2H MS-CN (TD). This implies a lower electron transfer from MS-CN to Pt.
Photoluminescence (PL) occurs upon recombination of photogenerated electrons and holes. It is therefore commonly employed to investigate the separation efficiency of photogenerated charge carriers [52]. The PL spectra of MoS2, CN and MS-CN composites after excitation at 370 nm are shown in Figure 7a.
It can be seen that pure CN exhibits a strong emission at 461 nm, which arrises from charge carrier recombination via the band gap, whereas the pure MoS2 samples show no PL, even though they absorb UV-vis light which in principle allows for the excitation of electrons from the valance to the conduction band. This implies a rather quick electron-hole recombination in the pure MoS2 samples so that no PL radiation is emitted. Upon loading of MoS2 onto CN, the PL emission peak intensity decreased, which is an indication for electron transfer from the conduction band of CN to that of MoS2 (Figure 7a). Similar observations have been made for other CN-based photocatalysts such as AgIn5S8/C3N4 [28], In2S3/g-C3N4 [53], ZnFe2O4/g-C3N4 [54], Cu2O/NaTaO3 [55], g-C3N4/NiFe-layered double hydroxide [56] and MoS2/g-C3N4 [57]. Upon deposition of Pt on top of the photocatalysts, the PL signal intensity decreased even further (Figure 7b). It seems thus to be very likely that the excited CB electrons are transferred from CN to Pt or from CN via MoS2 to Pt, respectively. As the reduction potential of Pt is sufficient to reduce protons, these electrons are able to form H2 from H+. As can be seen in both plots, the emission intensity decrease is highest in the case of (Pt/)2H MS-CN (PD) which is a further indication for effective electron transfer from the CB of CN directly or via MoS2 to Pt NPs. In the latter case, the electron transfer efficiency is hampered by fast charge carrier recombination in MoS2 (see PL spectra of pure MoS2 samples) only allowing increased charge transfer efficiency in the case of thin MoS2 layers as present in 2H MS-CN (PD).

3. Materials and Methods

3.1. Materials

Lactic acid solution, C3H6O3 (≥85% in H2O), l-cysteine, C3H7NO2S (≥98.5%) and Chloroplatinic acid solution, H2PtCl6 (8 wt% in H2O) were purchased from Sigma-Aldrich (Saint Louis, MO, USA). Ammonium tetrathiomolybdate, (NH4)2MoS4 (99.95%) and sodium molybdate dihydrate, NaMoO4·2H2O (99.5–103.0%) were purchased from Alfa Aesar (Ward Hill, MA, USA). Ammonium heptamolybdate tetrahydrate, (NH4)2Mo7O24·4H2O (≥99.0%) was purchased from Honeywell Fluka (Morristown, NJ, USA). Thiourea, CH4N2S (≥99%) was purchased from Carl Roth (Karlsruhe, Germany). N, N-Dimethylformamide, C3H7NO (99.8%) was purchased from Acros Organics. All chemicals were used without further purification except lactic acid solution and chloroplatinic acid solution. Both solutions were purged with Ar for 30 min to remove dissolved oxygen. Oxygen free water that was used in all experiments was prepared by distillation under exclusion of air. For drying of the materials an oven of Binder, Class 2.0 (Nominal temperature 300 °C) was used. For heating an UE200 oven of Memmert GmbH + Co. KG (Nominal temperature 300 °C) was applied. For sonication Elmasonic S 120 H with 220–240 V and an ultrosonic frequency (f) of 37 kHz was used. For thermal decomposition method, Carbolite, CTF 12/75/700 type tubular furnace was used (Maximum temperature 1200 °C).
Mesoporous C3N4 has been synthesized by a hard template method using tetraethyl orthosilicate (TEOS) as a hard template, as described previously [58].

3.2. Synthesis of MoS2/C3N4 Composites

3.2.1. Synthesis of 2 wt% 2H MoS2/C3N4 Composite by In Situ-Photodeposition Method (2H MS-CN (PD))

Ammonium tetrathiomolybdate (ATTM), (NH4)2MoS4 was used as precursor for MoS2 in situ-photodeposition [59]. A typical in situ-photodeposition process is given in Section 3.5 as the synthesis was performed in the same setup like the hydrogen evolution experiments. C3N4 (24.5 mg) and ATTM (NH4)2MoS4 (0.84 mg, 0.0032 mmol; theoretical loading amount of MoS2 is 2 wt% or 0.5 mg MoS2) were dispersed by sonication for 2 min in 25 mL of an aqueous solution containing 1.7 mL lactic acid. Before irradiation, the reactor was evacuated several times by applying vacuum and refilling with argon to remove oxygen. A 300 W Xe lamp with an output power of 1.5 W was applied to irradiate the sample and temperature was maintained at 25 °C. After 2 h, the reaction was stopped and the material was recovered by centrifugation. After washing it three times alternatingly with double distilled water and absolute ethanol, the material was dried at room temperature overnight.

3.2.2. Synthesis of 2 wt% 2H MoS2/C3N4 Composite by Sonochemical Method (2H MS-CN (SC))

For the synthesis of this material, 2H MoS2 has been prepared separately by a hydrothermal method (2H MS (HT)) [26]. In a typical procedure, ammonium heptamolybdate tetrahydrate, (NH4)6Mo7O24·4H2O (1.2359 g, 1.0 mmol) was dissolved in 35 mL deionized water by vigorous stirring for 1 h. Thiourea, CH4N2S (1.1418 g, 15.0 mmol), was dissolved separately in 35 mL deionized water by vigorous stirring for 1 h. These two reaction solutions were combined and stirred again for 30 min. Then, this reaction mixture (transparent solution) was transferred into a 100 mL Teflon-lined stainless steel autoclave and heated at 180 °C for 24 h in the heating oven, and cooled down to room temperature naturally. The black coloured product was collected by centrifugation, washed alternatingly with distilled water and absolute ethanol until the centrifugate became colourless and odorless (approx. 5–6 times each solvent). Finally, the obtained material was dried at 70 °C for 24 h in the heating oven.
For the synthesis of 2 wt% 2H MoS2/C3N4 composite (2H MS-CN (SC)), C3N4 (196 mg) was dispersed in 10 mL of absolute ethanol by stirring for 30 min and then sonicated for 30 min. In a separate flask, 2H MoS2 (HT) (4 mg) was dispersed in 5 mL of absolute ethanol by stirring for 30 min and then sonicated for 30 min. Then, the exfoliated C3N4 and 2H MoS2 solutions were combined and kept in an oil bath at 70 °C under stirring, until ethanol was evaporated completely. The obtained powder was ground by using mortar and pestle and then heated at 300 °C for 2 h under an Ar atmosphere (ramp rate 5 K/min.) in the tubular furnace [60,61].

3.2.3. Synthesis of 2 wt% 1T MoS2/C3N4 Composite by Sonochemical Method (1T MS-CN (SC))

For the synthesis of 1T MS-CN (SC), 1T MoS2 has been prepared separately by a solvothermal method using N, N-Dimethylformamide (DMF) as a solvent (1T MS (ST)) [29]. In a typical synthesis procedure, sodium molybdate dihydrate, Na2MoO4·2H2O (0.3630 g, 1.5 mmol) and l-cysteine, C3H7NO2S (0.608 g, 5.0 mmol) were dissolved in 70 mL of DMF/H2O 3/2 (v/v) under stirring for 1 h. The formed yellow coloured transparent solution was transferred into a 100 mL Teflon-lined stainless steel autoclave and then heated at 180 °C for 12 h in the heating oven and cooled down to room temperature naturally. The resulting black coloured product was centrifuged, washed alternatingly with distilled water and absolute ethanol for several times and then dried at 70 °C for 24 h in the heating oven.
For the synthesis of 2 wt% 1T MoS2/C3N4 composite (1T MS-CN (SC)), C3N4 (196 mg) was dispersed in 10 mL of absolute ethanol by stirring for 30 min and then sonicated for 30 min. In a separate flask, 1T MoS2 (ST) (4 mg) was dispersed in 10 mL of absolute ethanol by stirring for 2 h. Then, these two solutions were combined and stirred at room temperature until ethanol was evaporated and allowed to dry at room temperature for another 24 h. Finally, the material was ground by using mortar and pestle.

3.2.4. Synthesis of 2H MoS2 and 2 wt% 2H MoS2/C3N4 Composite by Thermal Decomposition (Impregnation) Method (2H MS-CN (TD))

For the synthesis of 2H MoS2 by a thermal decomposition method (2H MS (TD)) [62], ATTM (NH4)2MoS4 (200 mg, 0.77 mmol) was dispersed in 20 mL of absolute ethanol by vigorous stirring for 30 min and then sonicated for 1 h. This reaction solution was kept in an oil bath at 70 °C under stirring until complete evaporation of ethanol. The obtained black coloured powder was heated at 400 °C for 2 h under an Ar atmosphere (ramp rate 5 K/min.) in the tubular furnace. Finally, the material was ground by using mortar and pestle.
For the synthesis of 2 wt% 2H MoS2/C3N4 composite (2H MS-CN (TD)), C3N4 (196 mg) was dispersed in 10 mL of absolute ethanol by stirring for 30 min and then sonicated for 1 h. In a separate flask, ATTM (NH4)2MoS4 (6.5 mg, 0.025 mmol; theoretical loading amount of MoS2 is 2 wt% or 4 mg MoS2) was dispersed in 5 mL of absolute ethanol by stirring for 30 min and then sonicated for 1 h. Then, these two suspensions were combined and kept in an oil bath at 70 °C under stirring until complete evaporation of ethanol. The obtained powder was heated at 400 °C for 2 h under Ar atmosphere (ramp rate 5 K/min.) in the tubular furnace. Finally, the material was ground by using mortar and pestle.

3.3. Catalyst Characterization

XRD powder patterns were recorded on a Panalytical X’Pert diffractometer equipped with a Xcelerator detector using automatic divergence slits and Cu kα1/α2 radiation (40 kV, 40 mA; λ = 0.15406 nm, 0.154443 nm). Cu beta-radiation was excluded using a nickel filter foil. The measurements were performed in 0.0167° steps and 25 s of data collecting time per step. The samples were mounted on silicon zero background holders. The obtained intensities were converted from automatic to fixed divergence slits (0.25°) for further analysis. Peak positions and profile were fitted with Pseudo-Voigt function using the HighScore Plus software package (Panalytical). Phase identification was done by using the PDF-2 database of the International Center of Diffraction Data (ICDD).
Diffuse reflectance UV-vis spectra were collected with an AvaSpec 2048 fiber optical spectrometer (Avantes BV, Apeldoorn, Netherlands) equipped with an AvaLight-DHS light source and a FCR-19UV200-2-ME reflection probe. As white standard BaSO4 was employed. Each spectrum was acquired taking 24 to 27 accumulations with integration times between 18 and 22 ms.
Photoluminescence (PL) spectra were obtained by a Cary Eclipse Fluorescence spectrophotometer (Agilent Technologies Inc., Mulgrave, Australia) with an excitation wavelength of 370 nm.
STEM micrographs were obtained at 200 kV by a probe aberration corrected JEM-ARM200F transmission electron microscope (Jeol Ltd., Akishima, Japan). The microscope is equipped with a JED-2300 (JEOL) energy dispersive X-ray spectrometer (EDXS) for chemical analysis. The catalyst powder was dry deposited on a Cu grid (mesh 300) covered by a holey carbon film and transferred into the microscope.
The XPS (X-ray Photoelectron Spectroscopy) measurements were performed on an ESCALAB 220iXL (ThermoFisher Scientific, Waltham, MA, USA) with monochromated Al Kα radiation (E = 1486.6 eV). Samples are prepared on a stainless steel holder with conductive double sided adhesive carbon tape. The electron binding energies were obtained with charge compensation using a flood electron source and referenced to the C1s peak of C–C and C–H bonds at 284.8 eV. For quantitative analysis the peaks were deconvoluted with Gaussian-Lorentzian curves, the peak areas were divided by the transmission function of the spectrometer and a sensitivity factor obtained from the element specific Scofield factor.
The elemental bulk composition was determined using a Varian 715-ES ICP-emission spectrometer (Varian Deutschland GmbH, Darmstadt, Germany) and the Varian 720-ES Instrument software (Version 1.1, Varian Deutschland GmbH, Darmstadt, Germany).
A CHNS multianalyzer TruSpec (Leco) was used for the quantitative analysis of C, H and N. The catalyst (10 mg) was mixed with V2O5 as oxidation reagent and packed into a tin container, which is easily oxidizable. The reactor is heated to 1050 °C and the combustion products were quantified by the TCD at 290 °C.

3.4. In Situ Electron Paramagnetic Resonance Spectroscopy Studies

In situ-EPR measurements in X-band (microwave frequency ≈ 9.8 GHz) were performed at 300 K by an EMX CW-micro spectrometer (Bruker Biospin GmbH, Rheinstetten, Germany) equipped with an ER 4119HS-WI high-sensitivity optical resonator with a grid in the front side (Bruker Biospin GmbH, Rheinstetten, Germany). The samples were illuminated by a 300 W Xe lamp (LOT-QuantumDesign GmbH, Darmstadt, Germany). All the samples were measured under the same conditions (microwave power: 6.99 mW, receiver gain: 1 × 10⁴, modulation frequency: 100 kHz, modulation amplitude: 3 G, Sweep time: 122.8 s). g values have been calculated from the resonance field B0 and the resonance frequency ν using the resonance condition hν = gβB0. The calibration of the g values was performed using DPPH (2, 2-diphenyl-1-picrylhydrazyl) (g = 2.0036).

3.5. Photocatalytic Hydrogen Evolution Tests

All catalytic experiments were carried out under an argon atmosphere with fresh solvents. Catalytic tests were performed in a double walled and thermostatically controlled reaction vessel connected to an automatic gas burette (Figure S16). Before each experiment, the reactor was several times evacuated and filled with argon to remove air. In a typical experiment, the reactor was charged with 24.5 mg of catalyst and 0.2 mL of an aqueous stock solution of H2PtCl6, containing 0.5 mg Pt to achieve a nominal Pt loading of 2 wt% Pt. Then 24.8 mL of a mixture of water and lactic acid (LA, used as sacrificial agent) were added to obtain a final ratio of water/LA of 9/1 (v/v), and the temperature was maintained at 25 °C. After stirring for approximately 10 min to reach thermal equilibrium the reaction was started by switching the light source on. As light source a 300 W Xe lamp (LOT-QuantumDesign GmbH, Darmstadt, Germany) with an output power of 1.5 W was used. For working under visible light irradiation only, a 420 nm cut-off filter was applied. The amounts of evolved gases were continuously determined by an automatic gas burette, equipped with a pressure sensor. After each experiment, a 5 mL gas sample was taken from the burette and quantitatively analyzed by a GC HP 6890N gas chromatograph (Agilent Technologies Inc., Wilmington, DE, USA) equipped with a carboxen 1000 column and a thermal conductivity detector (TCD) and He as carrier gas. If necessary, recovery of the catalyst was done by centrifugation. For this purpose, the reaction was stopped after 6 h and the catalyst was centrifuged, washed 3 times with double distilled water and 3 times with absolute ethanol alternatingly, and was finally dried at room temperature overnight.

4. Conclusions

Pt/2H MS-CN (PD) showed the highest photocatalytic hydrogen production activity of all investigated MS-CN composites, and it is the only one in which deposition of MoS2 improves the performance of Pt/CN. This might be due to the fact that, in Pt/2H MS-CN (PD), MoS2 forms a very thin overlayer on C3N4 which does not hinder light absorption and charge separation in C3N4 nor charge transfer from the CB of C3N4 through the MoS2 layer to the Pt NPs. Rather it might be the case that this thin layer prevents fast charge recombination within C3N4. In samples Pt/2H MS-CN (SC), Pt/1T MS-CN (SC) and Pt/2H MS-CN (TD), which all revealed lower activity than sulfide-free Pt/CN, MoS2 is attached to C3N4 in form of big crystalline particles in which even lattice planes were detected by STEM. These particles might partially hinder absorption of visible light by C3N4 (evident from a decrease of the UV-vis band between 450 and 550 nm). Moreover, they hinder transfer of electrons from the CB of C3N4 to the Pt particles, as evidenced by in situ-EPR and photoluminescence results. Moreover, interaction with surface sulfate, the amount of which is highest in the least active sample Pt/2H MS-CN (TD), may lower the ability of Pt to reduce protons.
In summary, the beneficial performance of Pt/2H MS-CN (PD) is attributed to the formation of an effective heterojunction between the C3N4 surface and a thin MoS2 overlayer that enables an efficient electron transfer from CN via MoS2 to Pt.

Supplementary Materials

The following are available online at https://www.mdpi.com/2073-4344/9/8/695/s1, Table S1: Synthesis method, reaction conditions and H2 production rates of selected MoS2/C3N4 based photocatalysts, Table S2: Elemental composition of as-synthesized and used catalysts derived from CHNS and ICP-OES, Table S3: Surface elemental composition of as-synthesized and used catalysts derived from XPS, Table S4: Structural properties of as-prepared catalysts. Figure S1: XRD powder patterns of Pt/CN and Pt/MoS2-C3N4 composite catalysts removed from the reactor after 6 h irradiation under UV-vis light in the presence of lactic acid, Figure S2: DRS UV-vis spectra of 2H MoS2 (HT), 1T MoS2 (ST) and 2H MoS2 (TD), Figure S3: STEM high angle annular dark field (HAADF) micrographs of CN phase decorated with Pt (column l), high resolution HAADF (column m) and bright field (BF) micrographs (column r) of MoS2 phase (when present) in catalysts exposed to UV-vis irradiation for 6 h in the presence of lactic acid; Figure S4: High resolution STEM-HAADF image with corresponding FFT of Pt/2H MS-CN (SC), Figure S5: STEM-HAADF micrographs with corresponding EDX spectra of Pt/CN, Figure S6: STEM-HAADF micrographs with corresponding EDX spectra of Pt/2H MS-CN (PD), Figure S7: STEM-HAADF micrographs with corresponding EDX spectra of Pt/2H MS-CN (SC), Figure S8: STEM-HAADF micrographs with corresponding EDX spectra of Pt/1T MS-CN (SC), Figure S9: STEM-HAADF micrographs with corresponding EDX spectra of Pt/2H MS-CN (TD), Figure S10: XP spectra of C 1s: (a) Fresh catalysts; (b) Recovered catalysts after 6 h reaction, Figure S11: XP spectra of N 1s: (a) Fresh catalysts; (b) Recovered catalysts after 6 h reaction, Figure S12: XP spectra of O 1s: (a) Fresh catalysts; (b) Recovered catalysts after 6 h reaction, Figure S13: XP spectra of Pt 4f: Pt/CN, Pt/2H MS-CN (PD) and Pt/2H MS-CN (TD), Figure S14: (a) N2 adsorption-desorption isotherms of CN and 2H MS-CN (PD); (b) Barrett-Joyner-Halenda pore size distribution plot, Figure S15: EPR signal of as synthesized catalysts at 300 K without light irradiation, Figure S16: Experimental setup for photocatalytic H2 production.

Author Contributions

R.P.S. prepared the materials, performed the catalytic tests and wrote the manuscript, C.R.K., S.B. and H.L. performed and evaluated STEM, XPS and XRD experiments, respectively; A.A. and A.T. provided the pure carbon nitride; H.J. provided the setup for catalytic tests; N.R. and A.B. supervised the work, conceived the experiments and revised the manuscript.

Funding

This research was funded by the Open Access Fund of the Leibniz Association.

Acknowledgments

The authors thank R. Eckelt for performing N2 adsorption measurements, A. Simmula and A. Lehmann for ICP-OES and CHNS analysis, respectively, and P. Bartels for technical support with the catalytic tests.

Conflicts of Interest

The authors declare no conflict of interest.

References

  1. Armaroli, N.; Balzani, V. The future of energy supply: Challenges and opportunities. Angew. Chem. Int. Ed. 2007, 46, 52–66. [Google Scholar] [CrossRef] [PubMed]
  2. Takanabe, K.; Domen, K. Preparation of Inorganic Photocatalytic Materials for Overall Water Splitting. ChemCatChem 2012, 4, 1485–1497. [Google Scholar] [CrossRef]
  3. Lewis, N.S.; Nocera, D.G. Powering the planet: Chemical challenges in solar energy utilization. Proc. Natl. Acad. Sci. USA 2006, 103, 15729–15735. [Google Scholar] [CrossRef] [PubMed] [Green Version]
  4. Turner, J.A. Sustainable hydrogen production. Science 2004, 305, 972–974. [Google Scholar] [CrossRef] [PubMed]
  5. Colón, G. Towards the hydrogen production by photocatalysis. Appl. Catal. A Gen. 2016, 518, 48–59. [Google Scholar] [CrossRef]
  6. Li, X.; Yu, J.; Low, J.; Fang, Y.; Xiao, J.; Chen, X. Engineering heterogeneous semiconductors for solar water splitting. J. Mater. Chem. A 2015, 3, 2485–2534. [Google Scholar] [CrossRef]
  7. Kudo, A.; Miseki, Y. Heterogeneous photocatalyst materials for water splitting. Chem. Soc. Rev. 2009, 38, 253–278. [Google Scholar] [CrossRef] [PubMed]
  8. Chen, X.; Shen, S.; Guo, L.; Mao, S.S. Semiconductor-based Photocatalytic Hydrogen Generation. Chem. Rev. 2010, 110, 6503–6570. [Google Scholar] [CrossRef]
  9. Wang, R.; Gu, L.; Zhou, J.; Liu, X.; Teng, F.; Li, C.; Shen, Y.; Yuan, Y. Quasi-Polymeric Metal-Organic Framework UiO-66/g-C3N4 Heterojunctions for Enhanced Photocatalytic Hydrogen Evolution under Visible Light Irradiation. Adv. Mater. Interfaces 2015, 2, 1500037. [Google Scholar] [CrossRef]
  10. Han, X.B.; Li, Y.G.; Zhang, Z.M.; Tan, H.Q.; Lu, Y.; Wang, E.B. Polyoxometalate-based nickel clusters as visible light-driven water oxidation catalysts. J. Am. Chem. Soc. 2015, 137, 5486–5493. [Google Scholar] [CrossRef]
  11. Ong, W.-J.; Tan, L.-L.; Ng, Y.H.; Yong, S.-T.; Chai, S.-P. Graphitic Carbon Nitride (g-C3N4)-Based Photocatalysts for Artificial Photosynthesis and Environmental Remediation: Are We a Step Closer to Achieving Sustainability? Chem. Rev. 2016, 116, 7159–7329. [Google Scholar] [CrossRef] [PubMed]
  12. Reza Gholipour, M.; Dinh, C.T.; Beland, F.; Do, T.O. Nanocomposite heterojunctions as sunlight-driven photocatalysts for hydrogen production from water splitting. Nanoscale 2015, 7, 8187–8208. [Google Scholar] [CrossRef] [PubMed]
  13. Moniz, S.J.A.; Shevlin, S.A.; Martin, D.J.; Guo, Z.-X.; Tang, J. Visible-light driven heterojunction photocatalysts for water splitting a critical review. Energy Environ. Sci. 2015, 8, 731–759. [Google Scholar] [CrossRef]
  14. Marschall, R. Semiconductor Composites: Strategies for Enhancing Charge Carrier Separation to Improve Photocatalytic Activity. Adv. Funct. Mater. 2014, 24, 2421–2440. [Google Scholar] [CrossRef]
  15. Hollmann, D.; Karnahl, M.; Tschierlei, S.; Kailasam, K.; Schneider, M.; Radnik, J.; Grabow, K.; Bentrup, U.; Junge, H.; Beller, M.; et al. Structure-Activity Relationships in Bulk Polymeric and Sol–Gel-Derived Carbon Nitrides during Photocatalytic Hydrogen Production. Chem. Mater. 2014, 26, 1727–1733. [Google Scholar] [CrossRef]
  16. Wang, X.; Blechert, S.; Antonietti, M. Polymeric Graphitic Carbon Nitride for Heterogeneous Photocatalysis. ACS Catal. 2012, 2, 1596–1606. [Google Scholar] [CrossRef]
  17. Wang, X.; Maeda, K.; Thomas, A.; Takanabe, K.; Xin, G.; Carlsson, J.M.; Domen, K.; Antonietti, M. A metal-free polymeric photocatalyst for hydrogen production from water under visible light. Nat. Mater. 2009, 8, 76–80. [Google Scholar] [CrossRef] [PubMed]
  18. Zhang, S.; Li, J.; Wang, X.; Huang, Y.; Zeng, M.; Xu, J. Rationally designed 1D Ag@AgVO3 nanowire/graphene/protonated g-C3N4 nanosheet heterojunctions for enhanced photocatalysis via electrostatic self-assembly and photochemical reduction methods. J. Mater. Chem. A 2015, 3, 10119–10126. [Google Scholar] [CrossRef]
  19. Yin, S.; Han, J.; Zhou, T.; Xu, R. Recent progress in g-C3N4 based low cost photocatalytic system: Activity enhancement and emerging applications. Catal. Sci. Technol. 2015, 5, 5048–5061. [Google Scholar] [CrossRef]
  20. Wang, H.; Zhang, L.; Chen, Z.; Hu, J.; Li, S.; Wang, Z.; Liu, J.; Wang, X. Semiconductor heterojunction photocatalysts: Design, construction, and photocatalytic performances. Chem. Soc. Rev. 2014, 43, 5234–5244. [Google Scholar] [CrossRef]
  21. Jiang, D.; Li, J.; Xing, C.; Zhang, Z.; Meng, S.; Chen, M. Two-Dimensional CaIn2S4/g-C3N4 Heterojunction Nanocomposite with Enhanced Visible-Light Photocatalytic Activities: Interfacial Engineering and Mechanism Insight. ACS Appl. Mater. Interfaces 2015, 7, 19234–19242. [Google Scholar] [CrossRef] [PubMed]
  22. Zhang, Z.; Huang, J.; Zhang, M.; Yuan, Q.; Dong, B. Ultrathin hexagonal SnS2 nanosheets coupled with g-C3N4 nanosheets as 2D/2D heterojunction photocatalysts toward high photocatalytic activity. Appl. Catal. B Environ. 2015, 163, 298–305. [Google Scholar] [CrossRef]
  23. Hou, Y.; Wen, Z.; Cui, S.; Guo, X.; Chen, J. Constructing 2D porous graphitic C3N4 nanosheets/nitrogen-doped graphene/layered MoS2 ternary nanojunction with enhanced photoelectrochemical activity. Adv. Mater. 2013, 25, 6291–6297. [Google Scholar] [CrossRef] [PubMed]
  24. Wu, C.; Fang, Q.; Liu, Q.; Liu, D.; Wang, C.; Xiang, T.; Khalil, A.; Chen, S.; Song, L. Engineering interfacial charge-transfer by phase transition realizing enhanced photocatalytic hydrogen evolution activity. Inorg. Chem. Front. 2017, 4, 663–667. [Google Scholar] [CrossRef]
  25. Lei, Z.; Zhan, J.; Tang, L.; Zhang, Y.; Wang, Y. Recent Development of Metallic (1T) Phase of Molybdenum Disulfide for Energy Conversion and Storage. Adv. Energy Mater. 2018, 8, 1703482. [Google Scholar] [CrossRef]
  26. Liu, Q.; Li, X.; He, Q.; Khalil, A.; Liu, D.; Xiang, T.; Wu, X.; Song, L. Gram-Scale Aqueous Synthesis of Stable Few-Layered 1T-MoS2: Applications for Visible-Light-Driven Photocatalytic Hydrogen Evolution. Small 2015, 11, 5556–5564. [Google Scholar] [CrossRef] [PubMed]
  27. Zeng, M.; Li, Y. Recent advances in heterogeneous electrocatalysts for the hydrogen evolution reaction. J. Mater. Chem. A 2015, 3, 14942–14962. [Google Scholar] [CrossRef]
  28. Sivasankaran, R.; Rockstroh, N.; Hollmann, D.; Kreyenschulte, C.; Agostini, G.; Lund, H.; Acharjya, A.; Rabeah, J.; Bentrup, U.; Junge, H.; et al. Relations between Structure, Activity and Stability in C3N4 Based Photocatalysts Used for Solar Hydrogen Production. Catalysts 2018, 8, 52. [Google Scholar] [CrossRef]
  29. Wu, M.; Zhan, J.; Wu, K.; Li, Z.; Wang, L.; Geng, B.; Wang, L.; Pan, D. Metallic 1T MoS2 nanosheet arrays vertically grown on activated carbon fiber cloth for enhanced Li-ion storage performance. J. Mater. Chem. A 2017, 5, 14061–14069. [Google Scholar] [CrossRef]
  30. Tyborski, T.; Merschjann, C.; Orthmann, S.; Yang, F.; Lux-Steiner, M.C.; Schedel-Niedrig, T. Crystal structure of polymeric carbon nitride and the determination of its process-temperature-induced modifications. J. Phys. Condens. Matter 2013, 25, 395402. [Google Scholar] [CrossRef] [PubMed] [Green Version]
  31. Li, X.; Xia, J.; Zhu, W.; Di, J.; Wang, B.; Yin, S.; Chen, Z.; Li, H. Facile synthesis of few-layered MoS2 modified BiOI with enhanced visible-light photocatalytic activity. Colloids Surf. A Physico. Eng. Asp. 2016, 511, 1–7. [Google Scholar] [CrossRef]
  32. Mo, Z.; She, X.; Li, Y.; Liu, L.; Huang, L.; Chen, Z.; Zhang, Q.; Xu, H.; Li, H. Synthesis of g-C3N4 at different temperatures for superior visible/UV photocatalytic performance and photoelectrochemical sensing of MB solution. RSC Adv. 2015, 5, 101552–101562. [Google Scholar] [CrossRef]
  33. Wenderich, K.; Mul, G. Methods, Mechanism, and Applications of Photodeposition in Photocatalysis: A Review. Chem. Rev. 2016, 116, 14587–14619. [Google Scholar] [CrossRef] [PubMed]
  34. Xiang, T.; Fang, Q.; Xie, H.; Wu, C.; Wang, C.; Zhou, Y.; Liu, D.; Chen, S.; Khalil, A.; Tao, S.; et al. Vertical 1T-MoS2 nanosheets with expanded interlayer spacing edged on a graphene frame for high rate lithium-ion batteries. Nanoscale 2017, 9, 6975–6983. [Google Scholar] [CrossRef] [PubMed]
  35. Atkinson, I.B.; Swift, P. A study of the tribo-chemical oxidation of molybdenum disulphide using X-ray photo-electron spectroscopy. Wear 1974, 29, 129–133. [Google Scholar] [CrossRef]
  36. Liu, Q.; Fang, Q.; Chu, W.; Wan, Y.; Li, X.; Xu, W.; Habib, M.; Tao, S.; Zhou, Y.; Liu, D.; et al. Electron-Doped 1T-MoS2 via Interface Engineering for Enhanced Electrocatalytic Hydrogen Evolution. Chem. Mater. 2017, 29, 4738–4744. [Google Scholar] [CrossRef]
  37. Afanasiev, P.; Lorentz, C. Oxidation of Nanodispersed MoS2 in Ambient Air: The Products and the Mechanistic Steps. J. Phys. Chem. C 2019, 123, 7486–7494. [Google Scholar] [CrossRef]
  38. Chen, X.; Zhang, L.; Zhang, B.; Guo, X.; Mu, X. Highly selective hydrogenation of furfural to furfuryl alcohol over Pt nanoparticles supported on g-C3N4 nanosheets catalysts in water. Sci. Rep. 2016, 6, 28558. [Google Scholar] [CrossRef]
  39. Garbarino, S.; Pereira, A.; Hamel, C.; Irissou, É.; Chaker, M.; Guay, D. Effect of Size on the Electrochemical Stability of Pt Nanoparticles Deposited on Gold Substrate. J. Phys. Chem. C 2010, 114, 2980–2988. [Google Scholar] [CrossRef]
  40. Isaifan, R.J.; Ntais, S.; Baranova, E.A. Particle size effect on catalytic activity of carbon-supported Pt nanoparticles for complete ethylene oxidation. Appl. Catal. A Gen. 2013, 464, 87–94. [Google Scholar] [CrossRef]
  41. Marcus, P.; Hinnen, C. XPS study of the early stages of deposition of Ni, Cu and Pt on HOPG. Surf. Sci. 1997, 392, 134–142. [Google Scholar] [CrossRef]
  42. Mason, M.G. Electronic structure of supported small metal clusters. Phys. Rev. B 1983, 27, 748–762. [Google Scholar] [CrossRef]
  43. Espinós, J.P.; Morales, J.; Barranco, A.; Caballero, A.; Holgado, J.P.; González-Elipe, A.R. Interface Effects for Cu, CuO, and Cu2O Deposited on SiO2 and ZrO2. XPS Determination of the Valence State of Copper in Cu/SiO2 and Cu/ZrO2 Catalysts. J. Phys. Chem. B 2002, 106, 6921–6929. [Google Scholar] [CrossRef]
  44. Morales, J.; Espinos, J.P.; Caballero, A.; Gonzalez-Elipe, A.R.; Mejias, J.A. XPS Study of Interface and Ligand Effects in Supported Cu2O and CuO Nanometric Particles. J. Phys. Chem. B 2005, 109, 7758–7765. [Google Scholar] [CrossRef] [PubMed]
  45. Jang, J.S.; Choi, S.H.; Kim, H.G.; Lee, J.S. Location and State of Pt in Platinized CdS/TiO2 Photocatalysts for Hydrogen Production from Water under Visible Light. J. Phys. Chem. C 2008, 112, 17200–17205. [Google Scholar] [CrossRef]
  46. Zhang, G.; Lan, Z.-A.; Lin, L.; Lin, S.; Wang, X. Overall water splitting by Pt/g-C3N4 photocatalysts without using sacrificial agents. Chem. Sci. 2016, 7, 3062–3066. [Google Scholar] [CrossRef] [PubMed]
  47. Zheng, D.; Huang, C.; Wang, X. Post-annealing reinforced hollow carbon nitride nanospheres for hydrogen photosynthesis. Nanoscale 2015, 7, 465–470. [Google Scholar] [CrossRef] [PubMed]
  48. Xue, J.; Ma, S.; Zhou, Y.; Zhang, Z.; He, M. Facile Photochemical Synthesis of Au/Pt/g-C3N4 with Plasmon-Enhanced Photocatalytic Activity for Antibiotic Degradation. ACS Appl. Mater. Interfaces 2015, 7, 9630–9637. [Google Scholar] [CrossRef] [PubMed]
  49. Priebe, J.B.; Radnik, J.; Lennox, A.J.J.; Pohl, M.-M.; Karnahl, M.; Hollmann, D.; Grabow, K.; Bentrup, U.; Junge, H.; Beller, M.; et al. Solar Hydrogen Production by Plasmonic Au-TiO2 Catalysts: Impact of Synthesis Protocol and TiO2 Phase on Charge Transfer Efficiency and H2 Evolution Rates. ACS Catal. 2015, 5, 2137–2148. [Google Scholar] [CrossRef]
  50. Zhang, J.; Zhang, G.; Chen, X.; Lin, S.; Mohlmann, L.; Dolega, G.; Lipner, G.; Antonietti, M.; Blechert, S.; Wang, X. Co-monomer control of carbon nitride semiconductors to optimize hydrogen evolution with visible light. Angew. Chem. 2012, 51, 3183–3187. [Google Scholar] [CrossRef]
  51. Li, T.; Zhao, L.; He, Y.; Cai, J.; Luo, M.; Lin, J. Synthesis of g-C3N4/SmVO4 composite photocatalyst with improved visible light photocatalytic activities in RhB degradation. Appl. Catal. B Environ. 2013, 129, 255–263. [Google Scholar] [CrossRef]
  52. Miyashita, K.; Kuroda, S.-I.; Tajima, S.; Takehira, K.; Tobita, S.; Kubota, H. Photoluminescence study of electron–hole recombination dynamics in the vacuum-deposited SiO2/TiO2 multilayer film with photo-catalytic activity. Chem. Phys. Lett. 2003, 369, 225–231. [Google Scholar] [CrossRef]
  53. Xing, C.; Wu, Z.; Jiang, D.; Chen, M. Hydrothermal synthesis of In2S3/g-C3N4 heterojunctions with enhanced photocatalytic activity. J. Colloid Interface Sci. 2014, 433, 9–15. [Google Scholar] [CrossRef] [PubMed]
  54. Chen, J.; Shen, S.; Guo, P.; Wu, P.; Guo, L. Spatial engineering of photo-active sites on g-C3N4 for efficient solar hydrogen generation. J. Mater. Chem. A 2014, 2, 4605–4612. [Google Scholar] [CrossRef]
  55. Fan, M.; Hu, B.; Yan, X.; Song, C.; Chen, T.; Feng, Y.; Shi, W. Excellent visible-light-driven photocatalytic performance of Cu2O sensitized NaNbO3 heterostructures. New J. Chem. 2015, 39, 6171–6177. [Google Scholar] [CrossRef]
  56. Nayak, S.; Mohapatra, L.; Parida, K. Visible light-driven novel g-C3N4/NiFe-LDH composite photocatalyst with enhanced photocatalytic activity towards water oxidation and reduction reaction. J. Mater. Chem. A 2015, 3, 18622–18635. [Google Scholar] [CrossRef]
  57. Jin, X.; Fan, X.; Tian, J.; Cheng, R.; Li, M.; Zhang, L. MoS2 quantum dot decorated g-C3N4 composite photocatalyst with enhanced hydrogen evolution performance. RSC Adv. 2016, 6, 52611–52619. [Google Scholar] [CrossRef]
  58. Kailasam, K.; Epping, J.D.; Thomas, A.; Losse, S.; Junge, H. Mesoporous carbon nitride-silica composites by a combined sol-gel/thermal condensation approach and their application as photocatalysts. Energy Environ. Sci. 2011, 4, 4668. [Google Scholar] [CrossRef]
  59. Nguyen, M.; Tran, P.D.; Pramana, S.S.; Lee, R.L.; Batabyal, S.K.; Mathews, N.; Wong, L.H.; Graetzel, M. In situ photo-assisted deposition of MoS2 electrocatalyst onto zinc cadmium sulphide nanoparticle surfaces to construct an efficient photocatalyst for hydrogen generation. Nanoscale 2013, 5, 1479–1482. [Google Scholar] [CrossRef]
  60. Li, J.; Liu, E.; Ma, Y.; Hu, X.; Wan, J.; Sun, L.; Fan, J. Synthesis of MoS2/g-C3N4 nanosheets as 2D heterojunction photocatalysts with enhanced visible light activity. Appl. Surf. Sci. 2016, 364, 694–702. [Google Scholar] [CrossRef]
  61. Ge, L.; Han, C.; Xiao, X.; Guo, L. Synthesis and characterization of composite visible light active photocatalysts MoS2-g-C3N4 with enhanced hydrogen evolution activity. Int. J. Hydrogen Energy 2013, 38, 6960–6969. [Google Scholar] [CrossRef]
  62. Dai, W.; Yu, J.; Deng, Y.; Hu, X.; Wang, T.; Luo, X. Facile synthesis of MoS2/Bi2WO6 nanocomposites for enhanced CO2 photoreduction activity under visible light irradiation. Appl. Surf. Sci. 2017, 403, 230–239. [Google Scholar] [CrossRef]
Figure 1. Photocatalytic H2 production of MoS2-free Pt/CN as a function of time in the presence of lactic acid: (a) under UV-vis light (black), under visible light (λ > 420 nm, blue) and with a 420 nm cut-off filter inserted after 4 h irradiation under UV-vis light (red); (b) for differently prepared MS-CN composites under UV-vis light irradiation. Reaction conditions: 24.5 mg CN or MS-CN, 0.2 mL of a H2PtCl6 stock solution equal to 0.5 mg Pt, 24.8 mL H2O/lactic acid (final ratio 9/1 (v/v)), 25 °C, 1.5 W light power (Xe lamp) without (UV-vis) or with (vis) a 420 nm cut-off filter.
Catalysts 09 00695 g001
Figure 2. XRD powder patterns of (a) 1T MoS2 (ST), 2H MoS2 (SC), 2H MoS2 (TD) and (NH4) MoS4; (b) pure CN and differently prepared MS-CN composites.
Catalysts 09 00695 g002
Figure 3. (a) UV-vis-DR spectra of pure CN and MS-CN composites together with photographs of (I) CN, (II) 2H MS-CN (PD), (III) 2H MS-CN (SC), (IV) 1T MS-CN (SC), (V) 2H MS-CN (TD); (b) Band gap estimation from Tauc equation.
Catalysts 09 00695 g003
Figure 4. STEM-high angle annular dark field (HAADF) micrographs of catalysts exposed to UV-vis irradiation for 6 h in the presence of lactic acid. (a) Pt/CN, (b) Pt/2H MS-CN (PD), (c) Pt/2H MS-CN (SC), (d) Pt/1T MS-CN (SC), (e) Pt/2H MS-CN (TD).
Catalysts 09 00695 g004
Figure 5. XP spectra of 2H MS-CN (PD) and 2H MS-CN (TD) in the Mo 3d and S 2p region before (a,c) and after 6 h of reaction (b,d).
Catalysts 09 00695 g005
Figure 6. (a) Electron paramagnetic resonance (EPR) spectra of as-prepared catalysts during UV-vis light irradiation (solid lines) and after light switch-off (dashed lines). (b) Double integral of the EPR CB e signal (initial background signal in the dark was subtracted) during UV-vis light irradiation (black circles) and after light switched-off (red circles). Hollow and solid circles represent fresh bare supports (without Pt NPs) and used catalysts (with Pt NPs), respectively.
Catalysts 09 00695 g006
Figure 7. Photoluminescence spectra of (a) the as-synthesized catalysts; (b) recovered Pt containing catalysts after 6 h under UV-vis light irradiation.
Catalysts 09 00695 g007

