CoSe2 Clusters as Efficient Co-Catalyst Modified CdS Nanorod for Enhance Visible Light Photocatalytic H2 Evolution


Abstract
:1. Introduction
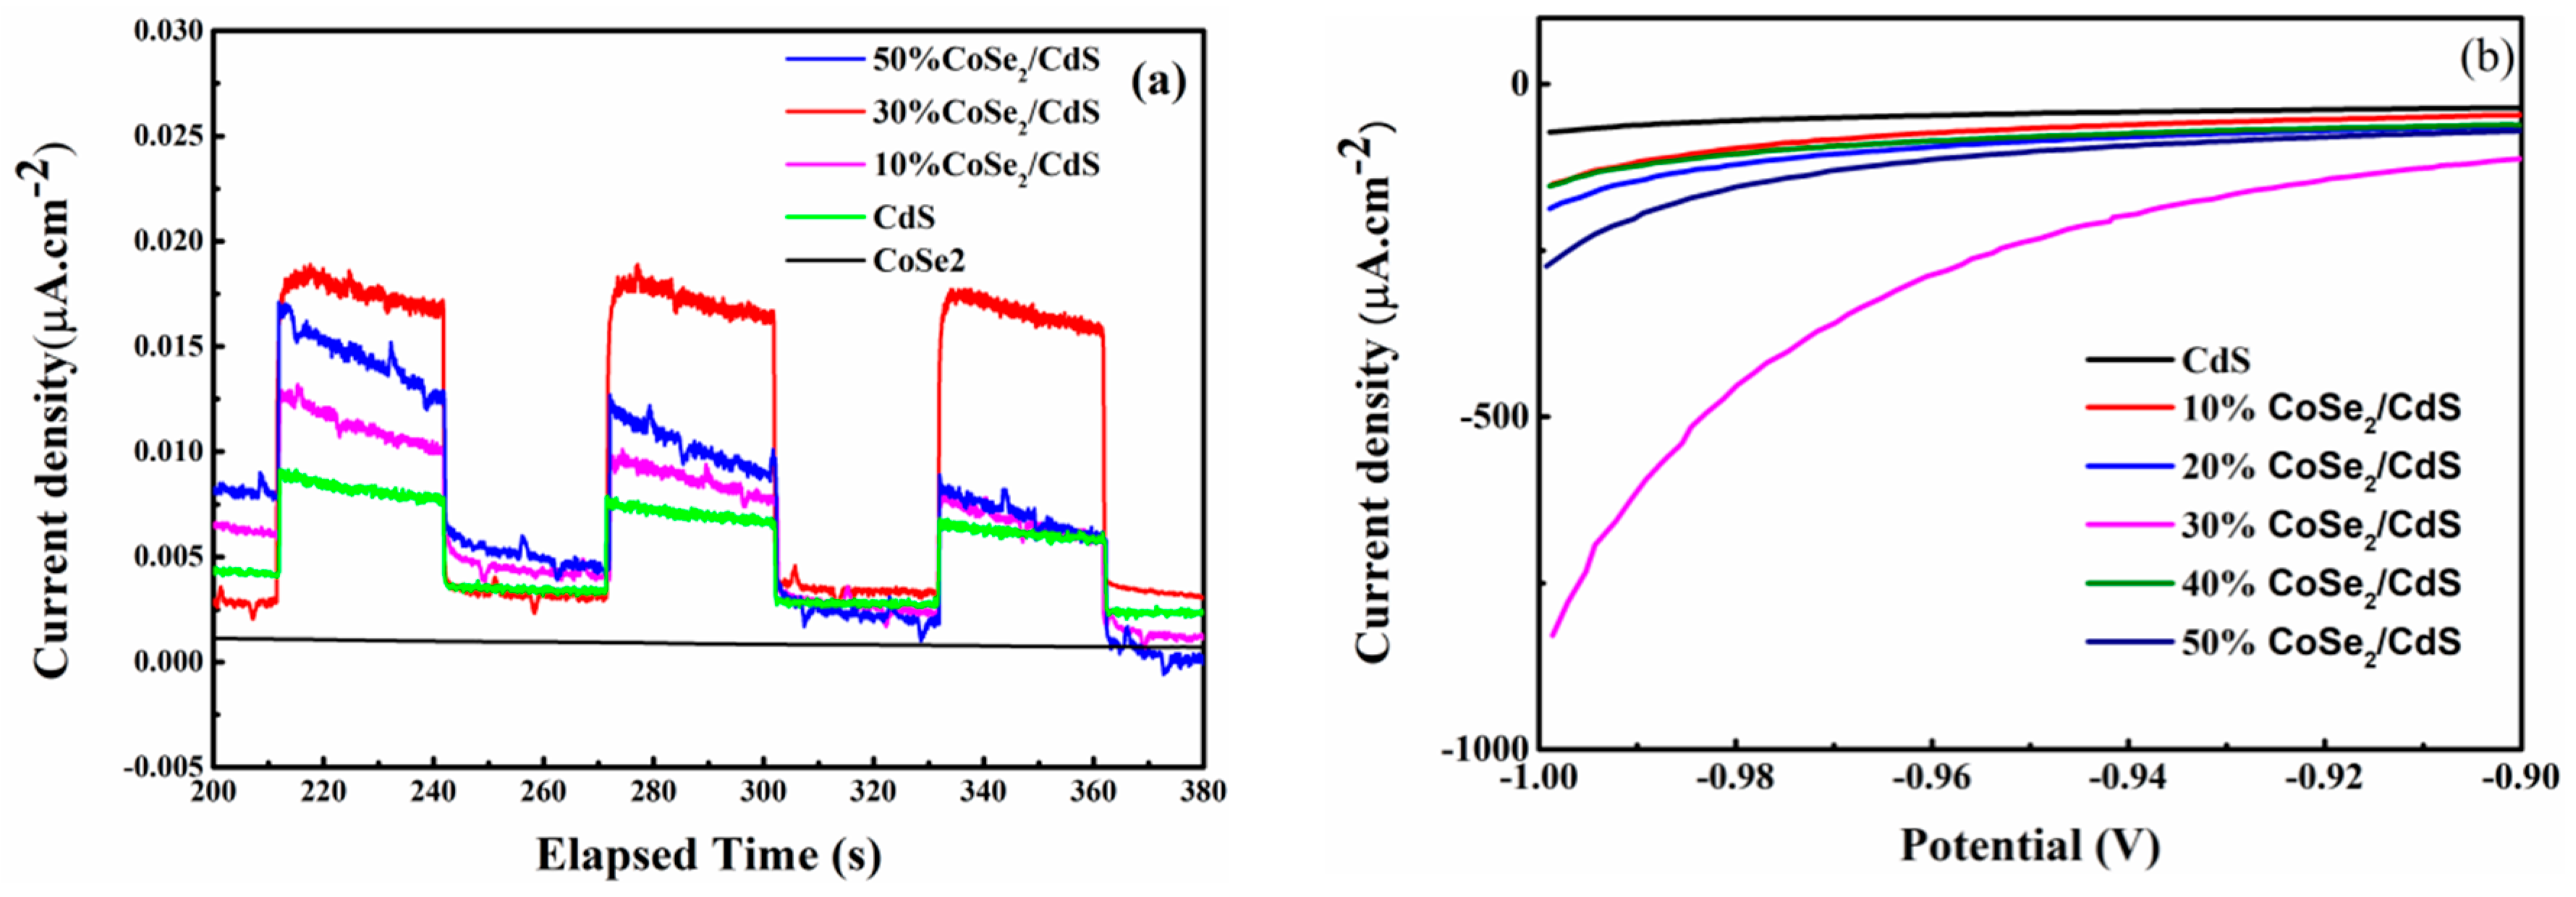
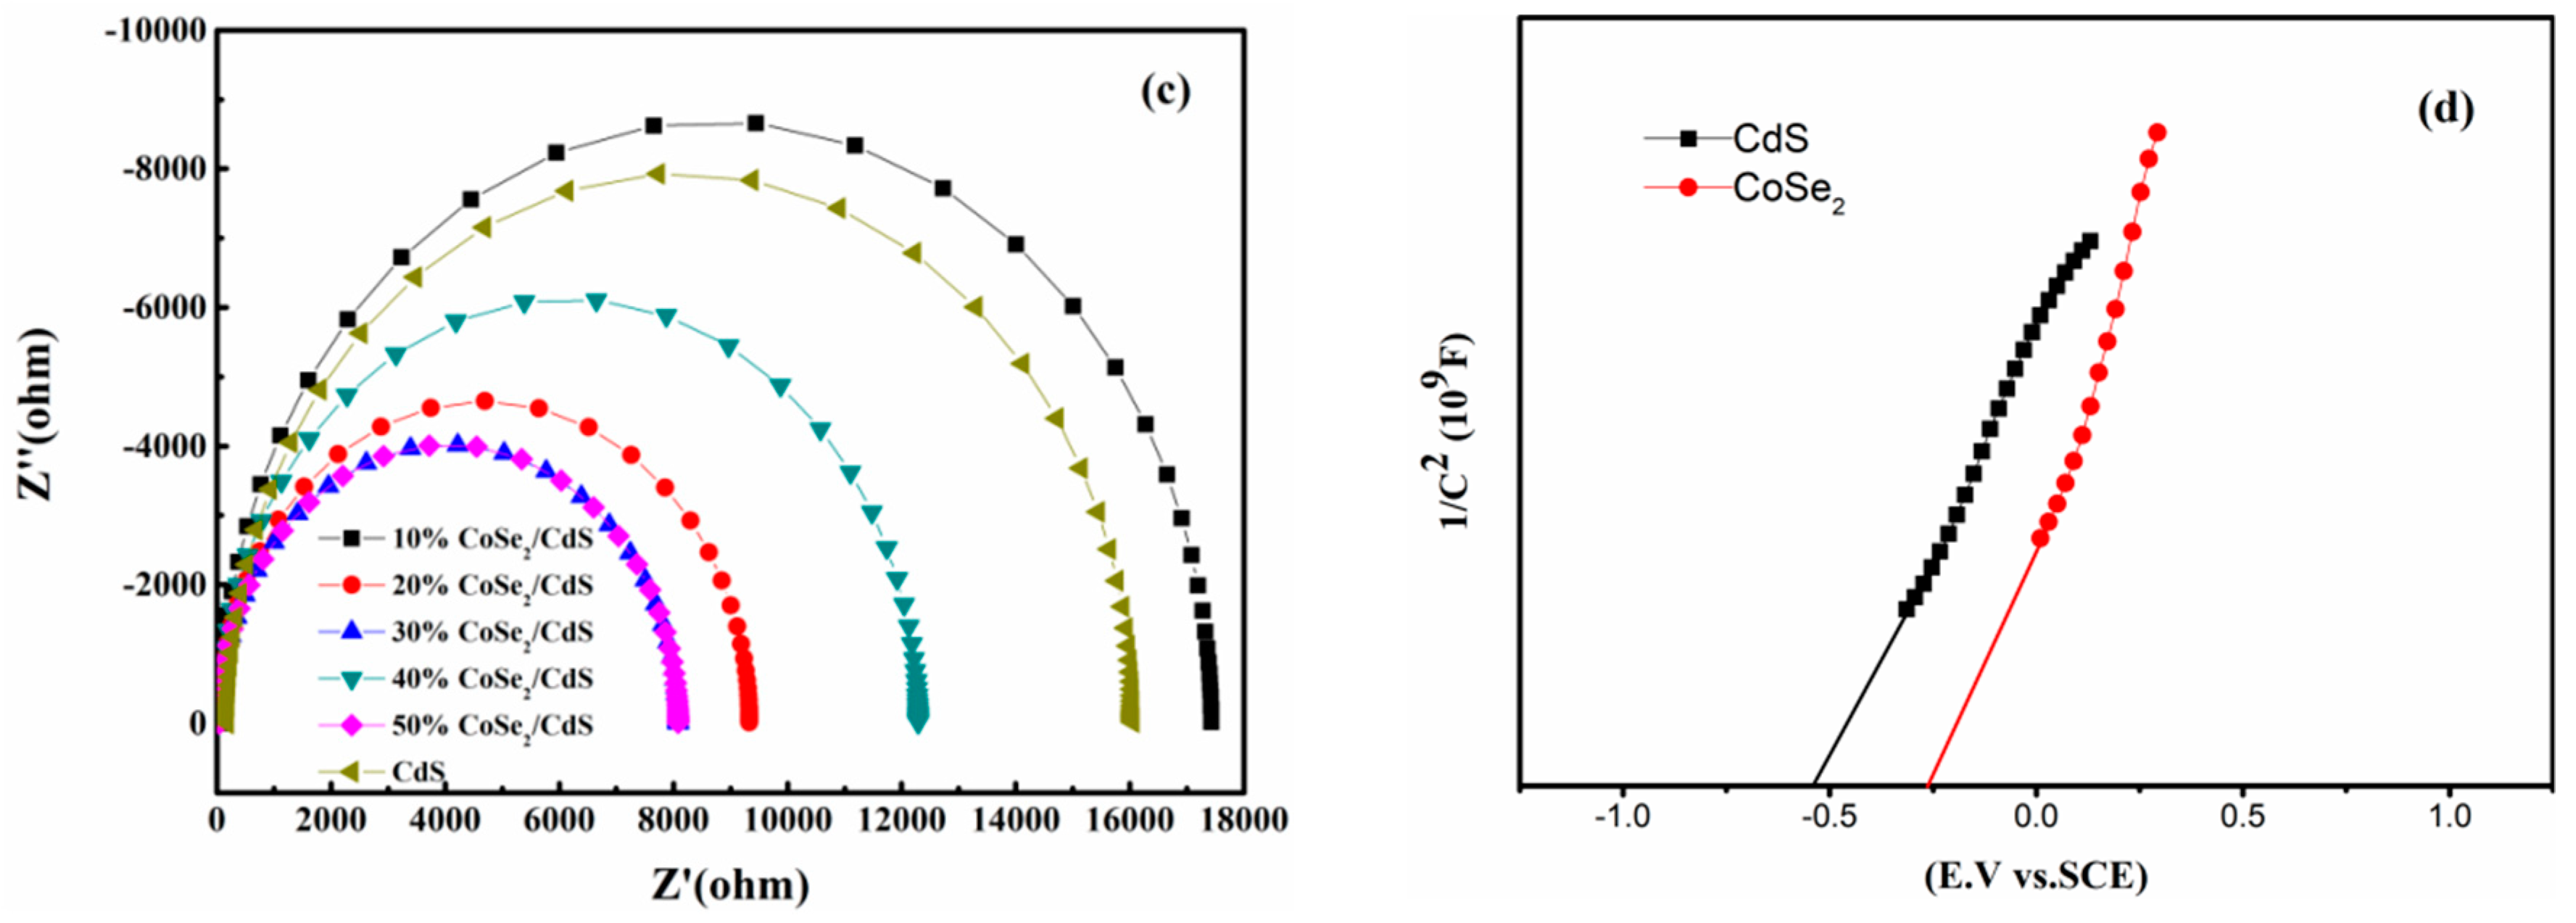
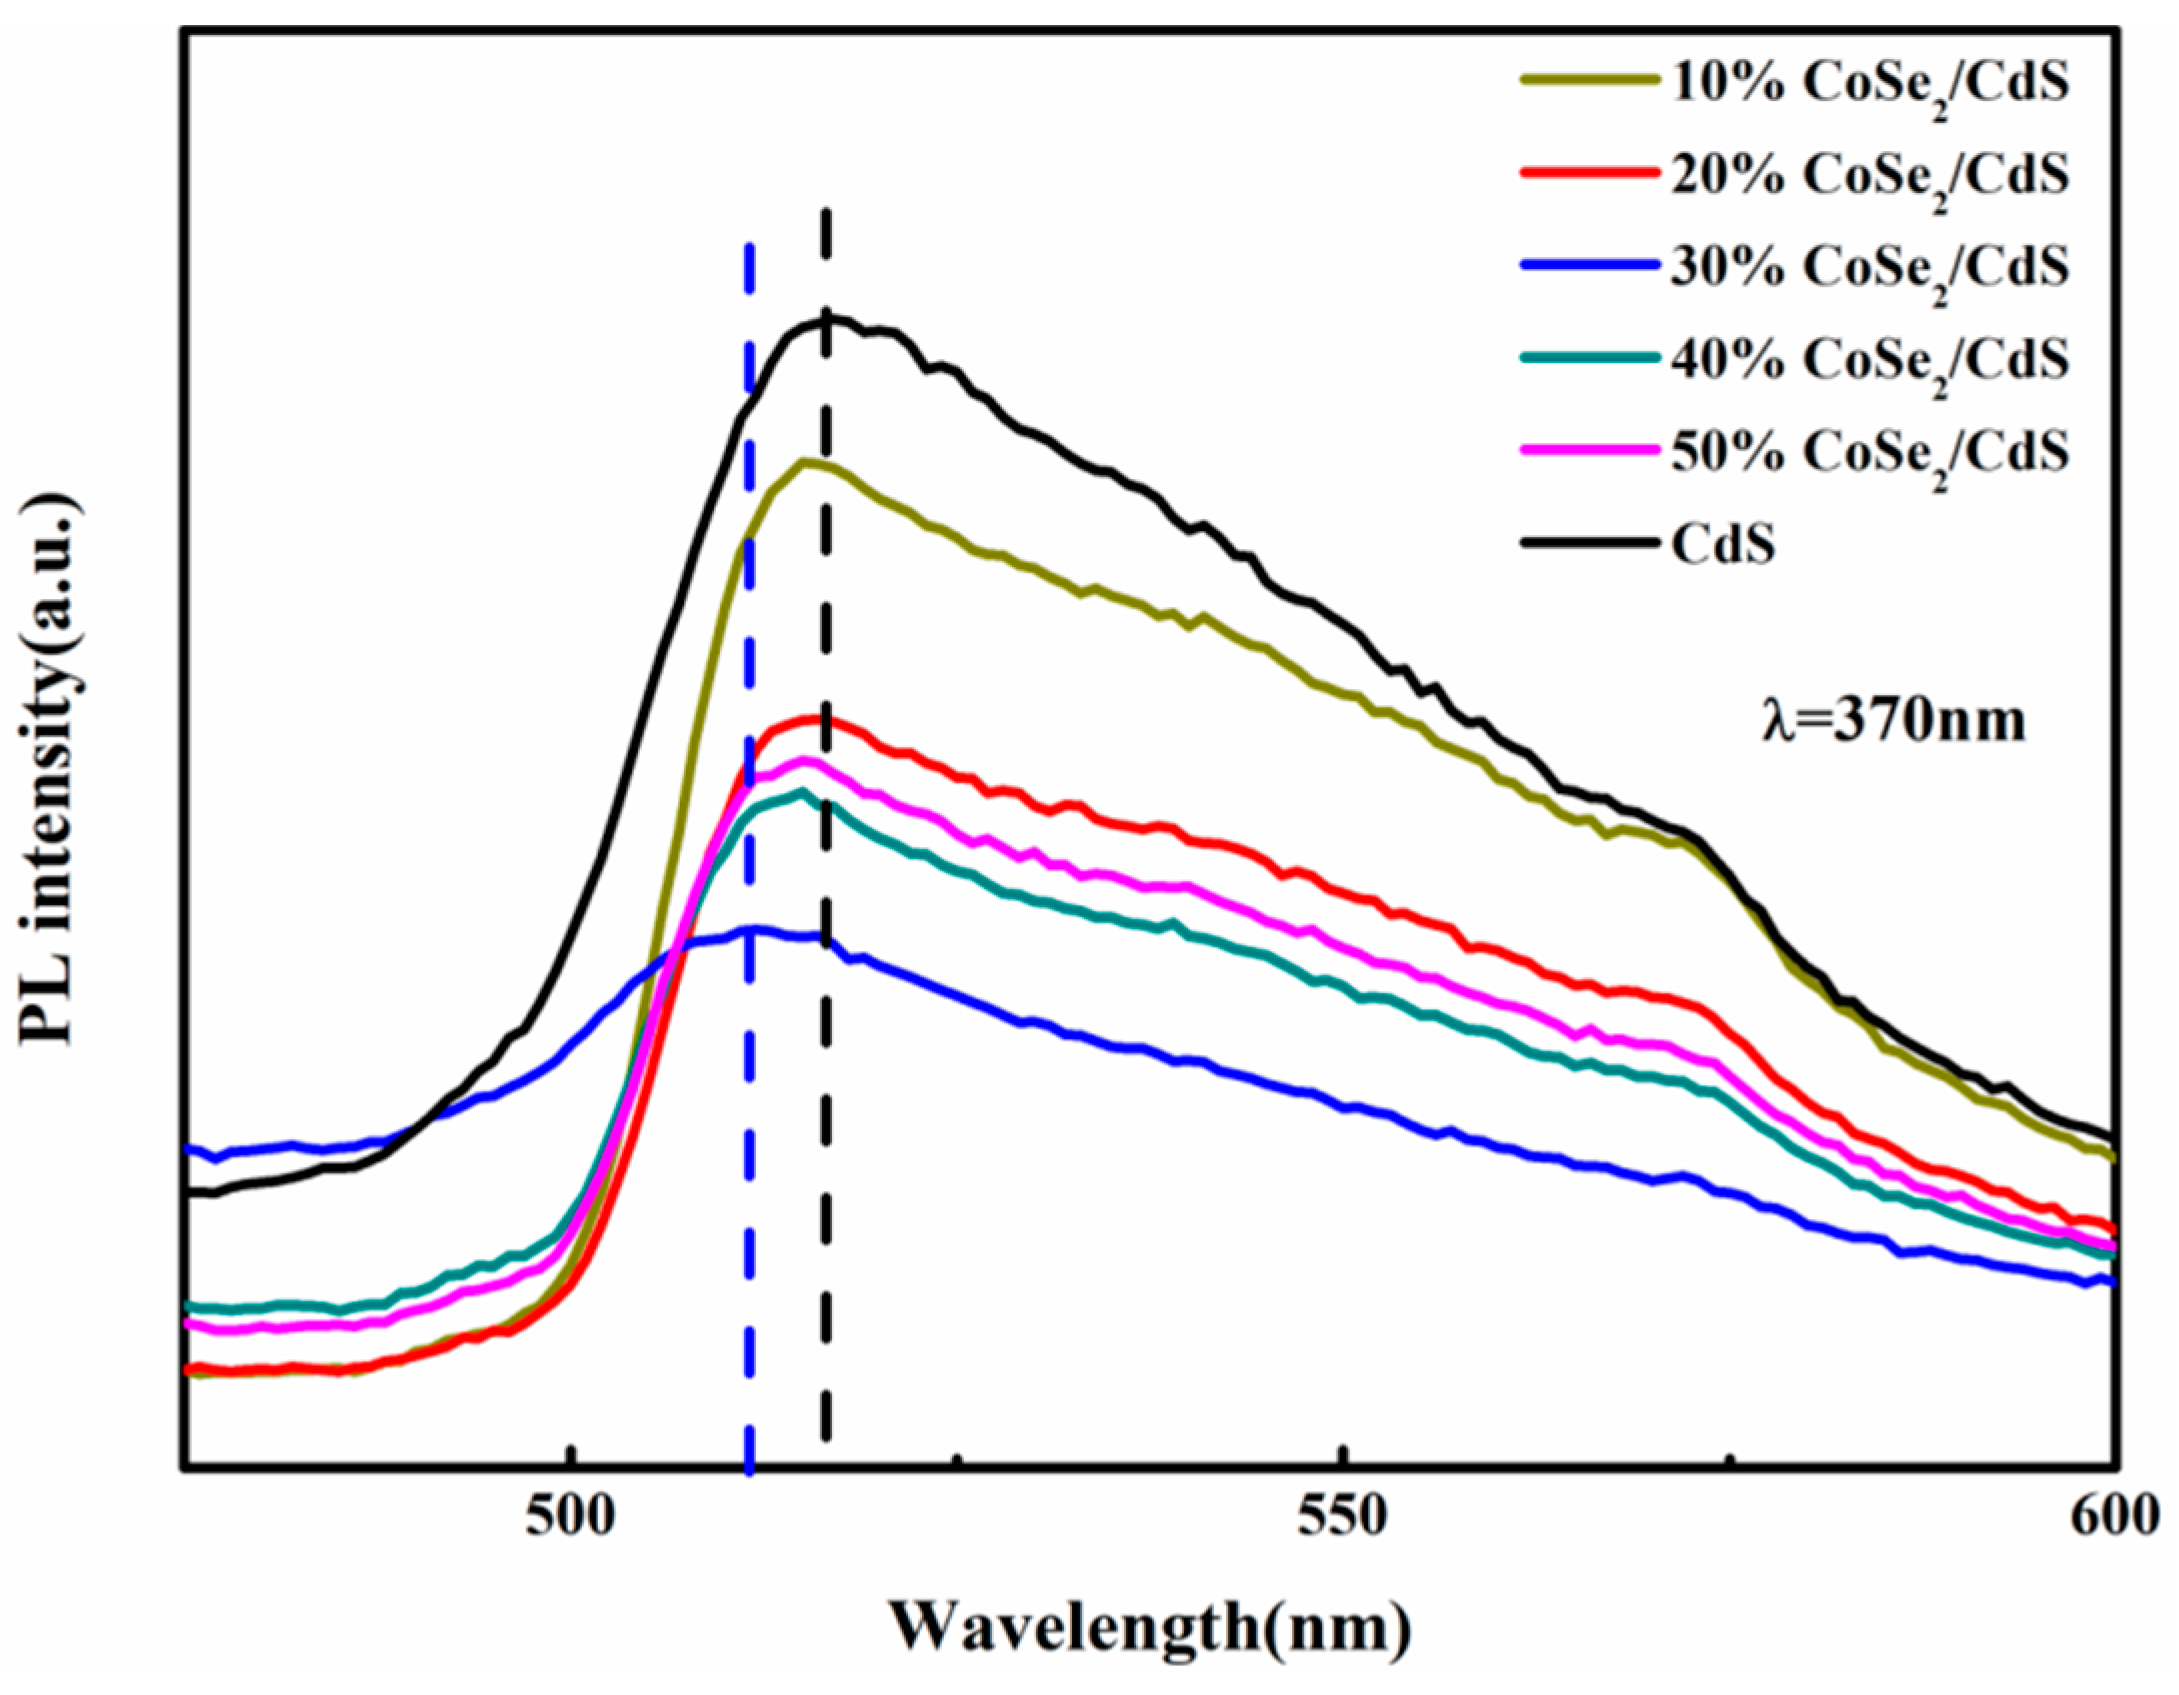
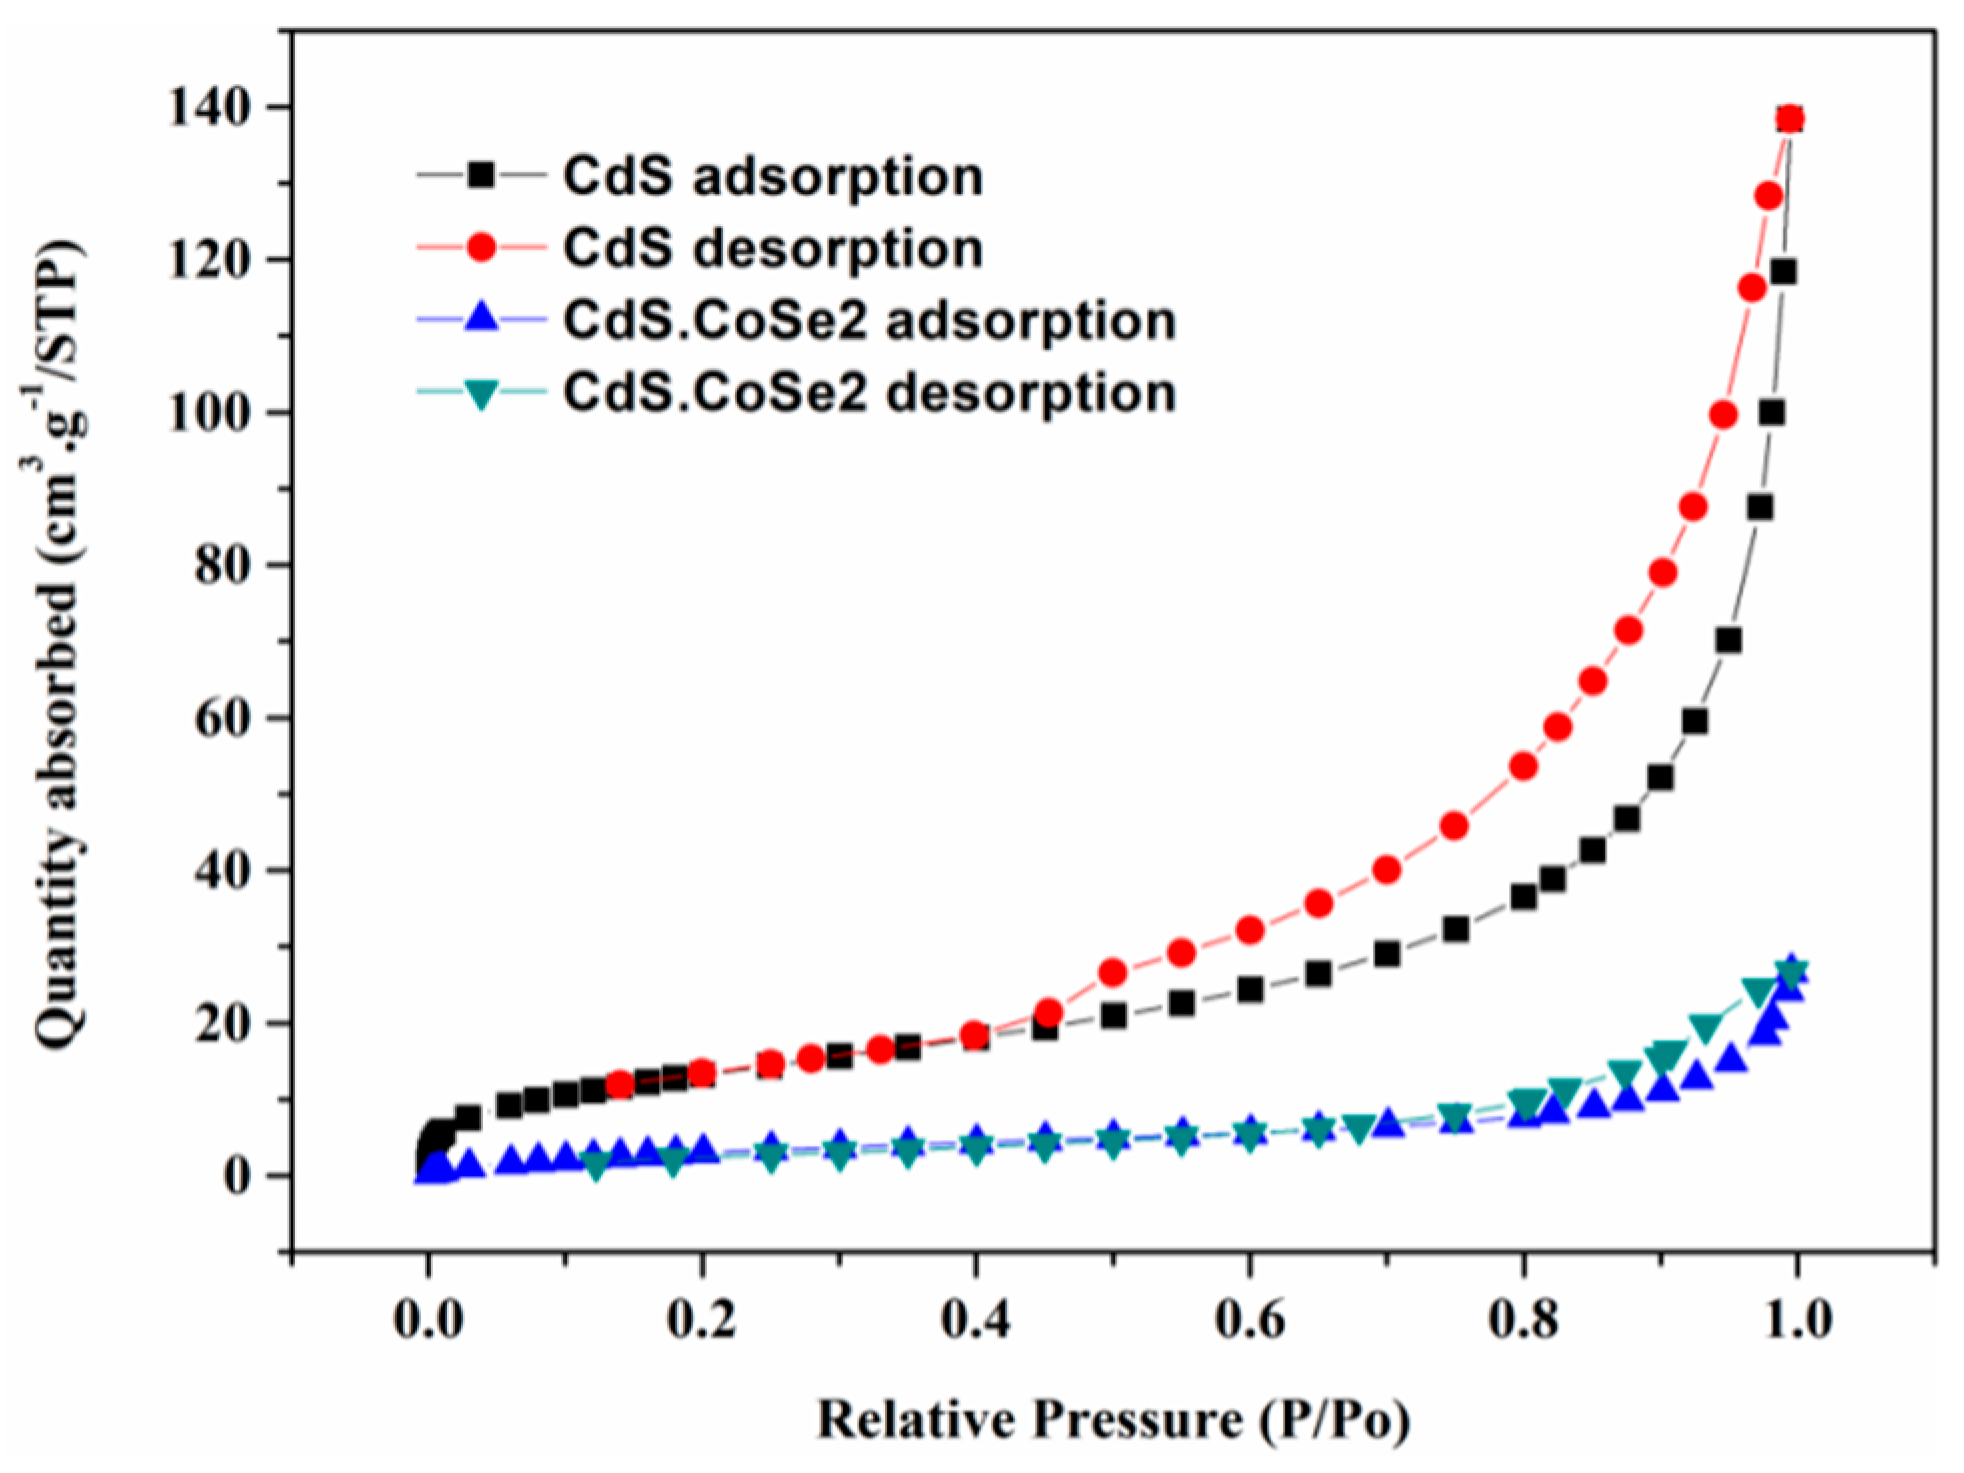
2. Result and Discussion
3. Experiment
3.1. Chemicals
3.2. Preparation of Catalysts
3.2.1. Preparation of CdS
3.2.2. Preparation of CoSe2
3.2.3. Preparation of CoSe2/CdS
3.3. Characterization
3.4. Photoelectrochemical Measurements
3.5. Photocatalytic Activity Measurements
4. Conclusions
Author Contributions
Funding
Conflicts of Interest
References
- Wang, H.; Wang, G.; Liu, Z.; Jin, Z. Strategy of nitrogen defects sponge from g-C3N4 nanosheets and Ni-Bi-Se complex modification for efficient dye—Sensitized photocatalytic H2 evolution. Mol. Catal. 2018, 453. [Google Scholar] [CrossRef]
- Hao, X.; Jin, Z.; Wang, D.; Xu, J.; Min, S.; Yuan, H.; Lu, G. Behavior of Borate Complex Anion on the Stabilities and the Hydrogen Evolutions of ZnxCo3-xO4 Decorated Graphene. Superlattices Microstruct. 2015, 82, 599–611. [Google Scholar] [CrossRef]
- Li, X.; Yu, J.; Jaroniec, M. Hierarchical photocatalysts. Chem. Soc. Rev. 2016, 45, 2603–2636. [Google Scholar] [CrossRef] [PubMed]
- Fujishima, A.; Honda, K. Electrochemical photolysis of water at a semiconductor electrode. Nature 1972, 238, 37–38. [Google Scholar] [CrossRef] [PubMed]
- Rajeshwar, K. Hydrogen generation at irradiated oxide semiconductor solution interfaces. J. Appl. Electrochem. 2007, 37, 765–787. [Google Scholar] [CrossRef]
- Maeda, K. Photocatalytic water splitting using semiconductor particles: History and recent developments. J. Photochem. Photobiol. C 2011, 12, 237–268. [Google Scholar] [CrossRef]
- Hisatomi, T.; Kubota, J.; Domen, K. Recent advances in semiconductors for photocatalytic and photoelectrochemical water splitting. Chem. Soc. Rev. 2015, 46, 7520–7535. [Google Scholar] [CrossRef] [PubMed]
- Moriya, Y.; Takata, T.; Domen, K. Recent progress in the development of (oxy)nitride photocatalysts for water splitting under visible-light irradiation. Coord. Chem. Rev. 2013, 257, 1957–1969. [Google Scholar] [CrossRef]
- Pelaez, M.; Nolan, N.T.; Pillai, S.C. A review on the visible light active titanium dioxide photocatalysts for environmental applications. Appl. Catal. B Environ. 2012, 125, 331–349. [Google Scholar] [CrossRef] [Green Version]
- Paola, A.D.; García-López, E.; Marcì, G. A survey of photocatalytic materials for environmental remediation. J. Hazard. Mater. 2012, 211, 3–29. [Google Scholar] [CrossRef]
- Zhang, H.; Chen, G.; Bahnemann, D.W. Photoelectrocatalytic materials for environmental applications. J. Mater. Chem. 2009, 19, 5089–5121. [Google Scholar] [CrossRef]
- Habisreutinge, S.N.; Schmidtmende, L.; Stolarczyk, J.K. Photocatalytic reduction of CO2 on TiO2 and other semiconductors. Angew. Chem. Int. Ed. 2013, 52, 7372–7408. [Google Scholar] [CrossRef] [PubMed]
- Low, J.; Yu, J.; Jaroniec, M.; Wageh, S.; Al-Ghamdi, A.A. Heterojunction photocatalysts. Adv. Mater. 2017, 29, 1601694. [Google Scholar] [CrossRef] [PubMed]
- Huang, Q.; Yu, J.; Cao, S.; Cui, C.; Cheng, B. Efficient photocatalytic reduction of CO2 by amine-functionalized g-C3N4. Appl. Surf. Sci. 2015, 358, 350–355. [Google Scholar] [CrossRef]
- Tong, H.; Ouyang, S.; Bi, Y.; Umezawa, N.; Oshikiri, M.; Ye, J. Nano-photocatalytic materials: Possibilities and challenges. Adv. Mater. 2012, 24, 229–251. [Google Scholar] [CrossRef] [PubMed]
- Schneider, J.; Matsuoka, M.; Takeuchi, M.; Zhang, J.; Horiuchi, Y.; Anpo, M.; Bahnemann, D.W. Understanding TiO2 photocatalysis: Mechanisms and materials. Chem. Rev. 2014, 114, 9919–9986. [Google Scholar] [CrossRef] [PubMed]
- Ye, R.; Fang, H.; Zheng, Y.Z.; Li, N.; Wang, Y.; Tao, X. Fabrication of CoTiO3/g-C3N4 hybrid photocatalysts with enhanced H2 evolution: Z-scheme photocatalytic mechanism insight. ACS Appl. Mater. Inter. 2016, 8, 13879–13889. [Google Scholar] [CrossRef]
- Linsebigler, A.L.; Lu, G.; Yates, J.T. Photocatalysis on TiO2 surfaces: Principles, mechanisms, and selected results. Chem. Rev. 1995, 95, 735–758. [Google Scholar] [CrossRef]
- Yu, J.; Zhang, J.; Liu, S. Ion-exchange synthesis and enhanced visible-light photoactivity of CuS/ZnS nanocomposite hollow spheres. J. Phys. Chem. C. 2010, 114, 13642–13649. [Google Scholar] [CrossRef]
- Yu, J.; Zhang, J. A simple template-free approach to TiO2 hollow spheres with enhanced photocatalytic activity. Dalton Trans. 2010, 39, 5860–5867. [Google Scholar] [CrossRef]
- Zhang, J.; Yu, J.; Jaroniec, M. Noble metal-free reduced graphene oxide-ZnxCd1-xS nanocomposite with enhanced solar photocatalytic H2 production performance. Nano Lett. 2012, 12, 4584–4589. [Google Scholar] [CrossRef] [PubMed]
- Yu, J.; Yang, B.; Cheng, B. Noble-metal-free carbon nanotube Cd0.1Zn0.9S composites for high visible-light photocatalytic H2 production performance. Nanoscale 2012, 4, 2670–2677. [Google Scholar] [CrossRef] [PubMed]
- Xiang, Q.; Yu, J.; Jaroniec, M. Synergetic effect of MoS2 and graphene as cocatalysts for enhanced photocatalytic H2 production activity of TiO2 nanoparticles. J. Am. Chem. Soc. 2012, 134, 6575–6578. [Google Scholar] [CrossRef] [PubMed]
- Li, Q.; Guo, B.; Yu, J. Highly efficient visible-light-driven photocatalytic hydrogen production of CdS-cluster-decorated graphene nanosheets. J. Am. Chem. Soc. 2011, 133, 10878–10884. [Google Scholar] [CrossRef] [PubMed]
- Zhang, Y.; Jin, Z.; Yuan, H.; Wang, G.; Ma, B. Well-regulated Nickel nanoparticles functional modified ZIF-67 (Co) derived Co3O4/CdS p-n heterojunction for efficient photocatalytic hydrogen evolution. Appl. Surf. Sci. 2018, 462, 213–225. [Google Scholar] [CrossRef]
- Yan, X.; Liu, X. Antiphotocorrosive photocatalysts containing CdS nanoparticles and exfoliated TiO2 nanosheets. J. Mater. Res. 2010, 25, 182–188. [Google Scholar] [CrossRef]
- Fu, J.; Xu, Q.; Low, J.; Jiang, C.; Yu, J. Ultrathin 2D/2D WO3/gC3N4 step-scheme H2-production photocatalyst. Appl. Catal. B Environ. 2019, 243, 556–565. [Google Scholar] [CrossRef]
- Qi, L.; Yu, J.M.; Jaroniec, M. Preparation and enhanced visible-light photocatalytic H2-production activity of CdS-sensitized Pt/TiO2 nanosheets with exposed (001) facets. Chem. Chem. Phys. 2011, 13, 8915–8923. [Google Scholar] [CrossRef]
- Li, B.; Wang, Y. Synthesis, microstructure, and photocatalysis of ZnO/CdS nano heterostructure. J. Phys. Chem. Solids 2011, 72, 1165–1169. [Google Scholar] [CrossRef]
- Xu, L.; Shi, W.; Guan, J. Preparation of crystallized mesoporous CdS/Ta2O5, composite assisted by silica reinforcement for visible light photocatalytic hydrogen evolution. Catal. Commun. 2012, 25, 54–58. [Google Scholar] [CrossRef]
- Wang, Y.; Wang, Y.; Xu, R. Photochemical deposition of Pt on CdS for H2 evolution from water: Markedly enhanced activity by controlling Pt reduction environment. J. Phys. Chem. C 2012, 117, 783–790. [Google Scholar] [CrossRef]
- Wu, K.; Zhu, H.; Zheng, L. Ultrafast charge separation and long-lived charge separated state in photocatalytic CdS–Pt nanorod heterostructures. J. Am. Chem. Soc. 2012, 134, 10337–10340. [Google Scholar] [CrossRef] [PubMed]
- Hao, X.; Jin, Z.; Yang, H.; Lu, G.; Bi, Y. Peculiar Synergetic Effect of MoS2 Quantum Dots and Graphene on Metal-Organic Frameworks for Photocatalytic Hydrogen Evolution. Appl. Catal. B Environ. 2017, 210, 45–56. [Google Scholar] [CrossRef]
- Zhang, Y.; Peng, Z.; Guan, S. Data on the synthesis processes optimization of novel β-NiS film modified CdS nanoflowers heterostructure nanocomposite for photocatalytic hydrogen evolution. Data Brief 2018, 16, 828–842. [Google Scholar] [CrossRef] [PubMed]
- Liu, J.; Fang, W.; We, Z. Metallic 1T-LixMoS2 Co-catalyst enhanced photocatalytic hydrogen evolution over ZnIn2S4 floriated microspheres under visible light irradiation. Catal. Sci. Technol. 2018, 8, 1375–1382. [Google Scholar] [CrossRef]
- Jian, W.; Bo, L.; Chen, J. Enhanced photocatalytic H2-production activity of CdxZn1–xS nanocrystals by surface loading MS (M = Ni, Co, Cu) species. Appl. Surf. Sci. 2012, 259, 118–123. [Google Scholar]
- Chen, T.; Song, C.; Fan, M. In-situ fabrication of CuS/g-C3N4, nanocomposites with enhanced photocatalytic H2 production activity via photoinduced interfacial charge transfer. Int. J. Hydrogen Energy 2017, 42, 12210–12219. [Google Scholar] [CrossRef]
- Chhowalla, M.; Shin, H.; Eda, G.; Li, L.; Loh, K.; Zhang, H. The chemistry of twodimensional layered transition metal dichalcogenide nanosheets. Nat. Chem. 2013, 5, 263–275. [Google Scholar] [CrossRef]
- Yang, H.; Jin, Z.; Hu, H.; Lu, G.; Bi, Y. Fabrication and behaviors of CdS on Bi2MoO6 thin film photoanodes. RSC Adv. 2017, 7, 10774–10781. [Google Scholar] [CrossRef]
- Jarimavičiūtė-Žvalionienė, R.; Tamulevičius, S.; Andrulevičius, M.; Tomašiūnas, R.; Grigaliūnas, V. Photoluminescence and XPS Study of Selenium Treated Porous Silicon. In Nanostructured and Advanced Materials for Applications in Sensor, Optoelectronic and Photovoltaic Technology; Springer: Berlin/Heidelberg, Germany, 2005; pp. 371–374. [Google Scholar]
- Liu, D.; Jin, Z.; Bi, Y. Charge transition channel construction between a MOF and rGO by means of Co-Mo-S modification. Catal. Sci. Technol. 2017, 7, 4478–4488. [Google Scholar] [CrossRef]
- Jang, J.; Joshi, U.A.; Lee, J.S. Solvothermal synthesis of CdS nanowires for photocatalytic hydrogen and electricity production. J. Phys. Chem. C 2007, 111, 13280–13287. [Google Scholar] [CrossRef]
- Wang, S.; Li, W.; Xin, L. Facile synthesis of truncated cube-like NiSe2, Single crystals for High-performance asymmetric supercapacitors. Chem. Eng. J. 2017, 330, 1334–1341. [Google Scholar] [CrossRef]


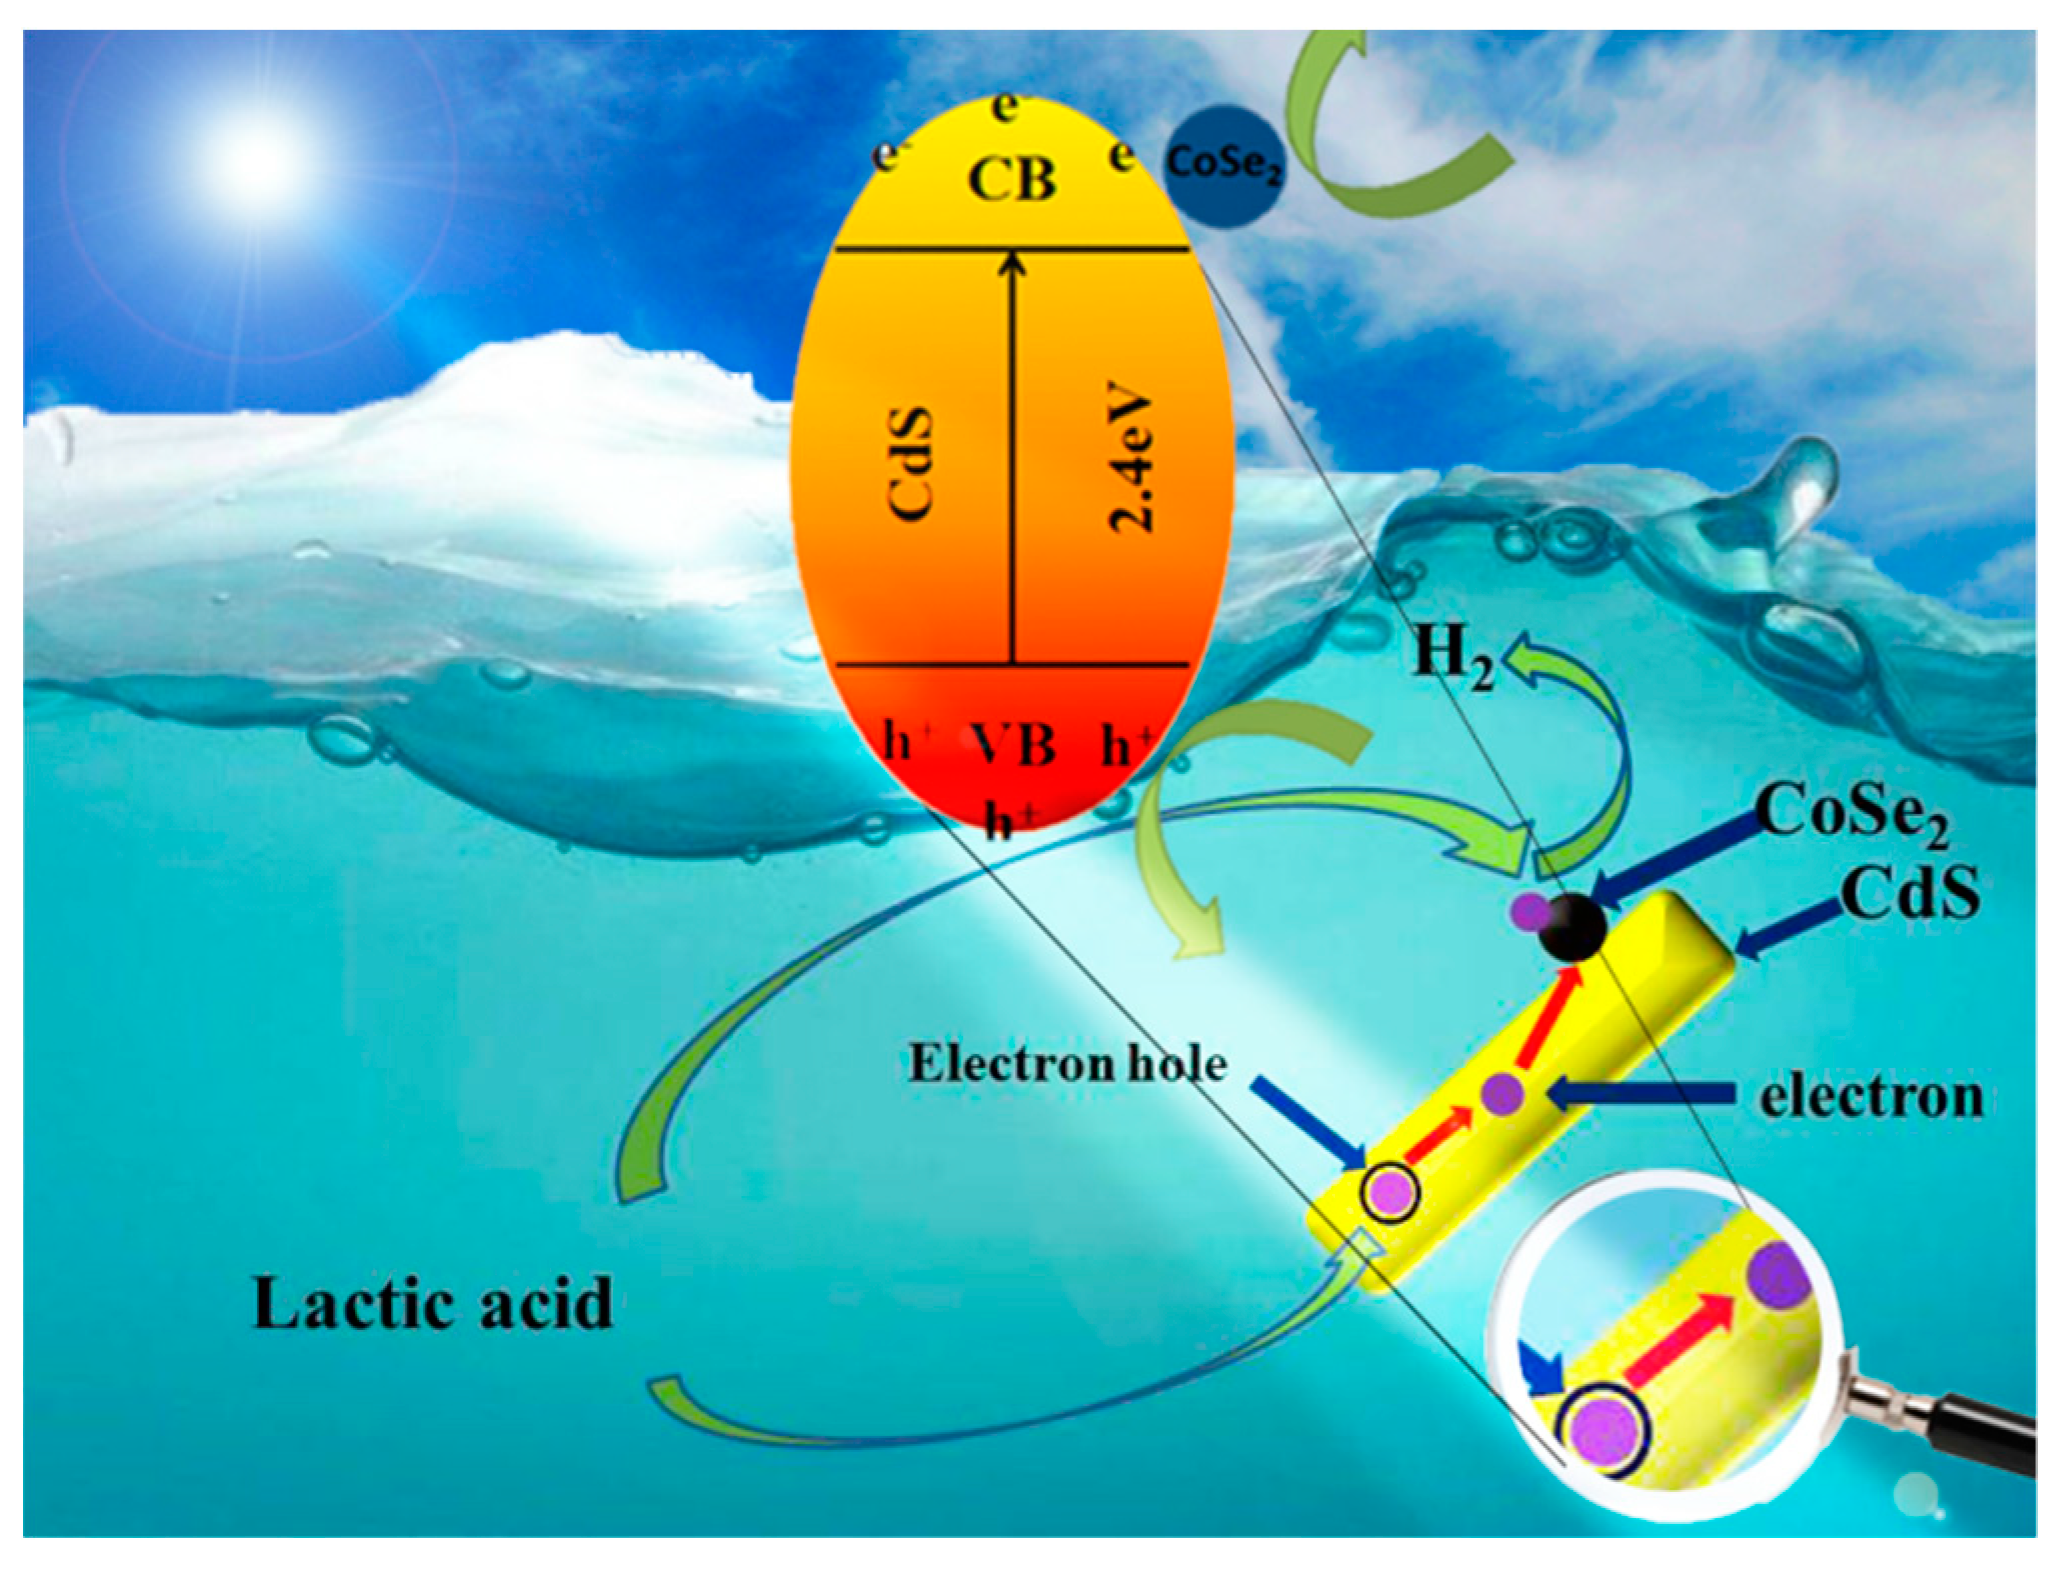
| Semiconductor | Band Energy Eg (eV) | Valence Band EVB (eV) | Conduction Band ECB (eV) |
|---|---|---|---|
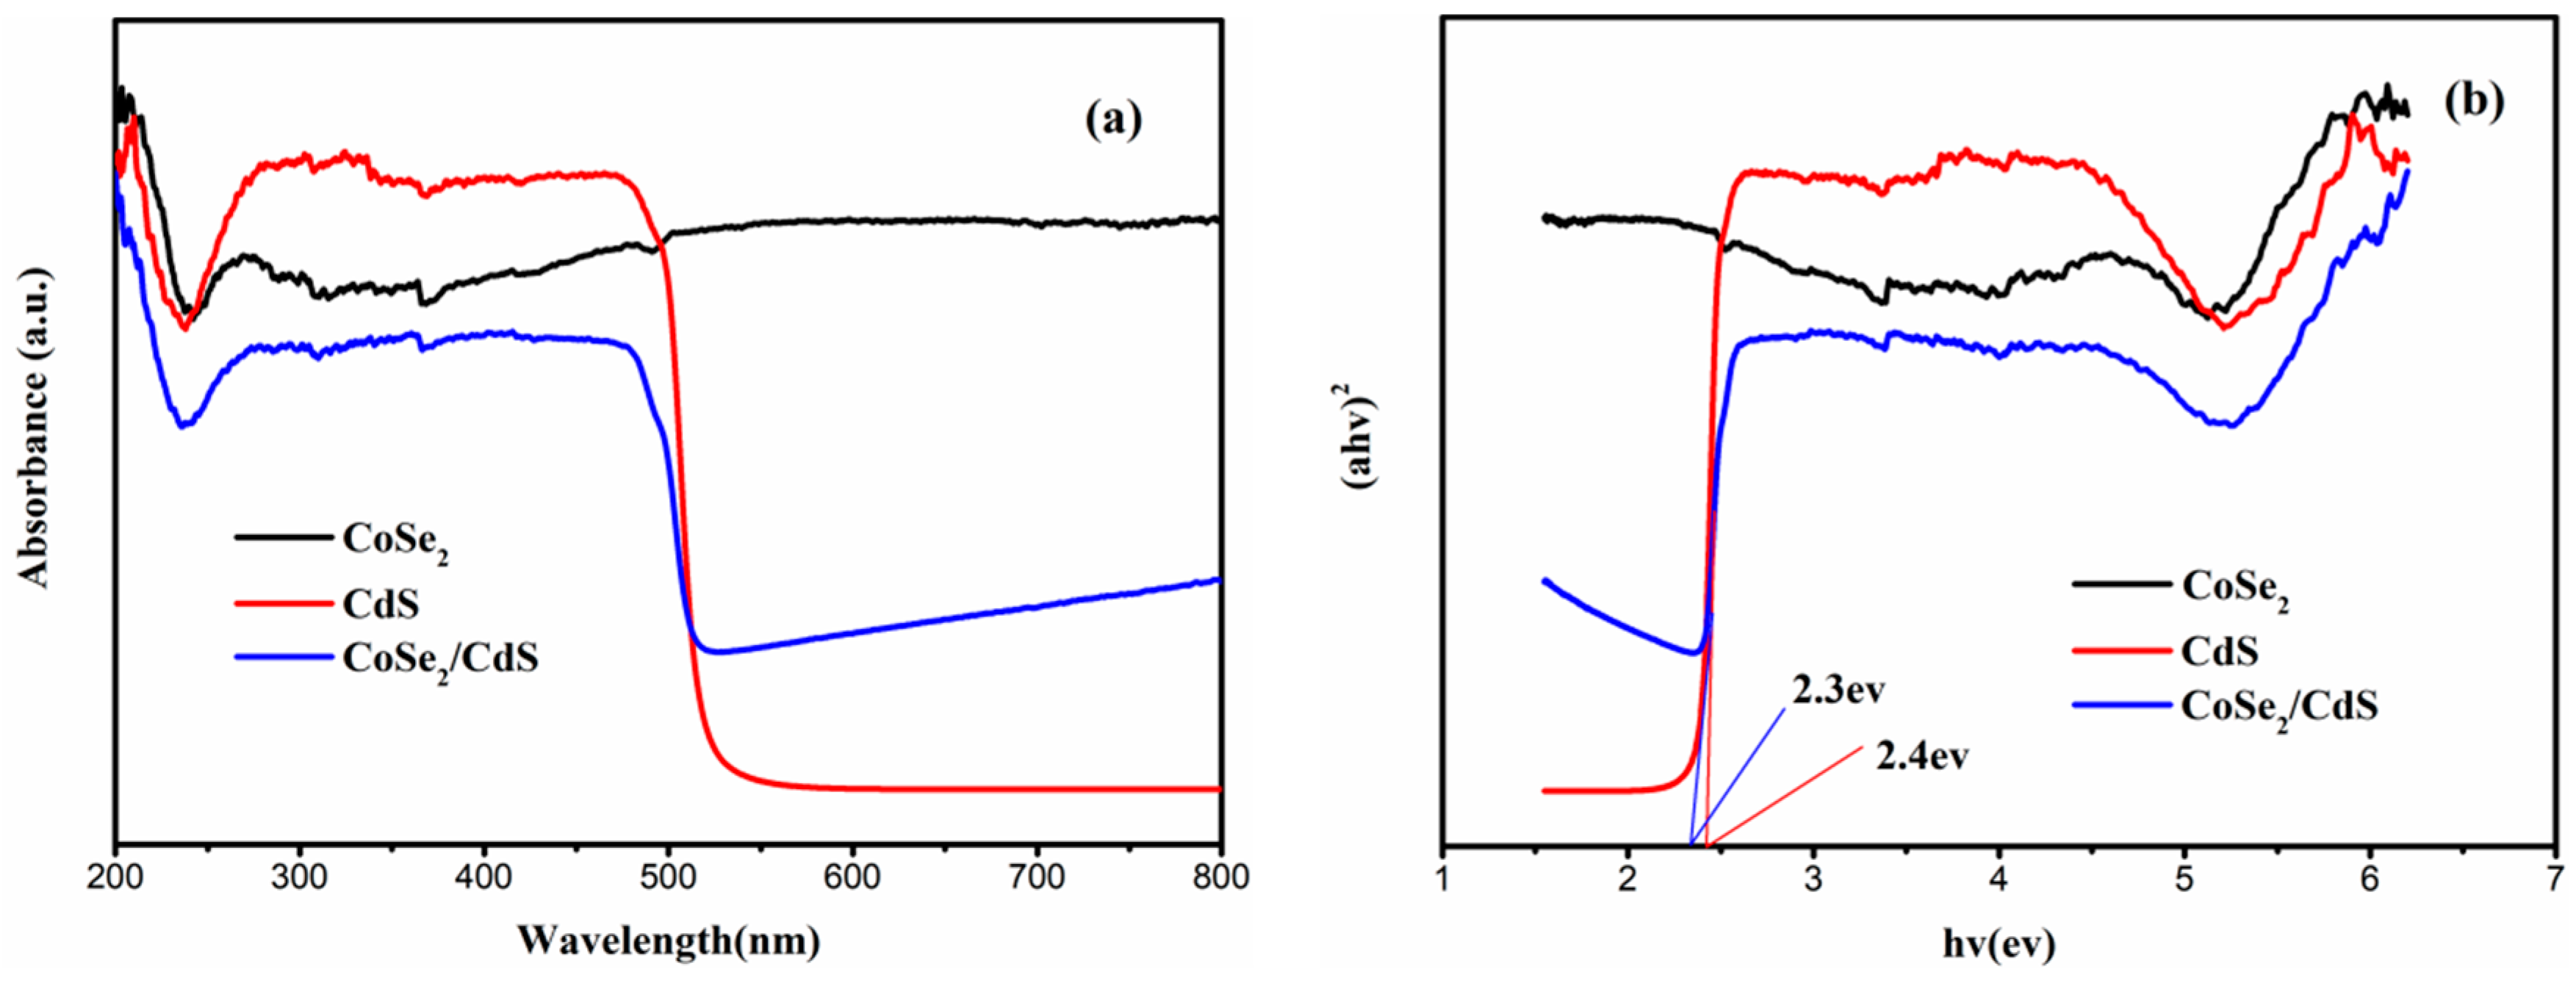
| CdS (n-type) | 2.4 | 2.0 | −0.4 |
| CoSe2 (n-type) | −0.1 |
| System | Lifetime <λ> (ns) | Pre-Exponential Factor A% | Average Lifetime <λ> (ns) | X2 |
|---|---|---|---|---|
| CoSe2 | 0.0059/4.1735/153.6543 | 99.76/0.05/0.18 | 0.00 | 1.48080 |
| CdS | 4.1953/0.5532/79.9562 | 25.00/15.06/59.94 | 2.94 | 1.77483 |
| 30% | 3.2128/0.4006/41.0649 | 27.26/15.61/57.13 | 2.04 | 1.75398 |
| Sample | SBET/(m2·g−1) | Pore Volume/(cm3·g−1) | Average Pore Size/nm |
|---|---|---|---|
| CdS | 50.1874 | 0.211466 | 15.1348 |
| CoSe2/CdS | 13.0324 | 0.039481 | 13.2311 |
© 2019 by the authors. Licensee MDPI, Basel, Switzerland. This article is an open access article distributed under the terms and conditions of the Creative Commons Attribution (CC BY) license (http://creativecommons.org/licenses/by/4.0/).
Share and Cite
Gan, R.; Ma, X.; Wang, G.; Jin, Z. CoSe2 Clusters as Efficient Co-Catalyst Modified CdS Nanorod for Enhance Visible Light Photocatalytic H2 Evolution. Catalysts 2019, 9, 616. https://doi.org/10.3390/catal9070616
Gan R, Ma X, Wang G, Jin Z. CoSe2 Clusters as Efficient Co-Catalyst Modified CdS Nanorod for Enhance Visible Light Photocatalytic H2 Evolution. Catalysts. 2019; 9(7):616. https://doi.org/10.3390/catal9070616
Chicago/Turabian StyleGan, Ruizhou, Xiaohua Ma, Guorong Wang, and Zhiliang Jin. 2019. "CoSe2 Clusters as Efficient Co-Catalyst Modified CdS Nanorod for Enhance Visible Light Photocatalytic H2 Evolution" Catalysts 9, no. 7: 616. https://doi.org/10.3390/catal9070616