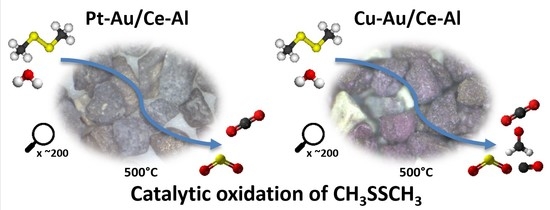
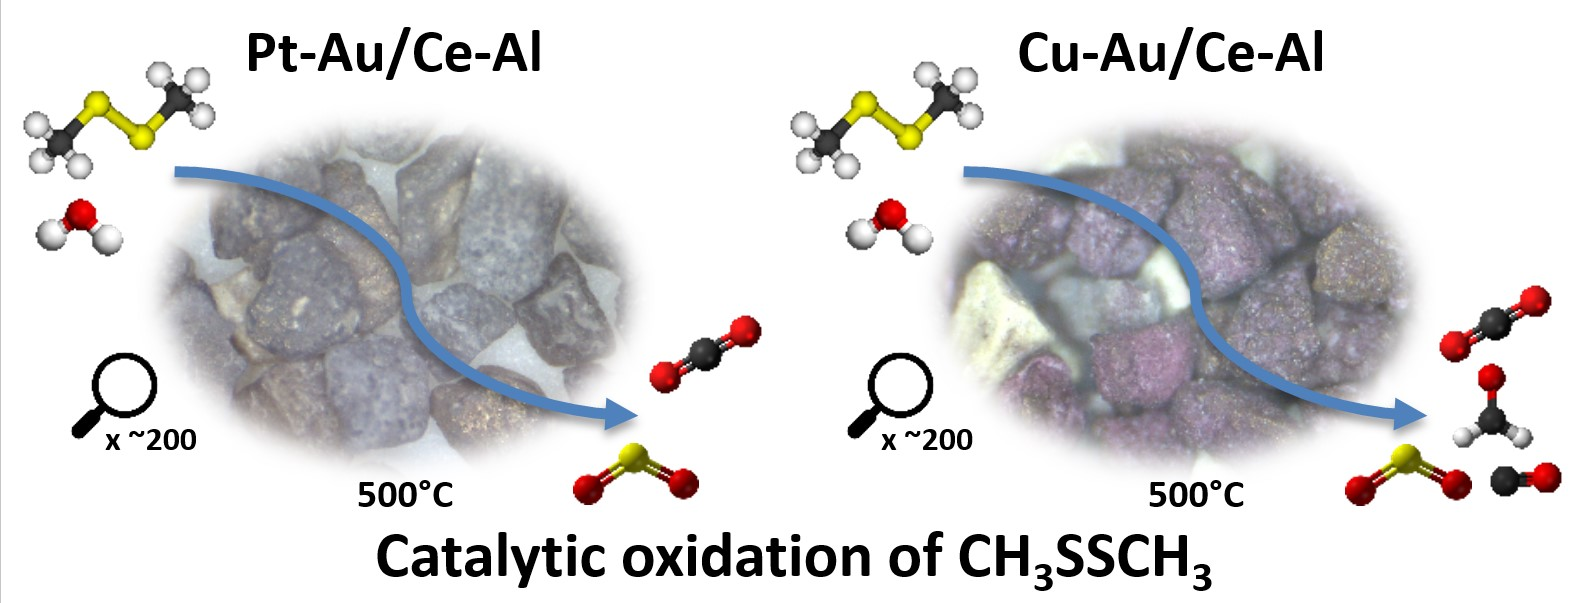
Catalytic Oxidation of Dimethyl Disulfide over Bimetallic Cu–Au and Pt–Au Catalysts Supported on γ-Al2O3, CeO2, and CeO2–Al2O3

 ,
,
Abstract
:
1. Introduction
2. Results
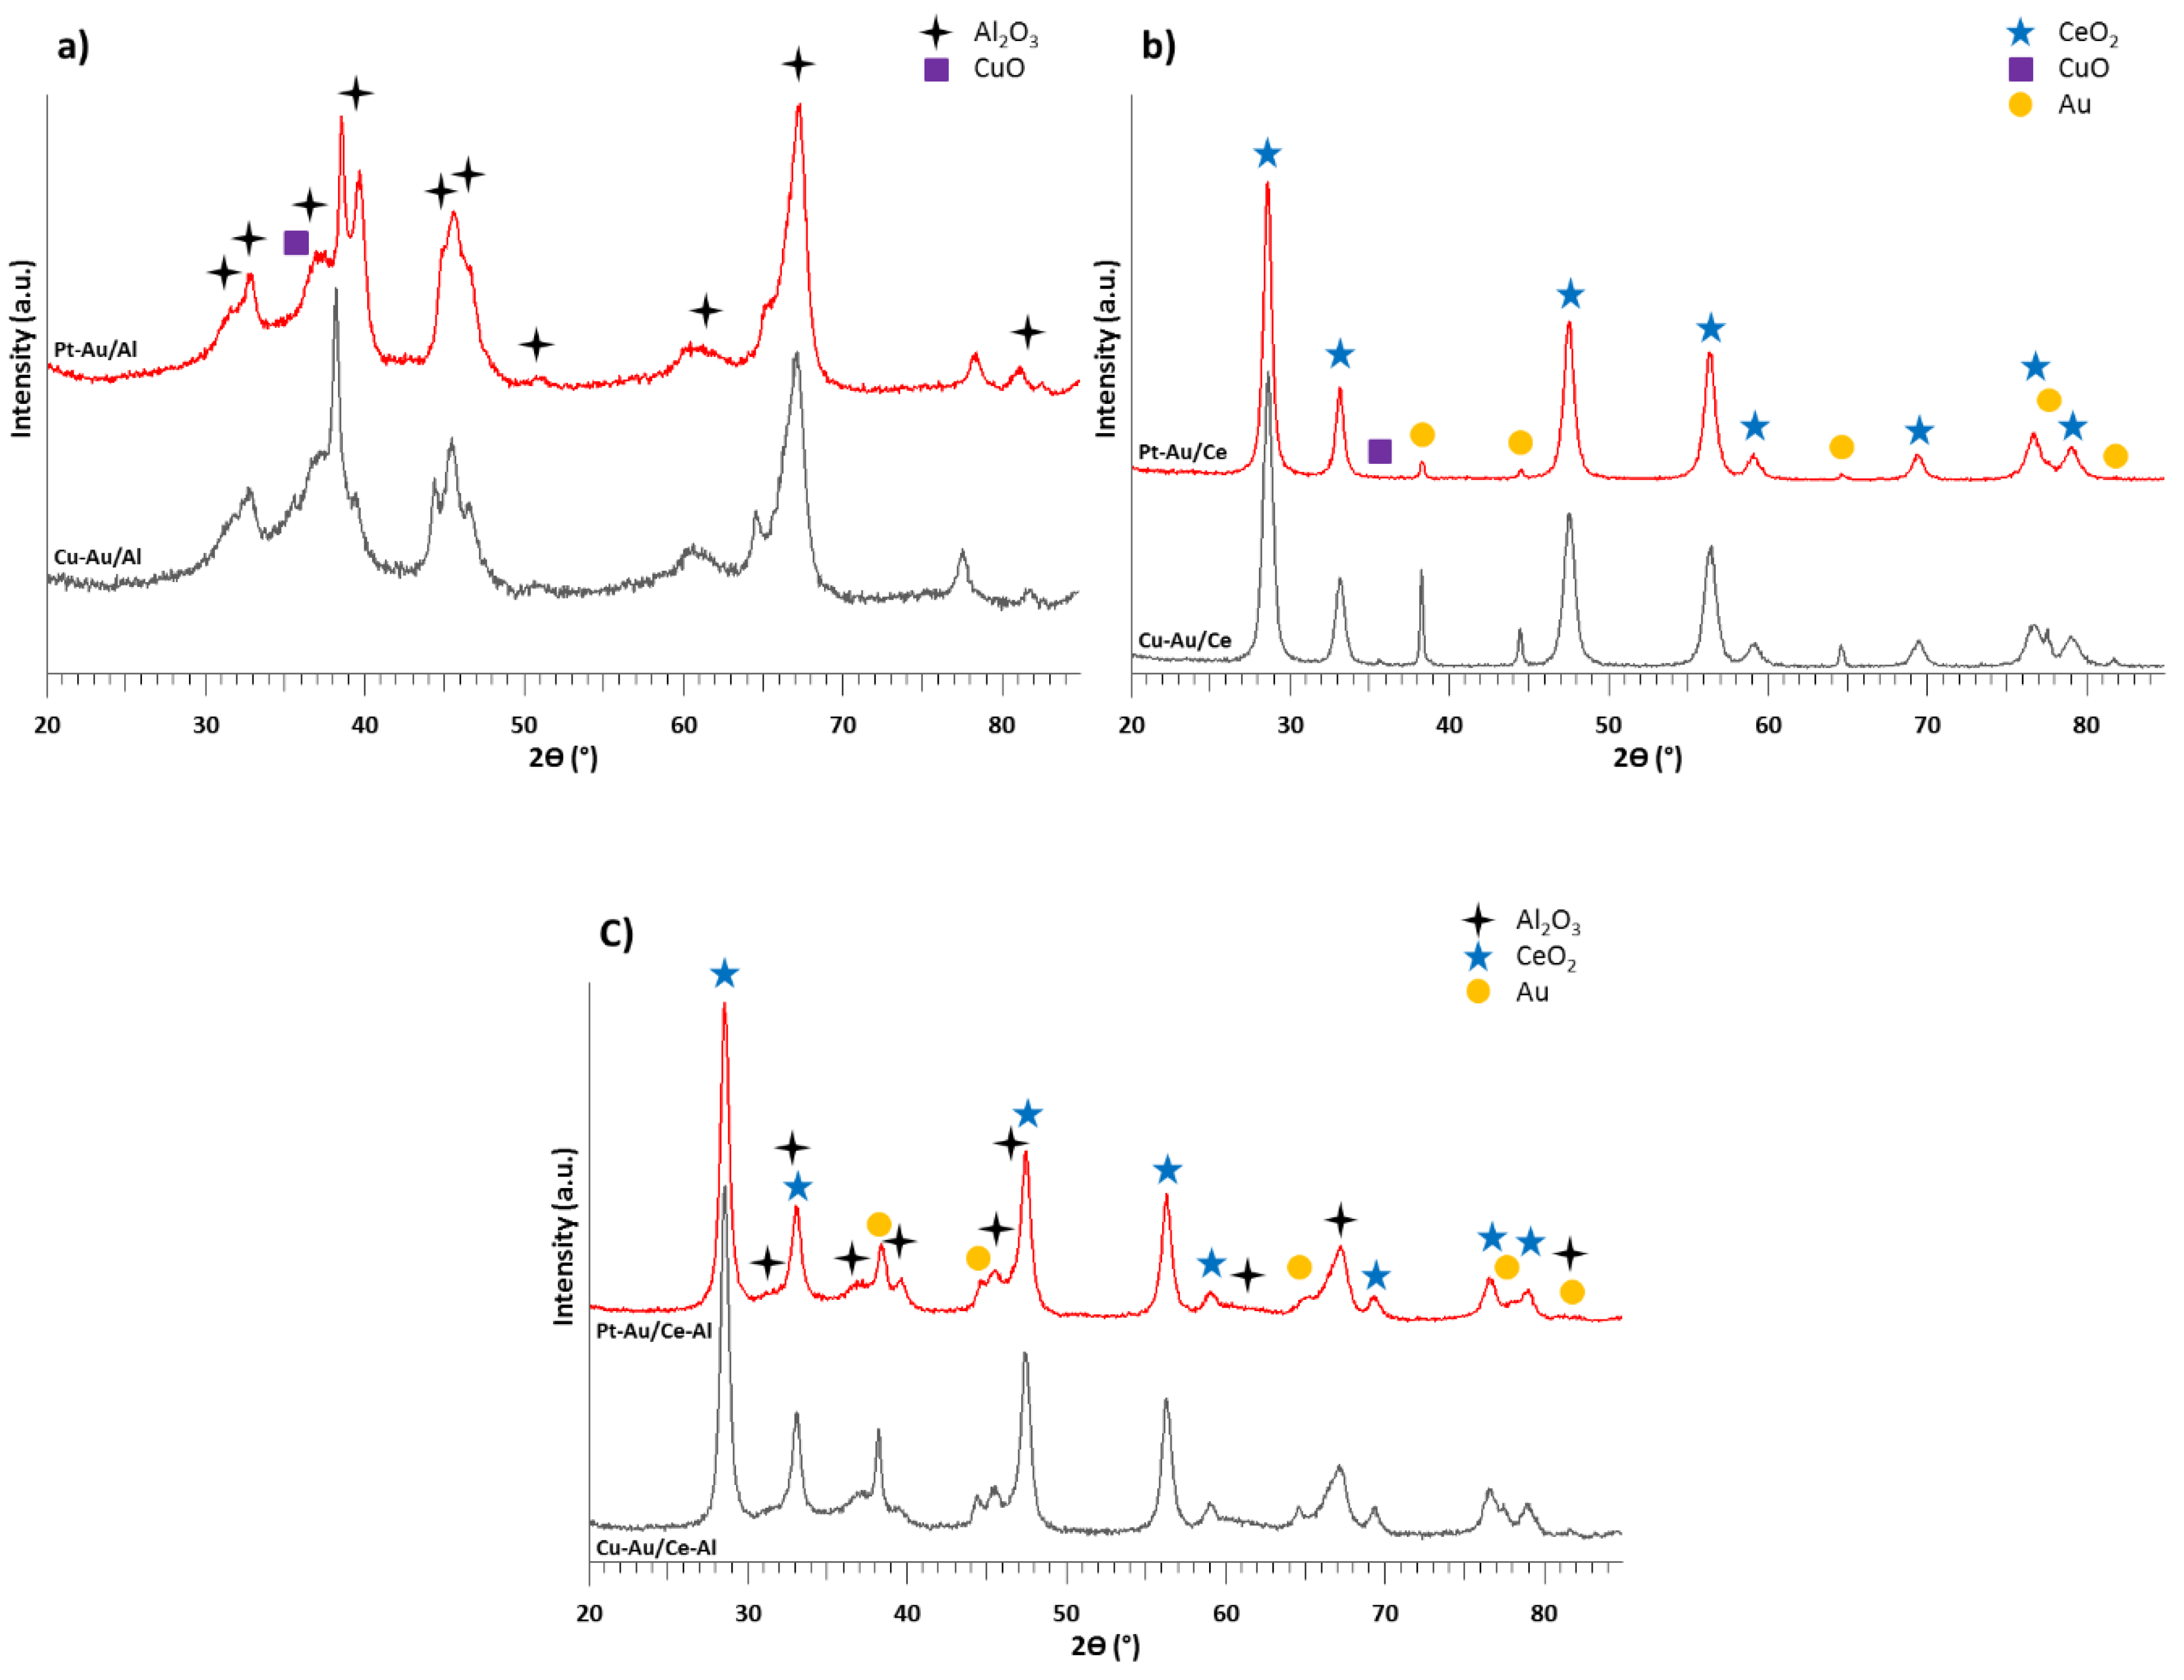
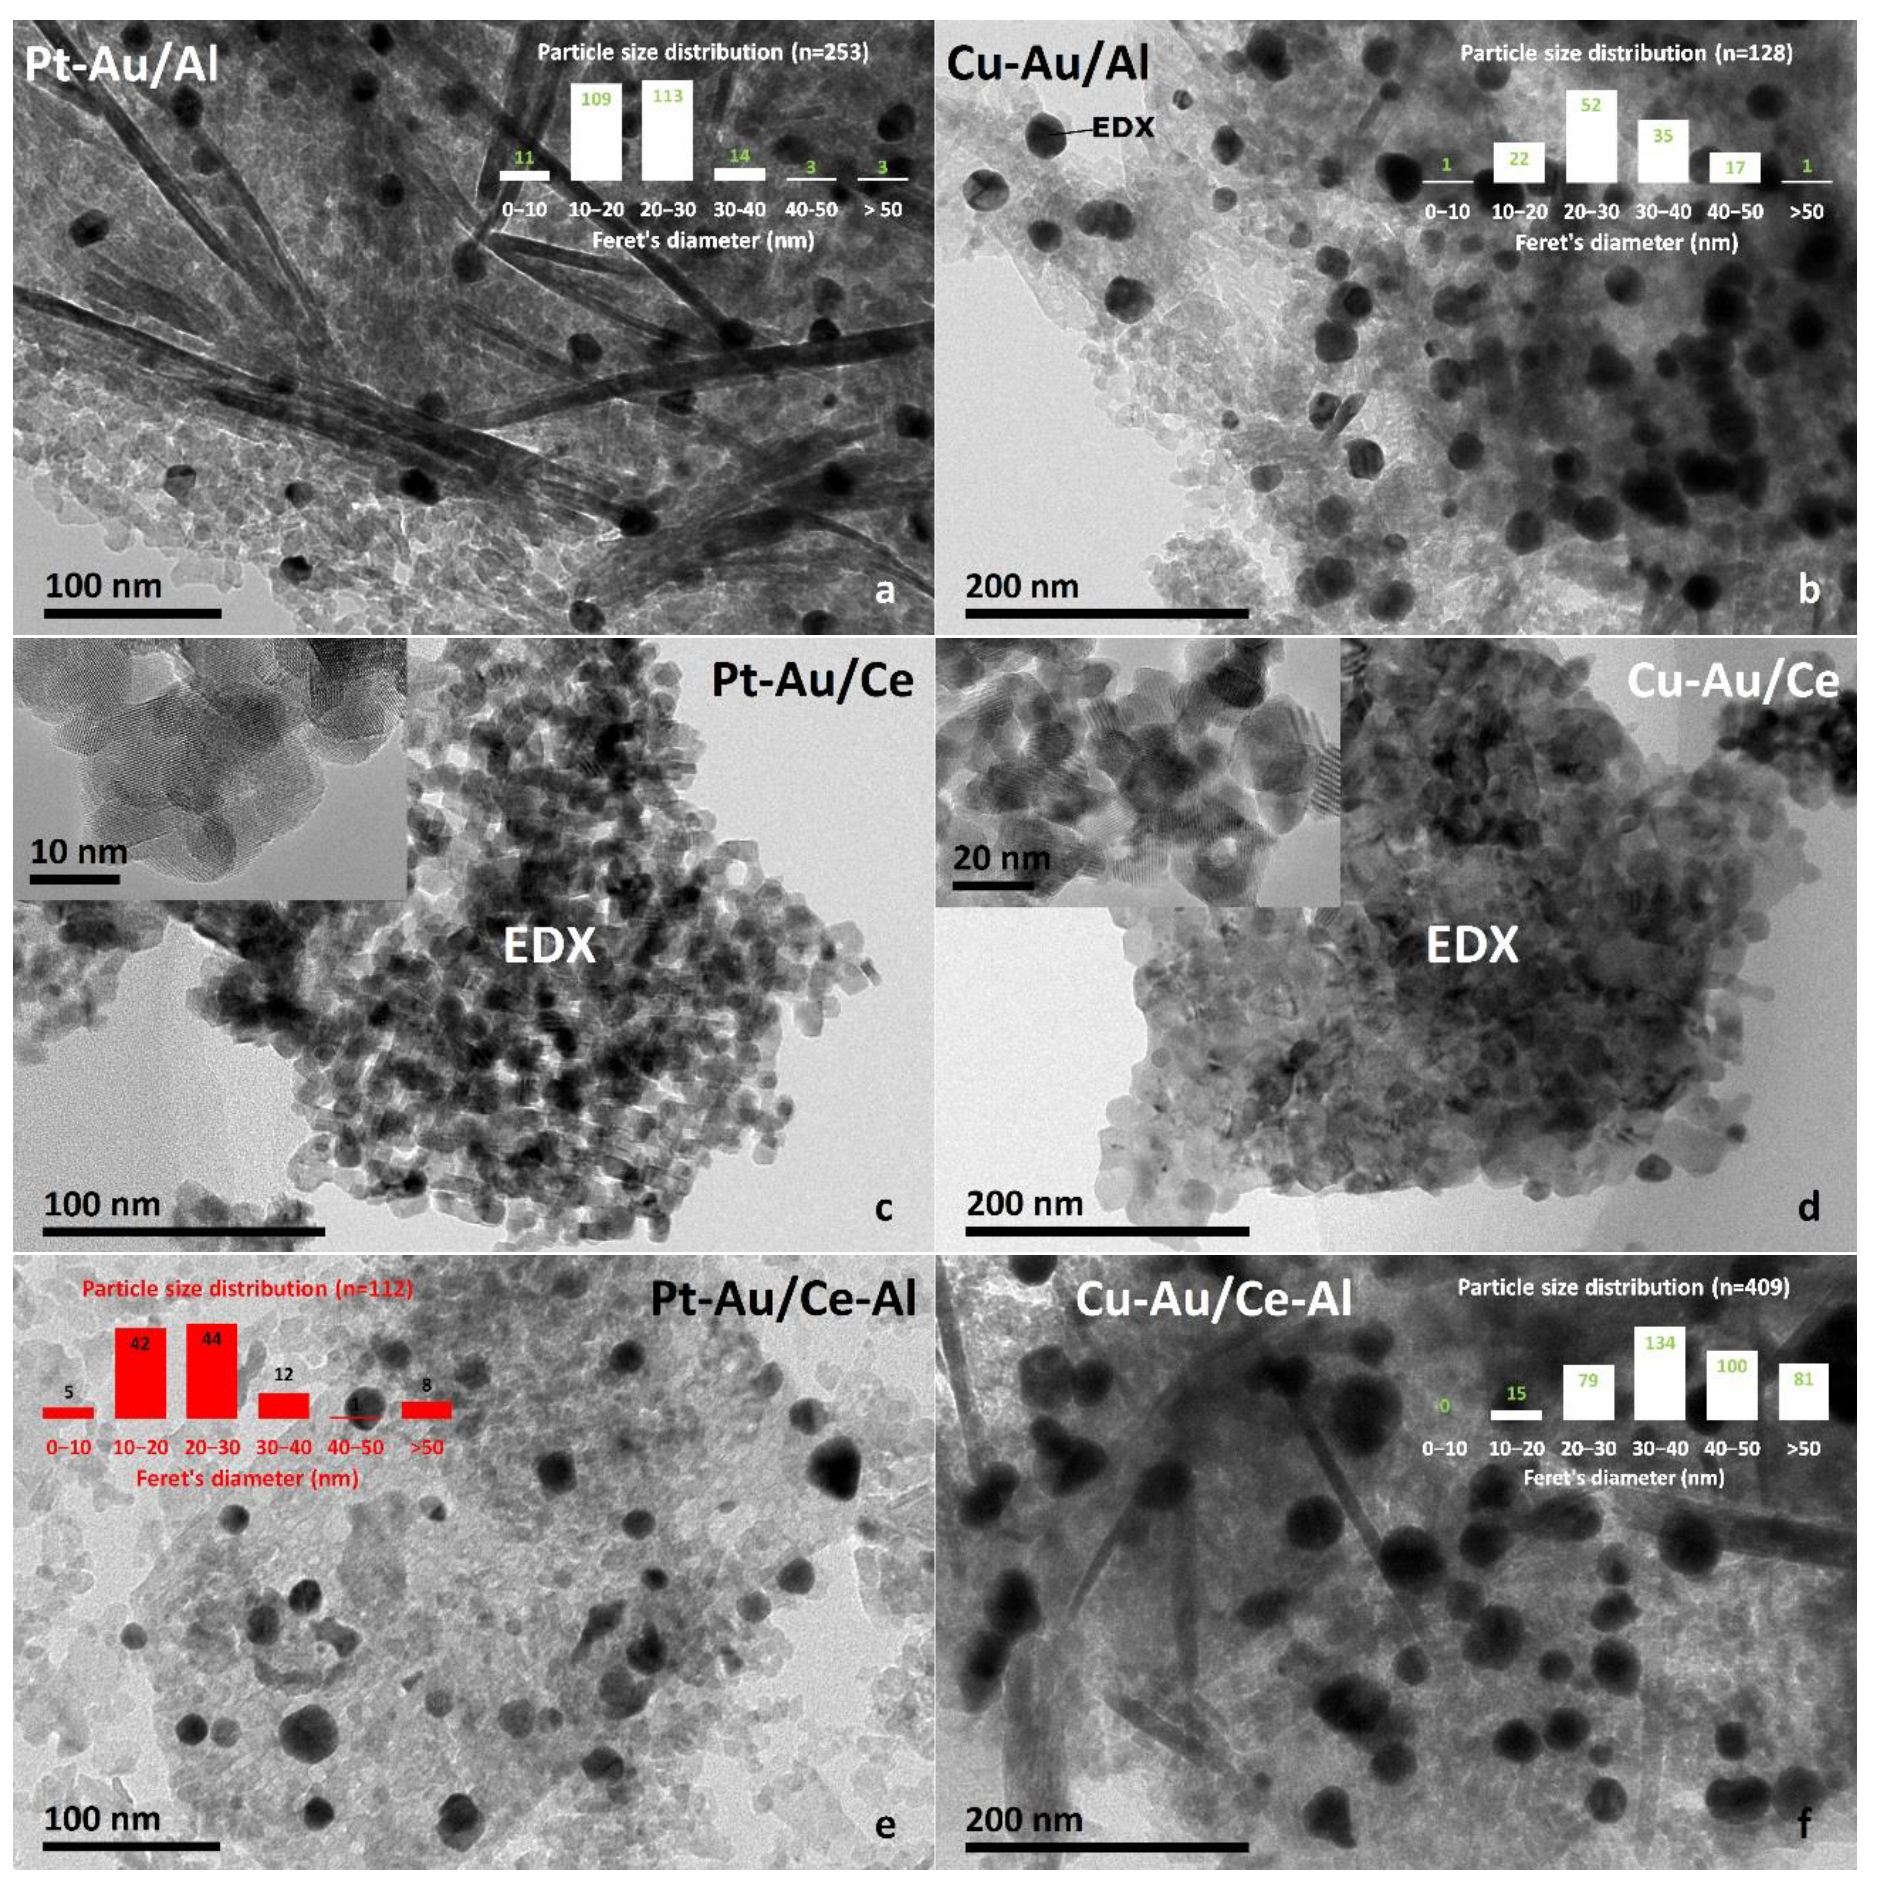
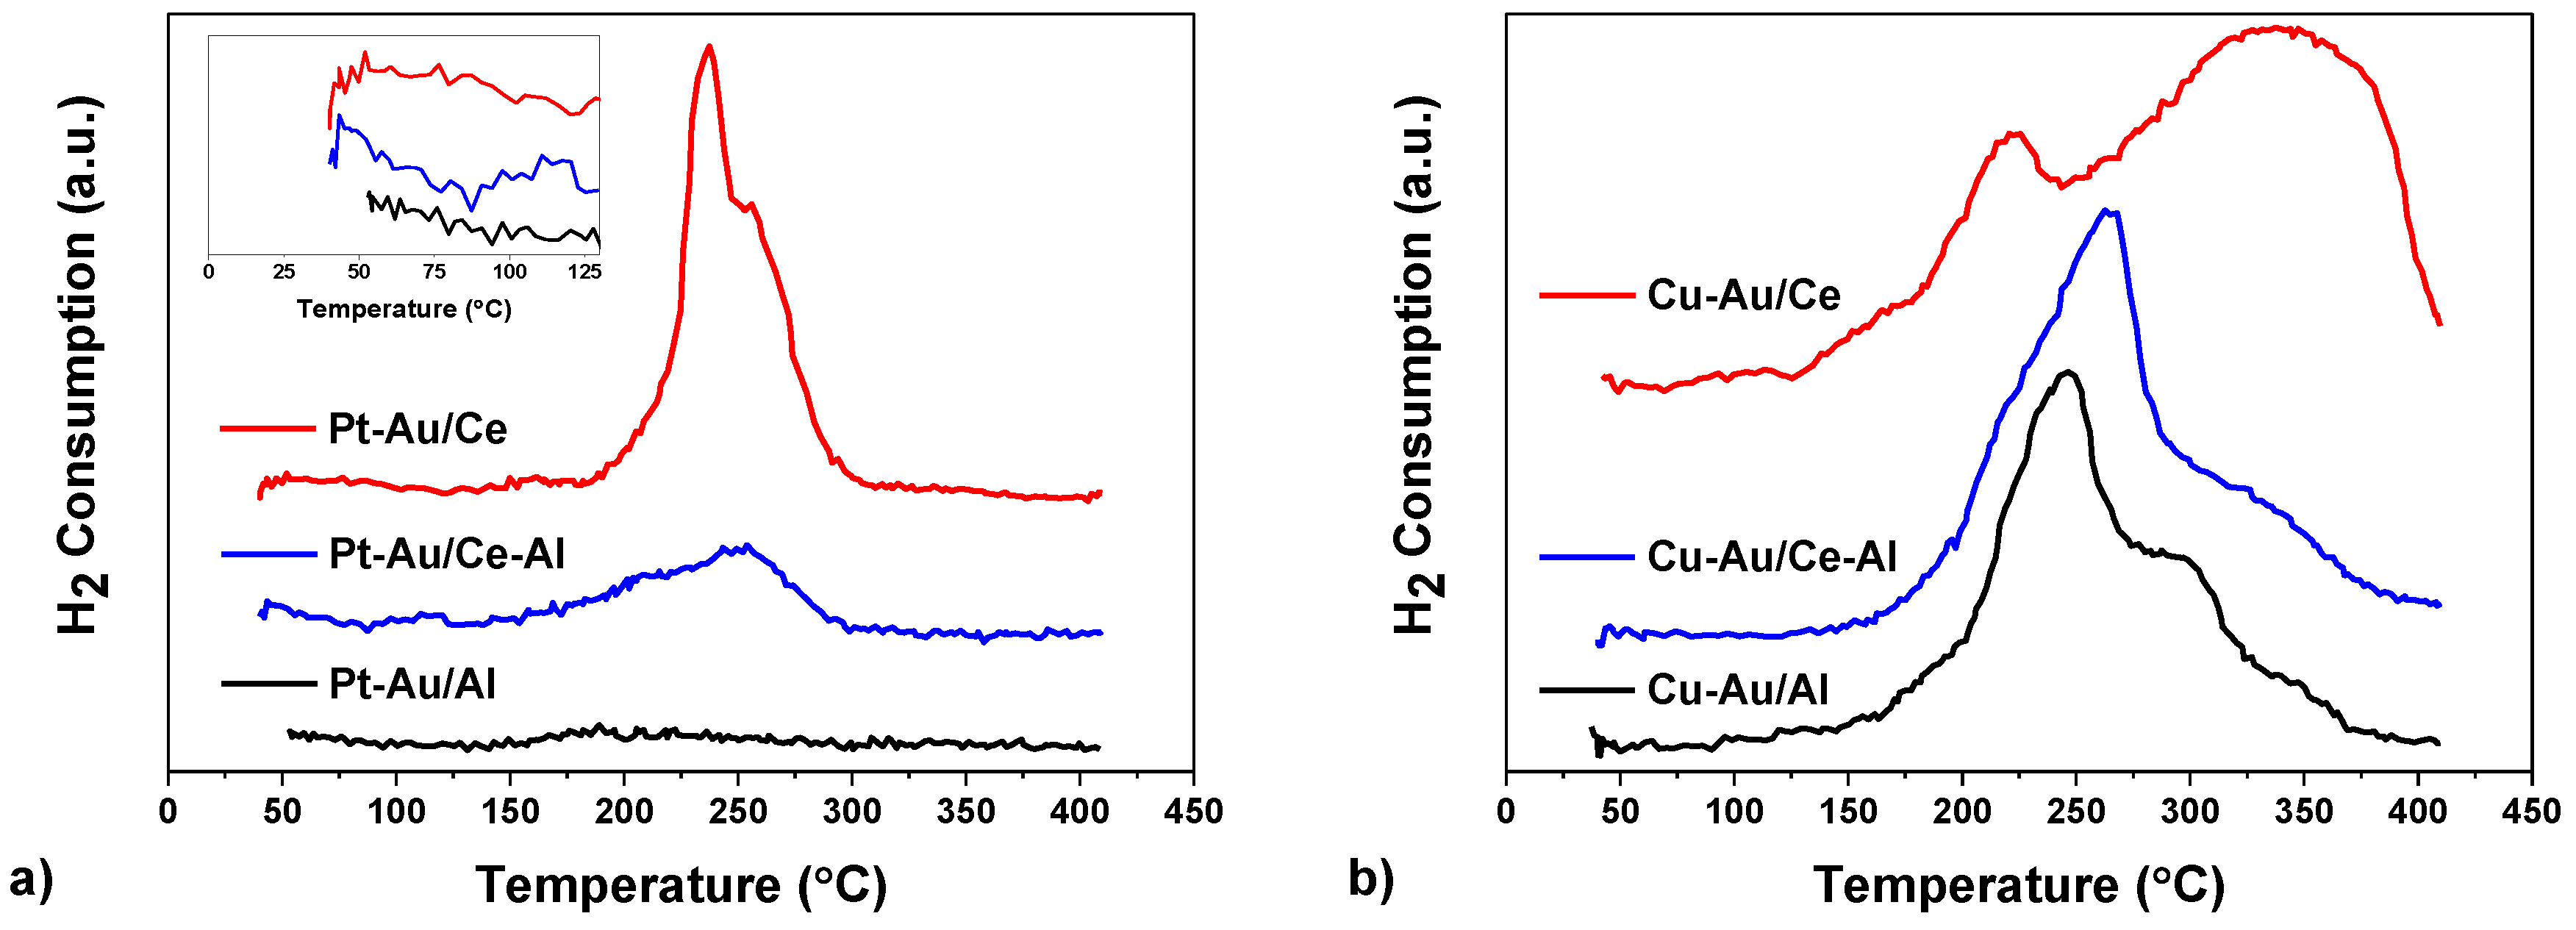
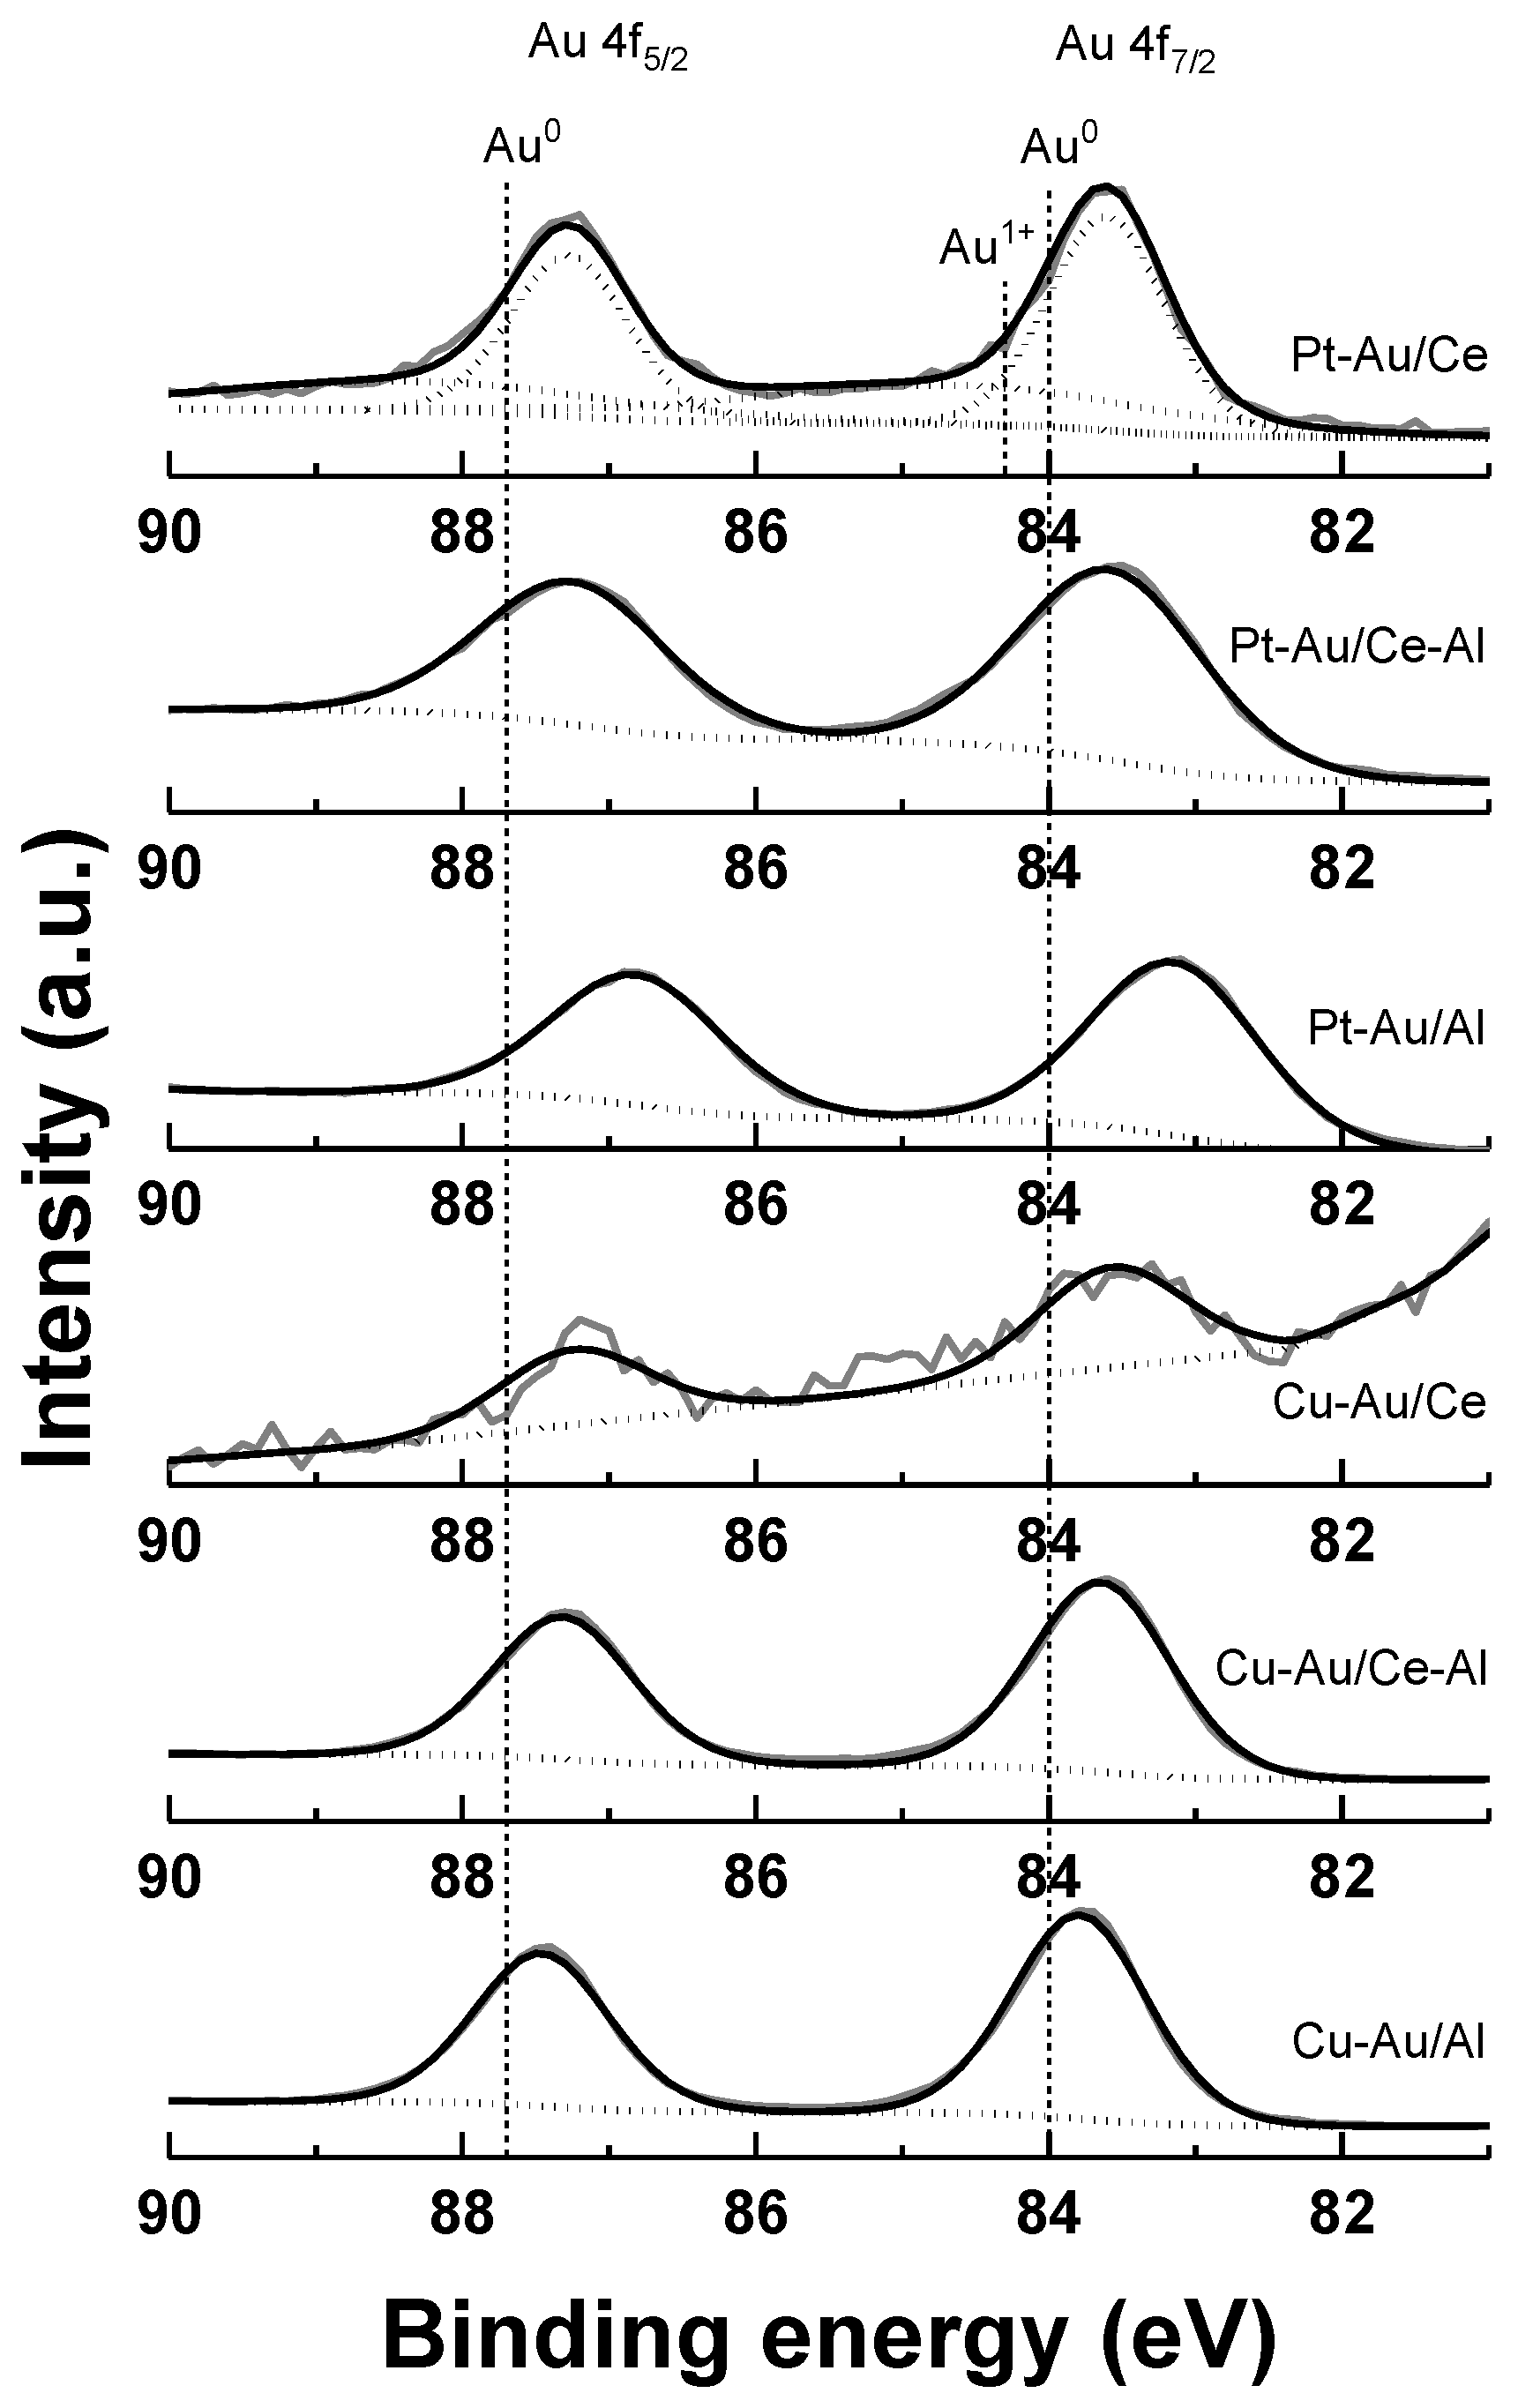
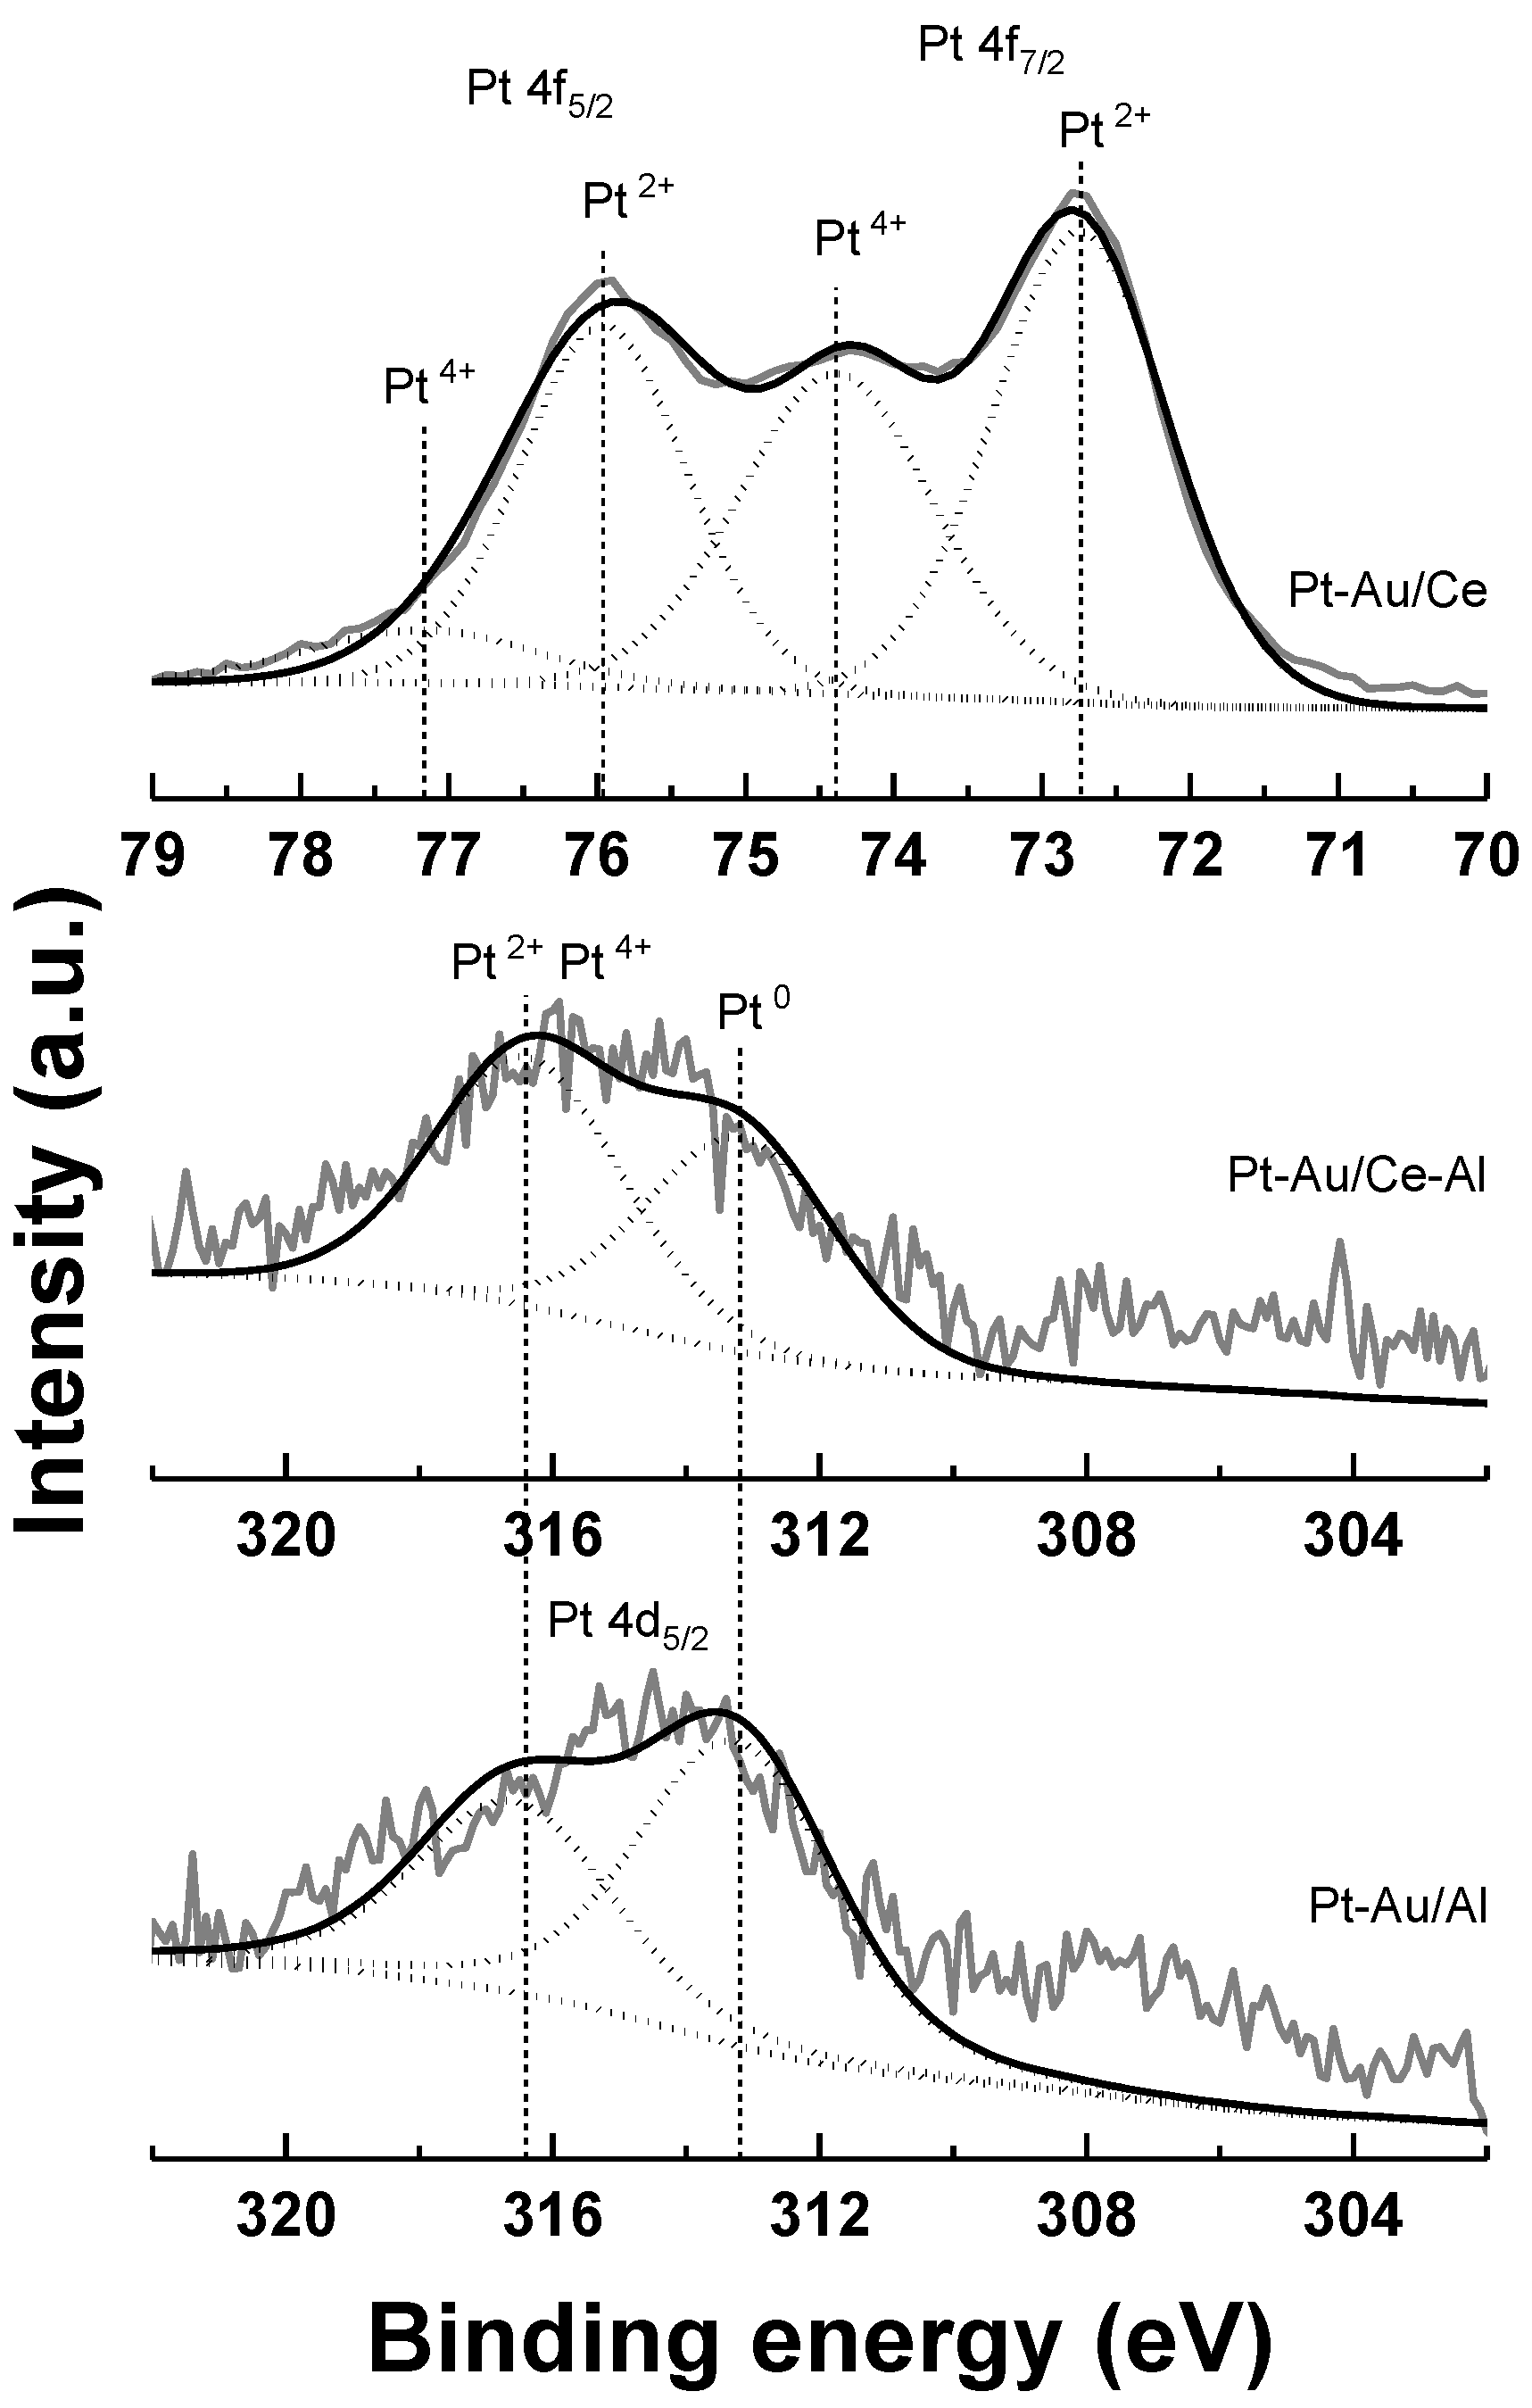
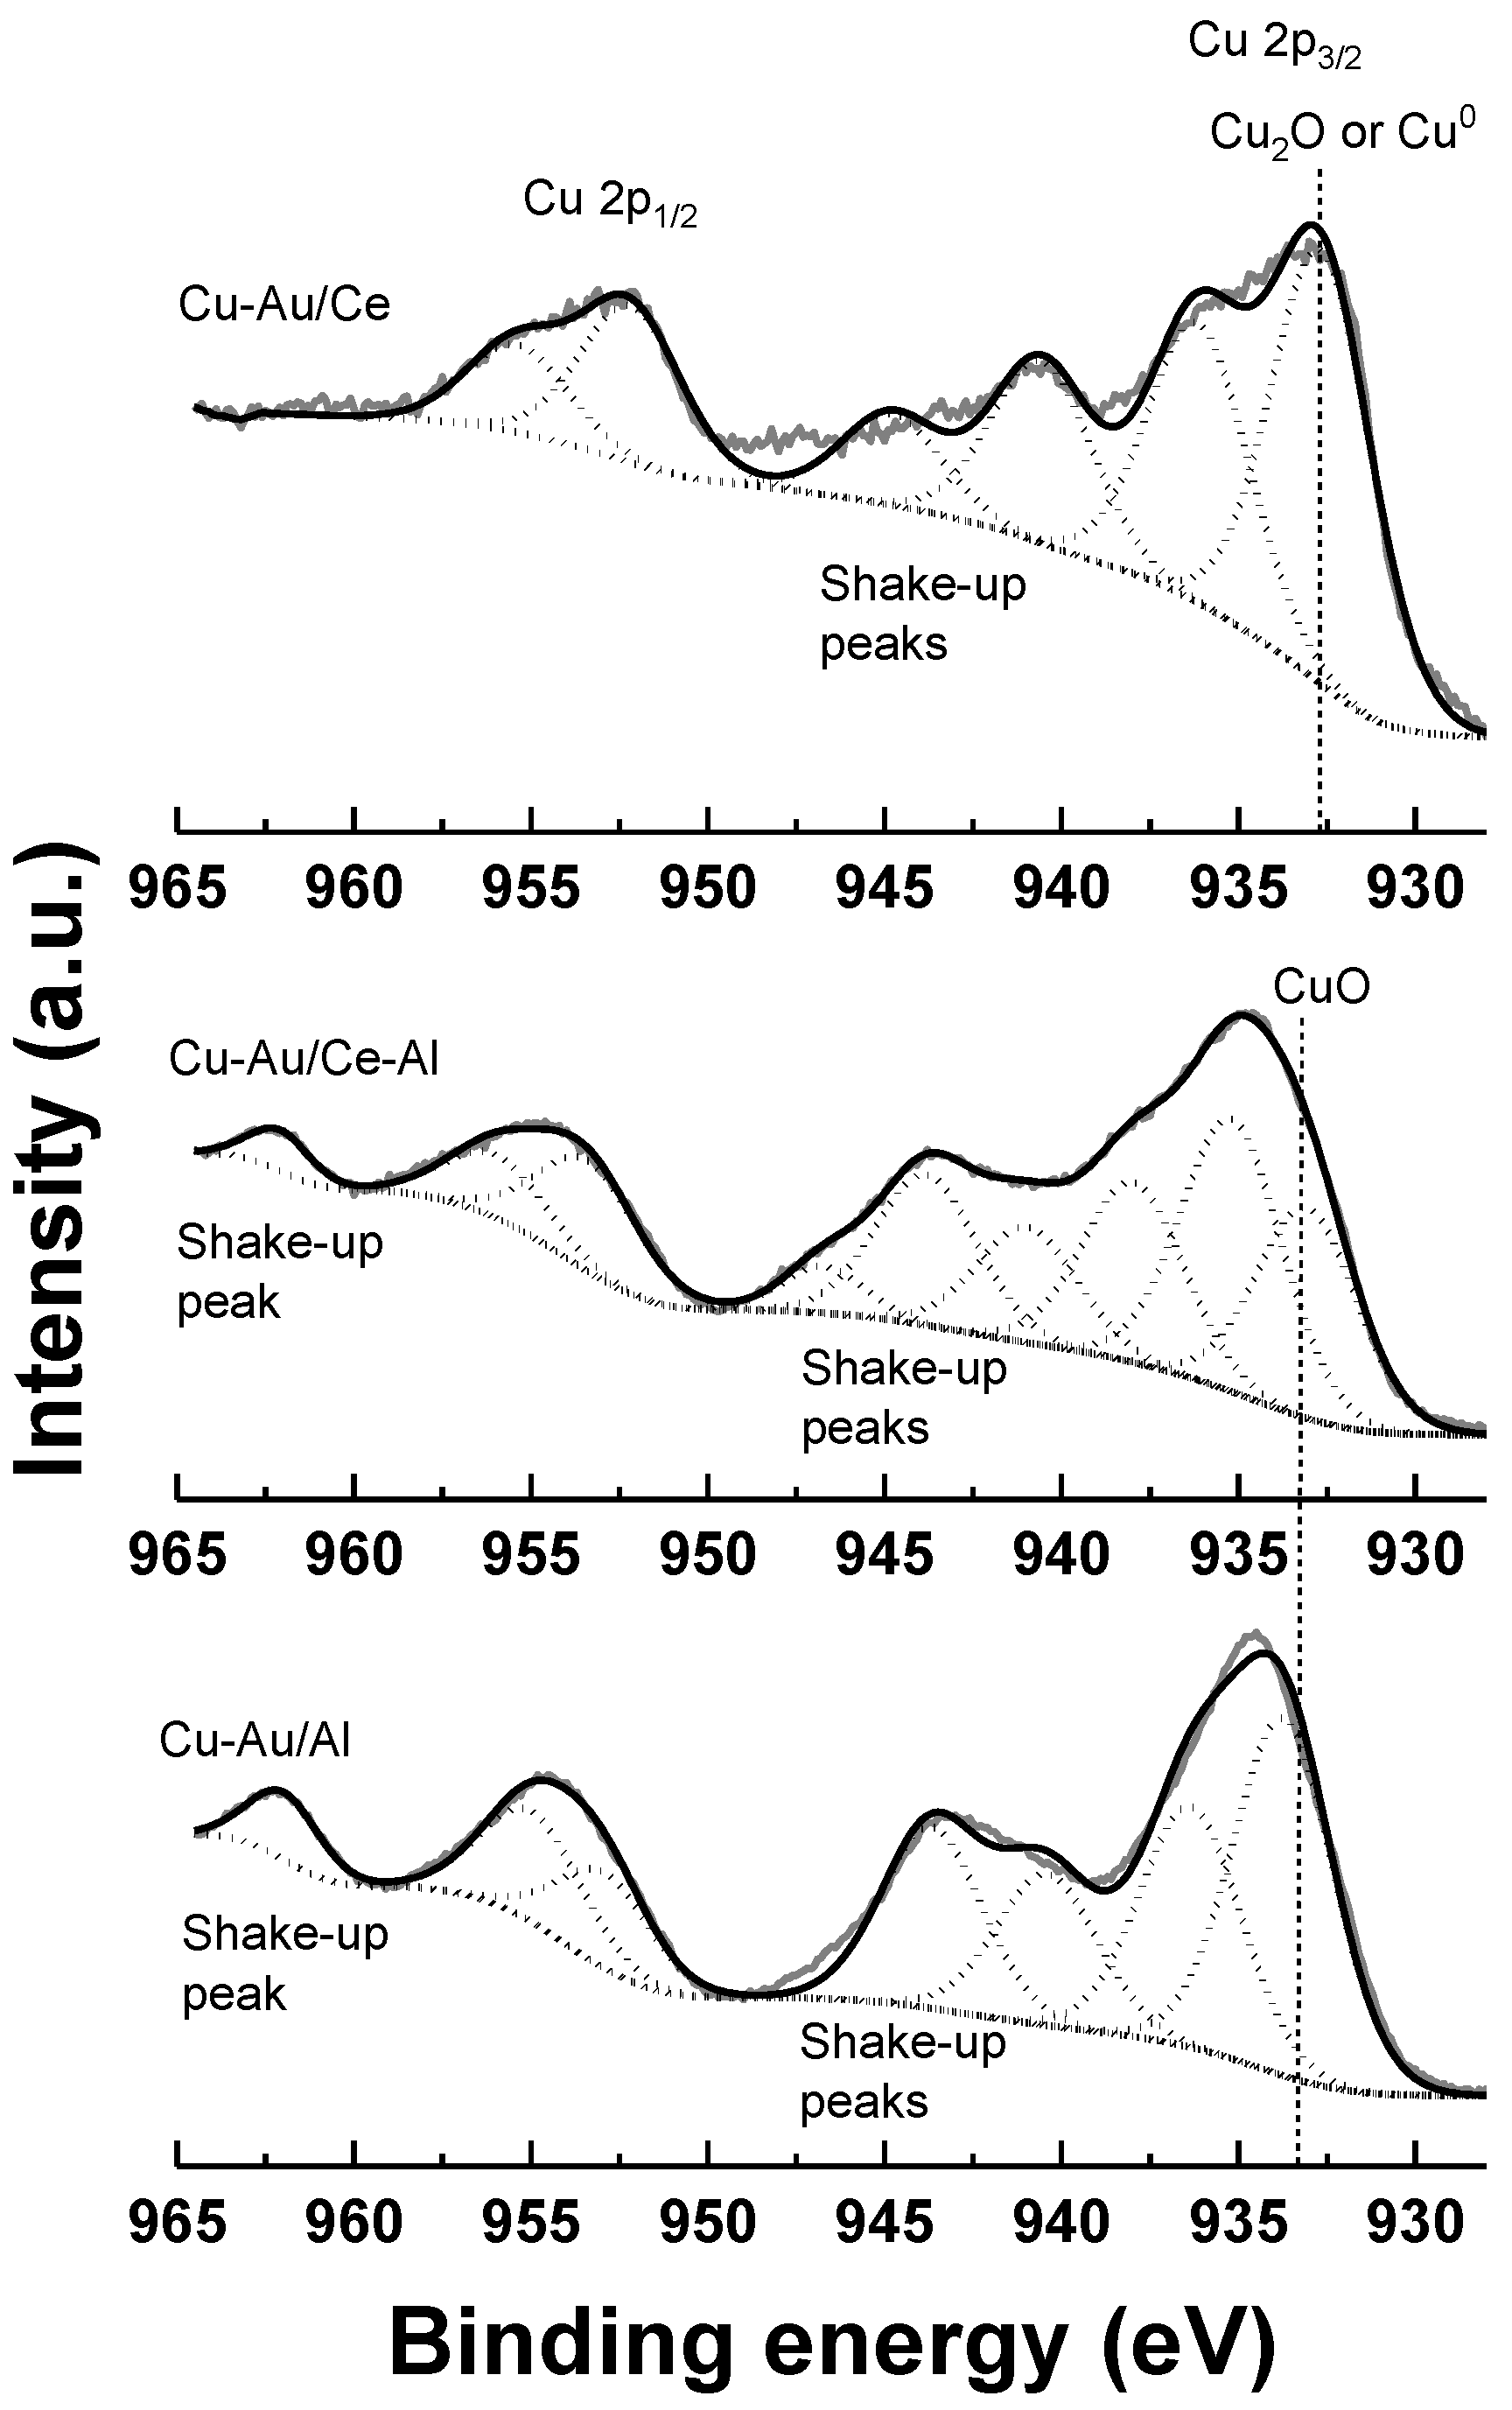
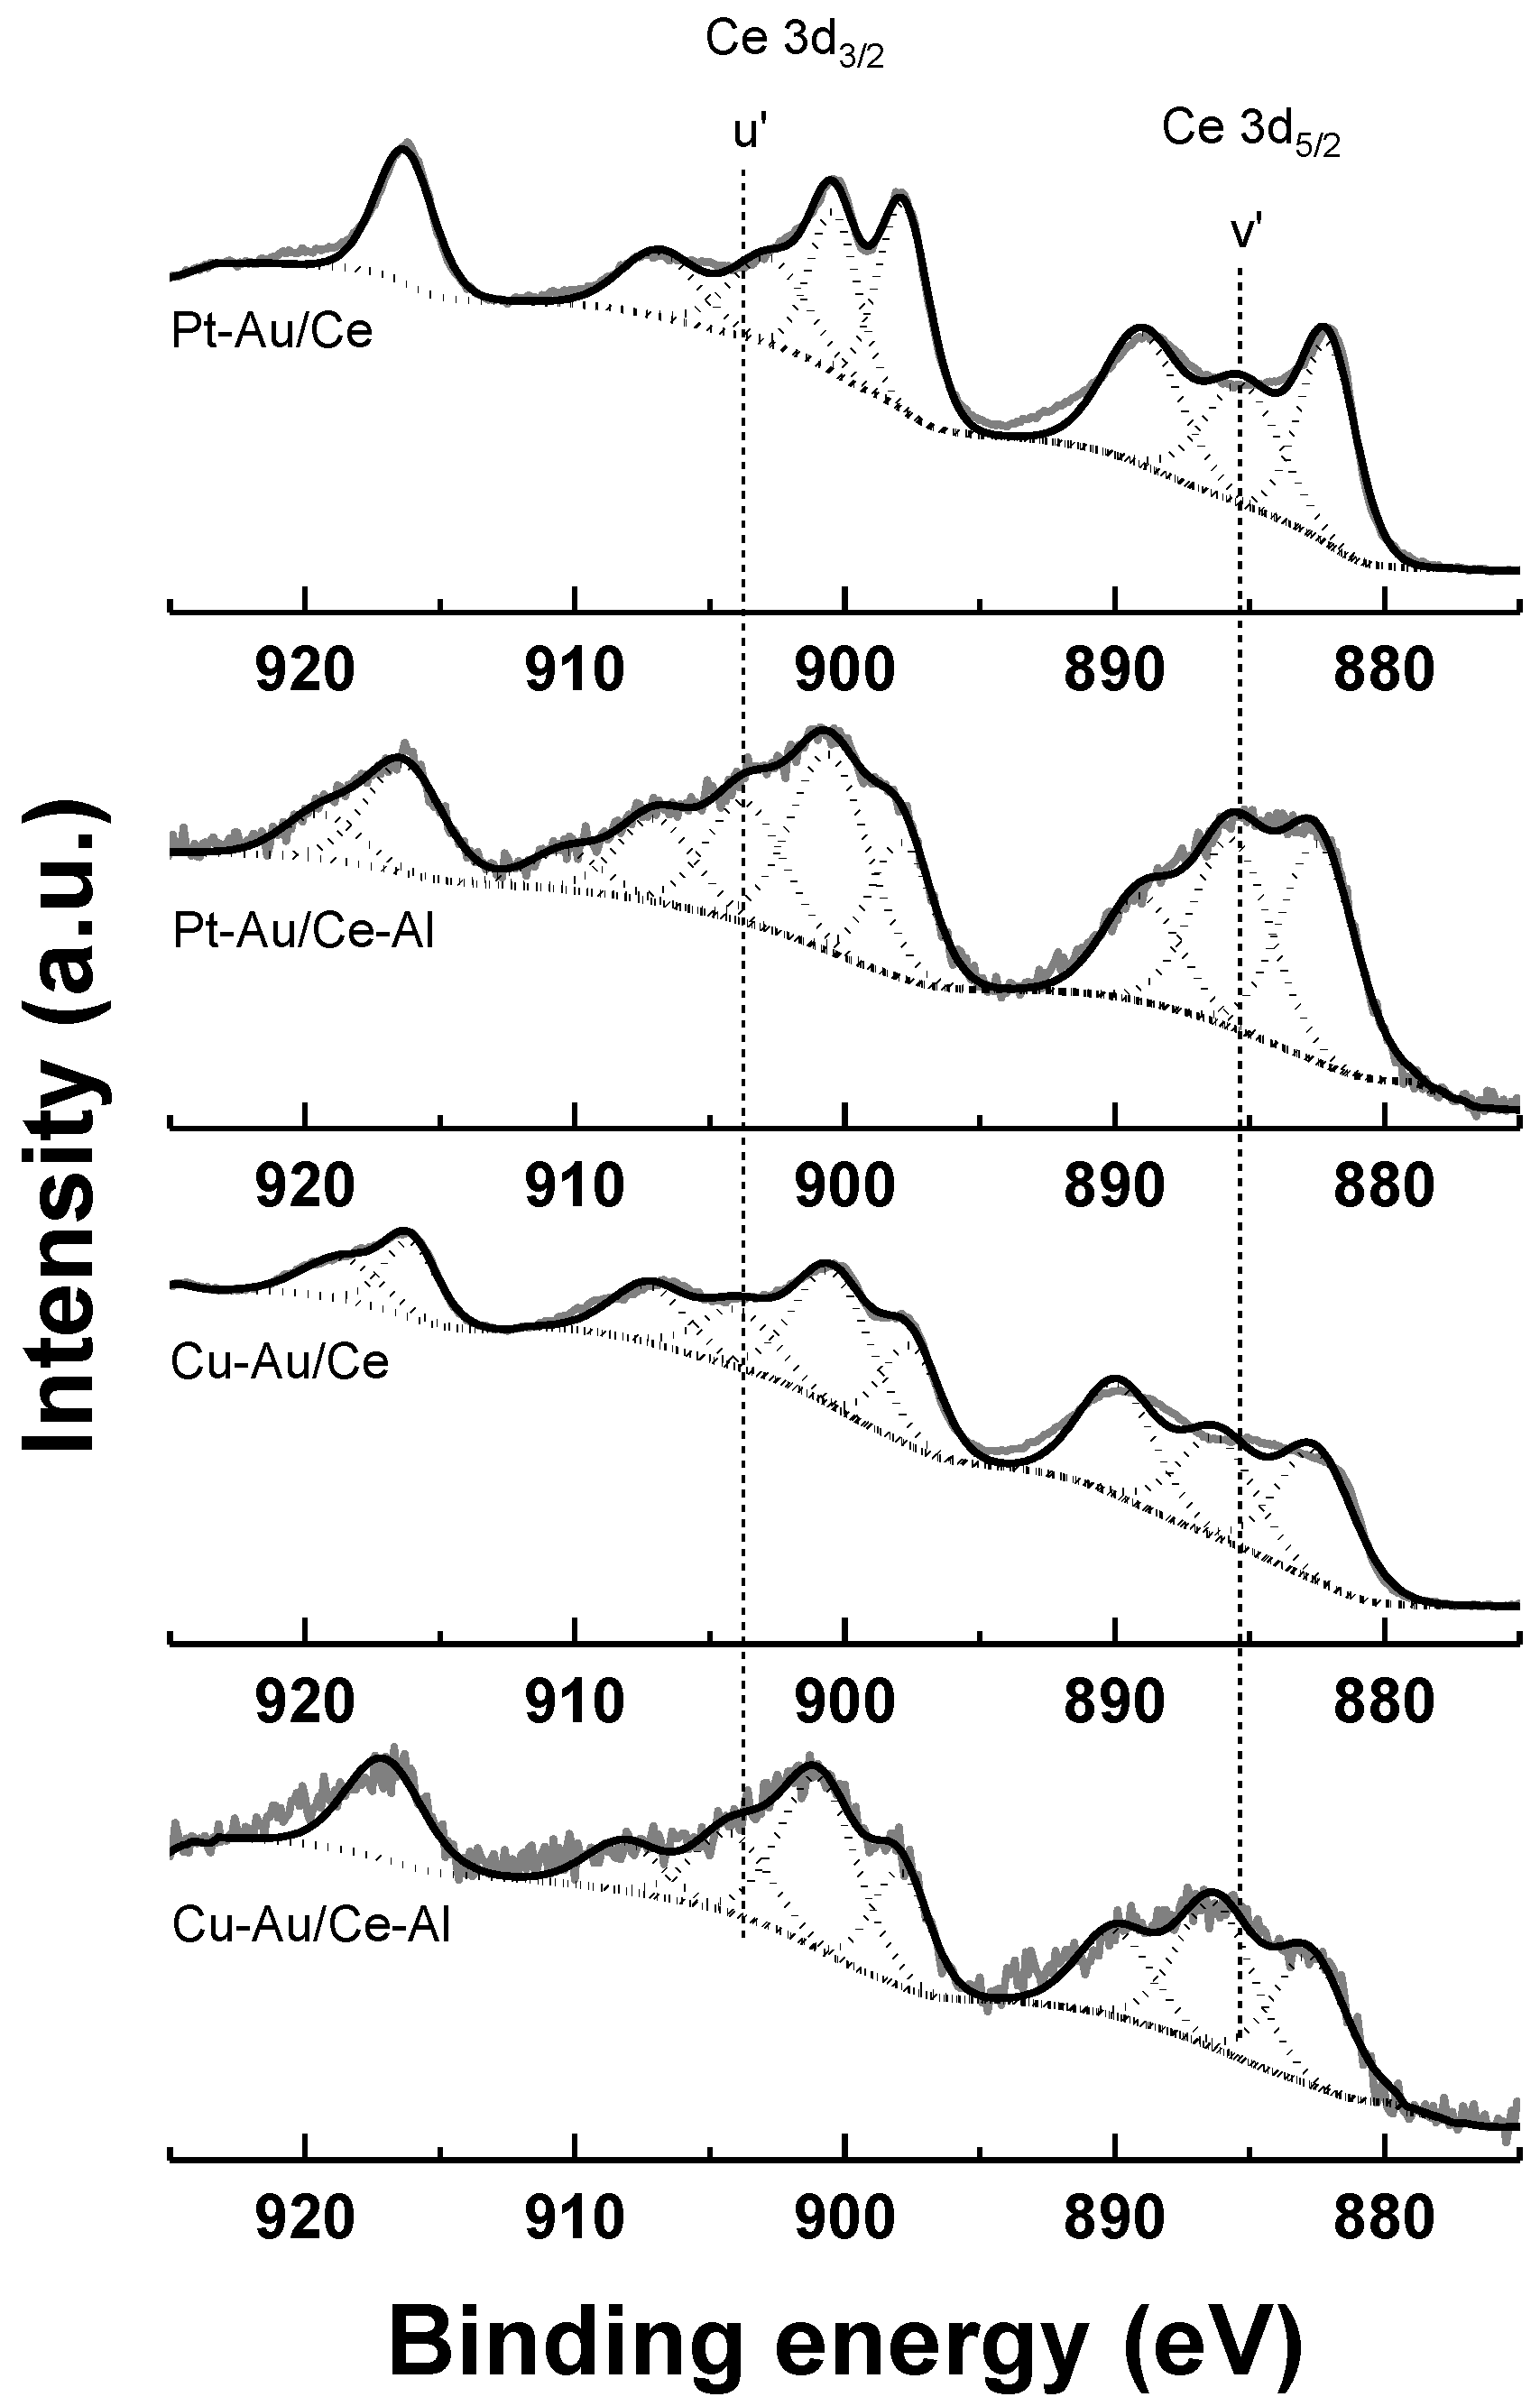
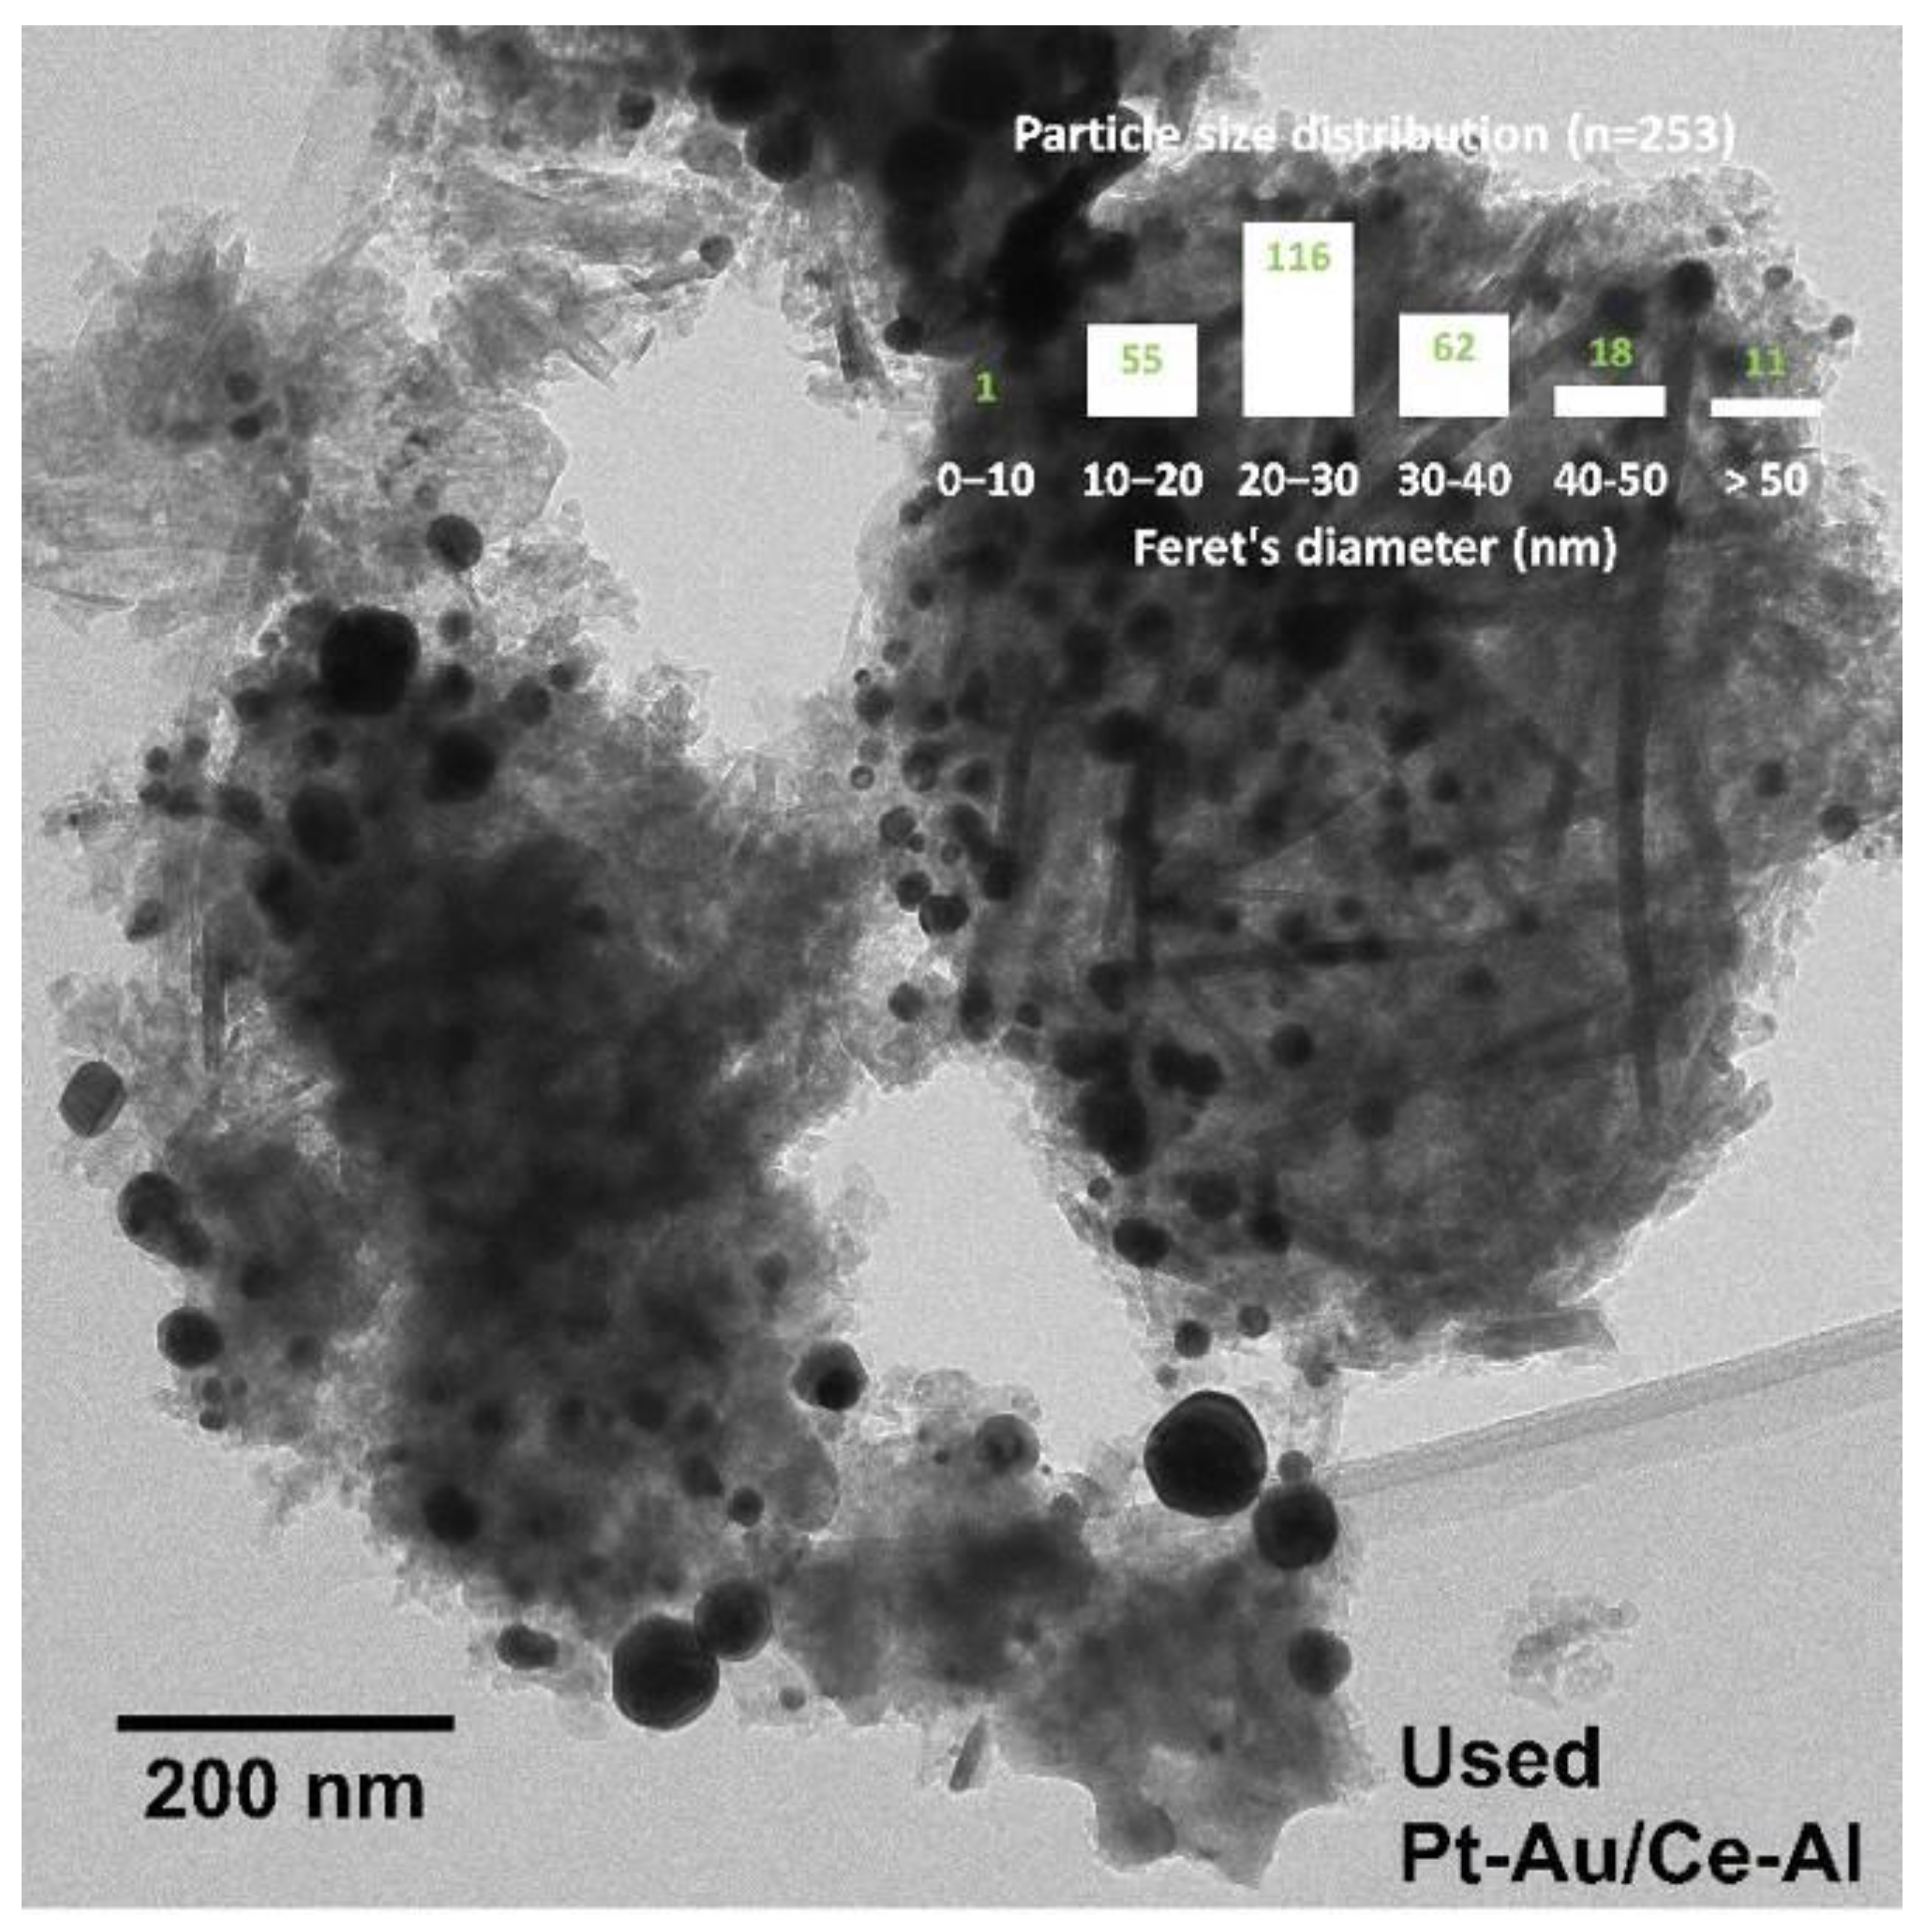
2.1. Characterization
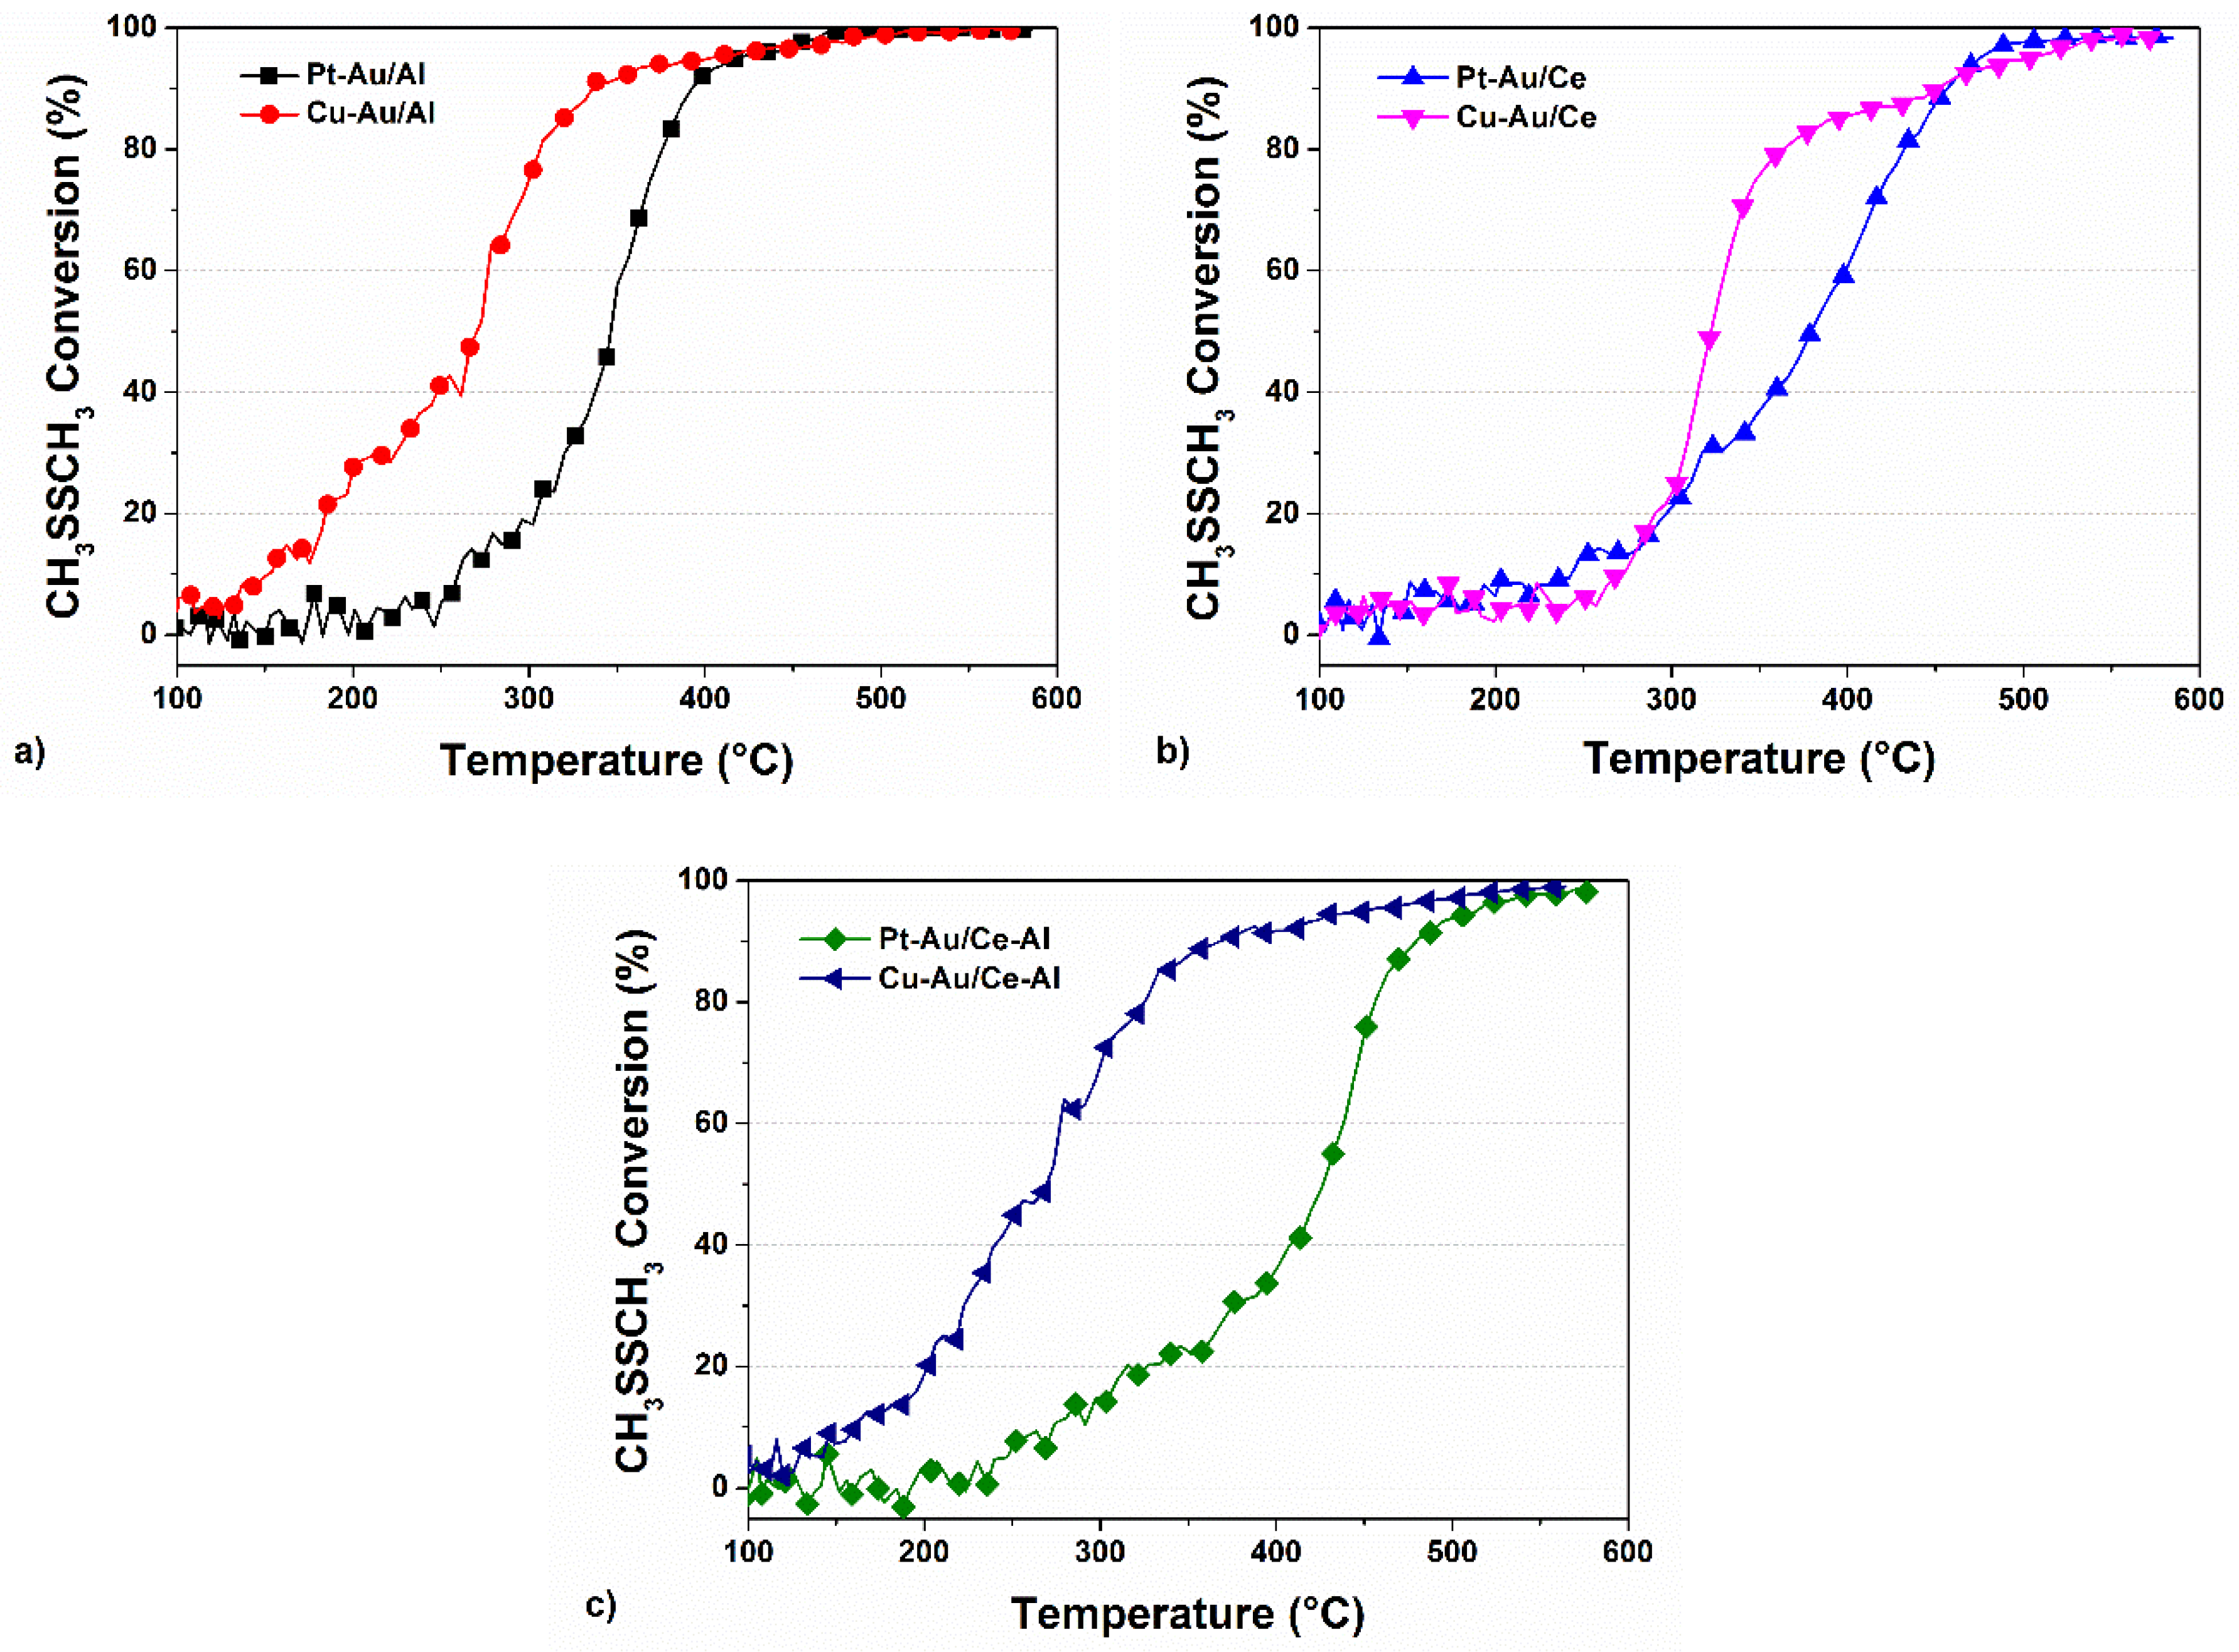
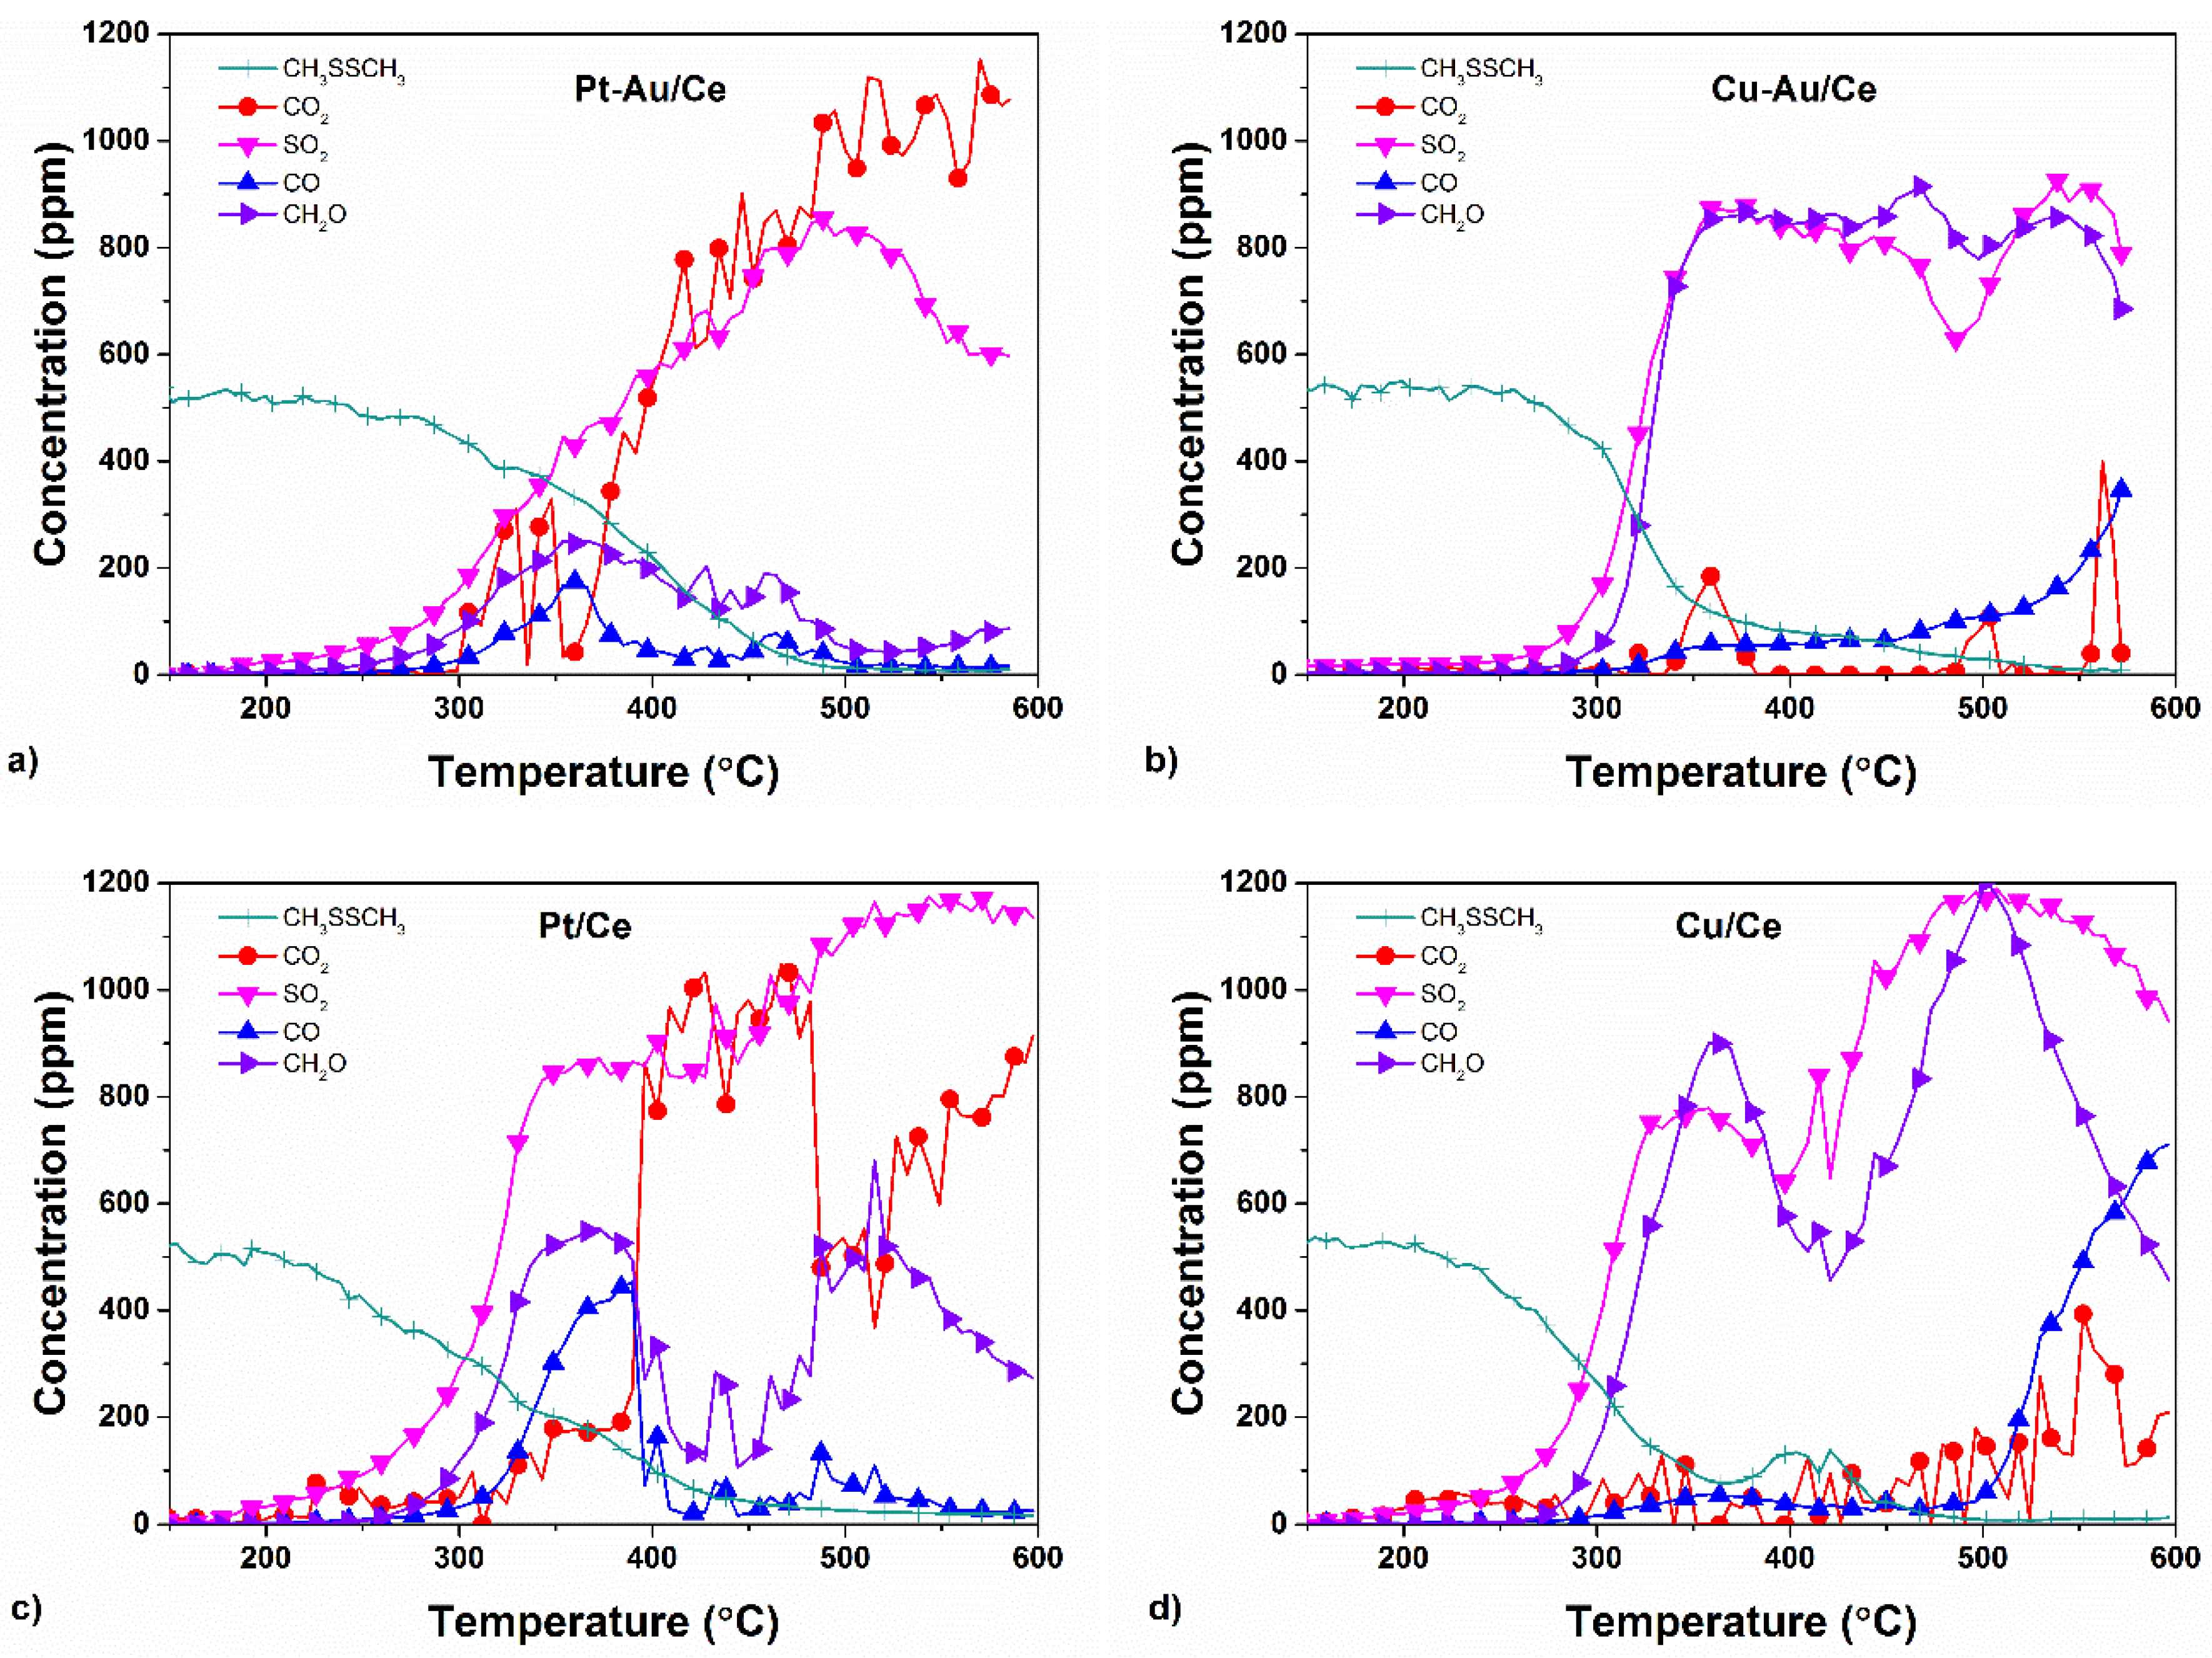
2.2. Activity of the Catalysts in the Oxidation of DMDS
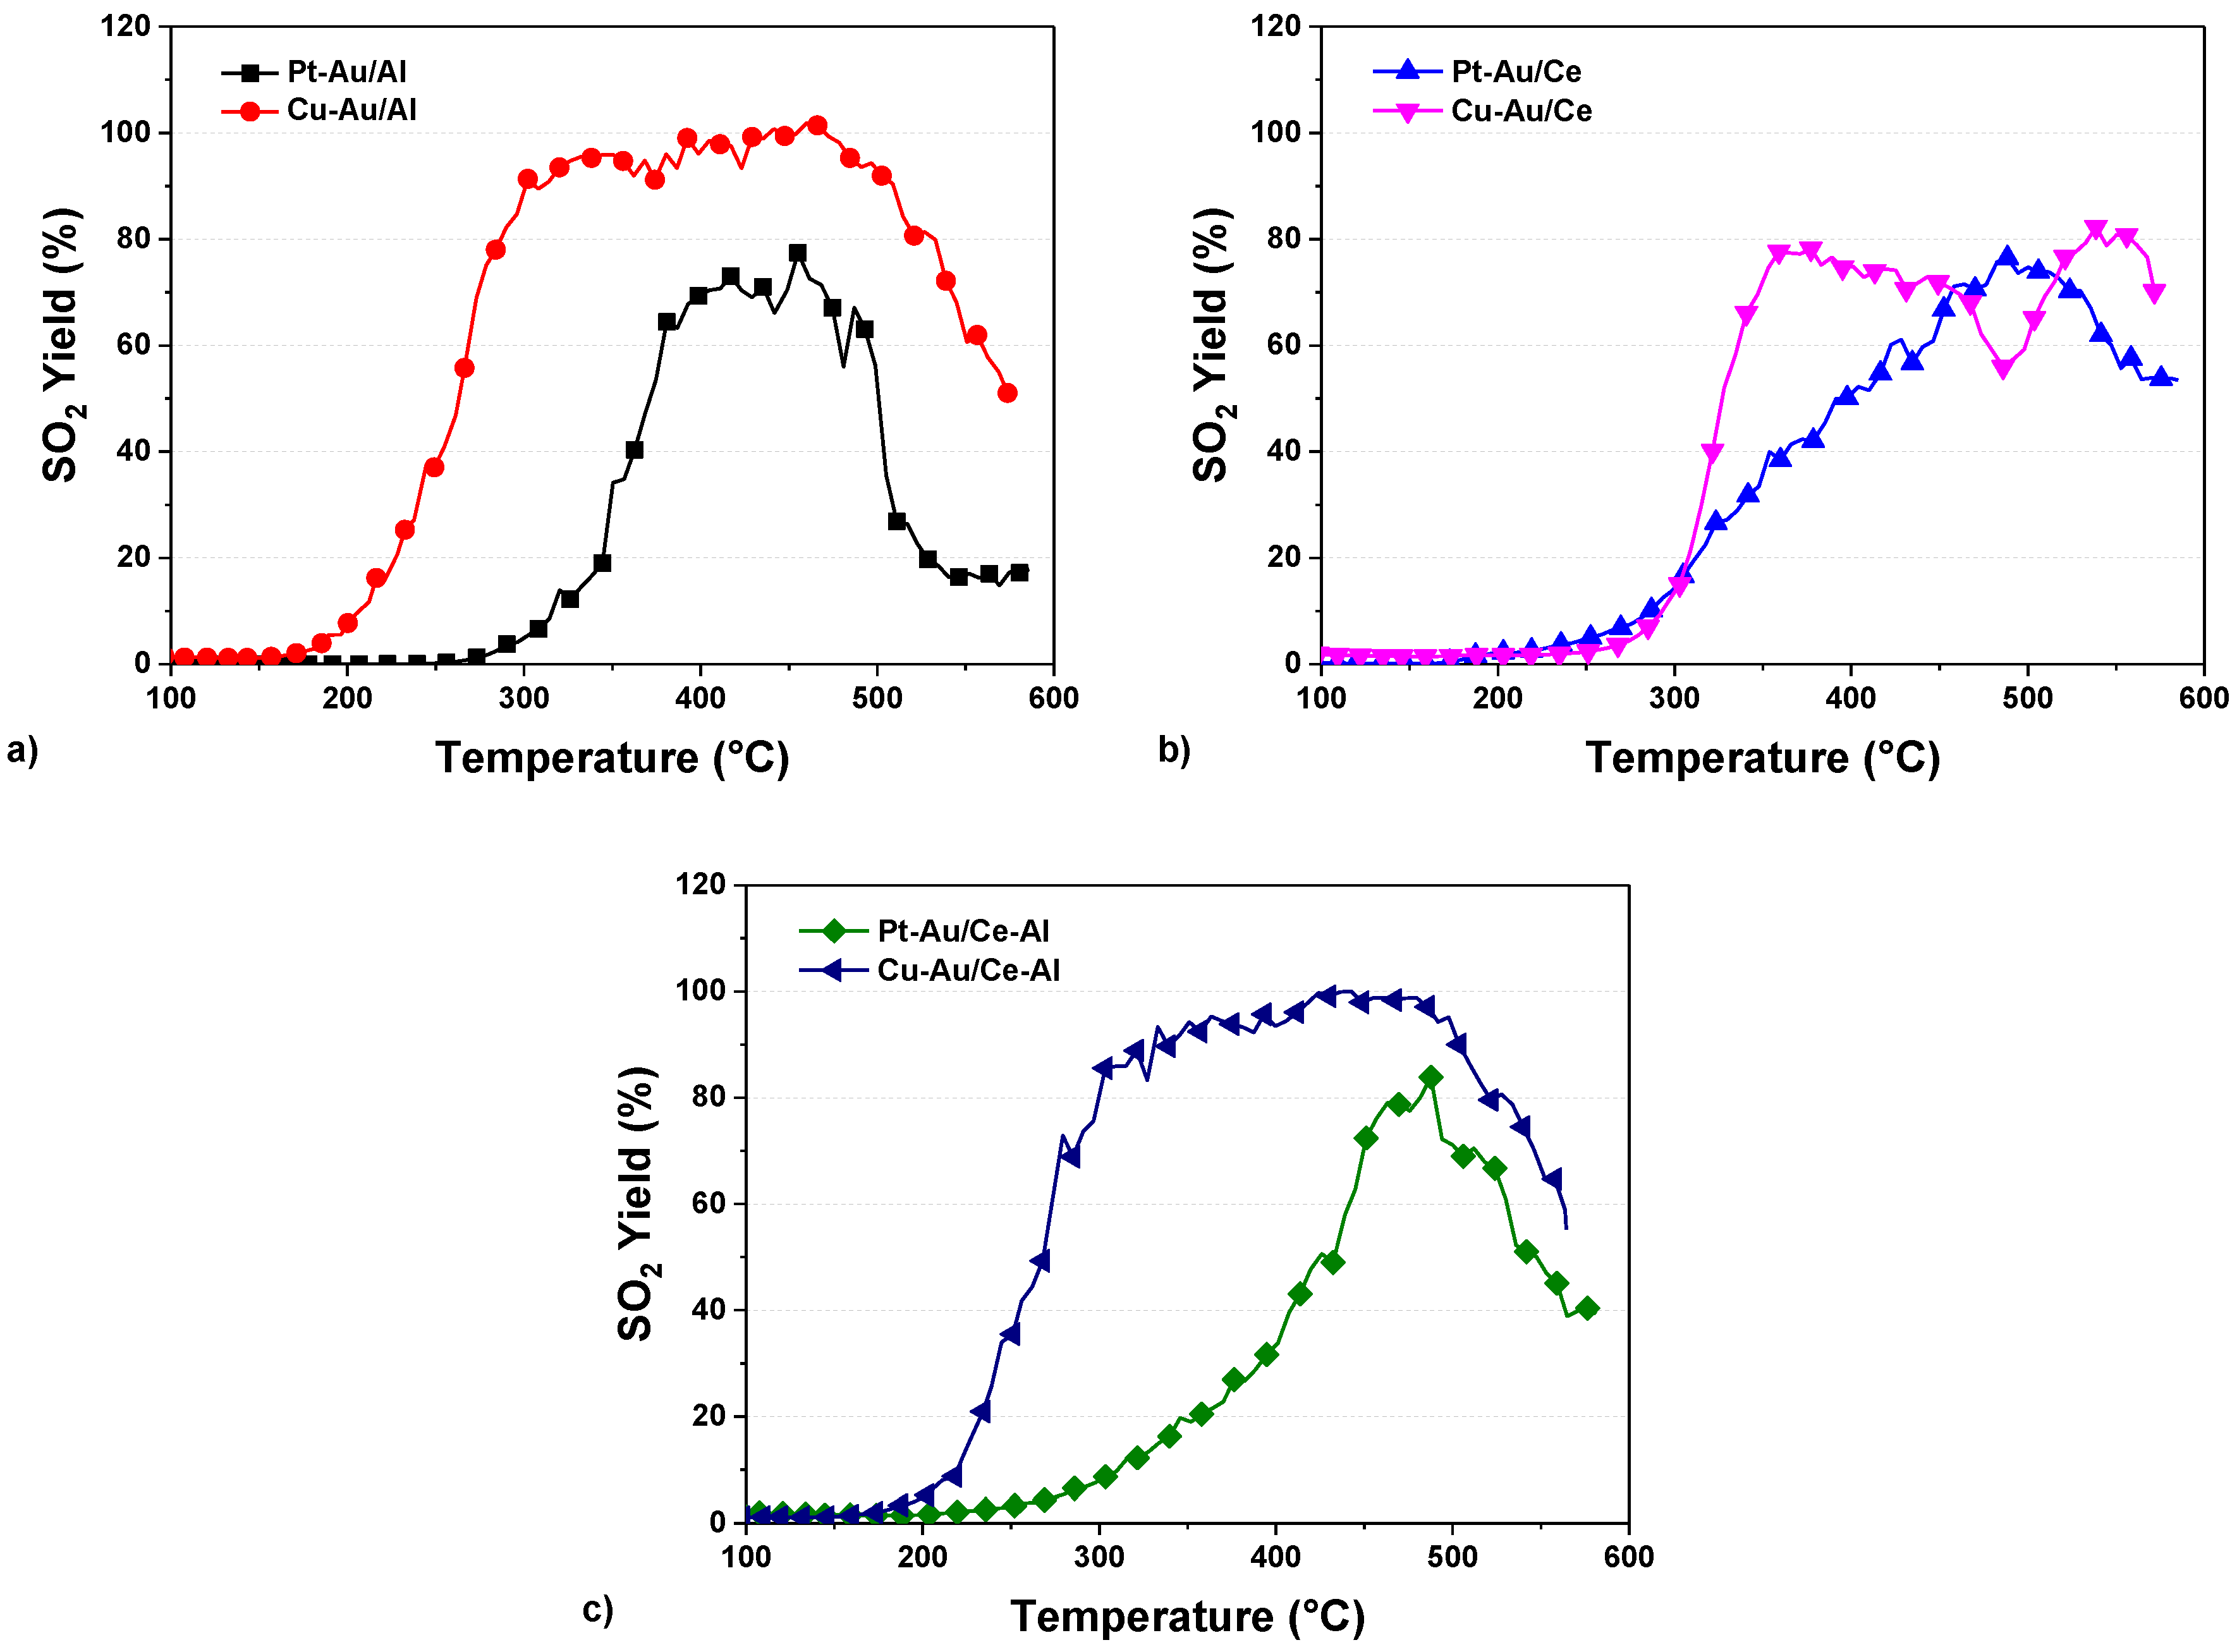
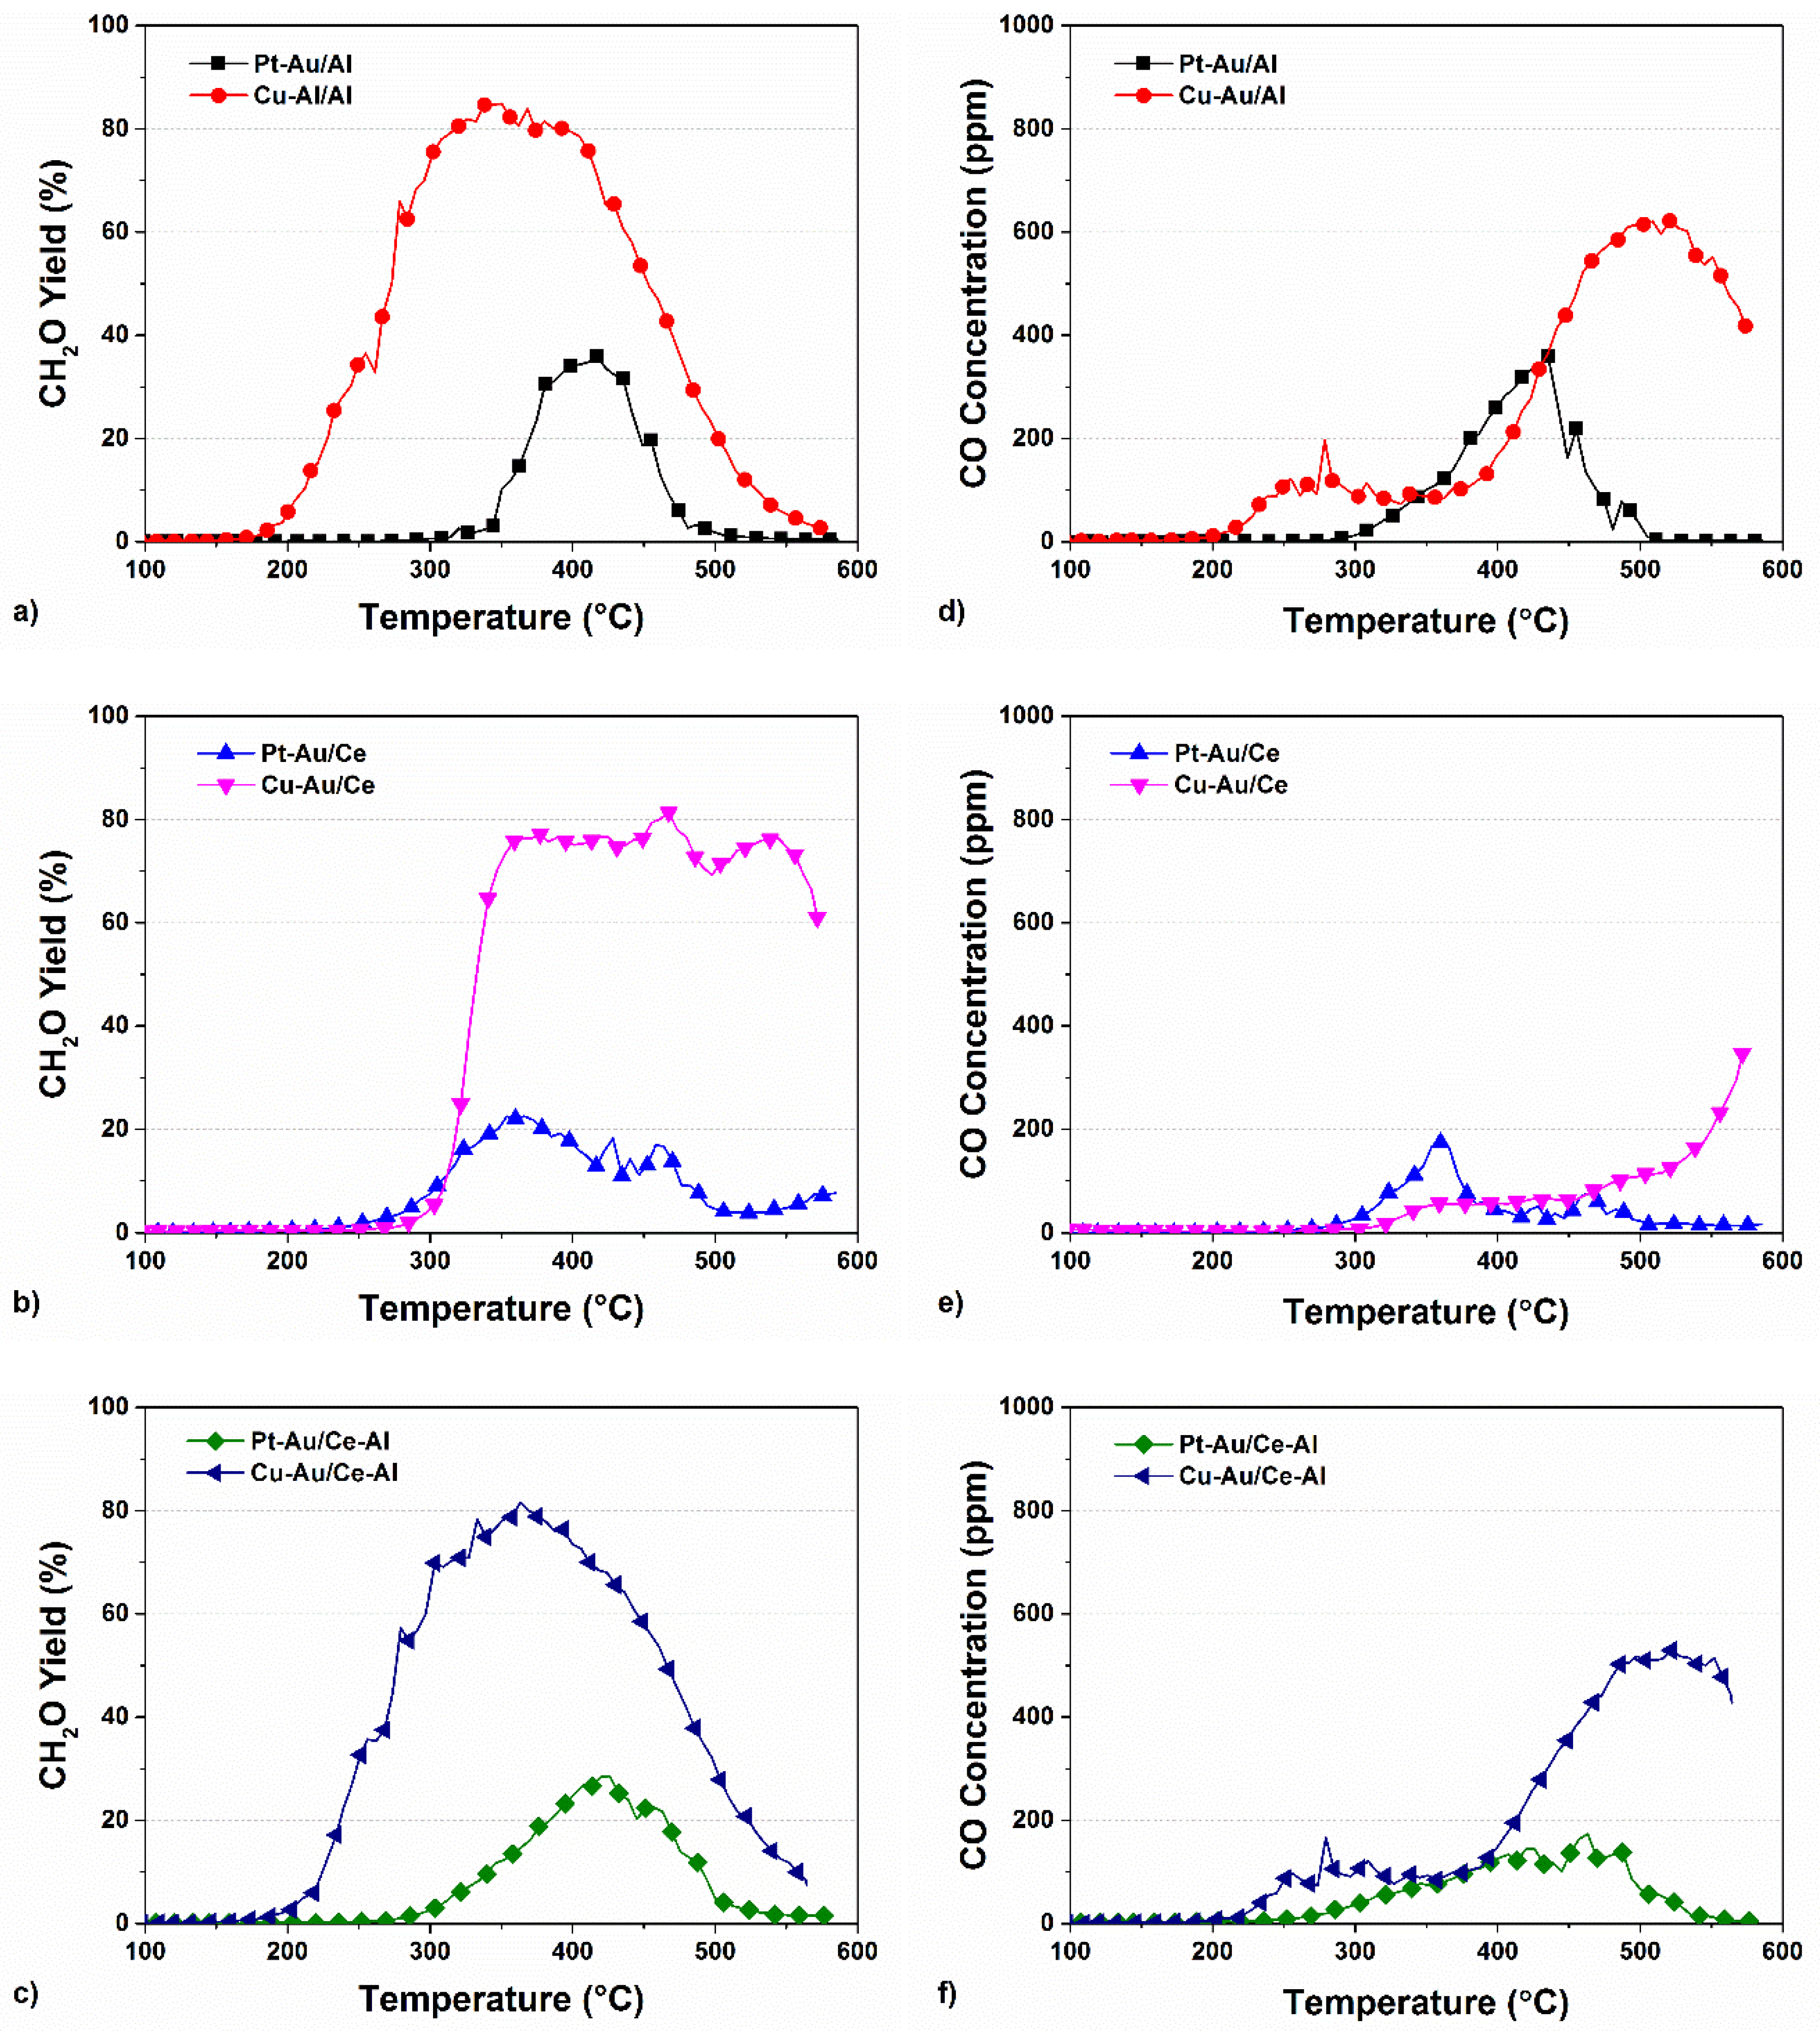
2.3. Yields of DMDS Oxidation Products
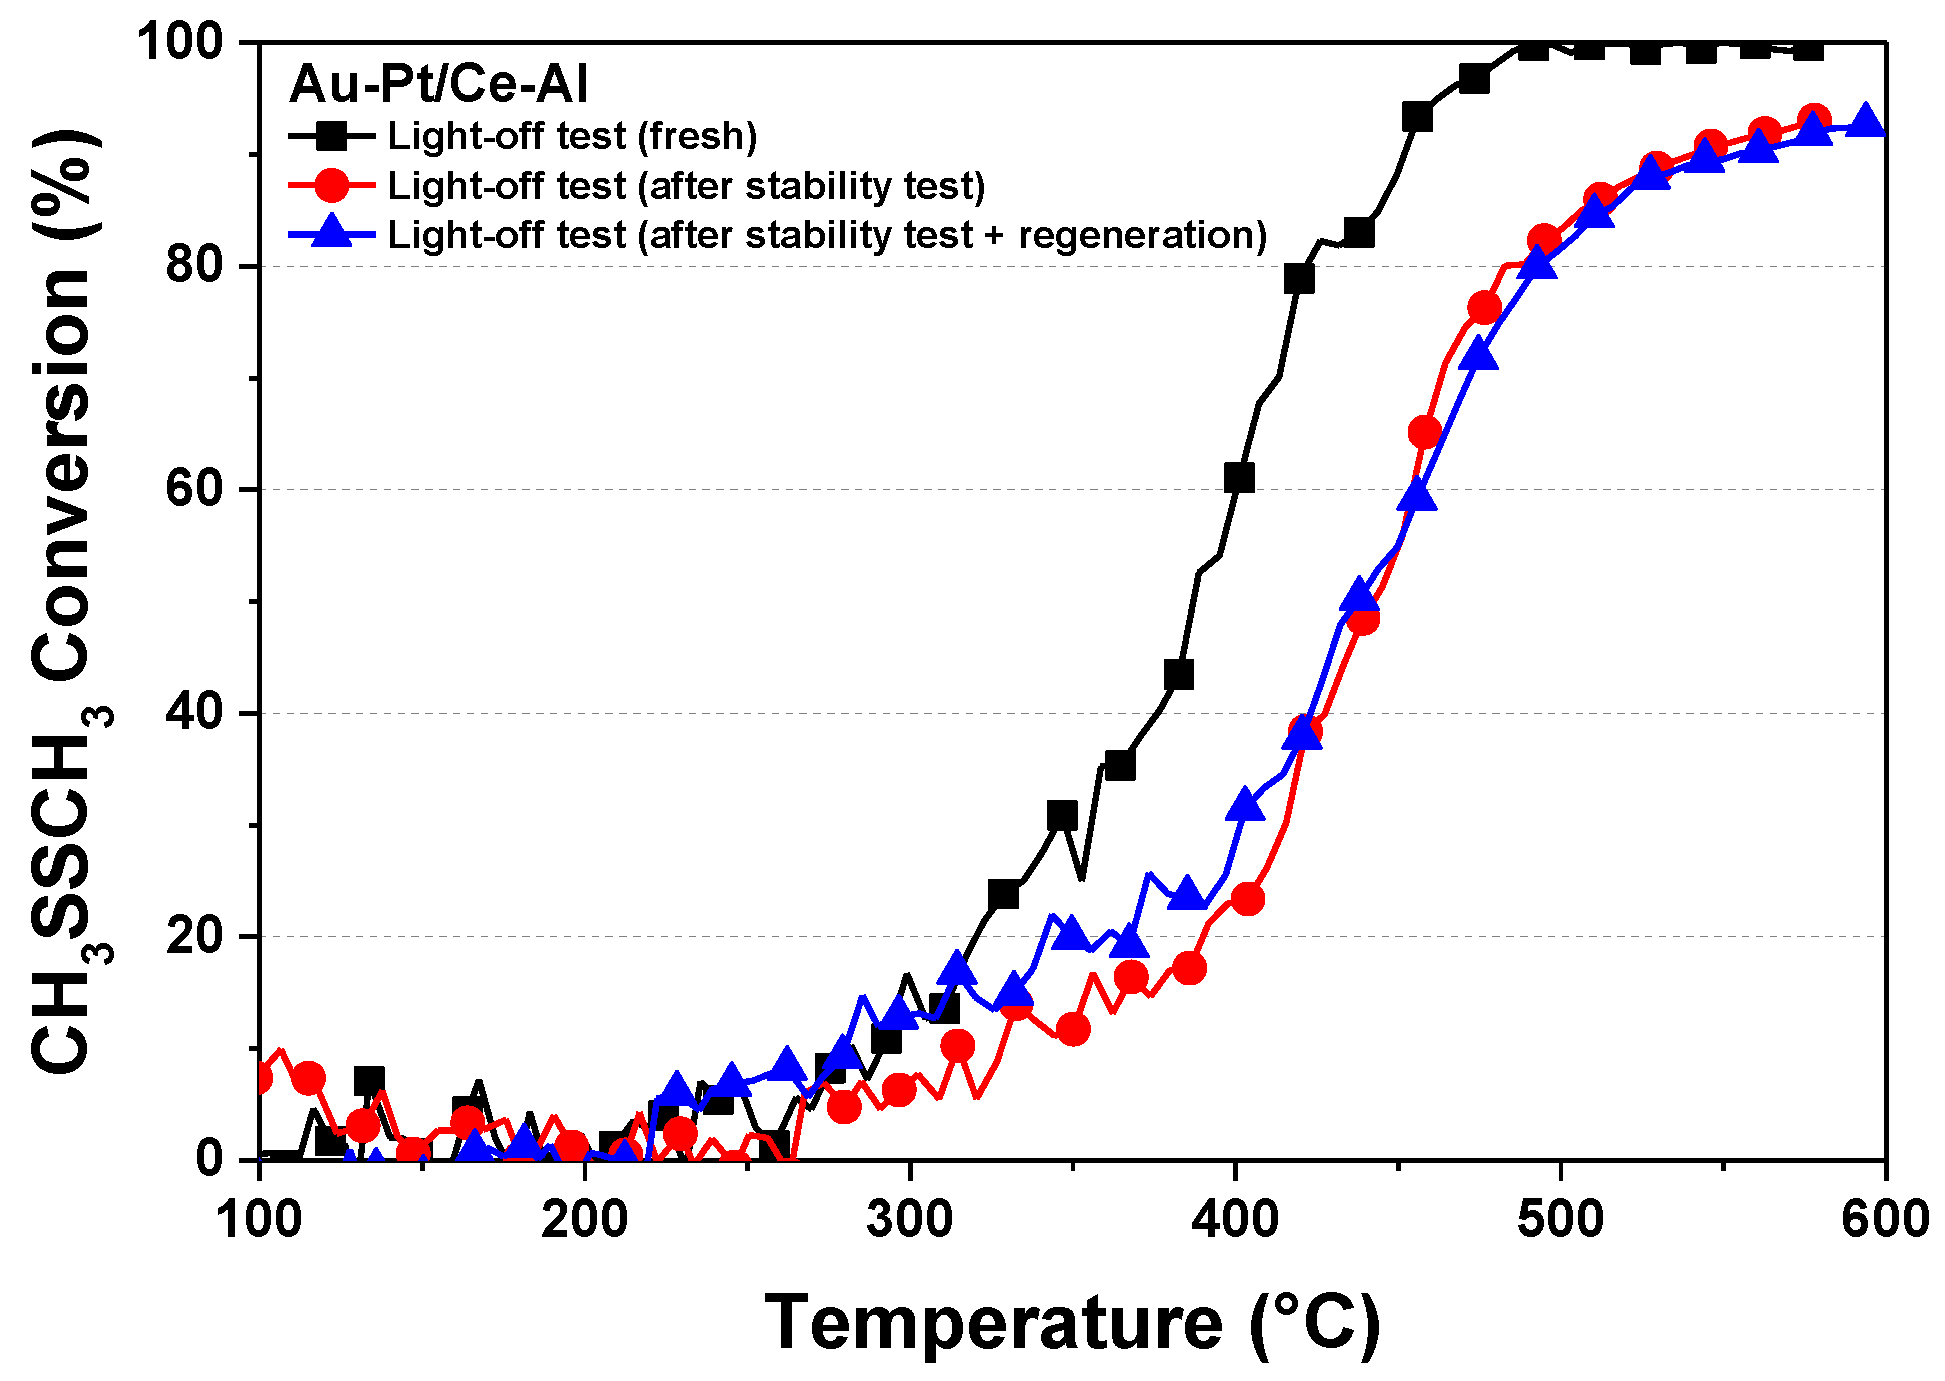
2.4. Stability of the Pt–Au/Ce–Al Catalyst
3. Discussion
4. Materials and Methods
4.1. Catalyst Preparation
4.2. Characterization
4.3. Catalytic Tests
5. Conclusions
Supplementary Materials
Author Contributions
Funding
Acknowledgments
Conflicts of Interest
References
- Seinfield, J.; Pandis, S. Atmospheric Chemistry and Physics: From Air Pollution to Climate Change, 1st ed.; Wiley: New York, NY, USA, 1998. [Google Scholar]
- Ojala, S.; Pitkäaho, S.; Laitinen, T.; Niskala, K.N.; Brahmi, R.; Gaálová, J.; Matejova, L.; Kucherov, A.; Päivärinta, S.; Hirschmann, C.; et al. Catalysis in VOC abatement. Top. Catal. 2011, 54, 1224–1256. [Google Scholar] [CrossRef]
- Yoon, S.H.; Chai, X.S.; Zhu, J.Y.; Li, J.; Malcolm, E.W. In-digester reduction of organic sulfur compounds in kraft pulping. Adv. Environ. Res. 2001, 5, 91–98. [Google Scholar] [CrossRef]
- Ojala, S.; Lassi, U.; Ylönen, R.; Keiski, R.L.; Laakso, I.; Maunula, T.; Silvonen, R. Abatement of malodorous pulp mill emissions by catalytic oxidation – pilot experiments in Stora Enso Pulp Mill, Oulu, Finland. Tappi J. 2004, 4, 9–14. [Google Scholar]
- Ojala, S. Catalytic Oxidation of Volatile Organic Compounds and Malodorous Organic Compounds. Ph.D. Thesis, University of Oulu, Oulu, Finland, 2005. [Google Scholar]
- Kucherov, A.V.; Sinev, I.M.M.; Ojala, S.; Keiski, R.; Kustov, L.M.M. Adsorptive-Catalytic Removal of CH3OH, CH3SH and CH3SSCH3 from Air over the Bifunctional System Noble Metals/HZSM-5. In Proceedings of the in from Zeolites to Porous MOF Materials—The 40th Anniversary of International Zeolite Conference, Beijing, China, 12–17 August 2007; Xu, R., Gao, Z., Chen, J., Yan, W., Eds.; Elsevier: Amsterdam, The Nederland, 2007; Volume 170, pp. 1129–1136. [Google Scholar] [CrossRef]
- Kucherov, A.V.; Tkachenko, O.P.; Kirichenko, O.A.; Kapustin, G.I.; Mishin, I.V.; Klementiev, K.V.; Ojala, S.; Kustov, L.M.; Keiski, R.L. Nanogold-Containing Catalysts for Low-Temperature Removal of S-VOC from Air. Top. Catal. 2009, 52, 351–358. [Google Scholar] [CrossRef]
- Darif, B.; Ojala, S.; Roy, P.L.; Bensitel, M.; Brahmi, R.; Keiski, R.L. Study on the catalytic oxidation of DMDS over Pt-Cu catalysts supported on Al2O3, AlSi20 and SiO2. Appl. Catal. B Environ. 2016, 181, 24–33. [Google Scholar] [CrossRef]
- Darif, B. Synthesis and Characterization of Catalysts used for the Ctalytic Oxidation of Sulfur-Containing Volatile Organic Compounds: Focus on Sulfur-Induced Deactivation. Ph.D. Thesis, University of Oulu, Oulu, Finland, 2016. [Google Scholar]
- Darif, B.; Ojala, S.; Kärkkäinen, M.; Pronier, S.; Maunula, T.; Brahmi, R.; Keiski, R.L. Study on sulfur deactivation of catalysts for DMDS oxidation. Appl. Catal. B Environ. 2017, 206, 653–665. [Google Scholar] [CrossRef] [Green Version]
- Corro, G.; Fierro, J.L.G.; Odilon, V.C. An XPS evidence of Pt4+ present on sulfated Pt/Al2O3 and its effect on propane combustion. Catal. Commun. 2003, 4, 371–376. [Google Scholar] [CrossRef]
- Nevanperä, T.K.; Ojala, S.; Bion, N.; Epron, F.; Keiski, R.L. Catalytic oxidation of dimethyl disulfide (CH3SSCH3) over monometallic Au, Pt and Cu catalysts supported on γ-Al2O3, CeO2 and CeO2-Al2O3. Appl. Catal. B Environ. 2016, 182, 611–625. [Google Scholar] [CrossRef]
- Lowell, S.; Shields, J.E.; Thomas, M.A.; Thommes, M. Adsorption Isotherms. In Characterization of Porous Solids and Powders: Surface Area, Pore Size and Density; Lowell, S., Shields, J.E., Thomas, M.A., Thommes, M., Eds.; Springer: Dordrecht, The Netherlands, 2004; pp. 11–14. [Google Scholar]
- Dow, W.P.; Wang, Y.P.; Huang, T. Yttria-Stabilized Zirconia Supported Copper Oxide Catalyst: I. Effect of Oxygen Vacancy of Support on Copper Oxide Reduction. J. Catal. 1996, 182, 171–182. [Google Scholar] [CrossRef]
- Moulijn, J.A.; Diepen, A.E.; Kapteijn, F. Catalyst deactivation: Is it predictable? What to do? Appl. Catal. A Gen. 2001, 212, 3–16. [Google Scholar] [CrossRef]
- Scirè, S.; Minicò, S.; Crisafulli, C.; Satriano, C.; Pistone, A. Catalytic combustion of volatile organic compounds on gold/cerium oxide catalysts. Appl. Catal. B Environ. 2003, 40, 43–49. [Google Scholar] [CrossRef]
- Jones, A.; McNicol, B. Temperature-Programmed Reduction for Solid Materials Characterization, 1st ed.; Marcel Dekker: New York, NY, USA, 1986. [Google Scholar]
- Bond, G.C.; Thompson, D.T. Catalysis by Gold. Catal. Rev. 1999, 41, 319–388. [Google Scholar] [CrossRef]
- Haruta, M. Catalysis of Gold Nanoparticles Deposited on Metal Oxides. CATTECH 2002, 6, 102–115. [Google Scholar] [CrossRef]
- Nikolaev, S.A.; Golubina, E.V.; Krotova, I.N.; Shilina, M.I.; Chistyakov, A.V.; Kriventsov, V.V. The effect of metal deposition order on the synergistic activity of Au-Cu and Au-Ce metal oxide catalysts for CO oxidation. Appl. Catal. B Environ. 2015, 168–169, 303–312. [Google Scholar] [CrossRef]
- Liu, Y.; Liu, B.; Liu, Y.; Wang, Q.; Hu, W.; Jing, P.; Liu, L.; Yu, S.; Zhang, J. Improvement of catalytic performance of preferential oxidation of CO in H2-rich gases on three-dimensionally ordered macro- and meso-porous Pt-Au/CeO2 catalysts. Appl. Catal. B Environ. 2013, 142–143, 615–625. [Google Scholar] [CrossRef]
- Bai, Y.C.; Zhang, W.D.; Chen, C.H.; Zhang, J.Q. Carbon nanotubes-supported PtAu-alloy nanoparticles for electro-oxidation of formic acid with remarkable activity. J. Alloys Compd. 2011, 509, 1029–1034. [Google Scholar] [CrossRef]
- Musialska, K.; Finocchio, E.; Sobczak, I.; Busca, G.; Wojcieszak, R.; Gaigneaux, E.; Ziolek, M. Characterization of alumina- and niobia-supported gold catalysts used for oxidation of glycerol. Appl. Catal. A Gen. 2010, 384, 70–77. [Google Scholar] [CrossRef]
- Leppelt, R.; Schumacher, B.; Plzak, V.; Kinne, M.; Behm, R.J. Kinetics and mechanism of the low-temperature water-gas shift reaction on Au/CeO2 catalysts in an idealized reaction atmosphere. J. Catal. 2006, 244, 137–152. [Google Scholar] [CrossRef]
- El-Moemen, A.; Abdel-Mageed, A.M.; Bansmann, J.; Parlinska-Wojtan, M.; Behm, R.J.; Kucerova, G. Deactivation of Au/CeO2 catalysts during CO oxidation: Influence of pretreatment and reaction conditions. J. Catal. 2016, 341, 160–179. [Google Scholar] [CrossRef]
- Ye, W.; Kou, H.; Liu, Q.; Yan, J.; Zhou, F.; Wang, C. Electrochemical deposition of Au-Pt alloy particles with cauliflower-like microstructures for electrocatalytic methanol oxidation. Int. J. Hydrog. Energy 2012, 37, 4088–4097. [Google Scholar] [CrossRef]
- Karpenko, A.; Leppelt, R.; Plzak, V.; Behm, R.J. The role of cationic Au3+ and nonionic Au0 species in the low-temperature water-gas shift reaction on Au/CeO2 catalysts. J. Catal. 2007, 252, 231–242. [Google Scholar] [CrossRef]
- Wertheim, G.K.; Dicenzo, S.B.; Youngquist, S.E. Unit charge on supported gold clusters in photoemission final state. Phys. Rev. Lett. 1983, 51, 2310–2313. [Google Scholar] [CrossRef]
- Peng, R.; Sun, X.; Li, S.; Chen, L.; Fu, M.; Wu, J.; Ye, D. Shape effect of Pt/CeO2 catalysts on the catalytic oxidation of toluene. Chem. Eng. J. 2016, 306, 1234–1246. [Google Scholar] [CrossRef]
- Mei, Z.; Li, Y.; Fan, M.; Zhao, L.; Zhao, J. Effect of the interactions between Pt species and ceria on Pt/ceria catalysts for water gas shift: The XPS studies. Chem. Eng. J. 2015, 259, 293–302. [Google Scholar] [CrossRef]
- Serrano-Ruiz, J.C.; Huber, G.W.; Sánchez-Castillo, M.A.; Dumesic, J.A.; Rodríguez-Reinoso, F.; Sepúlveda-Escribano, A. Effect of Sn addition to Pt/CeO2-Al2O3 and Pt/Al2O3 catalysts: An XPS, 119Sn Mössbauer and microcalorimetry study. J. Catal. 2006, 241, 378–388. [Google Scholar] [CrossRef]
- Moulder, J.F.; Stickle, W.F.; Sobol, P.E.; Bomben, K.D. Handbook of X-Ray Photoelectron Spectroscopy; Perkin-Elmer Corporation: Eden Prairie, MN, USA, 1992. [Google Scholar]
- Biesinger, M.C.; Lau, L.W.M.; Gerson, A.R.; Smart, R.S.C. Resolving surface chemical states in XPS analysis of first row transition metals, oxides and hydroxides: Sc, Ti, V, Cu and Zn. Appl. Surf. Sci. 2010, 257, 887–898. [Google Scholar] [CrossRef]
- Smit, E.; Groot, F.M.F.; Blume, R.; Hävecker, M.; Knop-Gericke, A.; Weckhuysen, B.M. The role of Cu on the reduction behavior and surface properties of Fe-based Fischer-Tropsch catalysts. Phys. Chem. Chem. Phys. 2010, 12, 667–680. [Google Scholar] [CrossRef]
- Potemkin, D.I.; Semitut, E.Y.; Shubin, Y.V.; Plyusnin, P.E.; Snytnikov, P.V.; Makotchenko, E.V.; Osadchii, D.Y.; Svintsitskiy, D.A.; Venyaminov, S.A.; Korenev, S.V.; et al. Alumina and ceria supported Au-Cu nanoparticles prepared via the decomposition of [Au(en)2]2[Cu(C2O4)2]3∙8H2O single-source precursor: Synthesis, characterization and catalytic performance in CO PROX. Catal. Today 2014, 235, 103–111. [Google Scholar] [CrossRef]
- Gaudin, P.; Fioux, P.; Dorge, S.; Nouali, H.; Vierling, M.; Fiani, E.; Moliére, M.; Brilhac, J.F.; Patarin, J. Formation and role of Cu+ species on highly dispersed CuO/SBA-15 mesoporous materials for SOx removal: An XPS study. Fuel Process. Technol. 2016, 153, 129–136. [Google Scholar] [CrossRef]
- Väliheikki, A.; Kolli, T.; Huuhtanen, M.; Maunula, T.; Keiski, R.L. Activity Enhancement of W–CeZr Oxide Catalysts by SO2 Treatment in NH3-SCR. Top. Catal. 2015, 58, 1002–1011. [Google Scholar] [CrossRef]
- Guo, R.T.; Chen, Q.L.; Ding, H.L.; Wang, Q.S.; Pan, W.G.; Yang, N.Z.; Lu, C.Z. Preparation and characterization of CeOx@MnOx core-shell structure catalyst for catalytic oxidation of NO. Catal. Commun. 2015, 69, 165–169. [Google Scholar] [CrossRef]
- Liao, X.; Chu, W.; Dai, X.; Pitchon, V. Bimetallic Au–Cu supported on ceria for PROX reaction: Effects of Cu/Au atomic ratios and thermal pretreatments. Appl. Catal. B Environ. 2013, 142–143, 25–37. [Google Scholar] [CrossRef]
- Duprez, D. Oxygen and Hydrogen Surface Mobility in Supported Metal Catalysts. Study by 18O/16O and 2H/1H Exchange. In Isotopes in Heterogeneous Catalysis; Hargreaves, J.S.J., Jackson, S.D., Webb, G., Eds.; Imperial College Press: London, UK, 2006; pp. 157–158. [Google Scholar]
- Descorme, C.; Duprez, D. Oxygen surface mobility and isotopic exchange on oxides: Role of the nature and the structure of metal particles. Appl. Catal. A Gen. 2000, 202, 231–241. [Google Scholar] [CrossRef]
- Ojala, S.; Bion, N.; Baylet, A.; Tarighi, M.; Keiski, R.L.; Duprez, D. Correlations between oxygen activation and methane oxidation over Pd/γ-Al2O3 catalysts prepared by nitrite method. Appl. Catal. B Environ. 2011, 108–109, 22–31. [Google Scholar] [CrossRef]
- Heck, R.M.; Farrauto, R.J. Catalytic Air Pollution Control: Commercial Technology; Van Nostrand Reinhold: New York, NY, USA, 1995. [Google Scholar]
- Assal, Z.; Ojala, S.; Pitkäaho, S.; Pirault-Roy, L.; Darif, B.; Comparot, J.D.; Bensitel, M.; Keiski, R.L.; Brahmi, R. Comparative study on the support properties in the total oxidation of dichloromethane over Pt catalysts. Chem. Eng. J. 2017, 313, 1010–1022. [Google Scholar] [CrossRef] [Green Version]
- Epron, F.; Especel, C.; Lafaye, G.; Marécot, P. Multimetallic Nanoparticles Prepared by Redox Processes Applied in Catalysis. In Nanoparticles and Catalysis; Astruc, D., Ed.; Wiley-VCH Verlag GmbH & Co. KGaA: Weinheim, Germany, 2008; pp. 279–302. [Google Scholar]


| Catalyst | Support | SBET (a) (m2 g−1) | Total Pore Volume (b) (cm3 g−1) | Average Pore Diameter (b) (nm) | Metal Loading (wt %) | Measured H2 Consumption (µmol g−1) | ||
|---|---|---|---|---|---|---|---|---|
| Au | Pt | Cu | ||||||
| Pt–Au/Al | Al2O3 | 95 | 0.49 | 19 | 0.8 | 0.9 | - | 44 |
| Cu–Au/Al | Al2O3 | 90 | 0.48 | 19 | 0.6 | - | 4.7 | 1222 |
| Pt–Au/Ce | CeO2 | 65 | 0.17 | 9 | 0.6 | 1.1 | - | 781 |
| Cu–Au/Ce | CeO2 | 50 | 0.17 | 12 | 0.2 | - | 5.6 | 2566 |
| Pt–Au/Ce–Al | CeO2-Al2O3 | 85 | 0.41 | 18 | 0.9 | 1.1 | - | 315 |
| Cu–Au/Ce–Al | CeO2-Al2O3 | 75 | 0.37 | 18 | 0.6 | - | 5.9 | 1307 |
| Compound | Tmelting (°C) | TTammann (°C) | THüttig (°C) |
|---|---|---|---|
| Pt | 1755 | 741 | 335 |
| PtO | 550 | 139 | -26 |
| PtO2 | 450 | 89 | -56 |
| Au | 1063 | 395 | 128 |
| Cu | 1083 | 405 | 134 |
| CuO | 1326 | 527 | 207 |
| Cu2O | 1235 | 481 | 179 |
| Catalyst | XPS | |||||
|---|---|---|---|---|---|---|
| Surface Composition (wt %) | ||||||
| Au | Pt | Cu | Ce | Al | O | |
| Pt–Au/Al | 0.9 | 1.2 | - | - | 51.3 | 46.6 |
| Cu–Au/Al | 5.2 | - | 7.5 | - | 46.1 | 41.2 |
| Pt–Au/Ce | 0.9 | 3.6 | - | 66.6 | - | 29.0 |
| Cu–Au/Ce | 0.1 | - | 12.4 | 61.1 | - | 26.4 |
| Pt–Au/Ce–Al | 2.2 | 2.1 | - | 4.4 | 48.1 | 43.2 |
| Cu–Au/Ce–Al | 4.0 | - | 8.6 | 2.2 | 45.4 | 39.9 |
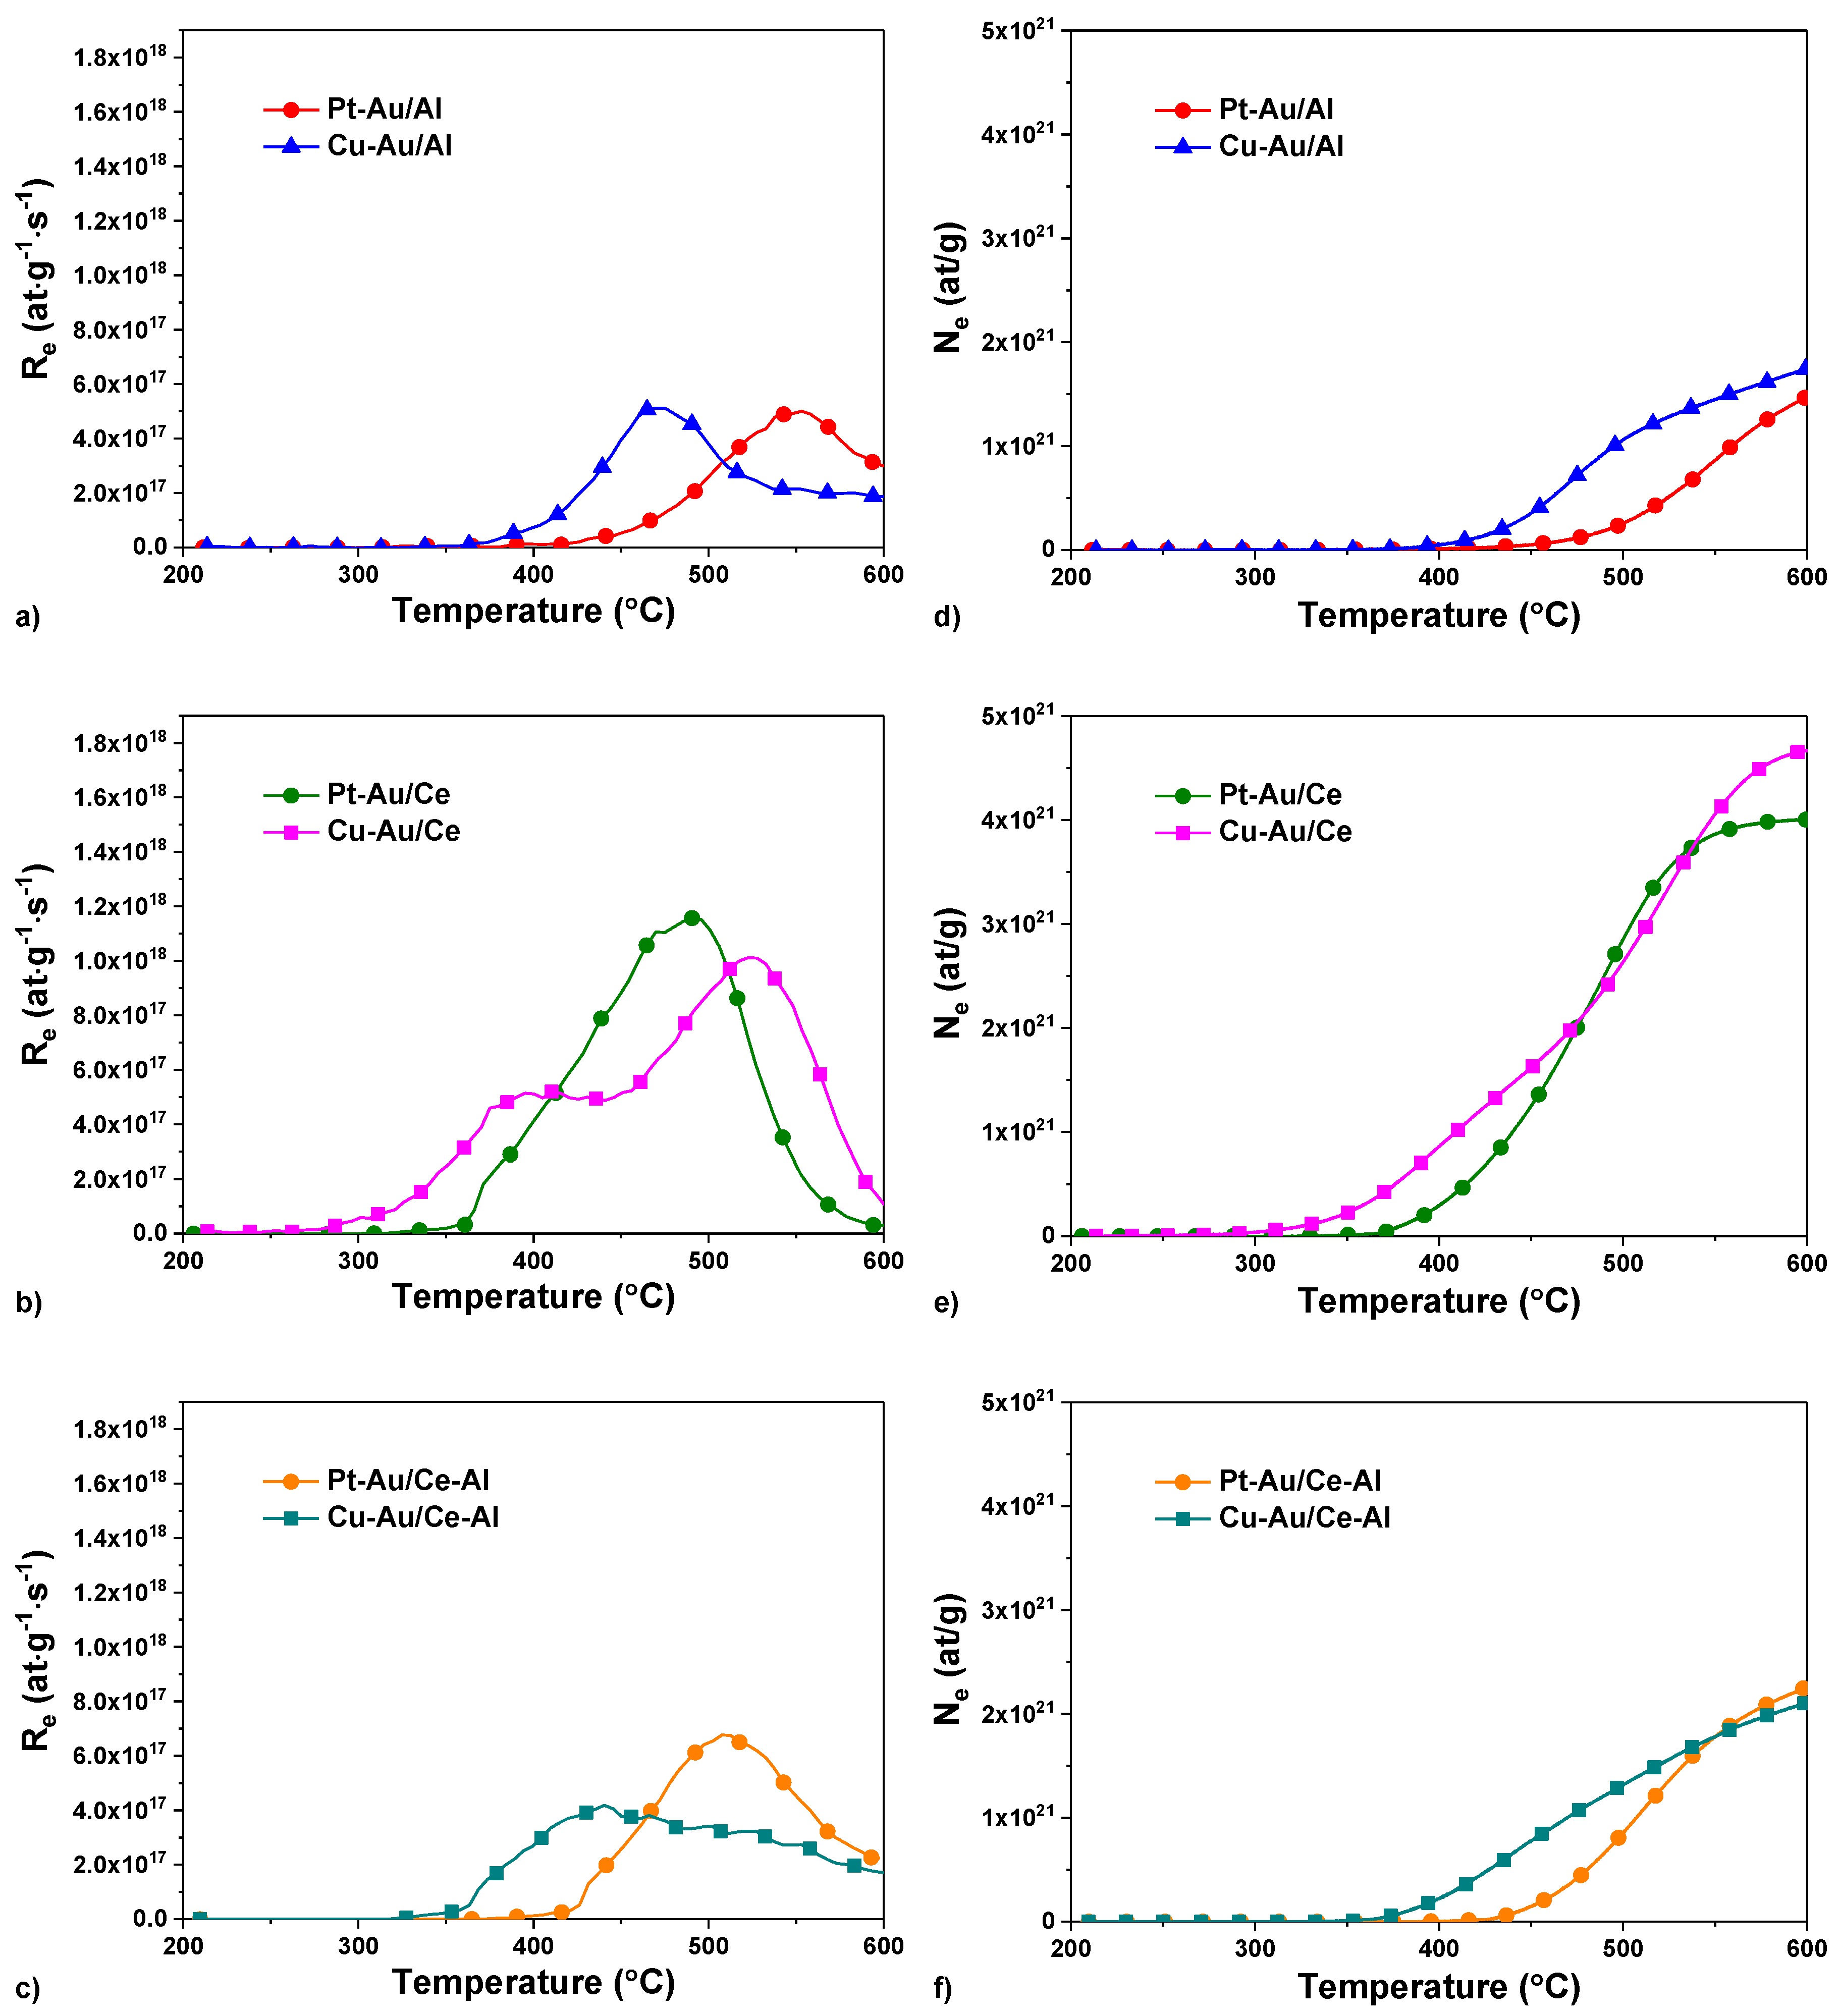
| Catalyst | Starting Temperature Range of Exchange (°C) | Temperature of Maximum Rate (°C) | Re Maximum (1017 at∙g−1 s−1) | Ne Final at 600 °C (1021 at∙g−1) |
|---|---|---|---|---|
| Pt–Au/Al | 380→ | 555 | 5.0 | 1.5 |
| Cu–Au/Al | 340→ | 470 | 5.1 | 1.8 |
| Pt–Au/Ce | 340→ | 490 | 11.6 | 4.0 |
| Cu–Au/Ce | 280→ | 410/520 | 5.2/10.1 | 4.7 |
| Pt–Au/Ce–Al | 390→ | 510 | 6.8 | 2.3 |
| Cu–Au/Ce–Al | 330→ | 440 | 4.2 | 2.1 |
| Al2O3 | CeO2 | CeO2–Al2O3 | |||||||
|---|---|---|---|---|---|---|---|---|---|
| T50 | T90 | T100 | T50 | T90 | T100 | T50 | T90 | T100 | |
| Pt a | 390 | 415 | 550 | 325 | 435 | * | 380 | 460 | * |
| Pt–Au | 350 | 390 | 480 | 380 | 455 | * | 425 | 480 | * |
| Cu a | 280 | 400 | 545 | 300 | 445 | * | 275 | 290 | 325 |
| Cu–Au | 275 | 340 | 515 | 330 | 450 | 575 | 275 | 370 | 570 |
| Catalyst Abbreviation | Support | Target Amount of Metals (wt %) | ||
|---|---|---|---|---|
| Au | Pt | Cu | ||
| Pt–Au/Al | Al2O3 | 1 | 1 | - |
| Cu–Au/Al | Al2O3 | 1 | - | 5 |
| Pt–Au/Ce | CeO2 | 1 | 1 | - |
| Cu–Au/Ce | CeO2 | 1 | - | 5 |
| Pt–Au/Ce–Al | CeO2–Al2O3 | 1 | 1 | - |
| Cu–Au/Ce–Al | CeO2–Al2O3 | 1 | - | 5 |
© 2019 by the authors. Licensee MDPI, Basel, Switzerland. This article is an open access article distributed under the terms and conditions of the Creative Commons Attribution (CC BY) license (http://creativecommons.org/licenses/by/4.0/).
Share and Cite
Nevanperä, T.K.; Ojala, S.; Laitinen, T.; Pitkäaho, S.; Saukko, S.; Keiski, R.L. Catalytic Oxidation of Dimethyl Disulfide over Bimetallic Cu–Au and Pt–Au Catalysts Supported on γ-Al2O3, CeO2, and CeO2–Al2O3. Catalysts 2019, 9, 603. https://doi.org/10.3390/catal9070603
Nevanperä TK, Ojala S, Laitinen T, Pitkäaho S, Saukko S, Keiski RL. Catalytic Oxidation of Dimethyl Disulfide over Bimetallic Cu–Au and Pt–Au Catalysts Supported on γ-Al2O3, CeO2, and CeO2–Al2O3. Catalysts. 2019; 9(7):603. https://doi.org/10.3390/catal9070603
Chicago/Turabian StyleNevanperä, Tuomas K., Satu Ojala, Tiina Laitinen, Satu Pitkäaho, Sami Saukko, and Riitta L. Keiski. 2019. "Catalytic Oxidation of Dimethyl Disulfide over Bimetallic Cu–Au and Pt–Au Catalysts Supported on γ-Al2O3, CeO2, and CeO2–Al2O3" Catalysts 9, no. 7: 603. https://doi.org/10.3390/catal9070603