Article

Catalyst/Feedstock Ratio Effect on FCC Using Different Catalysts Samples

Chemical Reactor Engineering Centre, Department of Chemical and Biochemical Engineering, University of Western Ontario, London, ON N6A 5B9, Canada
*
Author to whom correspondence should be addressed.
Catalysts 2019, 9(6), 542; https://doi.org/10.3390/catal9060542
Submission received: 23 May 2019 / Revised: 10 June 2019 / Accepted: 11 June 2019 / Published: 17 June 2019
(This article belongs to the Special Issue Catalyst Deactivation and Regeneration)

Abstract

:
The present study is a follow-up to a recent authors contribution which describes the effect of the C/O (catalyst/oil) ratio on catalytic cracking activity and catalyst deactivation. This study, while valuable, was limited to one fluidized catalytic cracking (FCC) catalyst. The aim of the present study is to consider the C/O effect using three FCC catalysts with different activities and acidities. Catalysts were characterized in terms of crystallinity, total acidity, specific surface Area (SSA), temperature programmed ammonia desorption (NH3-TPD), and pyridine chemisorption. 1,3,5-TIPB (1,3,5-tri-isopropyl benzene) catalytic cracking runs were carried out in a bench-scale mini-fluidized batch unit CREC (chemical reactor engineering centre) riser simulator. All data were taken at 550 °C with a contact time of 7 s. Every experiment involved 0.2 g of 1,3,5-TIPB with the amount of catalyst changing in the 0.12–1 g range. The resulting 0.6–5 g oil/g cat ratios showed a consistent 1,3,5-TIPB conversion increasing first, then stabilizing, and finally decreasing modestly. On the other hand, coke formation and undesirable benzene selectivity always rose. Thus, the reported results show that catalyst density affects both catalyst coking and deactivation, displaying an optimum C/O ratio, achieving maximum hydrocarbon conversions in FCC units.

Graphical Abstract

1. Introduction

The FCC process is one of the most important feedstock conversion units in the oil refinery industry. FCC is a major contributor to the production of gasoline [1,2,3,4,5]. Catalytic cracking endothermic reactions are accompanied with coke formation. Coke leads to catalytic activity decay and product selectivity changes [6,7,8]. Furthermore, catalyst regeneration via coke combustion involves an exothermic reaction, which is a critical contributor to the thermal balance of the refinery [9,10].
The optimization of FCC riser and downer unit operation may enhance product selectivity, minimizing coke formation and reducing operational costs [11,12,13]. With this end in mind, kinetic descriptions of catalytic cracking reactions with different degrees of simplifications have been considered for the cracking of both VGO (vacuum gas oil) and model compounds [14,15,16,17,18]. Micro activity units (MAT), confined fluid bed reactors (CFBRs) (e.g., advanced cracking evaluation (ACE)), and pilot plant riser units [19,20] have also been employed in these studies. This has led to kinetic models with kinetic parameters accounting for feedstock type, catalyst usage, and reactor type [15,17].
In 1992, an experimental device, invented by de Lasa [21] and designated as the CREC riser simulator, was used to simulate catalytic cracking [22,23]. This mini-fluidized CREC riser simulator reactor operates as a batch unit. Conditions such as temperatures, contact times, and partial pressures are close to the ones of an industrial FCC unit. Additionally, the needed constitutive chemical species balance equations for data analysis, resembling the ones of a continuous FCC [24]. In recent years, the application of the CREC riser simulator has allowed researchers in various laboratories around the world [24] to obtain kinetic data under short contact times (less than 10 s), for a diversity of catalytic reactions.
In spite of the reported progress in catalytic cracking kinetics, there is still a lack of understanding of the C/O ratio influence on FCC performance. There is a need for a fundamentally-based understanding of the processes affecting coke formation [25,26,27]. Issues with coke are particularly relevant for FCC riser operation and for the implementation of downflow reactors, where there are claims that higher catalyst/oil ratios (C/O) lead to enhanced unit performance [28,29,30].
To address this issue, the authors of this manuscript established in a recent article [31] the effect of the C/O on one FCC catalyst. Even if these findings are valuable, it was decided to reconsider the C/O ratio effect in a much broader context, using several FCC catalyst samples. To accomplish this, systematic runs of 1,3,5-TIPB catalytic cracking were developed in the CREC riser simulator. Experimental runs were adequately combined with catalyst characterization following cracking runs and catalyst regeneration using: XRD (X-ray diffraction), NH3-TPD (ammonia-temperature programmed desorption), pyridine-FTIR (Fourier transform infrared), and BET (Brunauer–Emmett–Teller) method.
Based on the results obtained, this study supports the view that the C/O effect is a condition likely to be encountered in different FCC units. This is in spite of the potential differences of the properties of the FCC catalysts used.

2. Results of the Catalyst Characterization

2.1. X-Ray Diffraction Analysis

X-ray diffraction was used to identify the Y zeolite crystal structure and to determine zeolite unit cell size and crystallinity. One example of XRD diffractograms is reported for Catalyst B in Figure 1.
Figure 1 shows the characteristic XRD peaks for the Y-zeolites at 27.52, 31.12, and 36.2 degrees in the 2θ scale. These peaks are identified with crosses. These peaks were considered to establish both the unit cell size and crystallinity following the ASTM D-3942.85. Table 1 reports both the relative crystallinity and unit cell size observed for the three catalysts of the present study.

2.2. NH3-TPD (Temperature Programmed Desorption)

The NH3-TPD spectrum were determined for CAT-A, CAT-B, and CAT-C. Figure 2 reports the NH3-TPD for the CAT-B sample. Figure 2 reports that increasing the C/O ratio leads to a consistent reduction of the total acidity, pointing towards a progressive catalyst deactivation [30]. The NH3-TPD for the CAT-A sample was already reported in [31] while NH3-TPD for CAT-C is given in [32].
Table 2 shows that CAT-A displays the highest acidity as measured by ammonia TPD at conditions free of coke: 3.37 cm3 NH3 STP/g in comparison with 1.73 cm3 NH3 STP/g and 1.47 cm3 NH3 STP/g for CAT-B and CAT-C, respectively. Thus, and on this basis, one can anticipate similar trends in 1,3,5-TIPB conversion and in coke formation.
Table 2 also shows a consistent behavior for the three catalysts with higher C/Os leading to a steady reduction in acidity as shown by NH3-TPD. These findings are in line with a progressive reduction of catalyst acidity with increased coke deposition, as will be later reported in the upcoming sections of this article.

2.3. Pyridine-FTIR

FTIR analysis of chemisorbed pyridine was used to assess both Brönsted and Lewis acidities for the catalysts studied, under free of coke conditions. Figure 3 displays the pyridine FTIR for CAT-A, CAT-B, and CAT-C, with the characteristic Brönsted and Lewis acid site peaks identified at 1445 cm−1 and 1545 cm−1 wavenumbers. On this basis, Brönsted/Lewis acid strength ratios were calculated, with Table 3 showing that CAT-B displays the highest ratio, followed by CAT-C and CAT-A.

2.4. N2 Adsorption-Desorption Isotherms

Figure 4 reports the N2 adsorption-desorption isotherms for CAT-B at various C/O ratios (0.8, 1.25, 2.5, 3.75, 5) and compares them with those of the free of coke catalyst. N2 adsorption-desorption isotherms for CAT-A were already reported in [31] while the N2 adsorption isotherms for CAT-C are given in Supplementary materials. One can then see that there is a significant isotherm shape change with increased C/O ratios. This is consistent with an increased coke amount, as will be reported later in this manuscript.
Table 4 summarizes the specific surface areas (SSA) for CAT-A, CAT-B, and CAT-C, which were established using the BET method. Table 4 also gives the total pore volume (PV) showing the differences between mesopores and micropores.
Figure 5 and Table 5 also show the influence of the C/O ratio on the micropores of CAT-B. Similar results were already reported in [31]. For CAT-C, results are given in Supplementary materials. One can thus see that the micropore volume after every run is reduced, with this being more pronounced at the higher C/O ratios.
Based on the above observations, the following conclusions for CAT-A, CAT-B, and CAT-C catalysts of this study were reached:
(a) FCC catalysts, when used together with cracking products, form coke. Coke alters both the structure and physicochemical properties of the catalyst: specific surface area, micropore volume, and acidity. Thus, catalyst regeneration with air is needed for the FCC catalysts to regain catalytic activity.
(b) However, changes of the catalyst structural and physicochemical properties increase at higher C/O ratios. This is the case given that higher C/O ratios lead to higher amounts of coke deposited, as is shown in the upcoming sections of this manuscript.

3. Thermal Cracking Runs

A series of 1,3,5-TIPB runs with the CREC riser simulator without catalyst were developed at different reaction times and temperatures. These runs allowed evaluating the effect of TIPB thermal cracking on the overall TIPB conversion. It was found that the thermal cracking effect on 1,3,5-TIPB catalytic conversion was limited to a 2% maximum. Seven seconds was the longest anticipated reaction time and 550 °C was the highest predicted temperature. Thus, the thermal cracking influence on the catalytic cracking runs was considered negligible. Additional details of the TIPB thermal cracking in the CREC riser simulator have been reported in a previous manuscript [31].

4. Catalytic Cracking Runs

A total number of 135 catalytic runs were conducted in the CREC riser simulator including at least five repeats per run. This allowed establishing conversions and selectivities with the required statistical indicators. Furthermore, and based on the detected propylene, DIPB, cumene, and benzene product species and their changes with reaction time, a series-parallel network was established as suggested by [31] and as further analyzed in Section 4.3.
Regarding catalytic cracking studies, a first series of systematic runs was developed with the CAT-A loaded in the CREC riser simulator and for a set C/O ratio of 2.5. Figure 6 reports that for 3 s, 5 s, and 7 s, there is a progressive increase of 1,3,5-TIPB conversion with temperature. These results are in line with the ones already reported in the technical literature by others [5,22,33,34] using the CREC riser simulator.

4.1. Effect of Catalyst-to-Oil Ratio (Catoil C/O Ratio) (g cat g feed −1)

Given the value of the results for FCC reported in a previous article [31] regarding the influence of the C/O ratios, or the equivalent of the apparent catalyst bed density (mass of catalyst per unit reactor volume), two additional catalysts (CAT-B and CAT-C) were studied. In every run, the 1,3,5-TIPB conversion, the coke formed, and the selectivity for the various product chemical species formed were determined. With this end in mind, runs were developed at set amounts of 0.2 g of feedstock, by changing the catalyst load from 0.12 g to 1 g. Thus, the catalyst-to-oil ratio (C/O) employed was set at 0.6, 0.8, 1.25, 2.5, 3.75, and 5 during the runs.
Figure 7, Figure 8 and Figure 9 report the changes in 1,3,5-TIPB conversion, hydrocarbon product, and coke selectivities using CAT-A, CAT-B, and CAT-C catalysts at various C/Os. In particular, Figure 7 shows a comparison of 1,3,5 TIPB conversions at various C/O ratios. It is apparent that CAT-A, with the higher acidity and crystallinity, showed the highest 1,3,5-TIPB conversions. CAT-B and CAT-C, on the other hand, displayed comparable lower levels of 1,3,5-TIPB conversion. These differences in catalytic activity are consistent with differences in crystallinity, total acidity, as well as density of stronger acid sites, as reported in Section 2.1, Section 2.2, and Section 2.3.
In spite of these differences and as shown in Figure 7, a common trend emerges when the changes in the 1,3,5-TIPB conversion with C/O ratio are examined. The 1,3,5-TIPB conversion increases first when C/Os are at 0.6−1.25. It levels off at the 2.5 intermediate C/O level, and decreases later at the higher 3.75−5 C/O values.
In order to be able to explain this behavior, one should consider coke formation at various conditions, including C/O changes as it is reported in the upcoming section.

4.2. Coke Selectivity

Figure 8 reports a comparison of coke selectivity-W (g coke/g of 1,3,5-TIPB converted) for the three catalysts (CAT-A, CAT-B, and CAT-C) at various C/O ratios. Figure 8 shows how coke selectivity augments steadily with the C/O ratio, with this being true in all cases and for the three catalyst samples. One can thus see the differences in coke formation with increasing C/O ratios versus the 1,3,5-TIPB conversion trends reported in Figure 7.
Thus, and to be able to explain these consistent trends applicable to the three catalysts studied, one can claim a reaction mechanism as advanced in our previous paper [31]. Increases in C/Os lead to higher catalyst density and, as a result, an increased interaction of particles with adsorbed hydrocarbon species. It is thus speculated that higher C/Os provide improved opportunities for bimolecular condensation reactions and, as a result, enhanced coke formation [4,12].

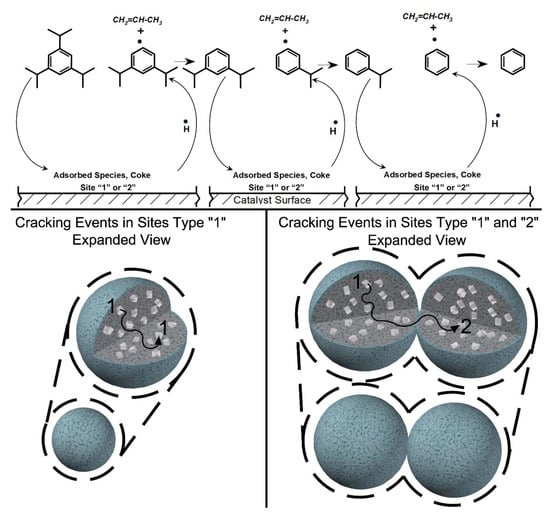
4.3. Hydrocarbon Product Selectivity

Given the value of establishing the influence of C/O ratios on FCC, one should also consider their effect on hydrocarbon product selectivity (product selectivity-M = moles of “i” product/ moles of 1,3,5-TIPB converted). Figure 9 reports the changes of hydrocarbon product hydrocarbon selectivity for the main gas phase chemical species. In this figure, product selectivity is quantified as a function of 1,3,5-TIPB conversion and C/O over CAT-B at 550 °C and 7 s. One should notice that the increasing C/O ratios for various runs, in the 0.6–5 range, is represented with “arrows”.
Thus, Figure 9 shows that 1,3 di-isopropyl benzene, cumene, and benzene selectivities always consistently increase with the C/O ratio. In contrast, propylene remains at essentially constant levels. Thus, aromatic product species display a consistent maximum at the highest C/O of 5. This trend is especially noticeable for benzene, which is a non-desirable terminal catalytic cracking product. In this respect, one can see that the product selectivity for the CAT-B catalyst is consistent with the data published in a previous contribution [31], and in agreement with the data reported in Supplementary materials for CAT-C.
Therefore, and on this basis, one can consider a reaction mechanism as outlined in Figure 10. The catalytic conversion of 1,3,5-TIPB encompasses a number of dealkylation steps, involving chemical and radical adsorbed species.
Thus, one can postulate, as in Figure 10, that catalytic cracking of 1,3,5-TIPB leads to the progressive removal of propyl radicals with: step (1) involving the removal of a first propyl radical; step (2) encompassing the abstraction of a second propyl; and step (3) including the subtraction of the last propyl radical left in the aromatic ring. Therefore, one can see that every reaction step also leads to the formation of an aromatic radical. Aromatic radicals may, however, be stabilized via catalyst H-transfer forming DIPB, cumene, and benzene with the potential of evolving later in the gas phase. Additionally, aromatic radicals may alternatively condense with other aromatic radicals forming coke.
Therefore, while the 1,3,5-TIPB catalytic cracking is a single site-driven reaction with the rate of change being proportional to catalyst density, coke formation involves, instead, at least two catalyst sites located in either the same, or a close but different, particle. Thus, a higher C/O proportionally increases coke formation and this is the case when a given C/O (e.g., C/O = 2.5) value is surpassed.
As a result, the catalytic cracking of 1,3,5-TIPB with higher C/Os or higher catalyst densities in the CREC riser simulator, consistently displays as shown for three FCC catalysts, the following: (a) it leads to higher coke selectivities; (b) it promotes the formation of undesirable final cracking products, such as benzene; and (c) it yields 1,3,5-TIPB conversions increasing first, and later decreasing at the higher C/Os. This sets optimum C/O ratios for FCC unit operation.

5. Materials and Methods

5.1. Feedstock and Catalysts

In this study, 1,3,5-TIPB was chosen as a feedstock to evaluate the catalytic cracking of catalysts. The 1,3,5-TIPB was selected as a model compound, given its special combination of aromatic and iso-paraffin functionalities [35]. Additionally, the 1,3,5-TIPB used is considered a valuable model species given its 9.4 A° critical molecular diameter, which allows combined diffusional and catalytic effects in Y zeolites [36,37,38,39]. All products from 1,3,5-TIPB conversion were identified and quantified using GC-MS analyses. Three commercial equilibrium FCC Y-zeolite fluidizable catalysts with a 60−70 micron average particle size were selected for this study. These catalysts are designated in the present study as CAT-A, CAT-B, and CAT-C, with their properties reported in Table 1.

5.2. Catalyst Characterization

X-ray diffraction (XRD) patterns of the catalysts were obtained by Ni-filtered Cu Kα radiation (λ = 0.15406 nm). XRD diffractometry was used from 5–90° of the 2θ scale. The crystallinity and unit cell size per catalyst were determined by using the following ASTM D-3942-85 method. High purity silicon powder (99%) was employed as a calibration standard. Table 1 summarizes the unit cell size and crystallinity calculated.
In addition, and for each catalyst studied, the specific surface area, the pore volume, and the pore size distribution (PSD) were determined by using an (ASAP 2010 Analyzer BET for nitrogen adsorption, Norcross, GA, USA) at 77K. Samples were degassed at 200 °C for 4 hours, prior to analysis. The pore size distribution (PSD) was established by plotting the dV/dD, or the differential pore volume as a function of the pore diameter (D) [40]. The integration of the differential pore volume function provided the total pore volume (PV). Furthermore, the consideration of the PSD allowed us to determine micropores (7A-12A) and mesopores (>12A) [41].
NH3-TPD was employed to determine the total acidity of the catalysts studied. This was achieved by measuring the amount of ammonia desorbed while heating catalyst samples (up to 550 °C), using a 15 °C/min heating ramp. For each TPD, 0.1−0.2 g of catalyst sample was first pretreated for 1 h at 650 °C while in contact with a 50 mL/min helium carrier. Following this, the catalyst sample was cooled down to 100 °C and was contacted with a 5% NH3/He gas mixture for 1 h. Then, the catalyst sample was heated progressively at a rate of 15 °C/min under 50 mL/min helium flow. Heating continued until 650 °C was reached. Due to the progressive heating, ammonia was gradually desorbed from the catalyst and measured with a thermal conductivity detector (TCD).
FTIR spectroscopy was also employed in conjunction with pyridine adsorption-desorption to quantify Brönsted and Lewis acid sites. The pyridine analysis was conducted in a Bruker FTIR (Billerica, MA, USA). Prior to measurements, the zeolite samples were first dried in a furnace tube under nitrogen flow, at 550 °C for 2 h. Then, a pyridine/nitrogen gas mixture was contacted with the catalyst at 100 °C for 1 h. Following this, with the temperature at 100 °C, a nitrogen flow was introduced into the furnace tube to remove weakly adsorbed pyridine species. After this stage, the catalyst sample was placed on a sodium chloride wafer with the pyridine FTIR spectrum of adsorbed species being recorded using a diffuse reflectance Fourier-transform infrared spectrometer (DRIFTS).

5.3. Chemical Species Analytical Methods

An Agilent Varian 6890 gas chromatograph unit (Santa Clara, CA, USA) was used to quantify the various chemical species. This unit was equipped with a flame ionization detector (FID) and a 0.25 µm ID and 30 m length HP1 capillary column. During this analysis, the FID detector temperature was set to 320 °C, while the column temperature was augmented at a rate of 5 °C/min starting from 35 °C, up to 350 °C. The 350 °C temperature was maintained for 20 min. Additionally, an Agilent 5973N mass selective detector (MSD) was employed for the identification of various chemical product species, with the help of the MSD Chemstation software library.

5.4. Catalytic Cracking Evaluation

Hydrocarbon catalytic cracking runs of 1,3,5-TIPB on three catalysts were performed in a novel bench-scale mini-fluidized batch unit CREC riser simulator [21,42]. Additional details of the experimental setup and experimental procedure have been described elsewhere [31]. All data were collected at 550 °C and at 7 s, in the 0.6–5 g-cat/g-oil C/O range, with the 1,3,5-TIPB amount injected being kept constant and the mass of the catalyst being varied.
While the 1,3,5-TIPB conversion was determined using a GC gas chromatography analysis of various gas phase products formed, coke on catalyst was measured with a total organic carbon TOC-VCPH analyzer from Shimadzu (Kyoto, Japan). In the TOC analysis, an infrared detector measured the total moles of CO2 formed by coke combustion. With this information, the moles of coke formed were calculated and the coke-on-catalyst (COC) was established as a weight fraction.
Thus, given the above, the following 1,3,5 TIPB conversion and product selectivity parameters were calculated using the following equation:
1 , 3 , 5   TIPB   Conversion   ( % ) = ( M propylene   + M DIPB + M cumene + M benzene + M coke ) M 1 , 3 , 5   TIPB .   x 100
Product   Selectivity M   = Moles i ,   product Moles   of   1 , 3 , 5   TIPB   Converted
Coke   Selectivity   W   = M coke M 1 , 3 , 5   TIPB     Converted

6. Conclusions

(a)
It is shown that the 1,3,5-TIPB catalytic cracking displays common activity trends at increasing C/O ratios. This is shown using three Y-zeolite catalysts with different acidities and crystallinities.
(b)
It is proven that the 1,3,5-TIPB catalytic cracking, when using these three catalysts, displays maximum 1,3,5 TIPB conversions at C/O ratios of 2.5.
(c)
It is observed that the 1,3,5-TIPB cracking product selectivity shows the highest coke and the highest undesirable benzene selectivity at the maximum C/O of 5.
(d)
It is thus anticipated that catalyst density, which is a main parameter that determines the C/O ratio, plays a critical role in achieving the highest 1,3,5-TIPB conversions. This phenomenon is of significant importance for the operation of scaled FCC units.

Supplementary Materials

The following are available online at https://www.mdpi.com/2073-4344/9/6/542/s1, Figure S1: BET-Nitrogen Adsorption Plot. N2 adsorption-desorption isotherms obtained from different samples of CAT-C, after runs at 550 °C and a 7 s contact time. Figure S2: Differential Pore Volume (dV/dD) as a Function of the Pore Diameter (D) using the N2-Adsorption Isotherms. (■) CAT-C free of coke; (●) CAT-C at C/O = 0.6g/g; (▲) CAT-C at C/O = 0.8g/g; (▼) CAT-C at C/O = 1.25 g/g; (♦) CAT-C at C/O = 2.5 g/g (◄); CAT-C at C/O = 3.75 g/g; (●) CAT-C at C/O = 5 g/g; All samples were analyzed following catalytic cracking runs at 550 °C and 7 s. Table S1: Specific Surface Areas [SSA] (m2/g) and Pore Volumes [PV] (cm3/g). Mesopore Volumes (cm3/g) for CAT-B are determined following catalytic cracking runs at 550 °C and 7 s, using different C/O ratios. SD on repeats: +/− 3 m2/g. Figure S3: Effect of C/O on the Product Selectivity-M Using TIPB on the Catalyst CAT-C. Run Conditions: 550 °C and 7 s, respectively. Notes: (a) Direction of the arrows represent an increasing C/O ratio, (b) Reported data and standard deviations (vertical bars) represent average values for 4−7 repeat runs.

Author Contributions

A.A. contributed with the development of the experimental studies both for catalyst characterization as well for the runs in the CREC Riser Simulator. H.d.L. contributed with the overview the research, drafting the present manuscript, discussion of results and as modelling of catalytic cracking of model compounds in the CREC Riser Simulator.

Funding

A. Alkhlel would like to thank Sebha University and the Libyan government for their financial support during his PhD research program. The authors would also like to express their appreciation to NSERC-Canada who contributed financially to this research through H. de Lasa’s NSERC Discovery Grant funds.

Acknowledgments

Acknowledgment also goes to Florencia de Lasa, who assisted with the technical drawing of the graphical abstract and with the editing of the present article.

Conflicts of Interest

The authors declare no conflict of interest.

Nomenclature

DPore diameter (A°)
M i Number of moles of “i” species (moles) in the gas phase
M c o k e Number of moles of coke collected (moles)
TReaction temperature, K
tReaction time, s
W c a t Mass of catalyst (g) loaded in the riser (basket), where catalytic cracking occurs.
W o i l Total mass of hydrocarbons injected (g)

Abreviations

BASBrönsted acid sites
BETBrunauer–Emmett–Teller
CAT-ACatalyst A
CAT-BCatalyst B
CAT-CCatalyst C
Catoil (C/O)Catalyst-to-oil ratio (g/g)
CRECChemical Reaction Engineering Center
DRIFTSDiffuse reflectance infrared Fourier transform spectroscopy
FCCFluidized catalytic cracking
FIDFlame ionization detector
FTIRFourier transform infrared spectroscopy
GCGas chromatography
LASLewis acid sites
MSDMass spectrometer detector
MATMicro activity tests units
PSDPore size distribution
PVPore volume (cm3/g)
Selectivity-MMoles of product “i” species/moles of 1,3,5-TIPB converted
Selectivity-WGrams of coke/grams of TIPB converted.
SSASpecific surface area (m2/g)
TCDThermal conductivity detector
1,3,5-TIPB1,3,5-Tri-isopropyl benzene
TOCTotal organic coke (g-coke/g-cat.)
TPDTemperature programmed desorption
VGOVacuum gas oil
XRDX-ray diffraction
XRFX-ray fluorescence

References

  1. Hussain, A.I.; Palani, A.; Aitani, A.M.; Shamzhy, M.; Kub, M.; Al-khattaf, S.S. Catalytic cracking of vacuum gasoil over-SVR, ITH, and MFI zeolites as FCC catalyst additives. Fuel Process. Technol. 2017, 161, 23–32. [Google Scholar] [CrossRef]
  2. Vogt, E.T.C.; Weckhuyse, B.M. Fluid catalytic cracking: Recent development on the grand and old lady of zeolite catalysis. Chem. Soc. Rev. 2015, 44, 7342–7370. [Google Scholar] [CrossRef] [PubMed]
  3. Xiong, K.; Lu, C.; Wang, Z.; Gao, X. Quantitative correlations of cracking performance with physiochemical properties of FCC catalysts by a novel lump kinetic modelling method. Fuel 2015, 161, 113–119. [Google Scholar] [CrossRef]
  4. Corma, A.; Sauvanaud, L. FCC testing at bench scale: New units, new processes, new feeds. Catal. Today 2013, 218–219, 107–114. [Google Scholar] [CrossRef]
  5. Passamonti, F.; de la Puente, G.; Gilbert, W.; Morgado, E.; Sedran, U. Comparison between fixed fluidized bed (FFB) and batch fluidized bed reactors in the evaluation of FCC catalysts. Chem. Eng. J. 2012, 183, 433–447. [Google Scholar] [CrossRef]
  6. Marin, G.B. Rigorous Kinetic Models for Catalyst Deactivation by Coke Deposition: Application to Butene Dehydrogenation. J. Catal. 1986, 426, 416–426. [Google Scholar] [CrossRef]
  7. Cerqueira, H.S.; Caeiro, G.; Costa, L.; Ribeiro, F.R. Deactivation of FCC catalysts. J. Mol. Catal. Chem. 2008, 292, 1–13. [Google Scholar] [CrossRef]
  8. Bai, T.; Zhang, X.; Wang, F.; Qu, W.; Liu, X.; Duan, C. Coking behaviors and kinetics on HZSM-5/SAPO-34 catalysts for conversion of ethanol to propylene. J. Energy Chem. 2016, 25, 545–552. [Google Scholar] [CrossRef]
  9. Gupta, R.K.; Kumar, V.; Srivastava, V.K. Modeling of Fluid Catalytic Cracking Riser Reactor: A Review. Int. J. Chem. React. Eng. 2010, 8, 1–40. [Google Scholar] [CrossRef]
  10. Han, I.; Riggs, J.B.; Chung, C. Modeling and optimization of a fluidized catalytic cracking process under full and partial combustion modes. Chem. Eng. Process. Process Intensif. 2004, 43, 1063–1084. [Google Scholar] [CrossRef]
  11. Al-Khattaf, S.; Saeed, M.R.; Aitani, A.; Klein, M.T. Catalytic cracking of light crude oil to Light Olefins and naphtha over E-Cat and MFI: Microactivity Test versus Advanced cracking evaluation and the effect of high reaction temperature. Energy Fuels 2018, 32, 6189–6199. [Google Scholar] [CrossRef]
  12. Wallensteln, D. Rational assessment of FCC catalyst performance by utilization of micro-activity testing. Appl. Catal. A Gen. 1998, 167, 141–155. [Google Scholar] [CrossRef]
  13. Shan, H.; Dong, H.; Zhang, J.; Niu, G. Experimental study of two-stage riser FCC reactions. Fuel 2001, 80, 1179–1185. [Google Scholar] [CrossRef]
  14. Gianetto, A.; Farag, H.I.; Blasetti, A.P.; de Lasa, H. Fluid Catalytic Cracking Catalyst for Reformulated Gasolines. Kinet. Modeling 1994, 33, 3053–3062. [Google Scholar]
  15. Delattre, C.; Forissier, M.; Pitault, I.; Schweich, D.; Bernard, J.R. Improvement of the microactivity test for kinetic and deactivation studies involved in catalytic cracking. Chem. Eng. Sci. 2001, 56, 1337–1345. [Google Scholar] [CrossRef]
  16. Fernandes, J.L.; Domingues, L.H.; Pinheiro, C.I.C.; Oliveira, N.M.C.; Ramôa, F. Influence of different catalyst deactivation models in a validated simulator of an industrial UOP FCC unit with high-efficiency regenerator. Fuel 2012, 97, 97–108. [Google Scholar] [CrossRef]
  17. Pinheiro, C.I.; Fernandes, J.L.; Domingues, L.; Chambel, A.J.; Graca, I.; Oliveira, N.M.; Cerqueira, H.S.; Ribeiro, F.R. Fluid Catalytic Cracking (FCC) Process Modeling, Simulation, and Control. Ind. Eng. Chem. Res. 2012, 51, 1–29. [Google Scholar] [CrossRef]
  18. Dupain, X.; Makkee, M.; Moulijn, J.A. Optimal conditions in fluid catalytic cracking: A mechanistic approach. Appl. Catal. A Gen. 2006, 297, 198–219. [Google Scholar] [CrossRef]
  19. Lappas, A.A.; Iatridis, D.K.; Papapetrou, M.C.; Kopalidou, E.P.; Vasalos, I.A. Feedstock and catalyst effects in fluid catalytic cracking—Comparative yields in bench scale and pilot plant reactors. Chem. Eng. J. 2015, 278, 140–149. [Google Scholar] [CrossRef]
  20. Jiménez-García, G.; Quintana-Solórzano, R.; Maya-Yescas, R. Improving accuracy in the estimation of kinetic frequency factors from laboratory data to model industrial catalytic cracking risers. Ind. Eng. Chem. Res. 2011, 50, 2736–2745. [Google Scholar] [CrossRef]
  21. de Lasa, H.I. Riser Simulator. U.S. Patent No. 5,102,628, 7 April 1992. [Google Scholar]
  22. Passamonti, F.J.; Puente, G.D.; Sedran, U. Comparison between MAT flow fixed bed and batch fluidized bed reactors in the evaluation of FCC catalysts. 2. Naphtha composition. Energy Fuels 2009, 23, 3510–3516. [Google Scholar] [CrossRef]
  23. Pruski, J.; Pekediz, A.; de Lasa, H. Catalytic cracking of hydrocarbons in a novel Riser Simulator: Lump Adsorption parameters under reaction conditions. Chem. Eng. Sci. 1996, 5, 1799–1806. [Google Scholar] [CrossRef]
  24. Kraemer, D.W. Modelling Catalytic Cracking in A Novel Riser Simulator (volumes I and Ii). Ph.D. Thesis, Western University, London, ON, Canada, 1991. [Google Scholar]
  25. Bartholomew, C.H.; Argyle, M.D. Advances in Catalyst Deactivation and Regeneration. Catalysts 2015, 5, 949–954. [Google Scholar] [CrossRef]
  26. Jarullah, A.T.; Awad, N.A.; Mujtaba, I.M. Optimal design and operation of an industrial fluidized catalytic cracking reactor. Fuel 2017, 206, 657–674. [Google Scholar] [CrossRef] [Green Version]
  27. Al-Sabawi, M.; Atias, J.A.; de Lasa, H. Kinetic modeling of catalytic cracking of gas oil feedstocks: Reaction and diffusion phenomena. Ind. Eng. Chem. Res. 2006, 45, 1583–1593. [Google Scholar] [CrossRef]
  28. Usman, A.; Bari, M.A.; Hussain, A.; Aitani, A.; Al-khattaf, S. Chemical engineering research and design catalytic cracking of crude oil to light olefins and naphtha: Experimental and kinetic modeling. Chem. Eng. Res. Des. 2017, 120, 121–137. [Google Scholar] [CrossRef]
  29. Yang, G.-F.; Wang, G.; Gao, J.S.; Xu, C.M. Coke formation and olefins conversion in FCC naphthaolefin reformulation at low reaction temperature. J. Fuel Chem. Technol. 2007, 35, 572–577. [Google Scholar] [CrossRef]
  30. Li, X.; Li, C.; Zhang, J.; Yang, C. Effects of temperature and catalyst to oil weight ratio on the catalytic conversion of heavy oil to propylene using ZSM-5 and USY catalysts. J. Nat. Gas Chem. 2007, 16, 92–99. [Google Scholar] [CrossRef]
  31. Alkhlel, A.; de Lasa, H. Catalytic Cracking of Hydrocarbons in a CREC Riser Simulator Using a Y—Zeolite-Based Catalyst: Assessing the Catalyst/Oil Ratio Effect. Ind. Eng. Chem. Res. 2018, 57, 13627–13638. [Google Scholar] [CrossRef]
  32. Alkhlel, A. Catalytic Conversion of Hydrocarbon 1,3,5-TIPB Over Y-Zeolite based Catalysts, Catalyst/oil ratio(C/O) Effect, and a Kinetic Model. Ph.D. Thesis. Disertatoion University of Western Ontario to be submitted August 2019.
  33. Jimeńez-García, G.; de Lasa, H.; Quintana-Soloŕzano, R.; Maya-Yescas, R. Catalyst activity decay due to pore blockage during catalytic cracking of hydrocarbons. Fuel 2013, 110, 89–98. [Google Scholar] [CrossRef]
  34. Atias, J.; Tonetto, G.M.; de Lasa, H. Modeling fluid catalytic cracking in a novel CREC Riser Simulator: Adsorption parameters under reaction conditions. Int. J. Chem. React. Eng. 2003, 1, 1–23. [Google Scholar] [CrossRef]
  35. Al-Khattaf, S.; de Lasa, H. The role of diffusion in alkyl-benzenes catalytic cracking. Appl. Catal. A Gen. 2002, 226, 139–153. [Google Scholar] [CrossRef]
  36. Mi, S.; Wei, T.; Sun, J.; Liu, P.; Li, X.; Zheng, Q.; Gong, K.; Liu, X. Catalytic function of boron to creating interconnected mesoporosity in microporous Y zeolites and its high performance in hydrocarbon cracking. J. Catal. 2017, 347, 116–126. [Google Scholar] [CrossRef]
  37. Guo, D.; Shen, B.; Qin, Y.; Sun, J.; Guo, Q.; Ren, S.; Gao, X.; Pang, X.; Wang, B.; Zhao, H. Microporous and Mesoporous Materials USY zeolites with tunable mesoporosity designed by controlling framework Fe content and their catalytic cracking properties. Microporous Mesoporous Mater. 2015, 211, 192–199. [Google Scholar] [CrossRef]
  38. Atias, J.A.; de Lasa, H. Adsorption, diffusion, and reaction phenomena on FCC catalysts in the CREC riser simulator. Ind. Eng. Chem. Res. 2004, 43, 4709–4720. [Google Scholar] [CrossRef]
  39. Bazyari, A.; Khodadadi, A.A.; Hosseinpour, N.; Mortazavi, Y. Effects of steaming-made changes in physicochemical properties of Y-zeolite on cracking of bulky 1,3,5-triisopropylbenzene and coke formation. Fuel Process. Technol. 2009, 90, 1226–1233. [Google Scholar] [CrossRef]
  40. White, M.G. Heterogeneous Catalysis; Prentice Hall: Upper Saddle River, NJ, USA, 1992. [Google Scholar]
  41. Tonetto, G.; Atias, J.; de Lasa, H. FCC catalysts with different zeolite crystallite sizes: Acidity, structural properties and reactivity. Appl. Catal. A Gen. 2004, 270, 9–25. [Google Scholar] [CrossRef]
  42. Arandes, J.M.; Abajo, I.; Fernández, I.; Azkoiti, M.J.; Bilbao, J. Effect of HZSM-5 Zeolite Addition to a Fluid Catalytic Cracking Catalyst. Study in a Laboratory Reactor Operating under Industrial Conditions. Ind. Eng. Chem. Res. 2000, 39, 1917–1924. [Google Scholar] [CrossRef]
Figure 1. XRD diffractograms for a CAT-B sample of the present study mixed with pure silicon. Characteristic peaks for silicon are shown at 28.47, 47.47, and 56.12 degrees in the 2θ scale and identified with the symbol x.
Catalysts 09 00542 g001
Figure 2. NH3-TPD analyses for CAT-B. Notes: Continuous black line: FCC catalyst free of coke; continuous red line: C/O = 1.25; continuous blue line: C/O = 2.5; continuous violet line: C/O = 3.75; continuous green line: C/O = 5; continuous blue line: experiment baseline. Samples with coke were analyzed following catalytic cracking runs at 550 °C and 7 s.
Catalysts 09 00542 g002
Figure 3. FTIR spectra shows IR band peaks for the catalysts A, B, and C studied. The black solid line represents pyridine adsorbed on CAT-A; the red solid line denotes pyridine adsorbed on CAT-B; and the blue solid line shows the pyridine adsorbed on CAT-C.
Catalysts 09 00542 g003
Figure 4. BET-nitrogen adsorption plot. N2 adsorption-desorption isotherms obtained from different samples of CAT-B after a run at 550 °C and 7 s contact time.
Catalysts 09 00542 g004
Figure 5. Differential pore volume (dV/dD) as a function of the pore diameter (D) using the N2-adsorption isotherms. (■) CAT-B free of coke; (●) CAT-B at C/O = 0.6 g/g; (▲) CAT-B at C/O = 0.8 g/g; (▼) CAT-B at C/O = 1.25 g/g; (♦) CAT-B at C/O = 2.5 g/g; and (◄) CAT-B at C/O = 3.75 g/g. All samples were analyzed following catalytic cracking runs at 550 °C and 7 s.
Catalysts 09 00542 g005
Figure 6. Effect of temperature and reaction time on the conversion of 1,3,5-TIPB using CAT-A. The C/O ratio was set to 2.5. Reported data and standard deviations (vertical bars) represent experimental data for at least five repeats.
Catalysts 09 00542 g006
Figure 7. Changes of the 1,3,5 -TIPB Conversion with the C/O ratio in the CREC riser simulator for CAT-A, CAT-B, and CAT-C. Note: Reaction time: 7 s, temperature: 550 °C. Reported data and standard deviations (vertical bars) represent at least five repeats.
Catalysts 09 00542 g007
Figure 8. Effect of C/O on coke selectivity using TIPB CAT-A, CAT-B, and CAT-C under relevant operating conditions, a temperature of 550 °C and a contact time of 7 s. Reported data and standard deviations (vertical bars) represent average values for at least 5–7 repeat runs.
Catalysts 09 00542 g008
Figure 9. Effect of C/O on the product selectivity using TIPB on selected catalyst CAT-B. The temperature and contact time were kept constant at 550 °C and 7 s, respectively. Notes: a) direction of the “arrows” represent increasing C/O ratios; and b) reported data and standard deviations (vertical bars) represent average values for 4–7 repeat runs.
Catalysts 09 00542 g009
Figure 10. Schematic description of the catalytic 1,3,5-TIPB conversion showing the hypothesized cracking steps. Notes: (a) Sites 1 sites are sites located in the same particle; and (b) Sites 1 and 2 are sites placed in different particles.
Catalysts 09 00542 g010
Table 1. Properties of the studied catalysts.
SampleParticle SiO2/Al2O3(mol/mol)Unit Cell Size (A°)Crystallinity
CAT-A0.8624.300.094
CAT-B0.7224.300.077
CAT-C0.9224.290.078
Table 2. NH3-TPD for CAT-A, CAT-B, and CAT-C catalyst samples.
CAT-ACAT-BCAT-C
SampleNH3 uptake
(cm3 STP/g)
NH3 uptake
(cm3 STP/g)
NH3 uptake
(cm3 STP/g)
Free of Coke 3.36 1.73 1.47
Catoil = 1.252.481.241.14
Catoil = 2.52.311.241.13
Catoil = 3.752.241.040.94
Catoil = 52.230.950.84
Table 3. Brönsted /Lewis acid site ratios using pyridine FTIR.
Sample CatalystBrönsted/Lewis Acid Sites Ratio
CAT-A0.298
CAT-B0.334
CAT-C0.321
Table 4. Specific surface areas and pore volumes of the free of coke catalysts.
CAT-ACAT-BCAT-C
BET (SSA)99.6118.5102
Pore Volume (PV) (cm3/g)0.1580.1960.140
Mesopores Volume (cm3/g)0.1120.1420.0916
Micropores Volume (cm3/g) 0.0468 0.0540 0.0491
Table 5. Specific surface areas (SSA) (m2/g) and pore volumes (PV) (cm3/g). Mesopore volumes (cm3/g) for CAT-B are determined following catalytic cracking runs at 550 °C and 7 s, using different C/O ratios. SD on repeats: +/− 3 m2/g.
CAT-B Catalyst Samples
Free CokeC/O = 0.6C/O = 0.8C/O = 1.25C/O = 2.5C/O = 3.75
BET (Specific Surface Area)10293.3791.8889.1888.9281.56
Pore Volume (PV)
cm3/g
0.1400.1290.1370.1210.1220.120
Mesopores-Macropores Volume,
cm3/g
0.09160.08640.09360.07850.07950.0815
Micropores Volume
cm3/g
0.04910.04350.04390.04300.04250.0390

