Partial Upgrading of Athabasca Bitumen Using Thermal Cracking


Abstract
:
1. Introduction
2. Results and Discussion
2.1. Catalyst Characterization
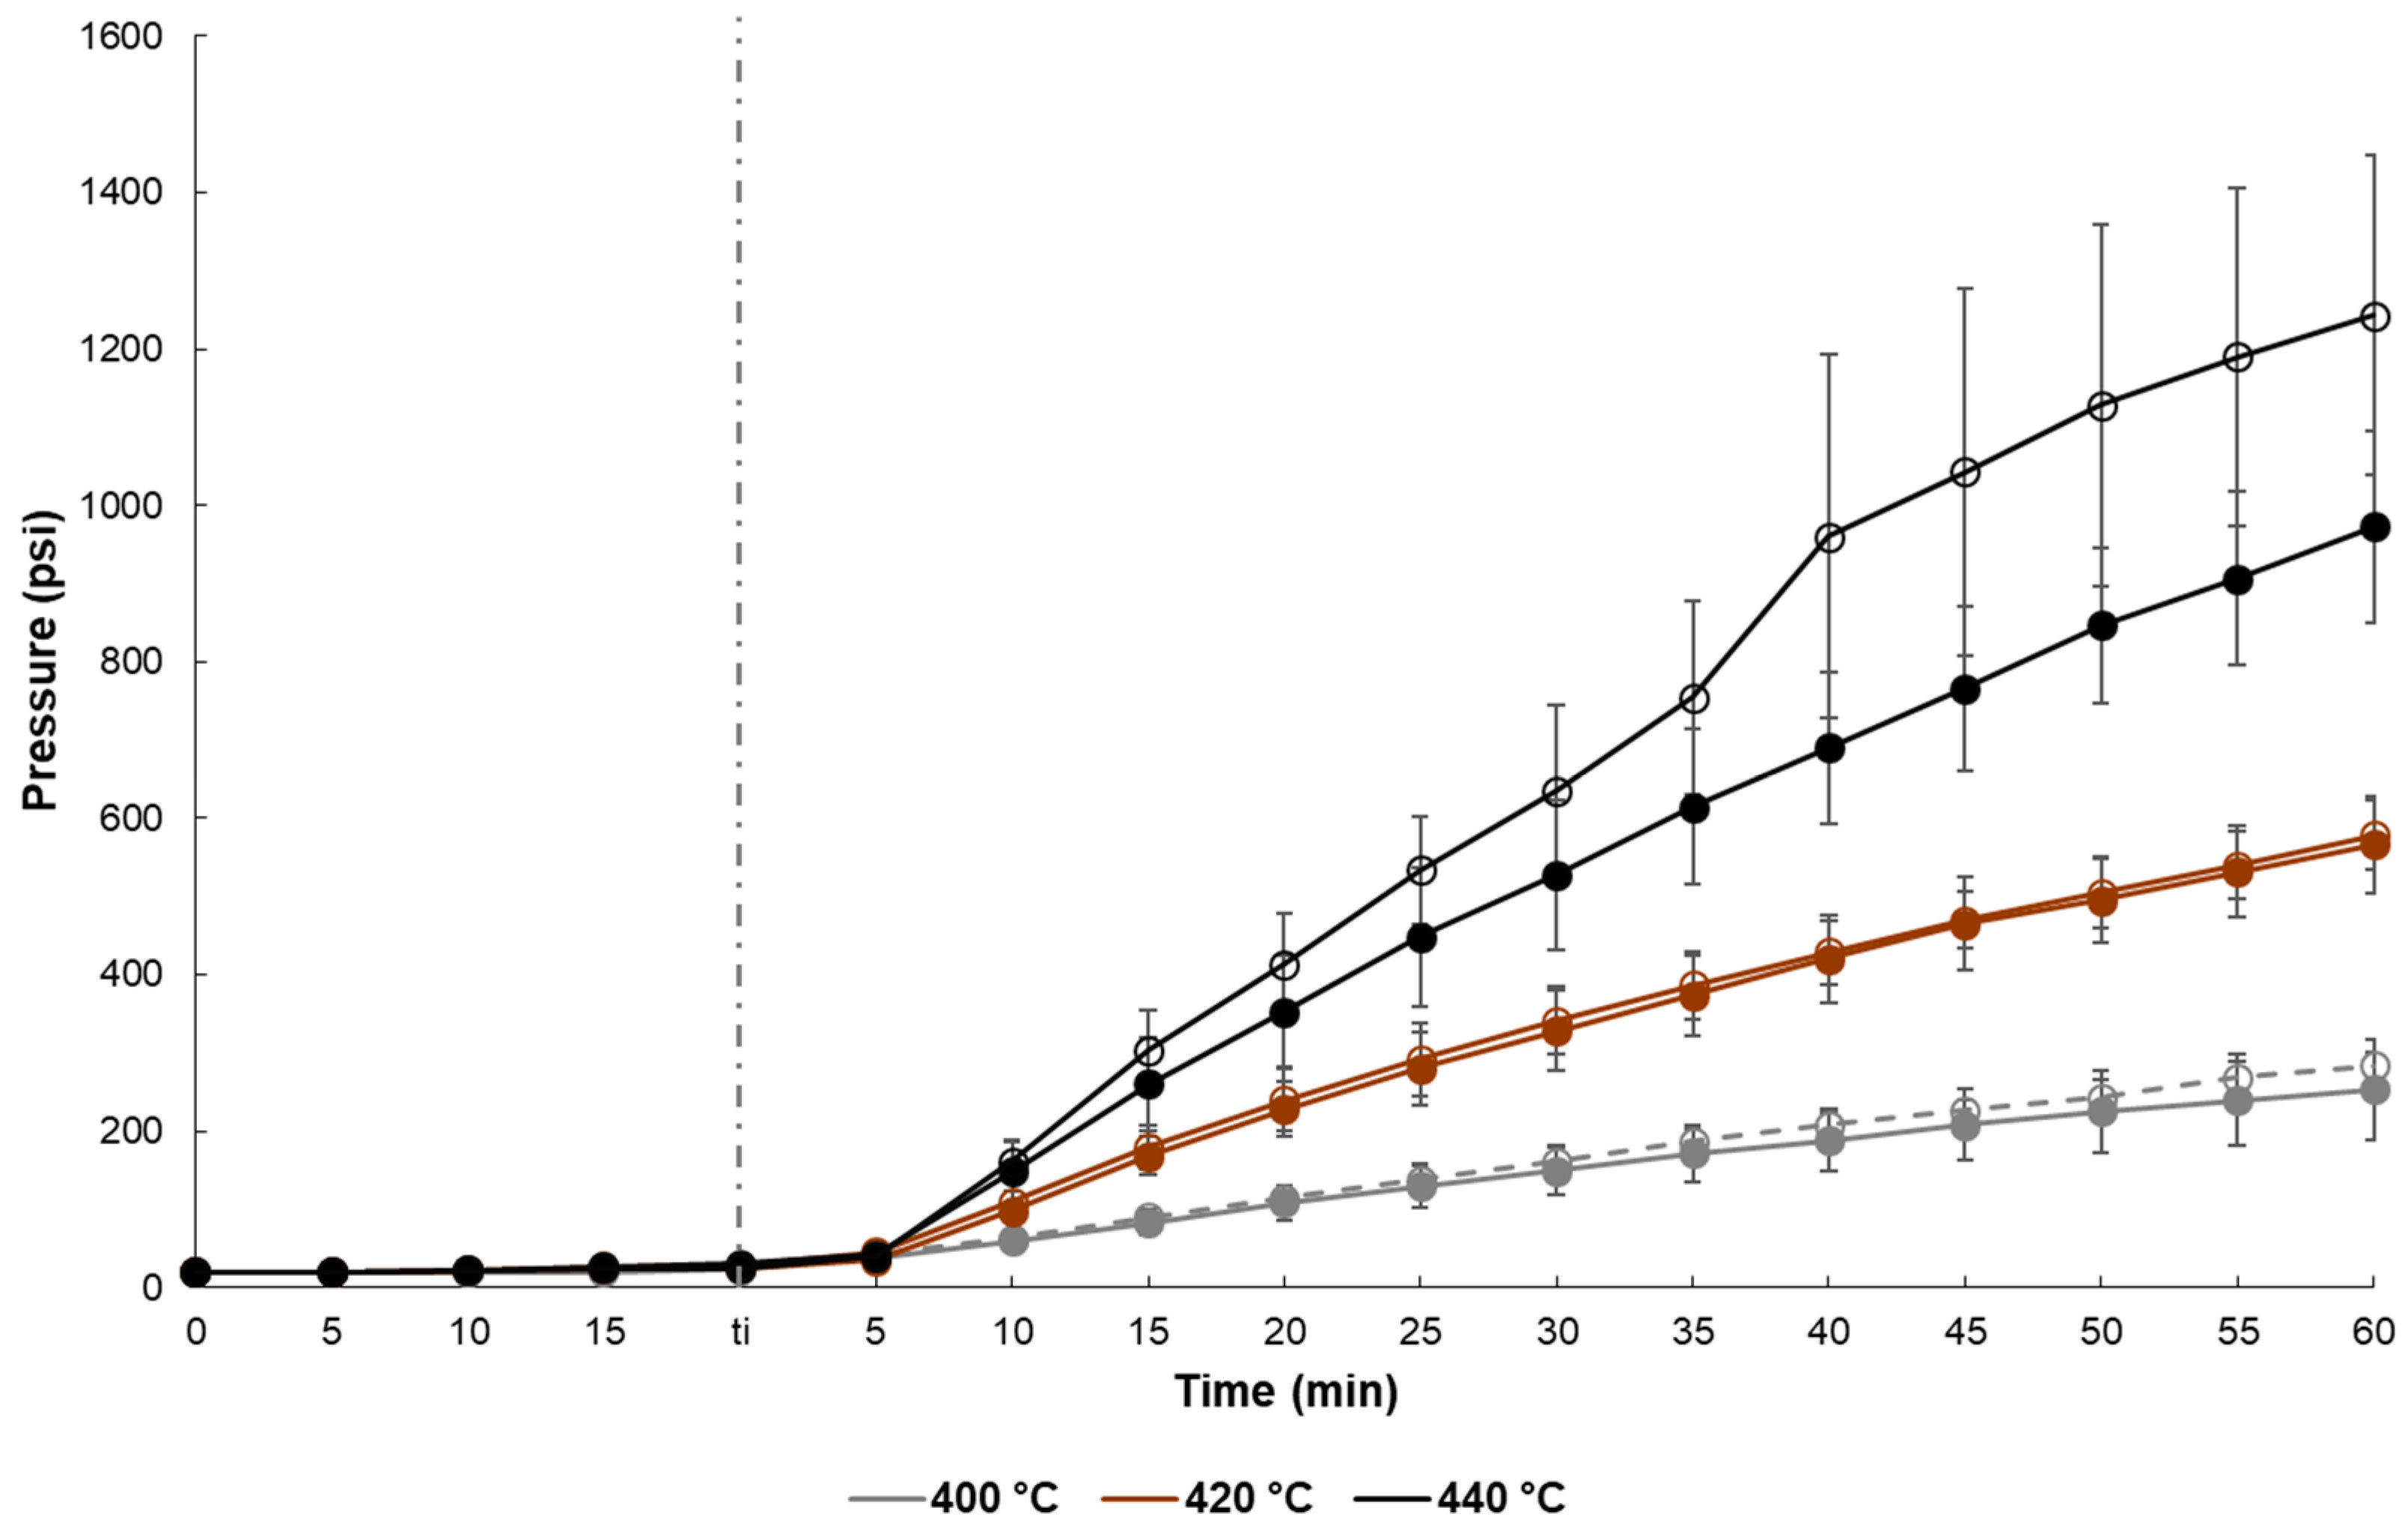
2.2. Temperature, Pressure and Energy Measurements
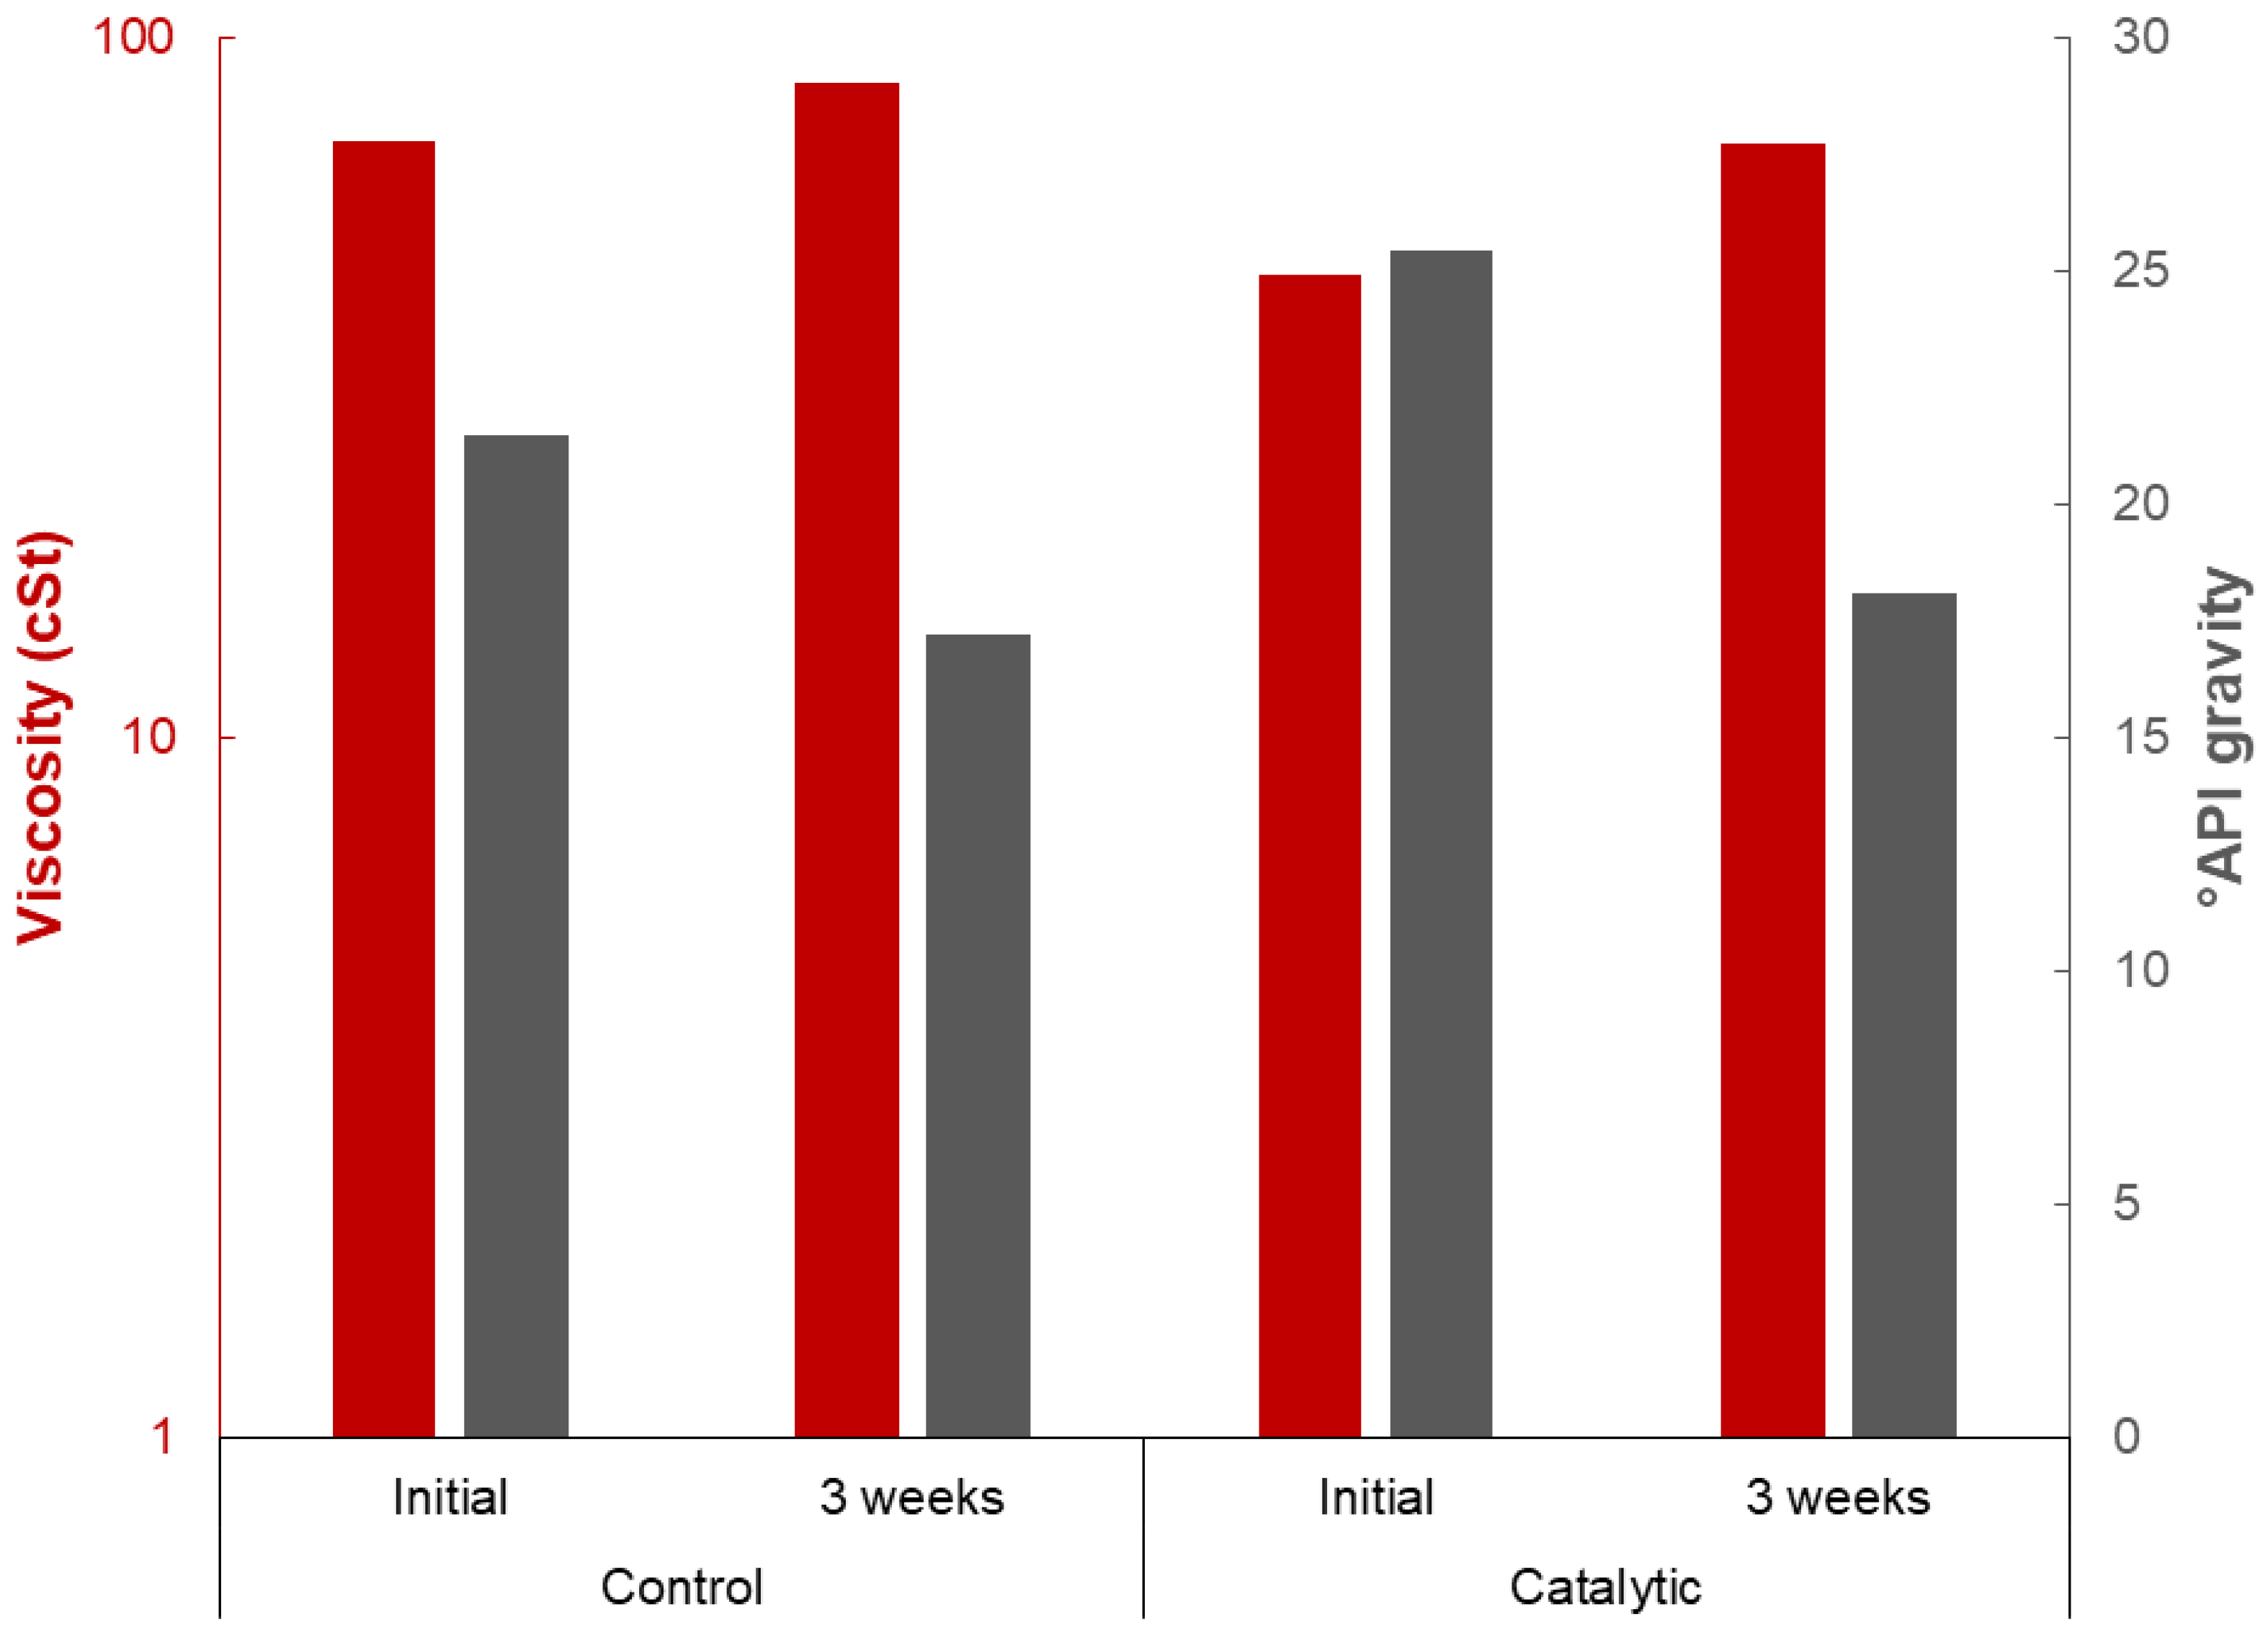
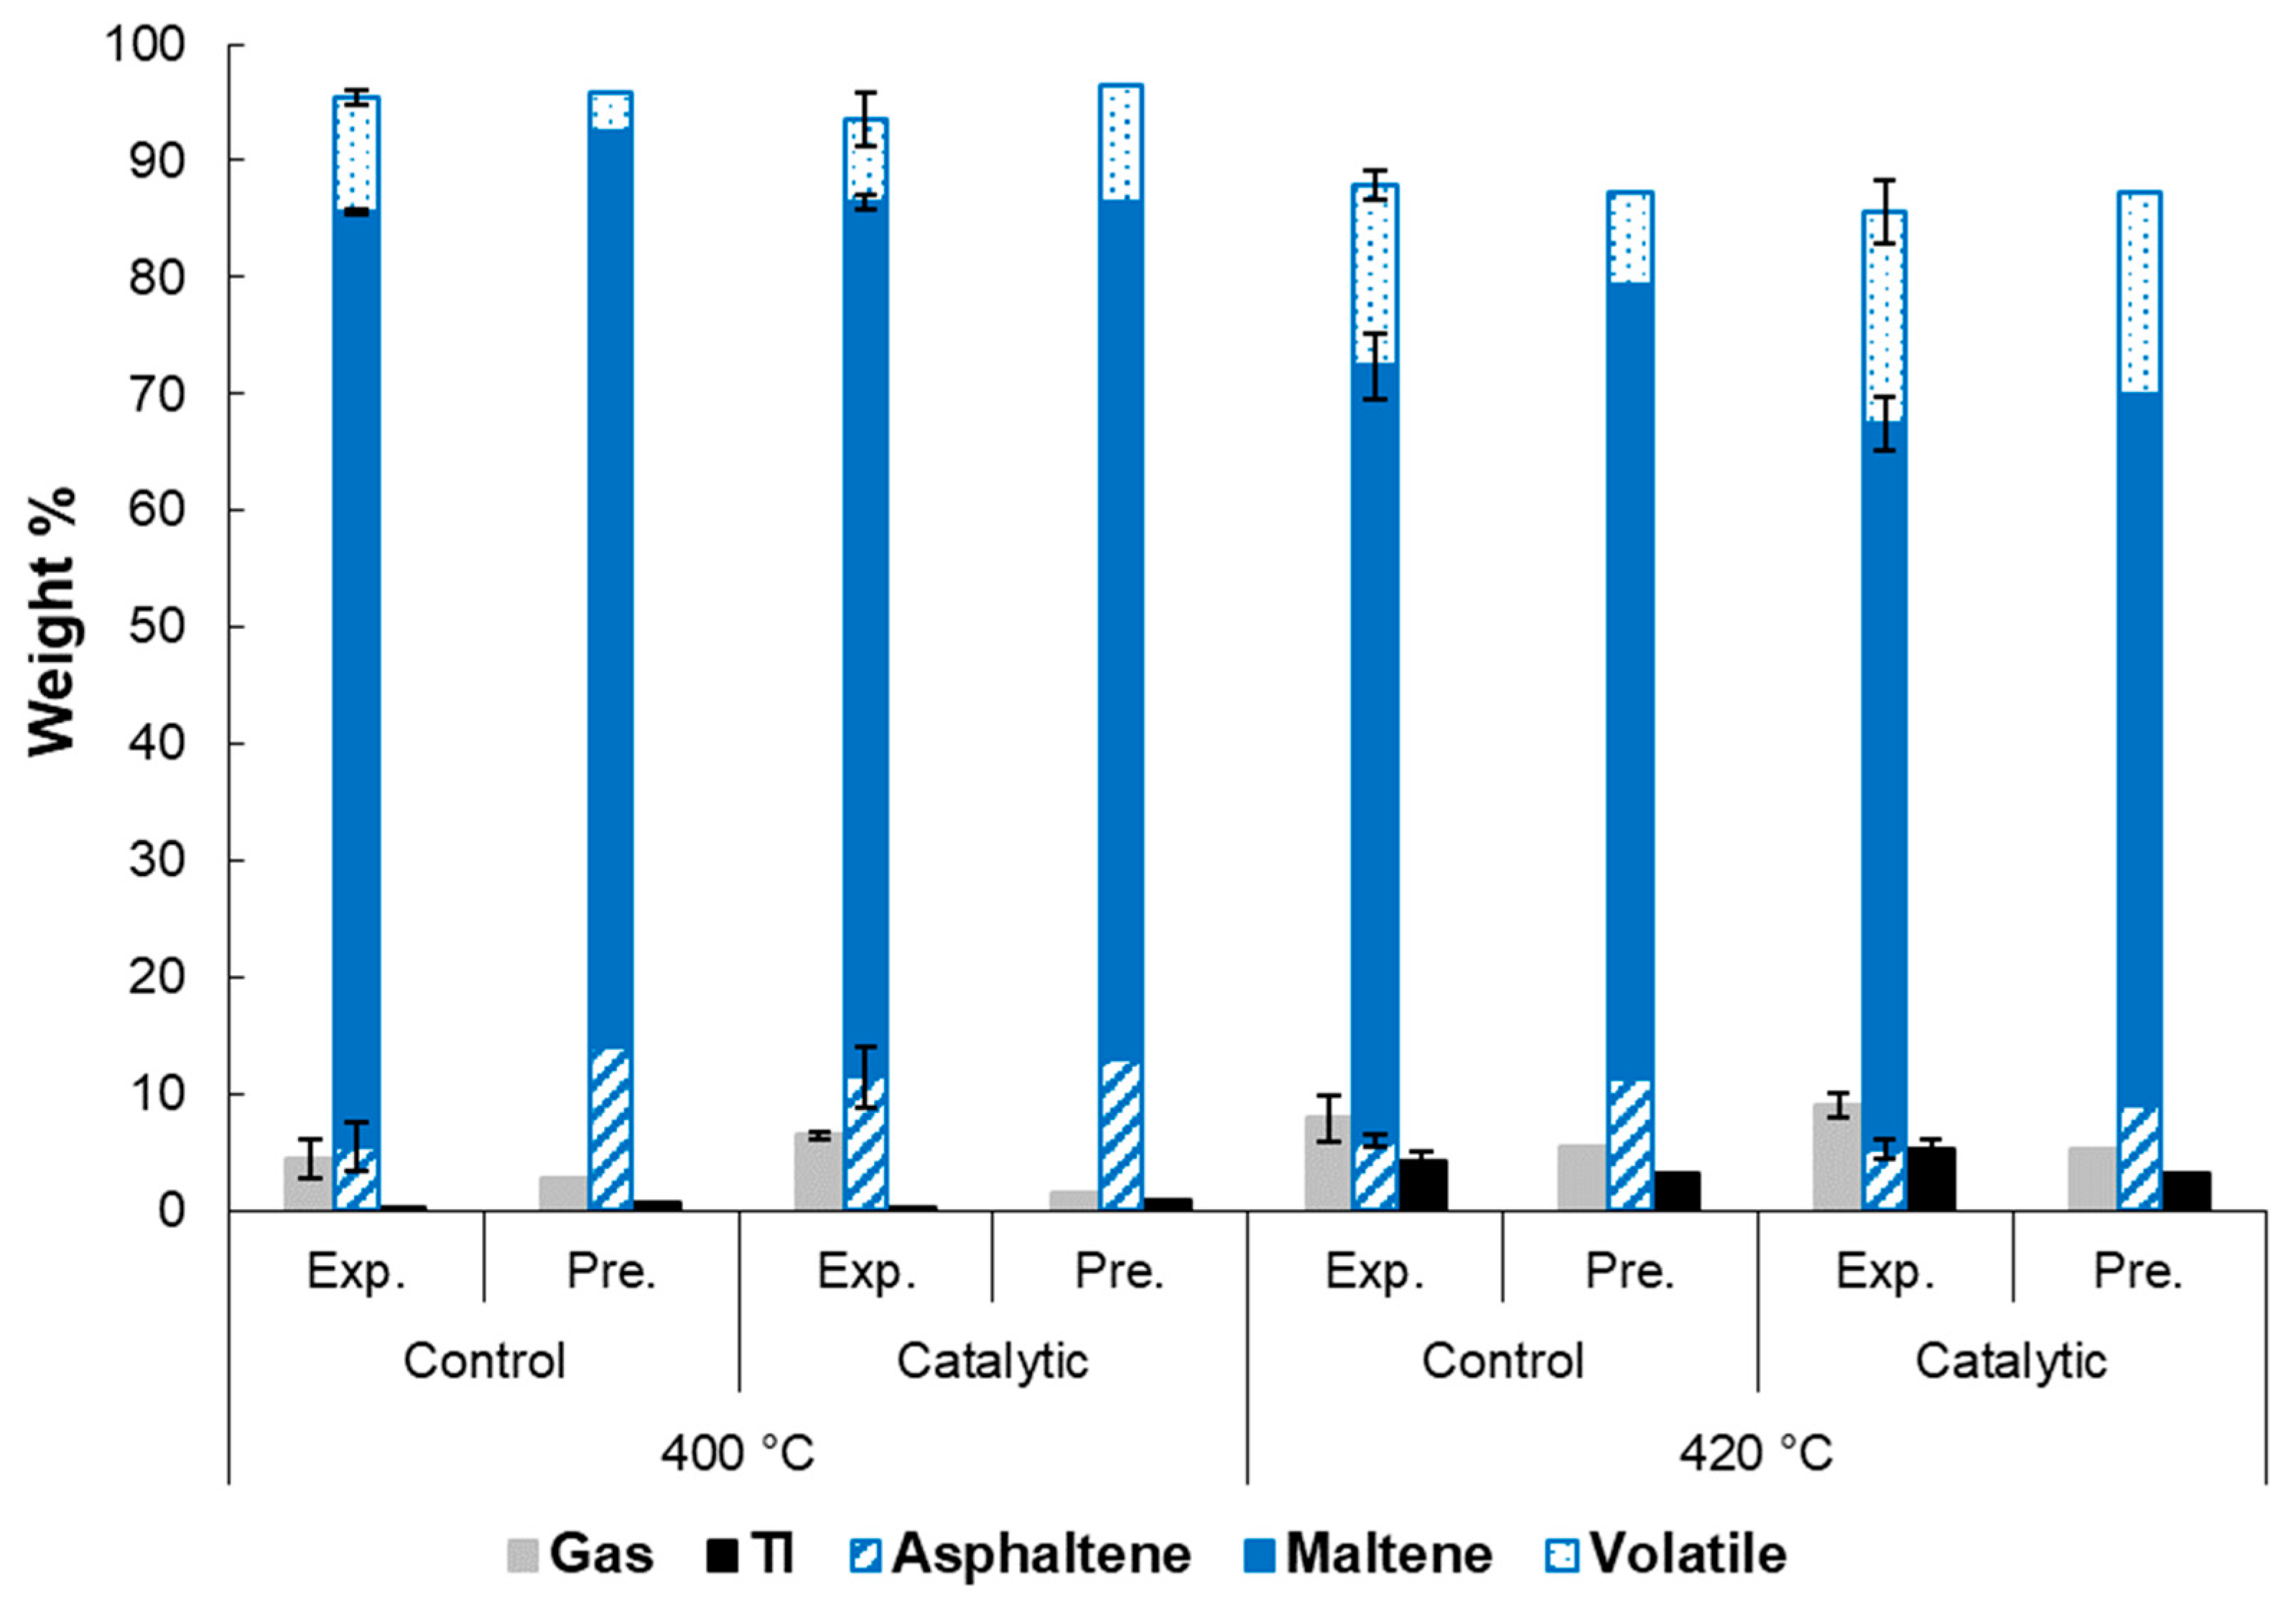
2.3. Product Yield and Quality
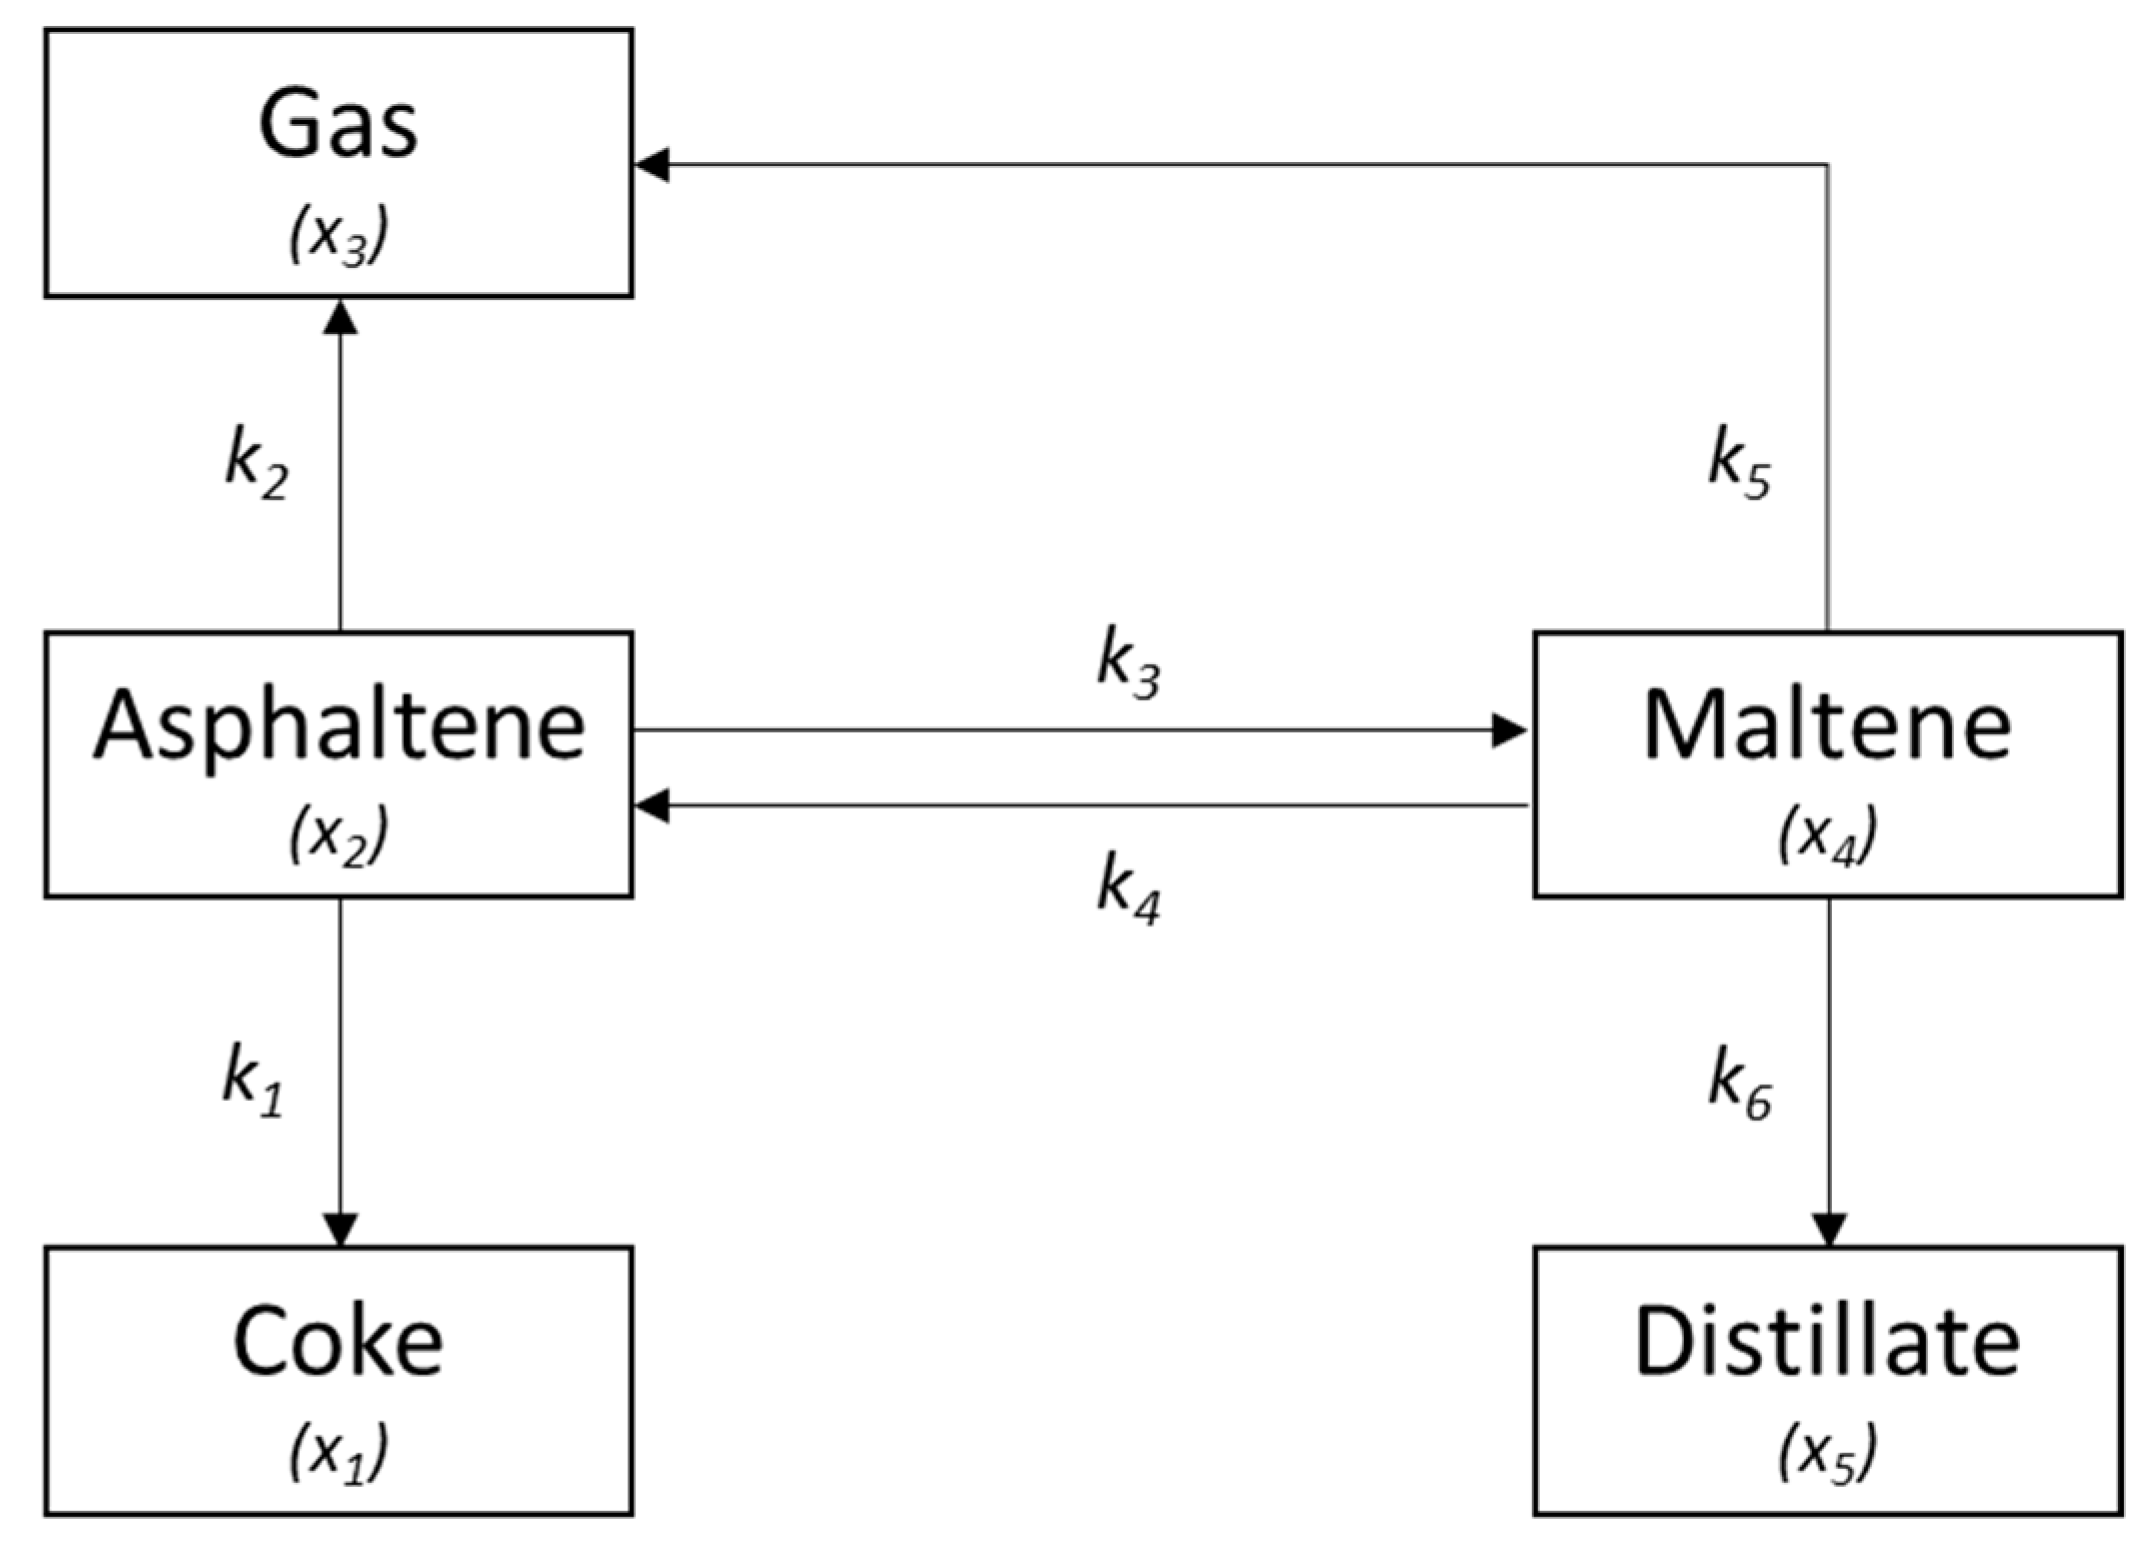
2.4. Kinetic Modelling
2.5. Energy Analysis
3. Materials and Methods
3.1. Materials
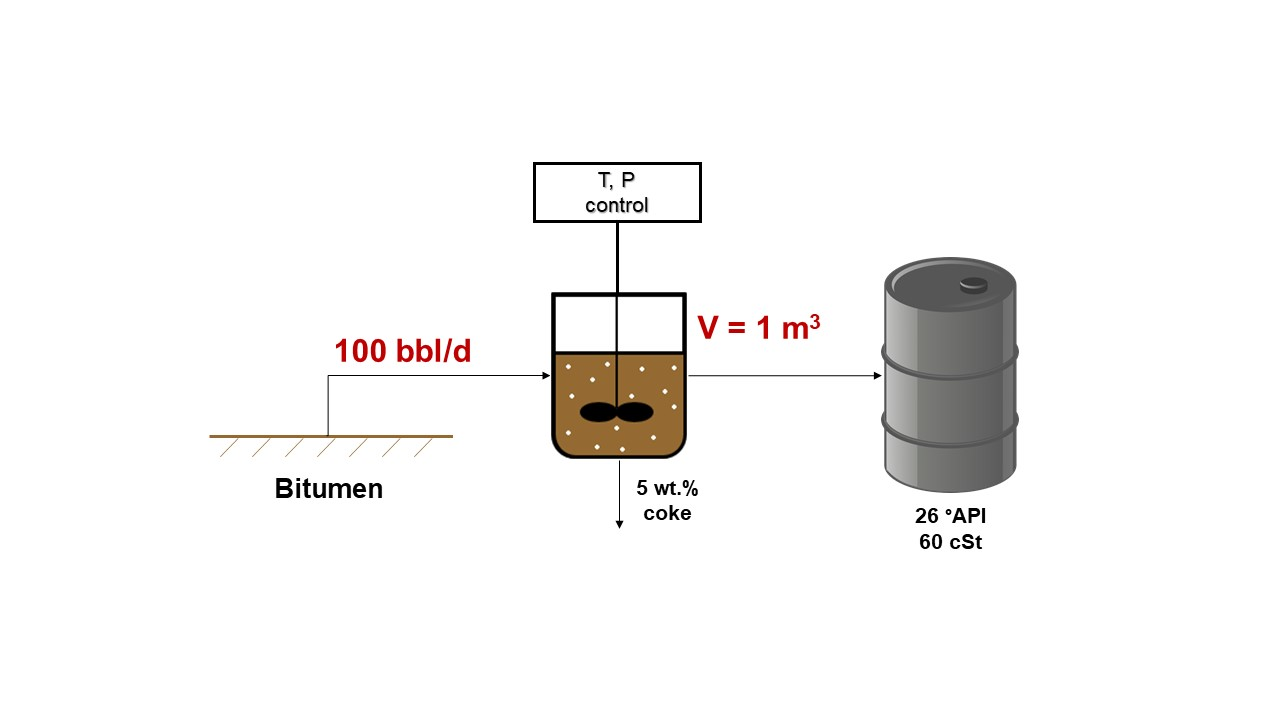
3.2. Upgrading
3.3. Analysis
3.4. Kinetic Model
4. Conclusions
Supplementary Materials
Author Contributions
Funding
Acknowledgments
Conflicts of Interest
Abbreviations
| BAS | Brønsted acid sites |
| CCR | Conradson carbon residue |
| LAS | Lewis acid sites |
| TI | Toluene insoluble |
References
- Rogner, H.H. An Assessment of World Hydrocarbon Resources. Ann. Rev. Energy Environ. 1997, 22, 217–262. [Google Scholar] [CrossRef]
- EIA. Annual Energy Outlook 2016; U.S. Energy Information Administration: Washington, DC, USA, 2016; p. ES-5.
- Gawel, I.; Bociarska, D.; Biskupski, P. Effect of asphaltenes on hydroprocessing of heavy oils and residua. Appl. Catal. A Gen. 2005, 295, 89–94. [Google Scholar] [CrossRef]
- Demirbas, A.; Bafail, A.; Nizami, A.S. Heavy oil upgrading: Unlocking the future fuel supply. Pet. Sci. Technol. 2016, 34, 303–308. [Google Scholar] [CrossRef]
- Castañeda, L.C.; Muñoz, J.A.D.; Ancheyta, J. Current situation of emerging technologies for upgrading of heavy oils. Catal. Today 2014, 220–222, 248–273. [Google Scholar] [CrossRef]
- Speight, J.G. Heavy and Extra-Heavy Oil Upgrading Technologies; Gulf Professional Publishing: Woburn, MA, USA, 2013; ISBN 9780124045705. [Google Scholar]
- Gray, M.R. Upgrading Oilsands Bitumen and Heavy Oil; University of Alberta: Edmonton, AB, Canada, 2015. [Google Scholar]
- Prajapati, R.; Kohli, K.; Maity, S.K.; Garg, M.O. Coking propensity during hydroprocessing of vacuum residues, deasphalted oils, and asphaltenes. Fuel 2017, 203, 514–521. [Google Scholar] [CrossRef]
- Carrillo, J.A.; Corredor, L.M. Upgrading of heavy crude oils: Castilla. Fuel Process. Technol. 2013, 109, 156–162. [Google Scholar] [CrossRef]
- Montes, V.; Hill, J.M. Activated carbon production: Recycling KOH to minimize waste. Mater. Lett. 2018, 220, 238–240. [Google Scholar] [CrossRef]
- Tan, M.H.; Zheng, J.T.; Li, P.; Noritatsu, T.; Wu, M.B. Preparation and modification of high performance porous carbons from petroleum coke for use as supercapacitor electrodes. Xinxing Tan Cailiao/New Carbon Mater. 2016, 31, 343–351. [Google Scholar] [CrossRef]
- Manasrah, A.D.; Nassar, N.N.; Ortega, L.C. Conversion of petroleum coke into valuable products using oxy-cracking technique. Fuel 2018, 215, 865–878. [Google Scholar] [CrossRef]
- Edwards, L.; Vogt, F.; Robinette, M.; Love, R.; Ross, A.; Mcclung, M.; Roush, R.; Morgan, W. Use of Shot Coke as an Anode Raw Material. In Essential Readings in Light Metals: Electrode Technology for Aluminum Production; Springer International Publishing: Cham, Switzerland, 2013; ISBN 9781118636633. [Google Scholar]
- Czarnecki, J.; Radoev, B.; Schramm, L.L.; Slavchev, R. On the nature of Athabasca Oil Sands. Adv. Colloid Interface Sci. 2005, 114–115, 53–60. [Google Scholar] [CrossRef]
- Attanasi, E.D.; Meyer, R.F. Natural Bitumen and Extra-Heavy Oil. Surv. Energy Resour. 2007, 93–117. [Google Scholar] [CrossRef]
- Hart, A. A review of technologies for transporting heavy crude oil and bitumen via pipelines. J. Pet. Explor. Prod. Technol. 2014, 4, 327–336. [Google Scholar] [CrossRef]
- Shah, A.; Fishwick, R.; Wood, J.; Leeke, G.; Rigby, S.; Greaves, M. A review of novel techniques for heavy oil and bitumen extraction and upgrading. Energy Environ. Sci. 2010, 3, 700. [Google Scholar] [CrossRef]
- Martínez-Palou, R.; de Lourdes Mosqueira, M.; Zapata-Rendón, B.; Mar-Juárez, E.; Bernal-Huicochea, C.; de la Cruz Clavel-López, J.; Aburto, J. Transportation of heavy and extra-heavy crude oil by pipeline: A review. J. Pet. Sci. Eng. 2011, 75, 274–282. [Google Scholar] [CrossRef]
- Ramos-Pallares, F.; Schoeggl, F.F.; Taylor, S.D.; Satyro, M.A.; Yarranton, H.W. Predicting the Viscosity of Hydrocarbon Mixtures and Diluted Heavy Oils Using the Expanded Fluid Model. Energy Fuels 2016, 30, 3575–3595. [Google Scholar] [CrossRef]
- Verma, A.; Nimana, B.; Olateju, B.; Rahman, M.M.; Radpour, S.; Canter, C.; Subramanyam, V.; Paramashivan, D.; Vaezi, M.; Kumar, A. A techno-economic assessment of bitumen and synthetic crude oil transport (SCO) in the Canadian oil sands industry: Oil via rail or pipeline? Energy 2017, 124, 665–683. [Google Scholar] [CrossRef]
- Miadonye, A.; Latour, N.; Puttagunta, V.R. Correlation for viscosity and solvent mass fraction of bitumen-diluent mixtures. Pet. Sci. Technol. 2000, 18, 1–14. [Google Scholar] [CrossRef]
- He, P.; Luan, Y.; Zhao, L.; Cheng, W.; Wu, C.; Chen, S.; Song, H. Catalytic bitumen partial upgrading over Ag-Ga/ZSM-5 under methane environment. Fuel Process. Technol. 2017, 156, 290–297. [Google Scholar] [CrossRef]
- Zhao, L.; He, P.; Jarvis, J.; Song, H. Catalytic Bitumen Partial Upgrading under Methane Environment over Ag-Mo-Ce/ZSM-5 Catalyst and Mechanistic Study Using N-Butylbenzene as Model Compound. Energy Fuels 2016, 30. [Google Scholar] [CrossRef]
- He, P.; Zhao, L.; Song, H. Bitumen partial upgrading over Mo/ZSM-5 under methane environment: Methane participation investigation. Appl. Catal. B Environ. 2017, 201, 438–450. [Google Scholar] [CrossRef]
- Yañez Jaramillo, L.M.; De Klerk, A. Partial Upgrading of Bitumen by Thermal Conversion at 150–300 °C. Energy Fuels 2018, 32, 3299–3311. [Google Scholar] [CrossRef]
- Xing, T.; Alvarez-Majmutov, A.; Chen, J. Bitumen partial upgrading by mild hydroprocessing in a fixed-bed reactor. Fuel 2019, 235, 696–702. [Google Scholar] [CrossRef]
- Valavarasu, G.; Bhaskar, M.; Balaraman, K.S. Mild Hydrocracking—A Review of the Process, Catalysts, Reactions, Kinetics, and Advantages. Pet. Sci. Technol. 2003, 21, 1185–1205. [Google Scholar] [CrossRef]
- Ball, A.S.; Stewart, R.J.; Schliephake, K. A review of the current options for the treatment and safe disposal of drill cuttings. Waste Manag. Res. 2012, 30, 457–473. [Google Scholar] [CrossRef]
- Kaminski, T.; Husein, M.M. Thermal cracking of atmospheric residue versus vacuum residue. Fuel Process. Technol. 2018, 181, 331–339. [Google Scholar] [CrossRef]
- Eshraghian, A.; Husein, M.M. Catalytic thermal cracking of Athabasca VR in a closed reactor system. Fuel 2018, 217, 409–419. [Google Scholar] [CrossRef]
- Kaminski, T.; Sheng, Q.; Husein, M.; Kaminski, T.; Sheng, Q.; Husein, M.M. Hydrocracking of Athabasca Vacuum Residue Using Ni-Mo-Supported Drill Cuttings. Catalysts 2019, 9, 216. [Google Scholar] [CrossRef]
- Gary, J.H.; Handwerk, G.E.; Kaiser, M.J. Petroleum Refining: Technology and Economics; CRC Press: Boca Raton, FL, USA, 2007. [Google Scholar]
- Kondo, J.N.; Nishitani, R.; Yoda, E.; Yokoi, T.; Tatsumi, T.; Domen, K. A comparative IR characterization of acidic sites on HY zeolite by pyridine and CO probes with silica–alumina and γ-alumina references. Phys. Chem. Chem. Phys. 2010, 12, 11576. [Google Scholar] [CrossRef] [PubMed]
- Parry, E.P. An infrared study of pyridine adsorbed on acidic solids. Characterization of surface acidity. J. Catal. 1963, 2, 371–379. [Google Scholar] [CrossRef]
- Wielers, A.F.H.; Vaarkamp, M.; Post, M.F.M. Relation between properties and performance of zeolites in paraffin cracking. J. Catal. 1991, 127, 51–66. [Google Scholar] [CrossRef]
- Jacob, S.M.; Gross, B.; Voltz, S.E.; Weekman, V.W. A lumping and reaction scheme for catalytic cracking. AIChE J. 1976, 22, 701–713. [Google Scholar] [CrossRef]
- Decroocq, D. Catalytic Cracking of Heavy Petroleum Fractions; Editions Technip: Paris, France, 1984. [Google Scholar]
- Regali, F.; Liotta, L.F.; Venezia, A.M.; Montes, V.; Boutonnet, M.; Järås, S. Effect of metal loading on activity, selectivity and deactivation behavior of Pd/silica-alumina catalysts in the hydroconversion of n-hexadecane. Catal. Today 2014, 223, 87–96. [Google Scholar] [CrossRef]
- Beganskiene, A.; Sirutkaitis, V.; Kurtinaitiene, M.; Juskenas, R.; Kareiva, A. FTIR, TEM and NMR Iinvestigations of Stöber Silica Nanoparticles. Mater. Sci. 2004, 10, 287–290. [Google Scholar]
- Contreras, C.A.; Sugita, S.; Ramos, E. Preparation of Sodium Aluminate From Basic Aluminium Sulfate. AZo J. Mater. Online 2006, 1–13. [Google Scholar] [CrossRef]
- Thommes, M. Physical adsorption characterization of nanoporous materials. Chemie-Ingenieur-Technik 2010, 82, 1059–1073. [Google Scholar] [CrossRef]
- Ali, M.A.; Tatsumi, T.; Masuda, T. Development of heavy oil hydrocracking catalysts using amorphous silica-alumina and zeolites as catalyst supports. Appl. Catal. A Gen. 2002, 233, 77–90. [Google Scholar] [CrossRef]
- Kaminski, T.; Anis, S.F.; Husein, M.M.; Hashaikeh, R. Hydrocracking of Athabasca VR Using NiO-WO3 Zeolite-Based Catalysts. Energy Fuels 2018, 32, 2224–2233. [Google Scholar] [CrossRef]
- Sanaie, N.; Watkinson, A.P.; Bowen, B.D.; Smith, K.J. Effect of minerals on coke precursor formation. Fuel 2001, 80, 1111–1119. [Google Scholar] [CrossRef]
- Nhieu, P.; Liu, Q.; Gray, M.R. Role of water and fine solids in onset of coke formation during bitumen cracking. Fuel 2016, 166, 152–156. [Google Scholar] [CrossRef]
- Tanabe, K.; Gray, M.R. Role of fine solids in the coking of vacuum residues. Energy Fuels 1997, 11, 1040–1043. [Google Scholar] [CrossRef]
- Maxwell, I.E. Zeolite catalysis in hydroprocessing technology. Catal. Today 1987, 1, 385–413. [Google Scholar] [CrossRef]
- Eshraghian, A.; Husein, M.M. Thermal cracking of Athabasca VR and bitumen and their maltene fraction in a closed reactor system. Fuel 2017, 190, 396–408. [Google Scholar] [CrossRef]
- Singh, J.; Kumar, M.M.; Saxena, A.K.; Kumar, S. Reaction pathways and product yields in mild thermal cracking of vacuum residues: A multi-lump kinetic model. Chem. Eng. J. 2005, 108, 239–248. [Google Scholar] [CrossRef]
- Del Bianco, A.; Panariti, N.; Anelli, M.; Beltrame, P.L.; Carniti, P. Thermal cracking of petroleum residues. 1. Kinetic analysis of the reaction. Fuel 1993, 72, 75–80. [Google Scholar] [CrossRef]
- Phillips, C.R.; Haidar, N.I.; Poon, Y.C. Kinetic models for the thermal cracking of Athabasca bitumen. Fuel 1985, 64, 678–691. [Google Scholar] [CrossRef]
- Gray, M.R.; McCaffrey, W.C.; Huq, I.; Le, T. Kinetics of cracking and devolatilization during coking of Athabasca residues. Ind. Eng. Chem. Res. 2004, 43, 5438–5445. [Google Scholar] [CrossRef]
- Gentzis, T.; Rahimi, P.; Malhotra, R.; Hirschon, A.S. Effect of carbon additives on the mesophase induction period of Athabasca bitumen. Fuel Process. Technol. 2001, 69, 191–203. [Google Scholar] [CrossRef]
- Lababidi, H.M.S.; Sabti, H.M.; Alhumaidan, F.S. Changes in asphaltenes during thermal cracking of residual oils. Fuel 2014, 117, 59–67. [Google Scholar] [CrossRef]
- Ranjbar, M.; Pusch, G. Pyrolysis and combustion kinetics of crude oils, asphaltenes and resins in relation to thermal recovery processes. J. Anal. Appl. Pyrolysis 1991, 20, 185–196. [Google Scholar] [CrossRef]
- Asgharzadeh Shishavan, R.; Ghashghaee, M.; Karimzadeh, R. Investigation of kinetics and cracked oil structural changes in thermal cracking of Iranian vacuum residues. Fuel Process. Technol. 2011, 92, 2226–2234. [Google Scholar] [CrossRef]
- Kaminski, T.; Husein, M.M.M. Kinetic Modelling of Thermal Cracking of Arabian Atmospheric and Vacuum Residue. Fuel Process. Technol. 2019, 189, 89–97. [Google Scholar] [CrossRef]
- Singh, J.; Kumar, M.M.; Saxena, A.K.; Kumar, S. Studies on thermal cracking behavior of residual feedstocks in a batch reactor. Chem. Eng. Sci. 2004, 59, 4505–4515. [Google Scholar] [CrossRef]
- Cardillo, P.; Galtieri, A. Determination of the Carbon Residue of Fuel Oils by Means of Thermogravimetry. Riv. Combust. 1987, 41, 1–5. [Google Scholar]
- Jia, N.; Moore, R.G.; Mehta, S.A.; Ursenbach, M.G. Kinetic modelling of thermal cracking and low temperature oxidation reactions. J. Can. Pet. Technol. 2006. [Google Scholar] [CrossRef]
- Radmanesh, R.; Chan, E.; Gray, M.R. Modeling of mass transfer and thermal cracking during the coking of Athabasca residues. Chem. Eng. Sci. 2008, 63, 1683–1691. [Google Scholar] [CrossRef]
- Martínez, M.T.; Benito, A.M.; Callejas, M.A. Thermal cracking of coal residues: Kinetics of asphaltene decomposition. Fuel 1997, 76, 871–877. [Google Scholar] [CrossRef]


| Feed | CCR (wt.%) | Sulfur (wt.%) | |
|---|---|---|---|
| 12.9 | 5.4 | ||
| 400 °C | control | 20.9 | - |
| catalytic | 14.2 | - | |
| 420 °C | control | 11.6 | 4.1 |
| catalytic | 10.4 | 4.2 | |
| 440 °C | control | 14.8 | - |
| catalytic | 8.4 | - | |
| ki (h−1) | Ea (kJ/mol) | ln(ko) | R2 | |||
|---|---|---|---|---|---|---|
| 400 °C | 410 °C | 420 °C | ||||
| Non-Catalytic | ||||||
| 1 | 0.100 | 0.183 | 0.522 | 319.9 | 54.79 | 0.974 |
| 2 | 0.175 | 0.209 | 0.368 | 143.3 | 23.80 | 0.910 |
| 3 | 0.022 | 0.070 | 0.083 | 255.1 | 41.94 | 0.852 |
| 4 | 0.038 | 0.054 | 0.116 | 213.4 | 34.81 | 0.951 |
| 5 | 0.001 | 0.007 | 0.009 | 380.9 | 61.57 | 0.857 |
| 6 | 0.015 | 0.033 | 0.077 | 315.2 | 52.13 | 0.999 |
| Catalytic | ||||||
| 1 | 0.128 | 0.211 | 0.614 | 303.3 | 52.06 | 0.954 |
| 2 | 0.035 | 0.143 | 0.323 | 433.6 | 74.22 | 0.979 |
| 3 | 0.295 | 0.392 | 0.481 | 94.5 | 15.68 | 0.992 |
| 4 | 0.051 | 0.091 | 0.147 | 204.0 | 33.51 | 0.998 |
| 5 | 0.012 | 0.014 | 0.019 | 91.7 | 11.94 | 0.975 |
| 6 | 0.101 | 0.159 | 0.213 | 144.8 | 23.62 | 0.986 |
| °API gravity | 13.1 ± 2.2 |
| Viscosity (cSt) | >200,000 |
| Asphaltenes (wt.%) | 15.4 ± 1.2 |
| Maltenes (wt.%) | 82.2 ± 0.3 |
| Sulfur (wt.%) | 5.4 |
| CCR (wt.%) | 12.9 |
© 2019 by the authors. Licensee MDPI, Basel, Switzerland. This article is an open access article distributed under the terms and conditions of the Creative Commons Attribution (CC BY) license (http://creativecommons.org/licenses/by/4.0/).
Share and Cite
Kaminski, T.; Husein, M.M. Partial Upgrading of Athabasca Bitumen Using Thermal Cracking. Catalysts 2019, 9, 431. https://doi.org/10.3390/catal9050431
Kaminski T, Husein MM. Partial Upgrading of Athabasca Bitumen Using Thermal Cracking. Catalysts. 2019; 9(5):431. https://doi.org/10.3390/catal9050431
Chicago/Turabian StyleKaminski, Thomas, and Maen M. Husein. 2019. "Partial Upgrading of Athabasca Bitumen Using Thermal Cracking" Catalysts 9, no. 5: 431. https://doi.org/10.3390/catal9050431