Review

Photocatalytic Reversible Reactions Driven by Localized Surface Plasmon Resonance

Computational Center for Property and Modification on Nanomaterials, College of Sciences, Liaoning Shihua University, Fushun 113001, China
*
Author to whom correspondence should be addressed.
Catalysts 2019, 9(2), 193; https://doi.org/10.3390/catal9020193
Submission received: 14 January 2019 / Revised: 31 January 2019 / Accepted: 18 February 2019 / Published: 20 February 2019
(This article belongs to the Special Issue Plasmonic Photocatalysts)

Abstract

:
In this study, we review photocatalytic reversible surface catalytic reactions driven by localized surface plasmon resonance. Firstly, we briefly introduce the synthesis of 4,4′-dimercaptoazobenzene (DMAB) from 4-nitrobenzenethiol (4NBT) using surface-enhanced Raman scattering (SERS) technology. Furthermore, we study the photosynthetic and degradation processes of 4NBT to DMAB reduction, as well as factors associated with them, such as laser wavelength, reaction time, substrate, and pH. Last but not least, we reveal the competitive relationship between photosynthetic and degradation pathways for this reduction reaction by SERS technology on the substrate of Au film over a nanosphere.

1. Introduction

Surface-enhanced Raman scattering (SERS) and tip-enhanced Raman spectroscopy (TERS) are widely used in the fields of physics, chemistry, biology, medicine, and materials, and they are highly sensitive molecular-detection tools that play a significant role in research on the electronic structure and spectral properties of molecules and plasmon-driven chemical reactions [1,2,3,4,5,6,7,8,9]. Recently, we studied the physical mechanism of plasmon-enhanced resonance Raman and fluorescence spectra [10] to understand the applications and principles of photoinduced charge transfer [11]. Furthermore, SERS made significant contributions to the study of heterostructures in two-dimensional materials [12], and significant advances were made in the application of nonlinear optical microscopy [13]. At the same time, it is a significantly important tool for probing chemical signals about molecules adsorbed onto metal substrates, such as Au, Ag, and Cu. It is also a promising technology for detecting plasmon-driven catalytic mechanisms. This technique is extremely sensitive to detecting high field-enhancement regions on a plasmon substrate. Many research results show that an electromagnetic field is an important part of the SERS enhancement mechanism, which is generated by the amplification and localization of incident electromagnetic waves.
A lot of research shows that conversion of 4-nitrobenzenethiol (4NBT) and p-aminothiophenol (PATP) to 4,4′-dimercaptoazobenzene (DMAB) via reduction and oxidation reactions was achieved with SERS technology [2,3,4,5,6,7,8,9,10,11,14,15,16,17,18]. Theoretical and experimental studies showed that SERS synthesis of DMAB from PATP is achieved via the selective catalytic coupling of Ag nanoparticles (Ag NPs). It was concluded that, in the field of electromagnetic fields, the six strong generated vibration modes are enhanced by the plasmon; this is direct evidence of the reaction of PATP to DMAB on Ag NPs via selective catalytic coupling [19,20]. Therefore, DMAB is an important topic in the study of plasmon-assisted catalytic reactions [21,22,23,24].
Authors researched the effects of photoreduction-field enhancement from 4NBT to DMAB driven by plasmon on Au, Ag, and Cu [25,26,27]. The molecular structure of 4NBT and DMAB are shown in Figure 1 [28]. Studies showed that there was a higher active SERS in a diluted HNO3 solution for Cu substrates by using a 632.8-nm He/Ne laser. However, it could not be ruled out that Cu may also be an effective photoelectron emitter under a wavelength condition of 632.8 nm. The SERS spectrum on Cu-adsorbed 4NBT could be significantly converted into an SERS spectrum of another substance, such as 4-aminobenzenethiol (4ABT). Simultaneously, the authors studied the time-, substrate-, and wavelength-dependent surface catalysis reduction reaction of 4NBT to DMAB under the assisting condition of plasmon on Au, Ag, and Cu [29]. In Figure 2, atomic force microscopy (AFM) images of Au, Ag, and Cu films are displayed. Studies showed that this kind of reduction reaction of 4NBT to DMAB was significantly dependent on wavelength, substrates, and reaction time. When the wavelength was 632.8 nm, the reaction of 4NBT to DMAB did not occur on the Cu film substrate when the reaction time exceeded two hours. In contrast, 4NBT was quickly converted to DMAB when the wavelength was 514.5 nm. Thus, it was rational to control this reduction reaction by adjusting some of the factors mentioned above. Plasmon hot electrons provide high kinetic energy to overcome the reaction barrier for dissociation, and the electrons for photodissociation.

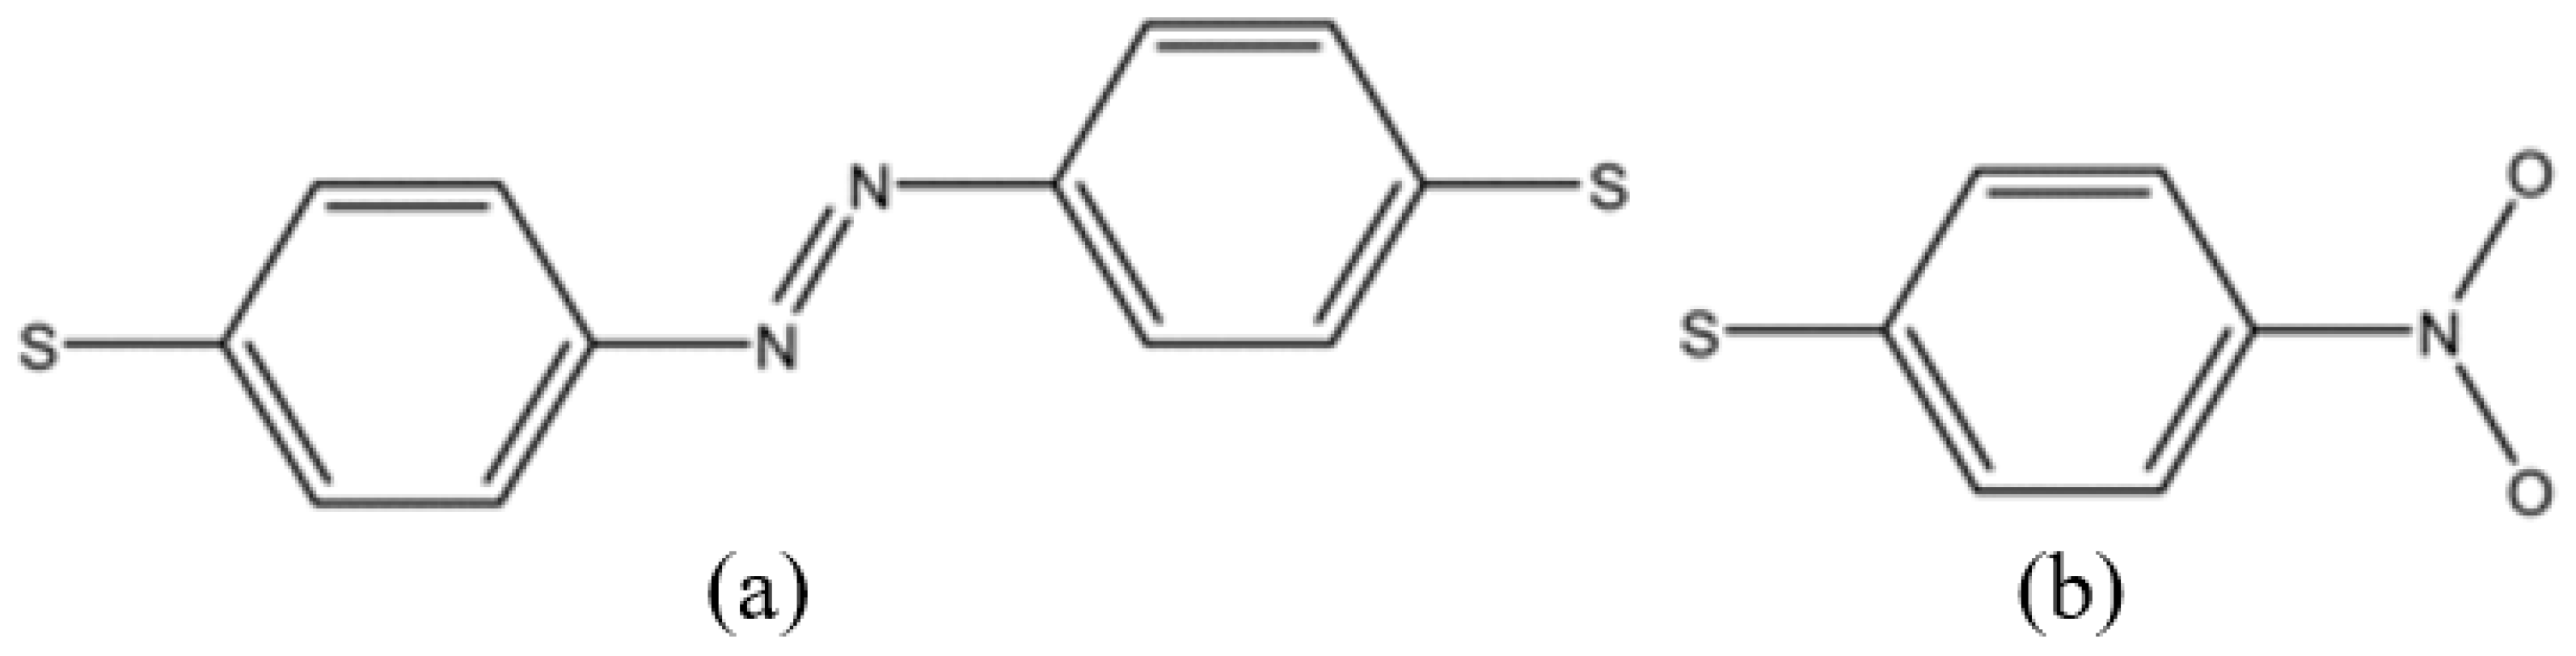
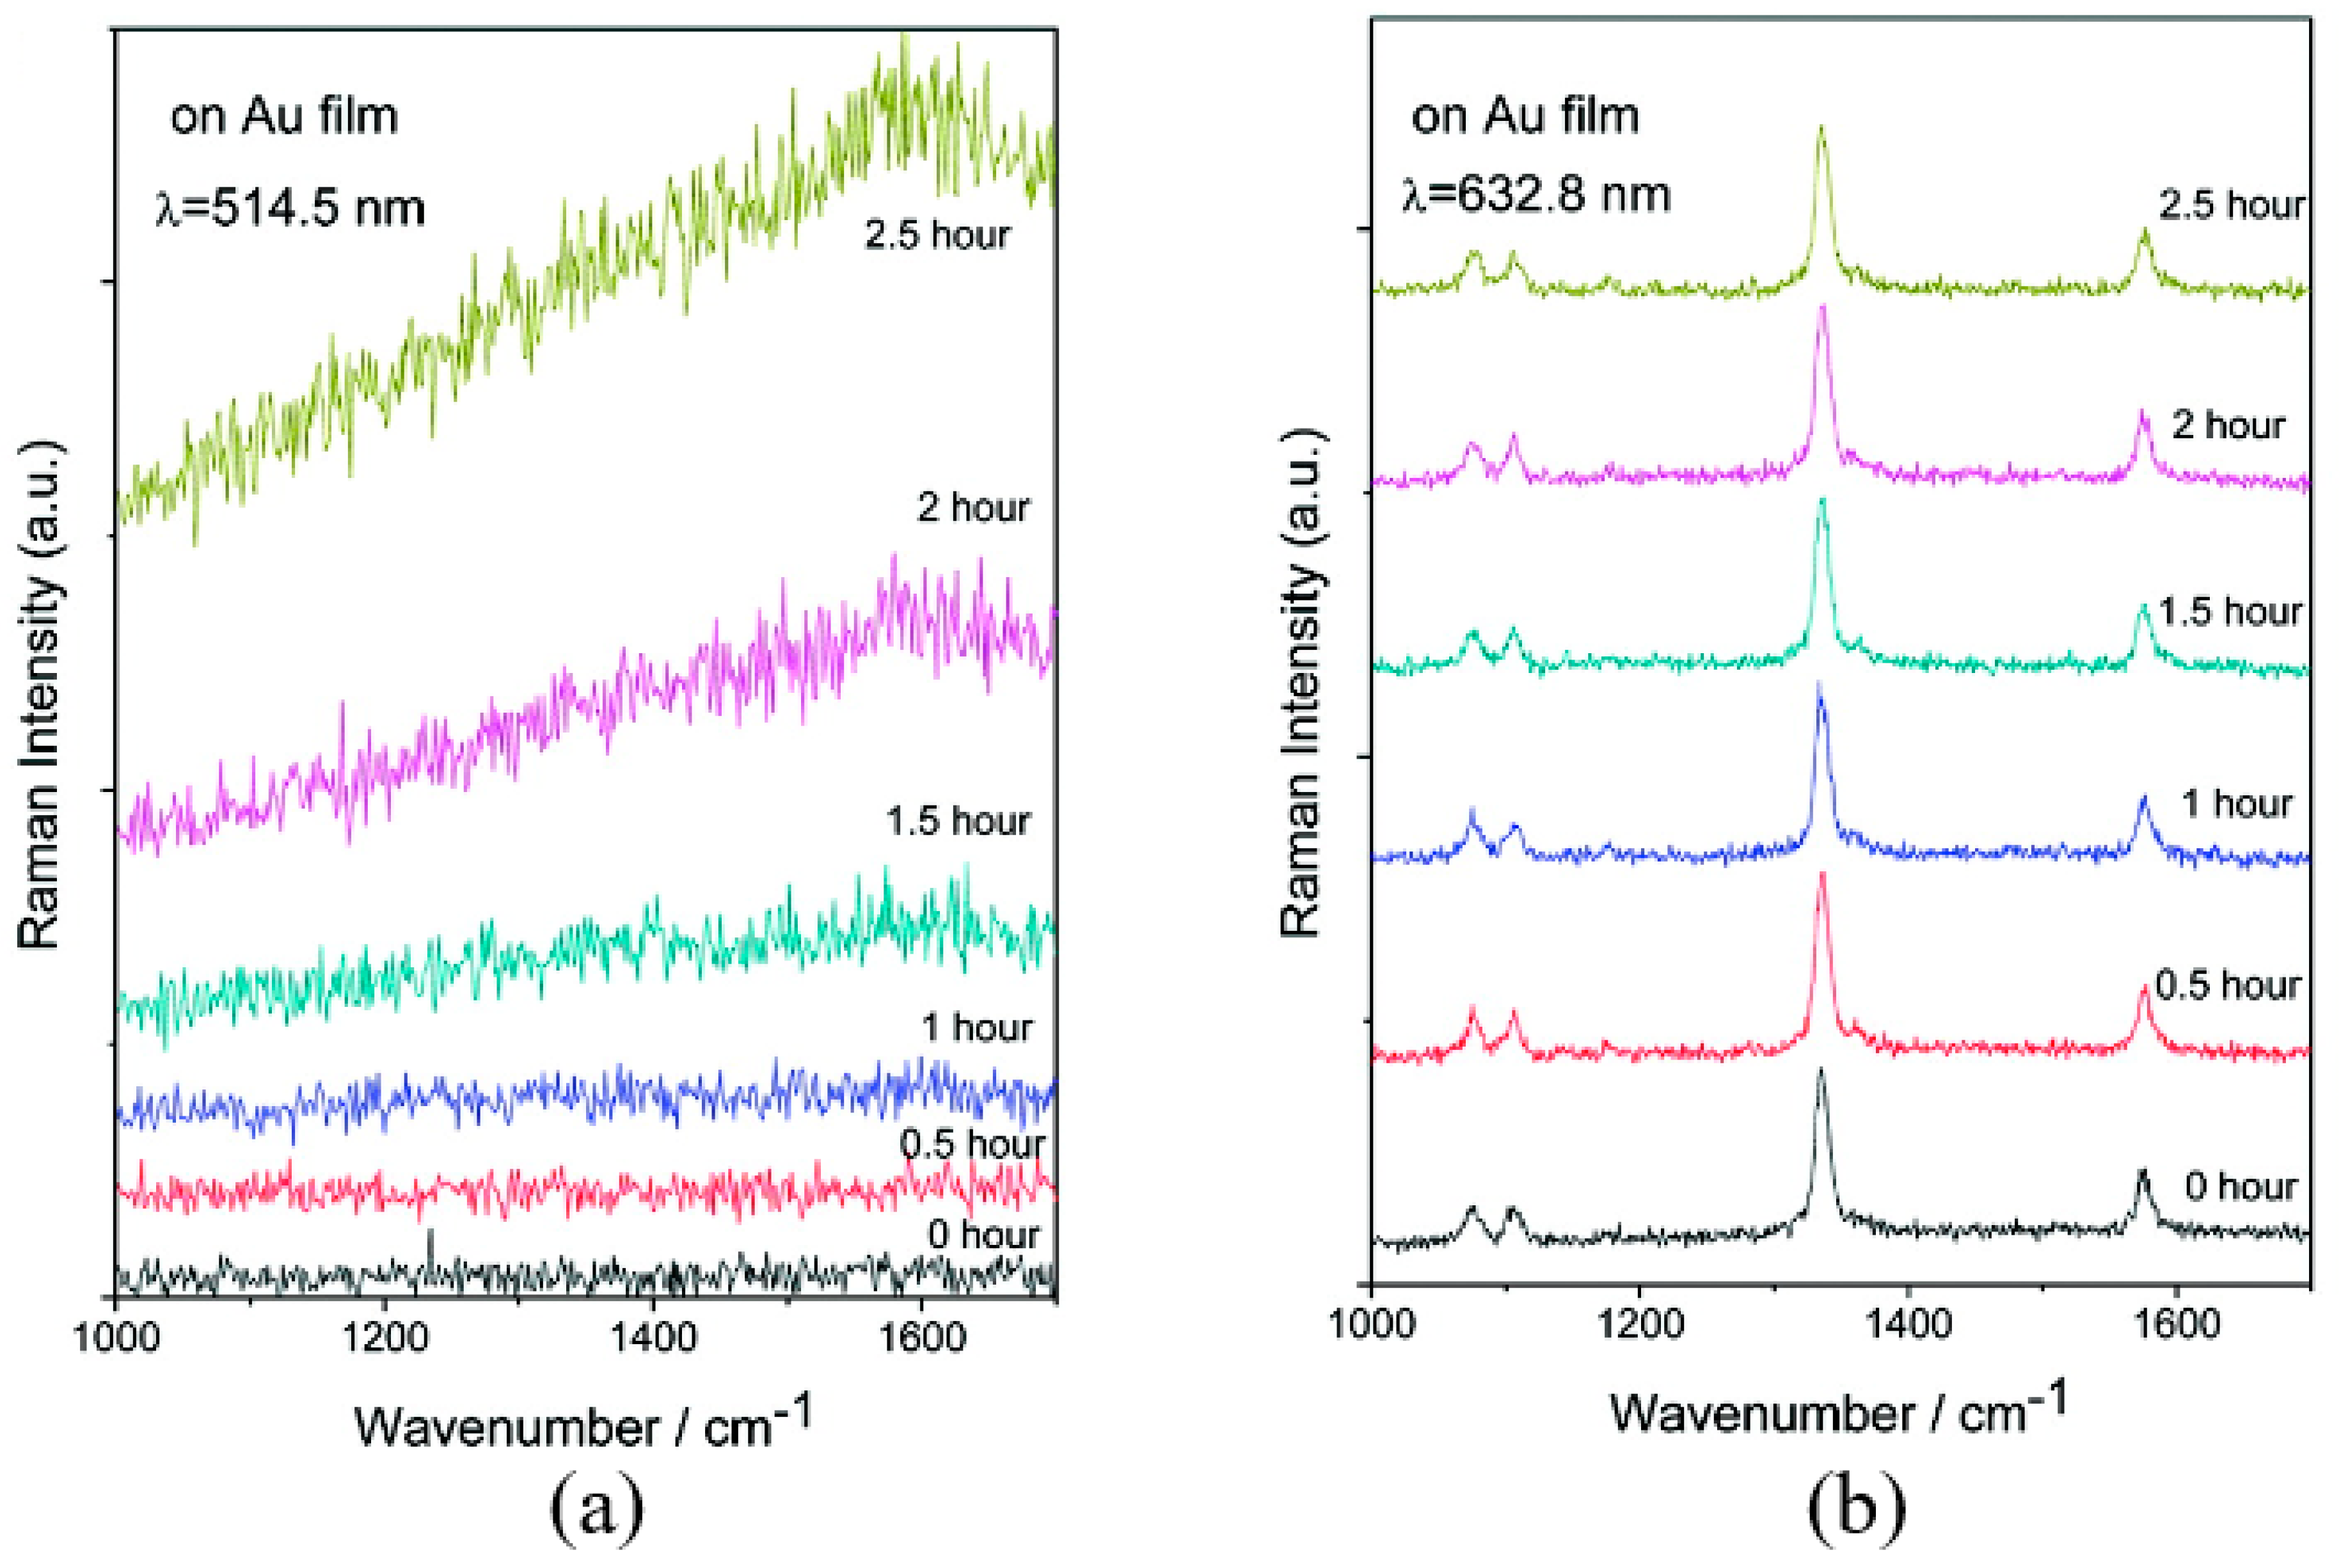
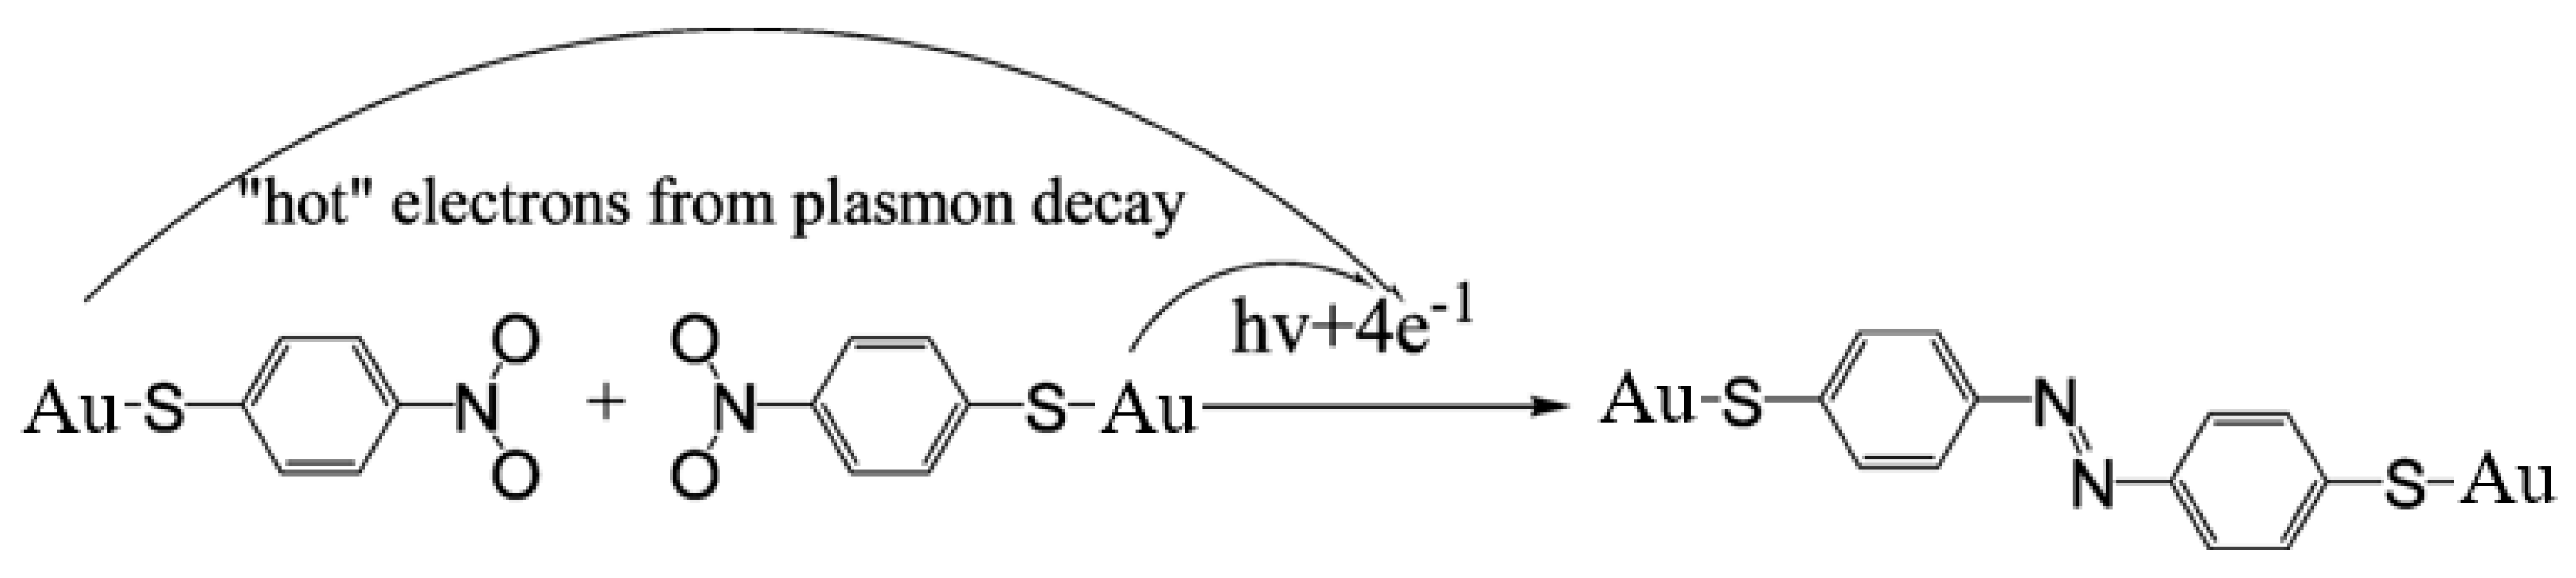
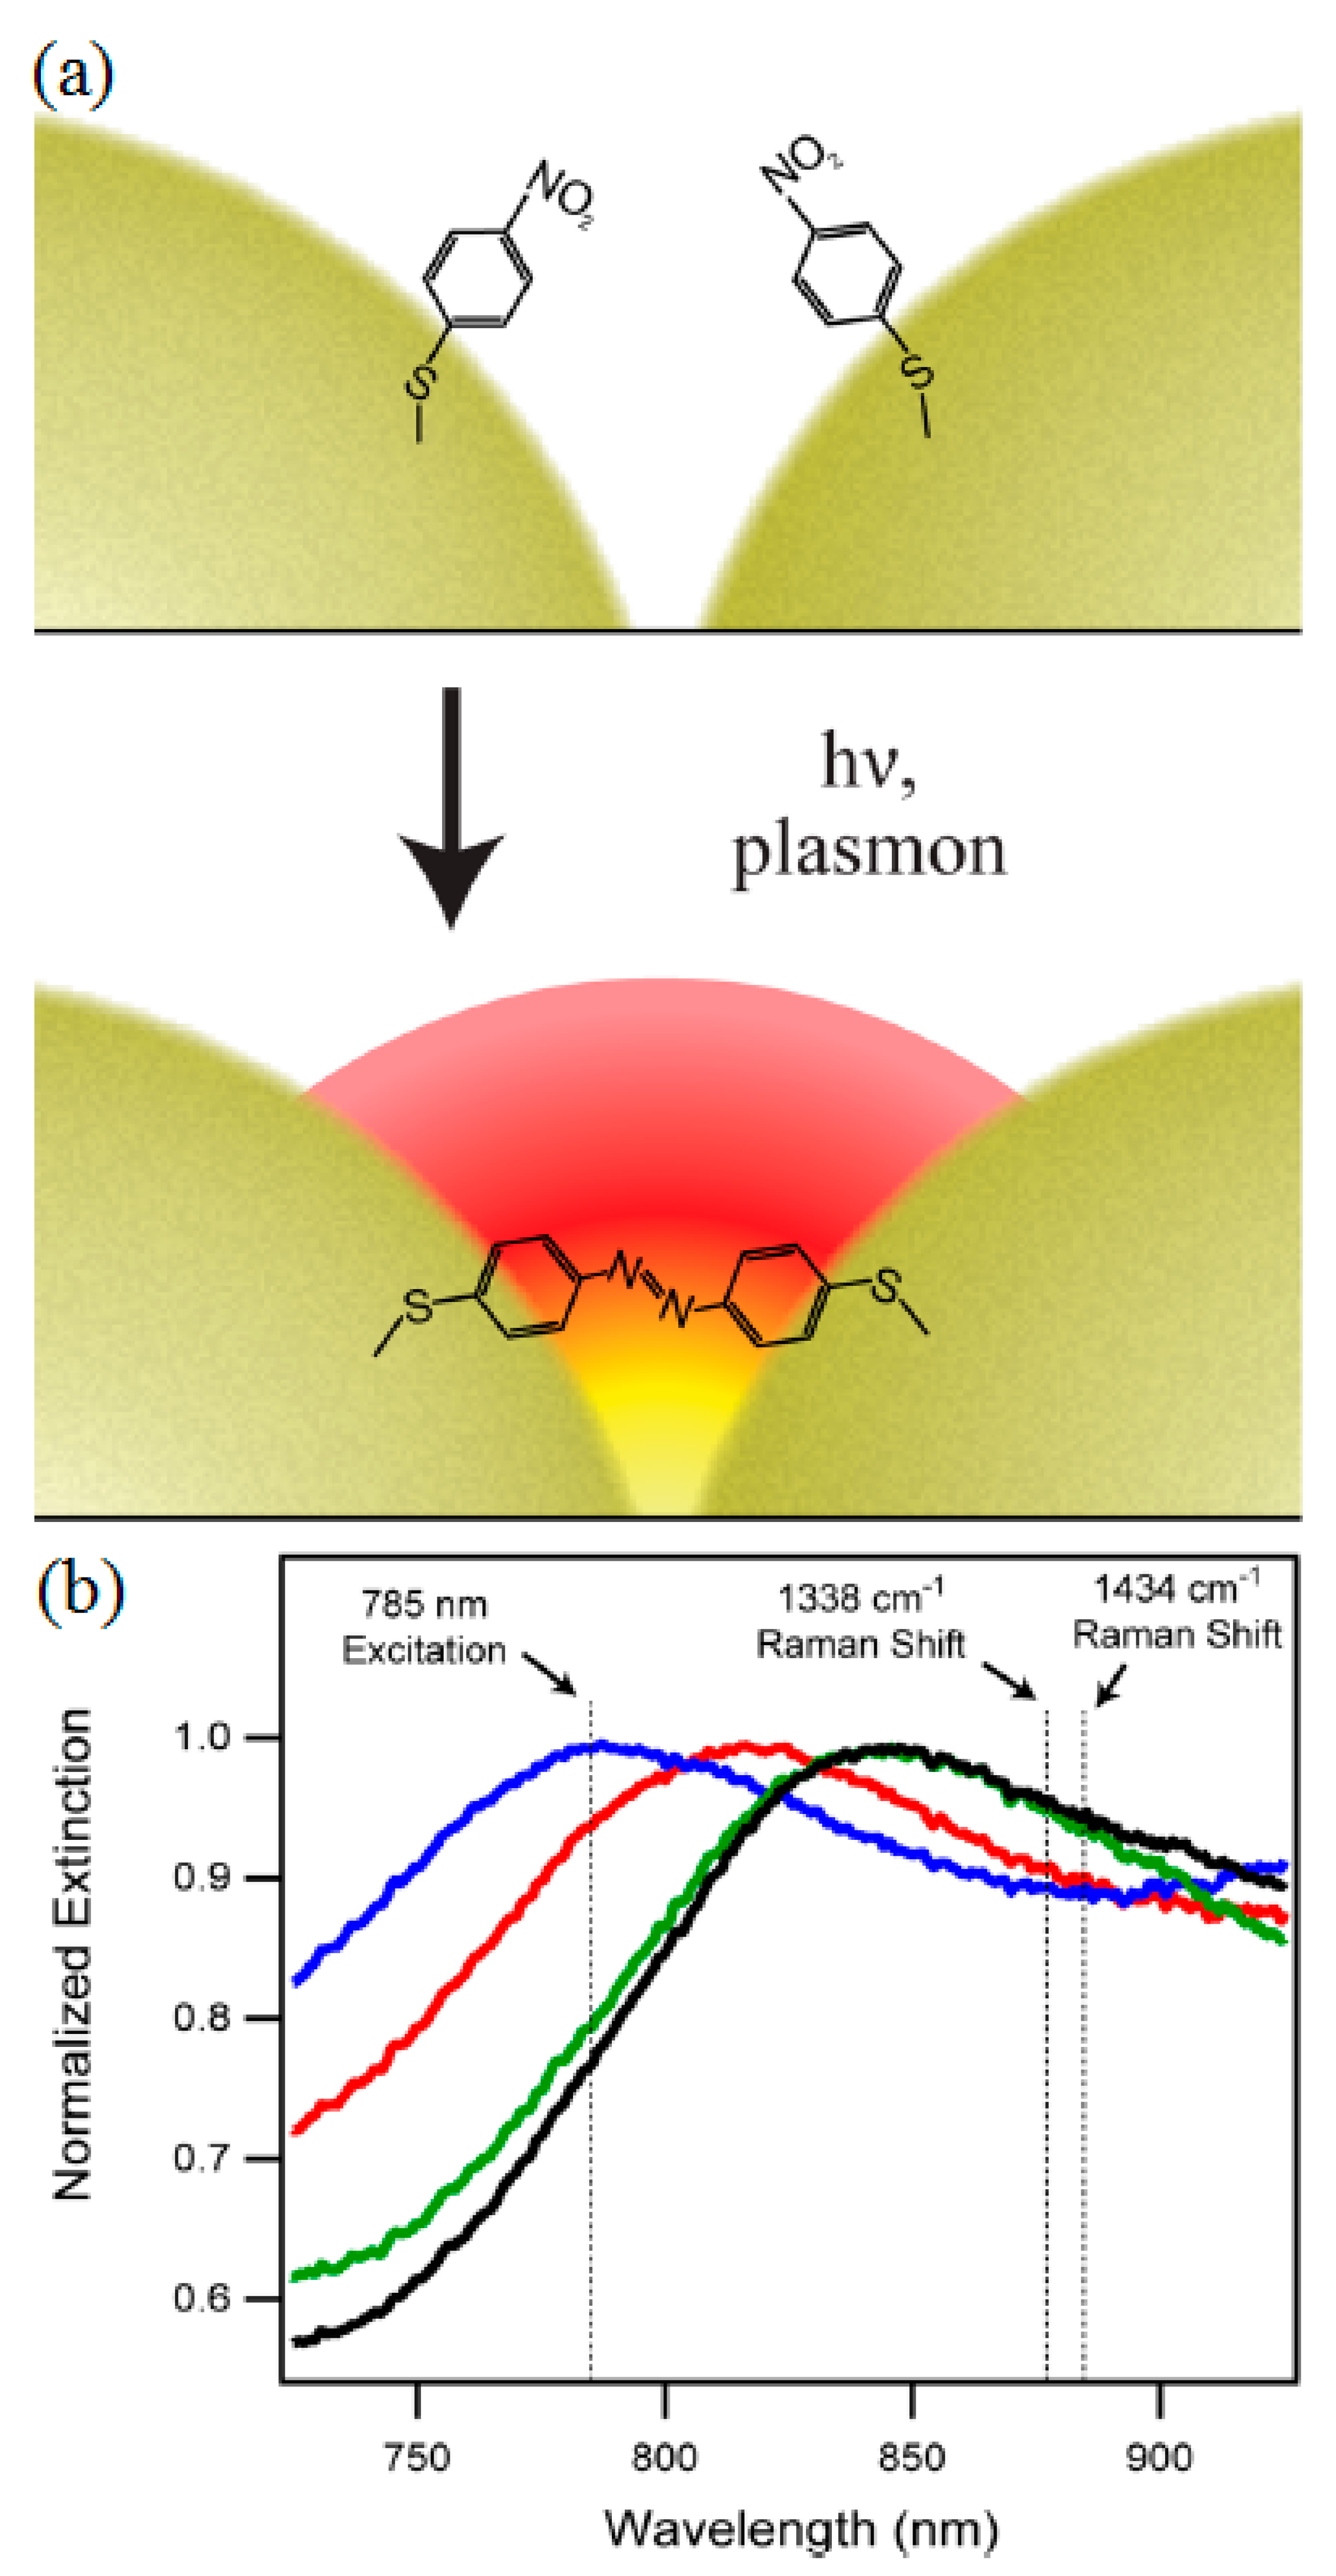
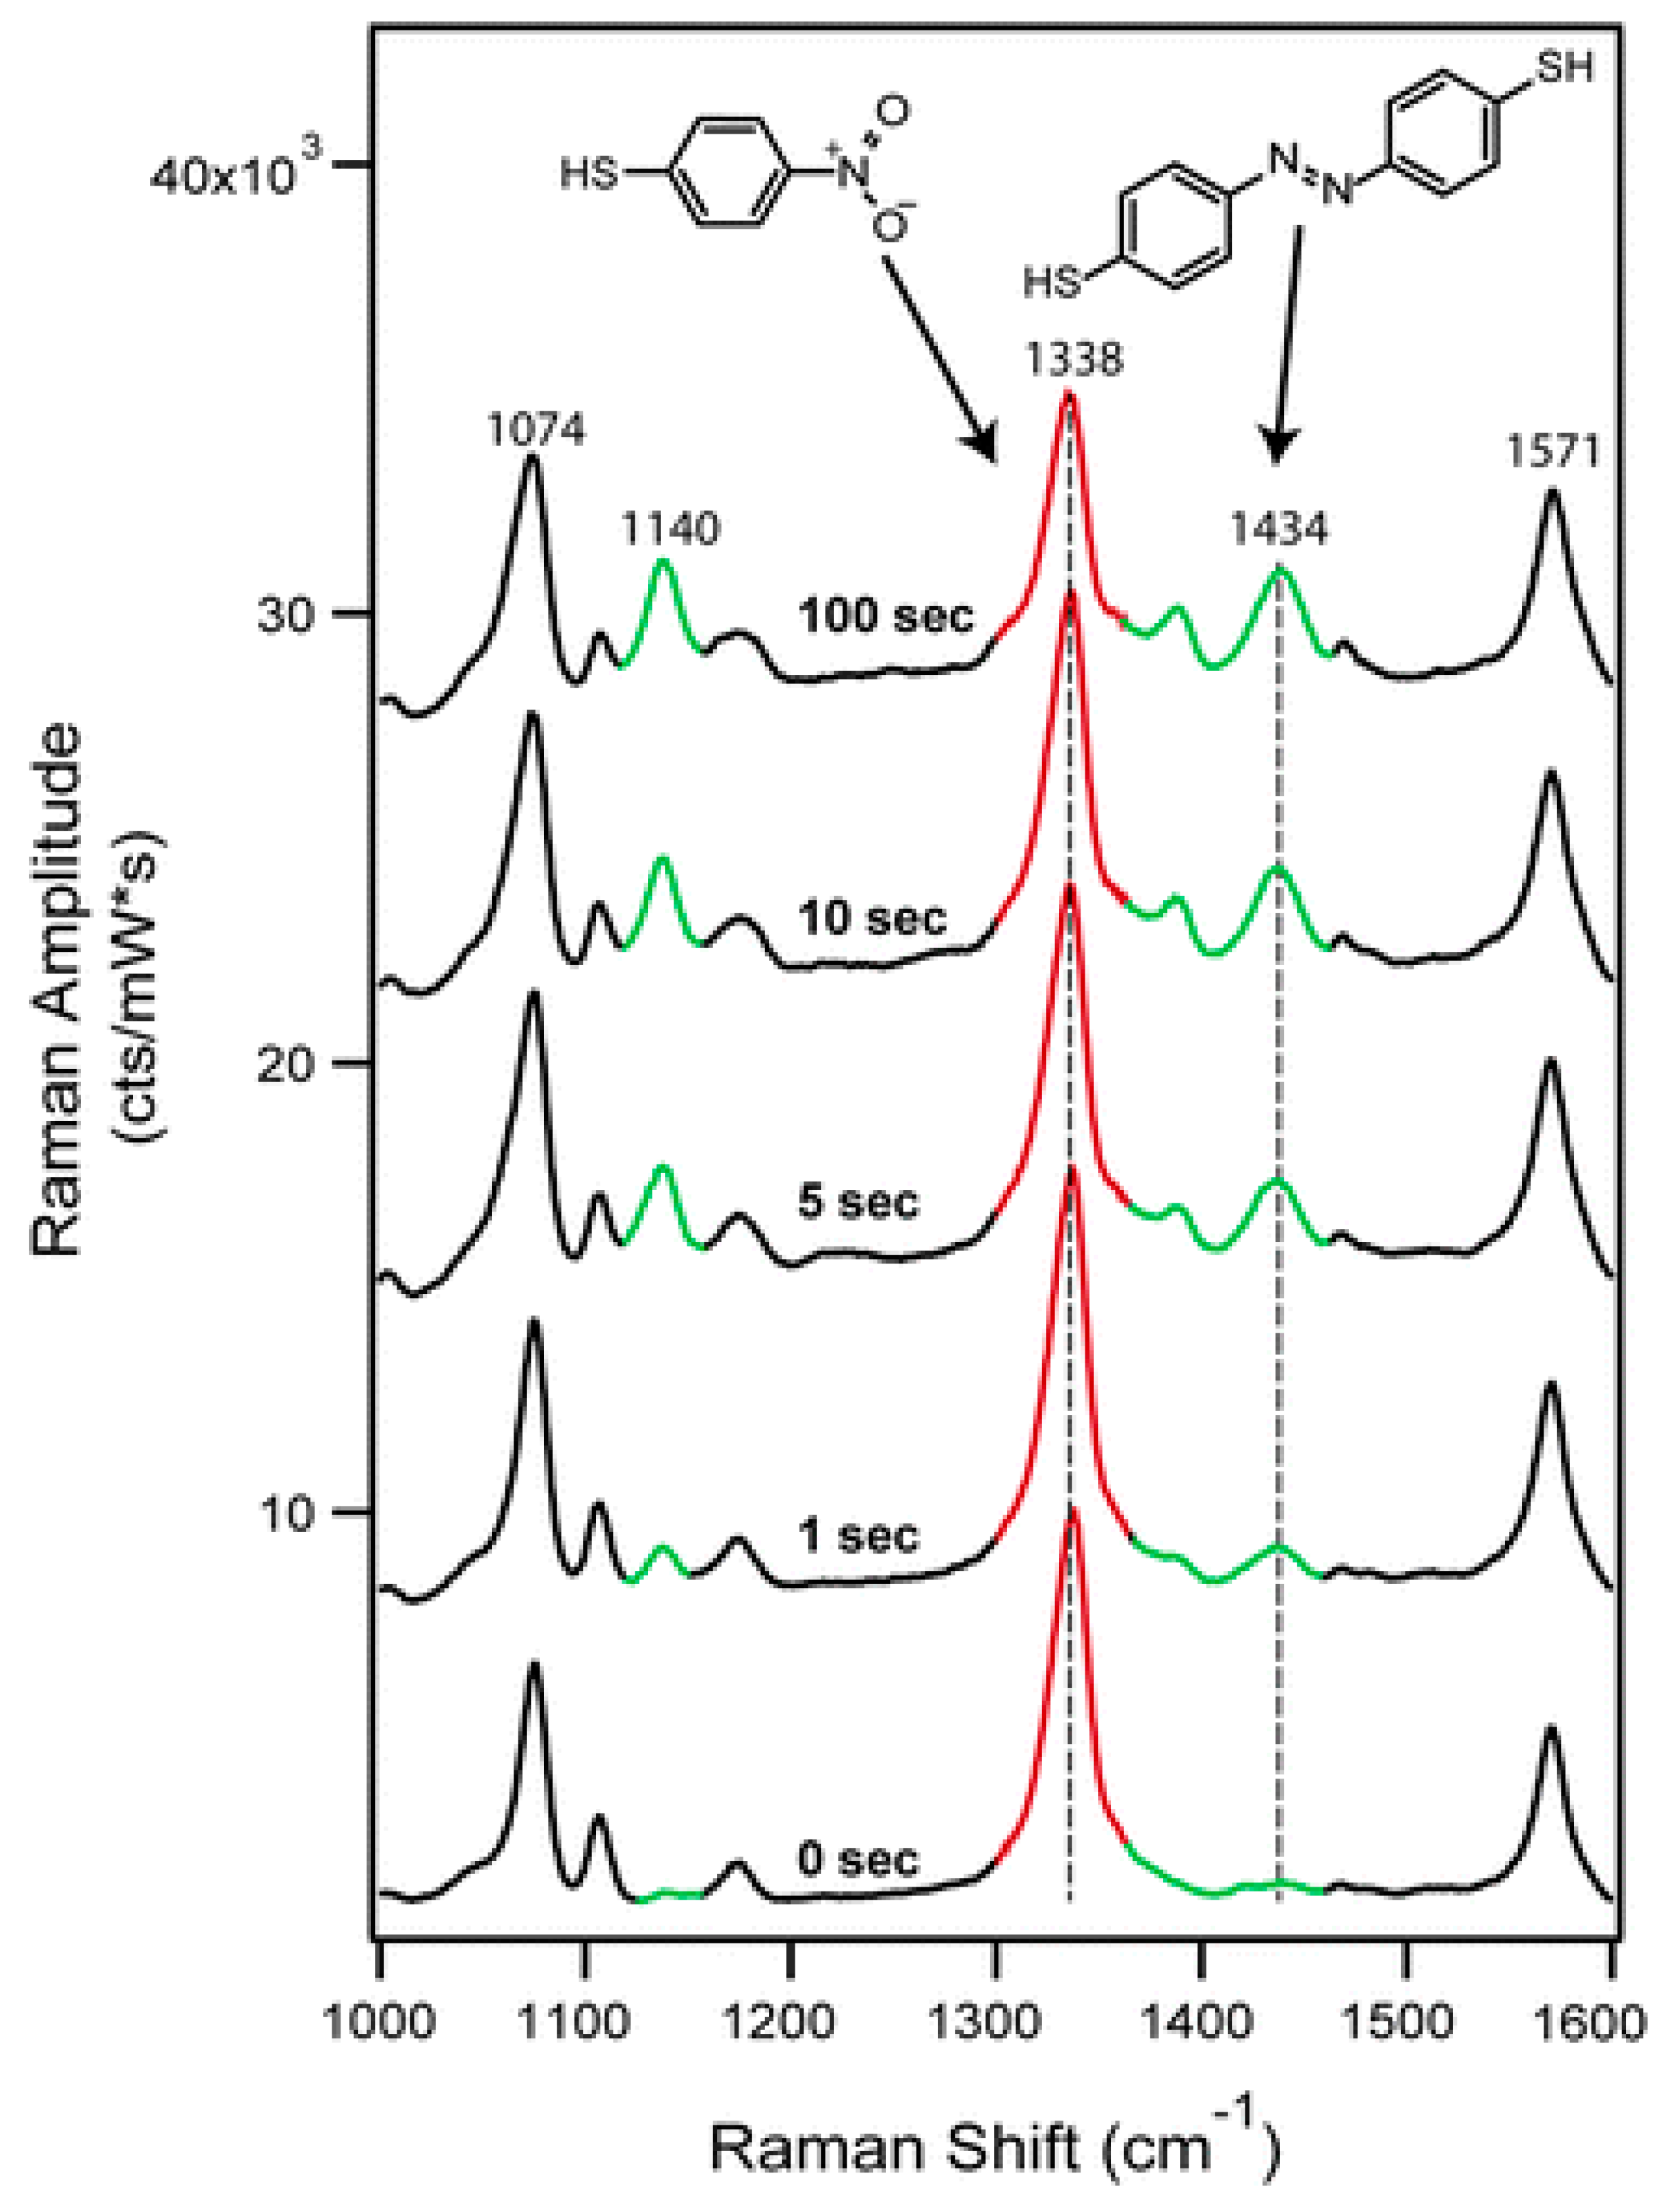
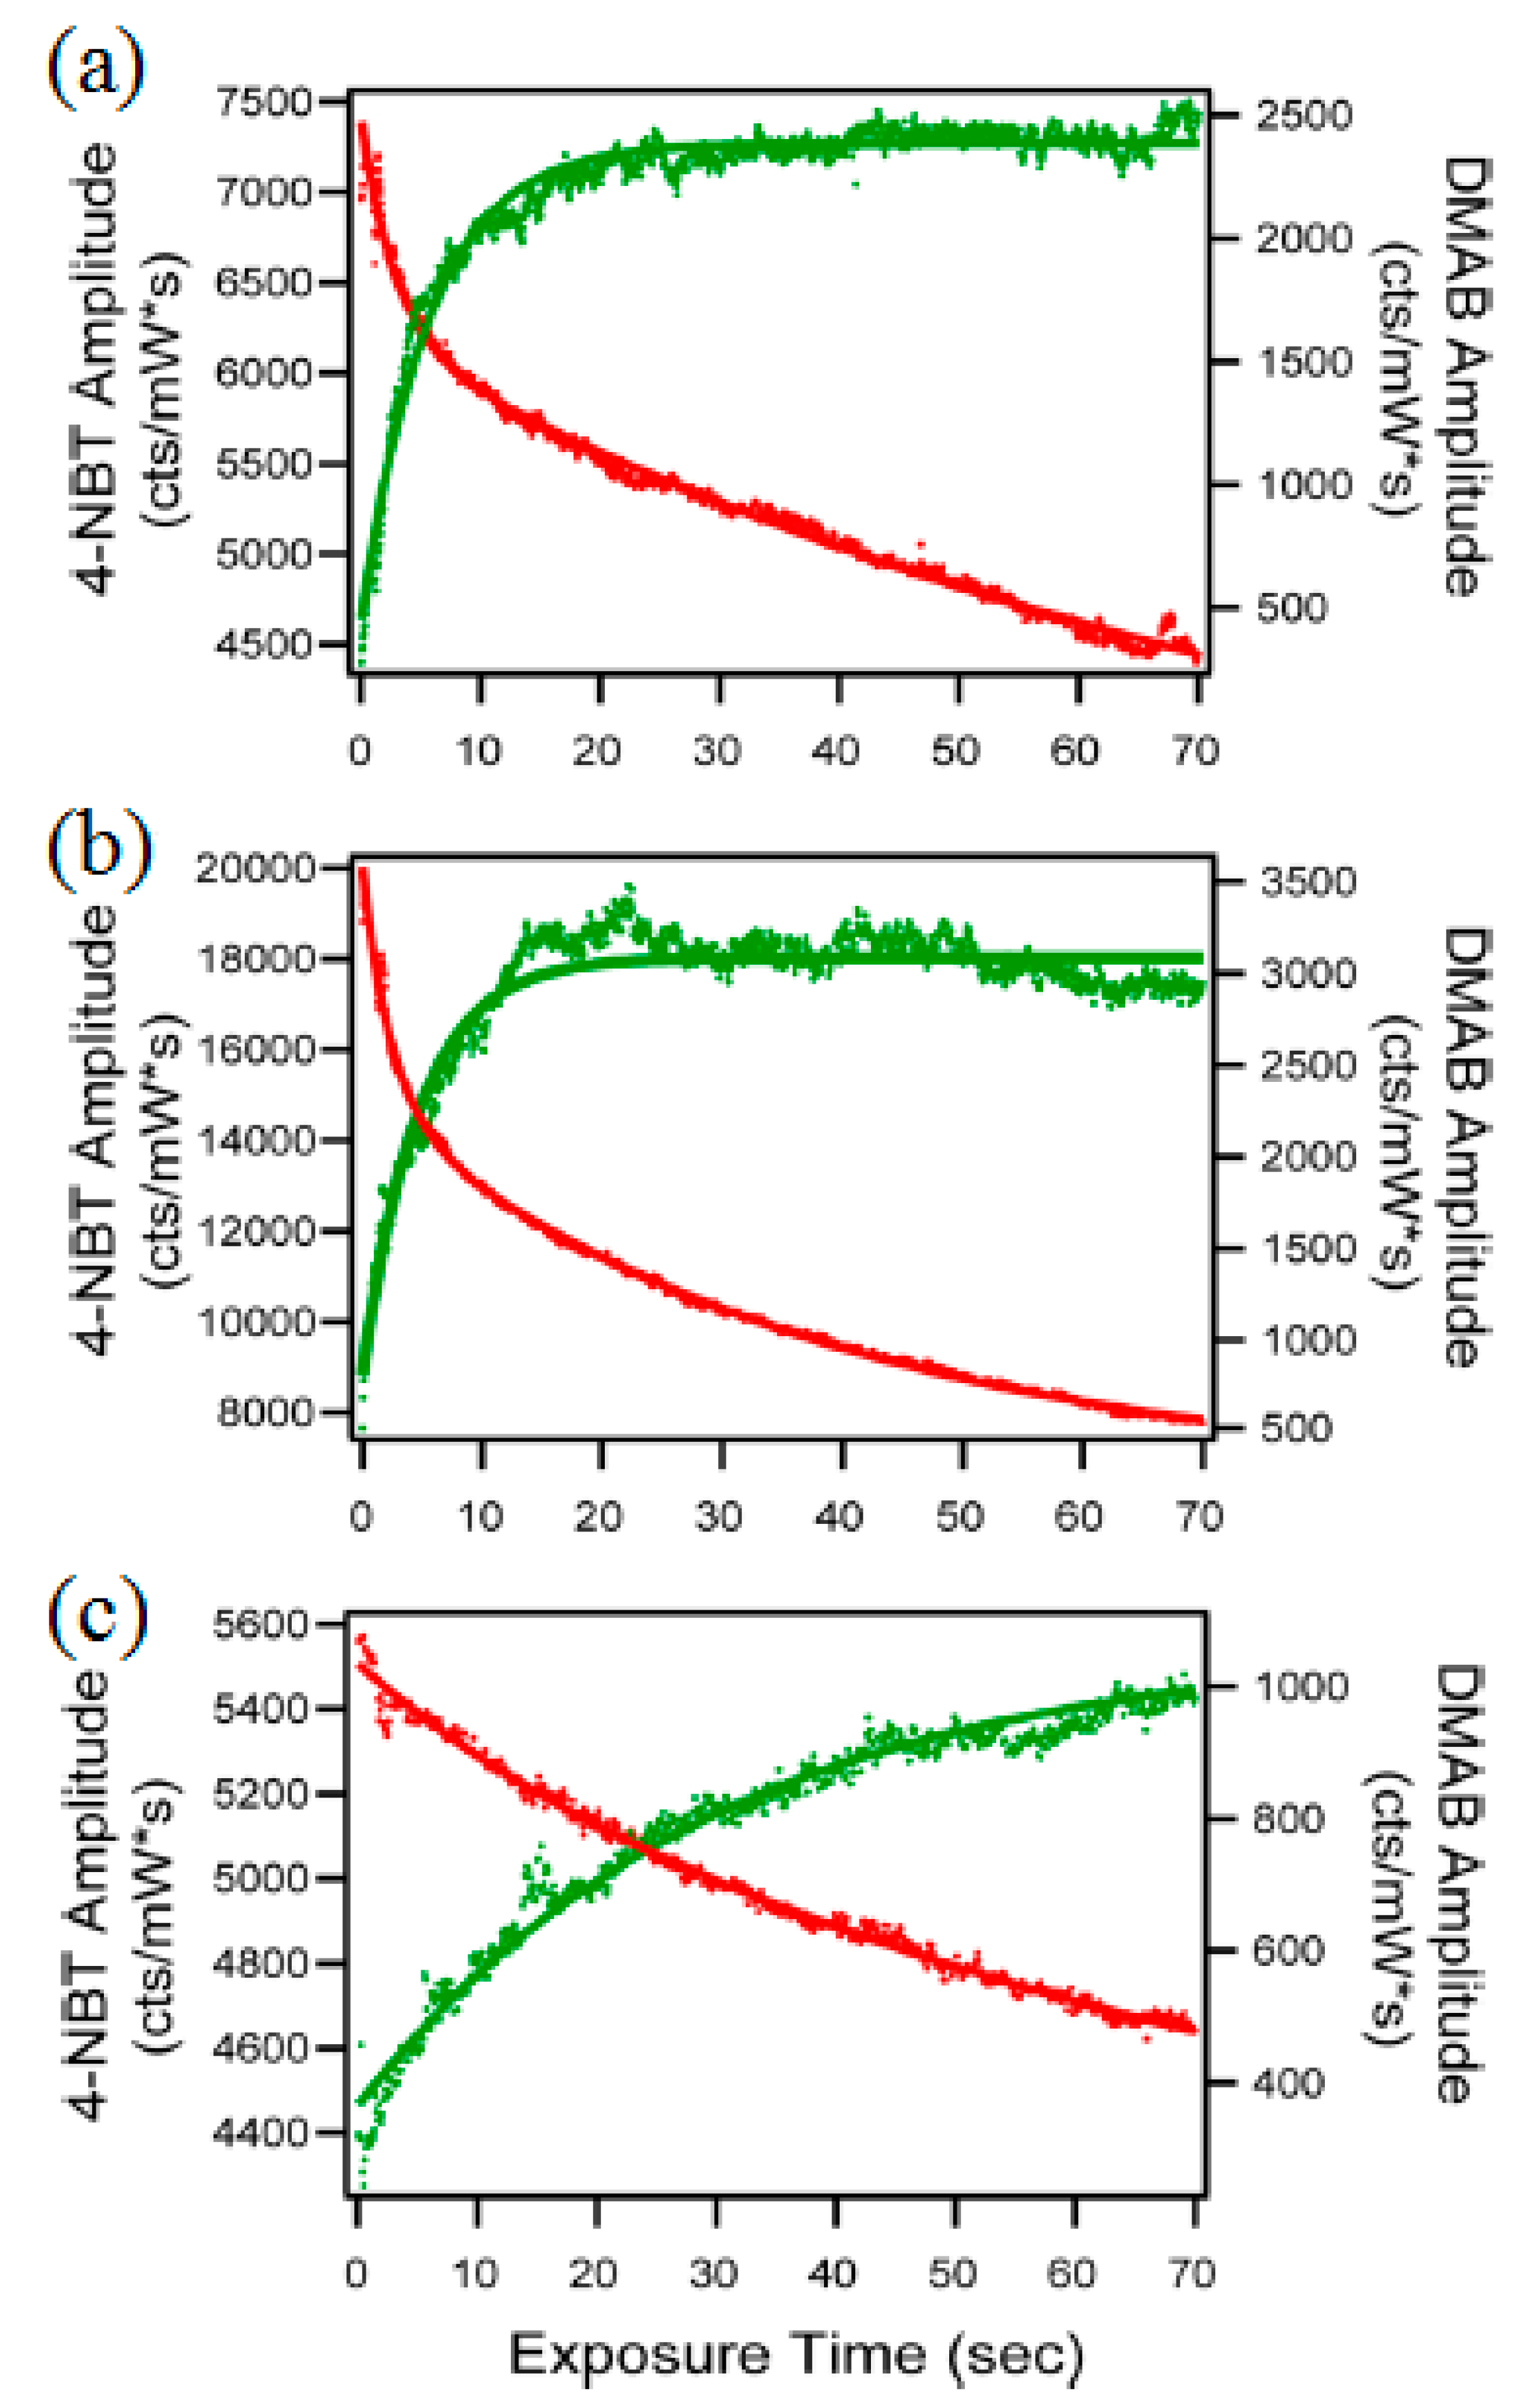
2. Plasmon-Driven Surface Catalysis Reduction Reaction of 4NBT to DMAB

In this section, we focus on the time- and wavelength-dependent plasmon-driven surface catalysis reduction reaction of 4NBT to DMAB on an Au film. Sun et al. conducted some research on Au films and determined whether the rate and yield of the reaction were related to the wavelength of the used laser and the reaction time. In Figure 3a,b, SERS spectra of 4NBT are shown at the junction of an Ag NP on the Au film with the incident wavelength of 514.5 and 632.8 nm, respectively. Studies showed that, when the incident laser had a wavelength of 632.8 nm and the reaction time reached 2.5 h, 4NBT did not convert to DMAB, revealed by the Raman intensity of vs(NO2) on 4NBT. When the wavelength of the incident laser was 632.8 nm, the corresponding local electric-field distribution map of an Ag NP–Au film was as displayed in Figure 4. However, when the incident laser wavelength was 514.5 nm, the Raman signal was hardly detected after 2.5 h, indicating that the Au film was not a reasonable substrate under the condition of a 514.5-nm laser.
Here, the authors proposed a reaction mechanism for a surface catalytic reaction when the 4NBT is transformed into DMAB, as displayed in Figure 5. There are many ways to provide energy for plasmon-driven surface catalytic reactions, such as enhanced thermal surroundings, hot electric transfer, and increased scattering. Here, the authors mainly studied energy supply by hot electrons. This mechanism indicates that the conversion of 4NBT to DMAB requires four electrons, and the required hot electrons were generated by plasmon decay, which had high kinetic energy, and the generated energy could drive the surface catalytic reaction.
By detecting the Raman signals of different incident-laser wavelengths and reaction times, the relationship between the surface catalytic reduction reaction of 4NBT to DMAB and the length of the reaction time was shown. The wavelength of the incident laser was also revealed, thus finding the optimal incident-laser wavelength and reaction time. Therefore, these two factors can be adjusted to promote or inhibit the surface catalytic reduction of 4NBT to DMAB on Au substrates. At the same time, plasmon resonance plays a key role in the surface catalytic reaction, and the energy that drives the reaction is generated by plasmon decay.
In a previous study, control of the degradation reaction of DMAB was achieved, the chemical bond of DMAB was selectively broken using hot electrons as plasmon scissors, and the degradation process was related to various factors, such as pH. The authors controlled the dissociation products by pH, attaching hydrogen ions under acidic conditions to produce PATP. Under alkaline conditions, 4NBT was produced by attaching oxygen ions. In the next section, we present an in-depth discussion on what was more dominant in the synthesis and degradation process under different environmental conditions, as well as what had a higher conversion rate and a faster response rate.

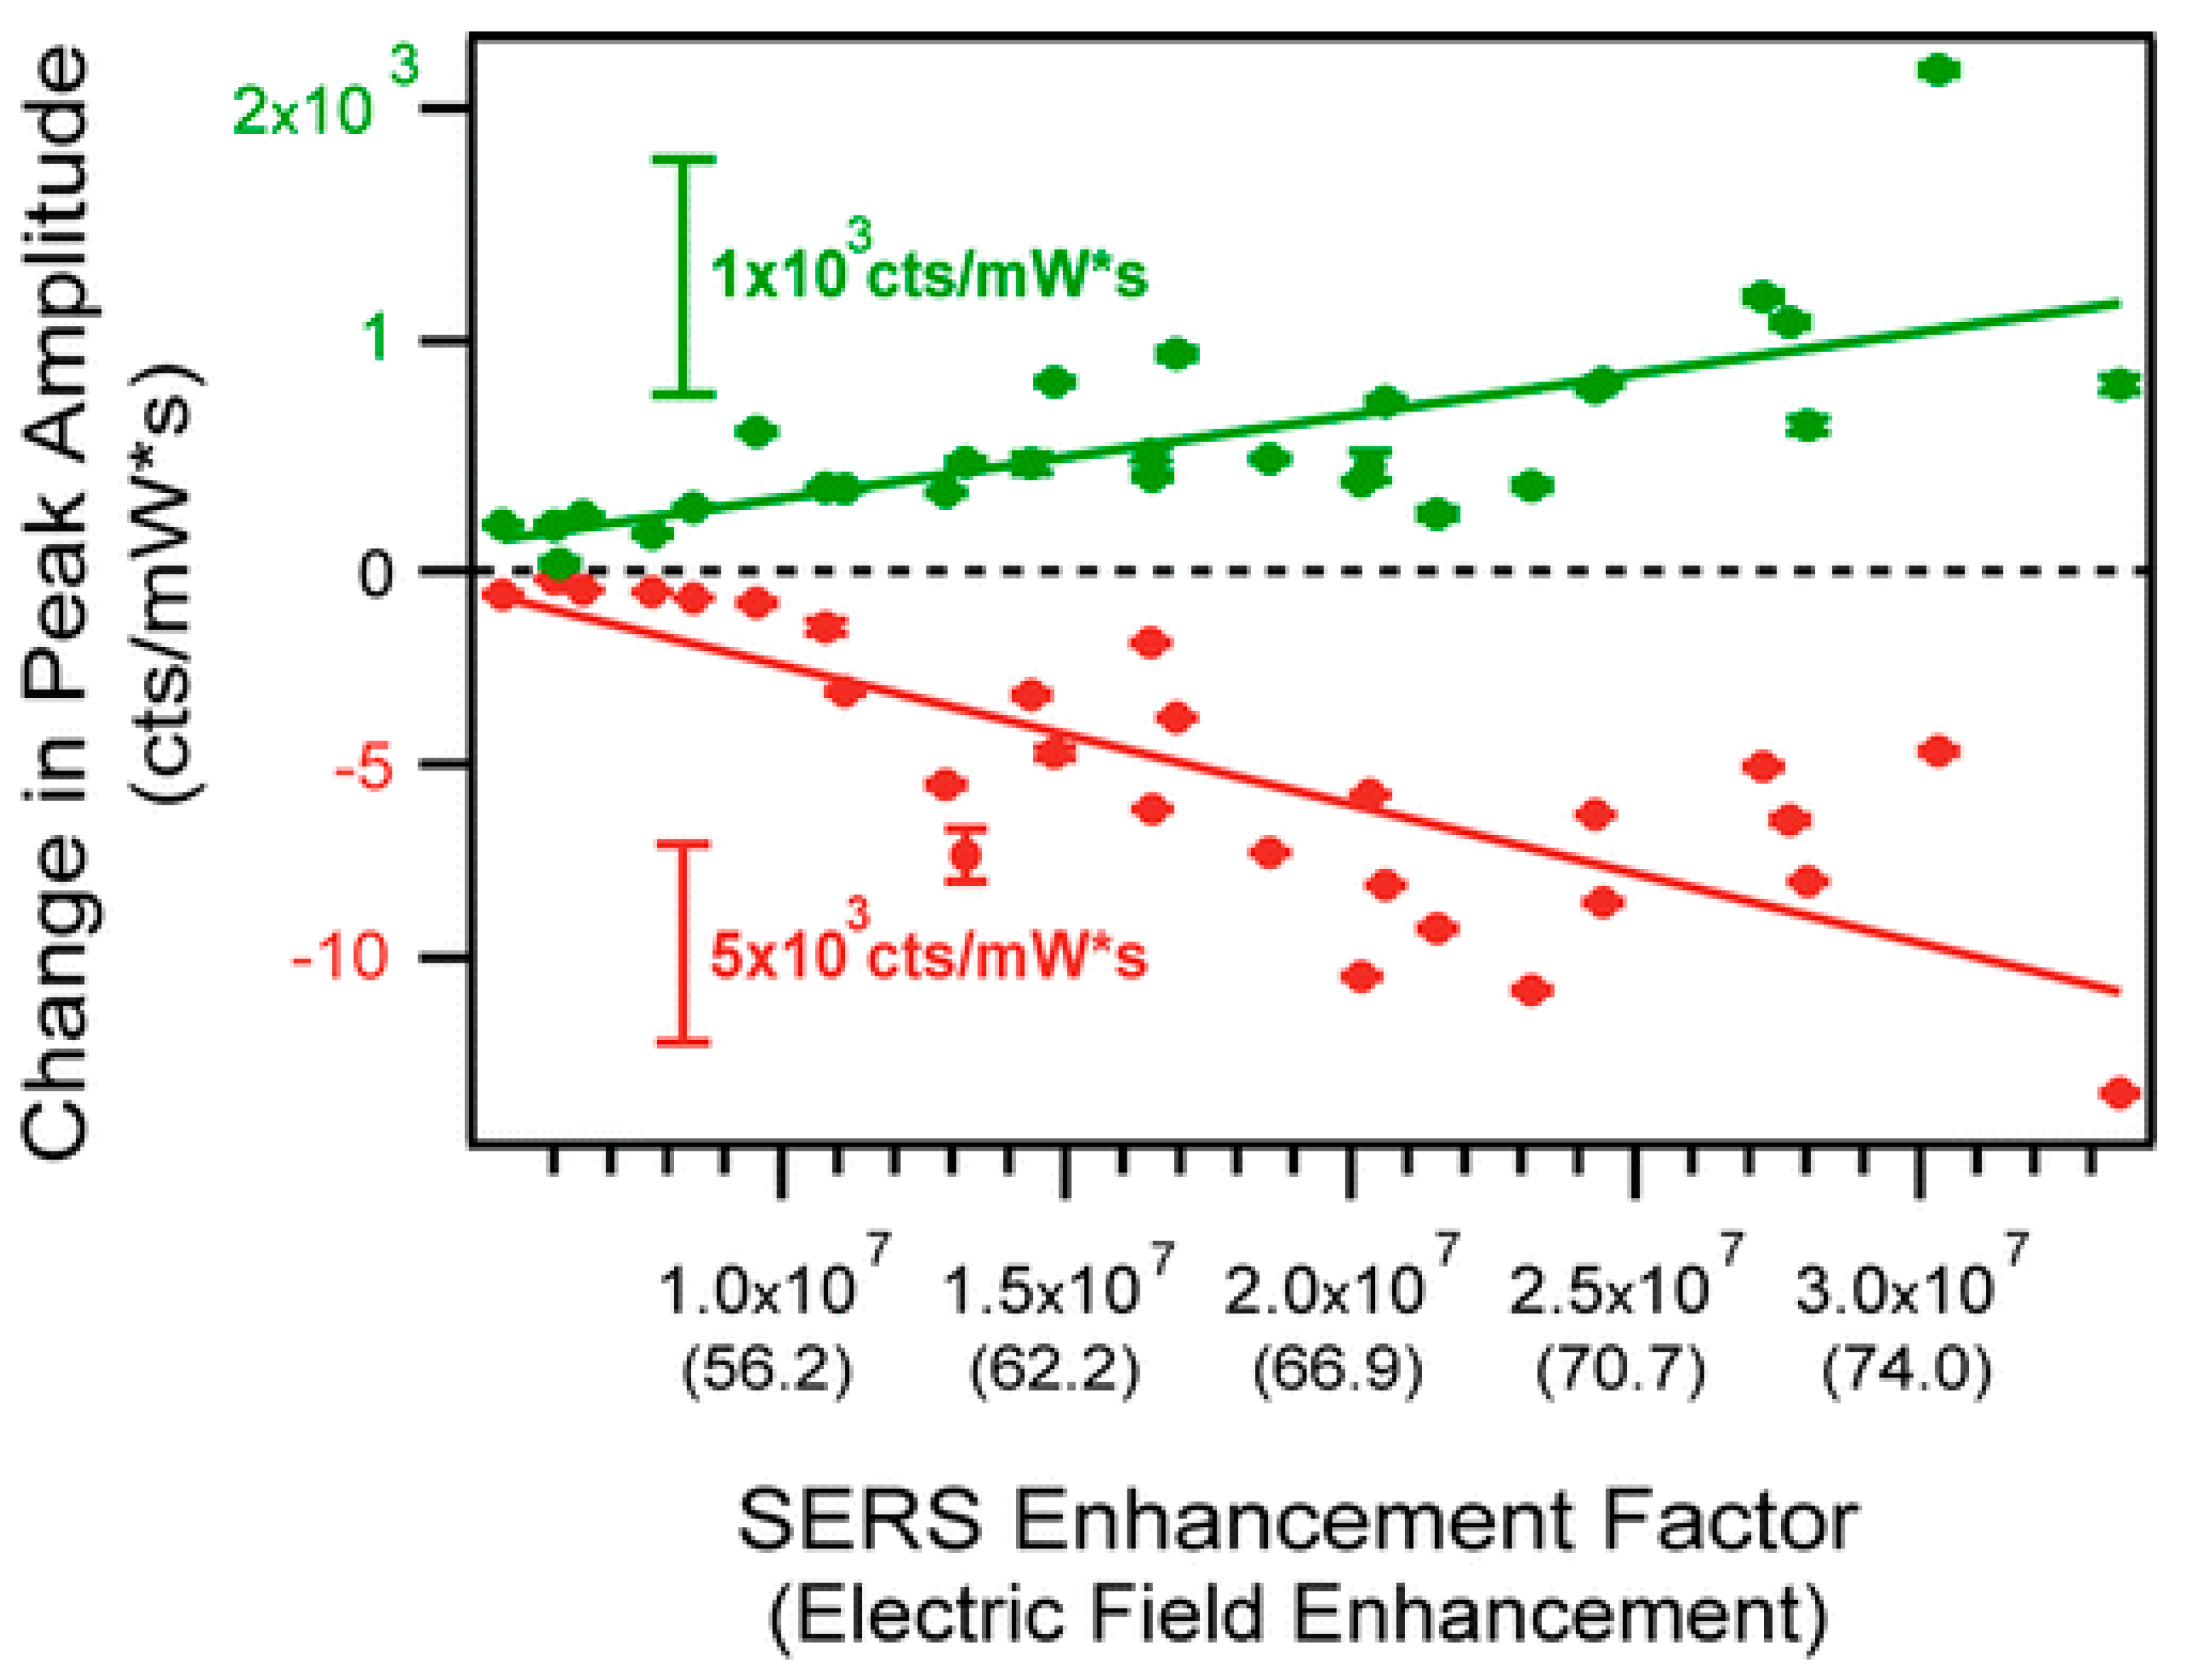
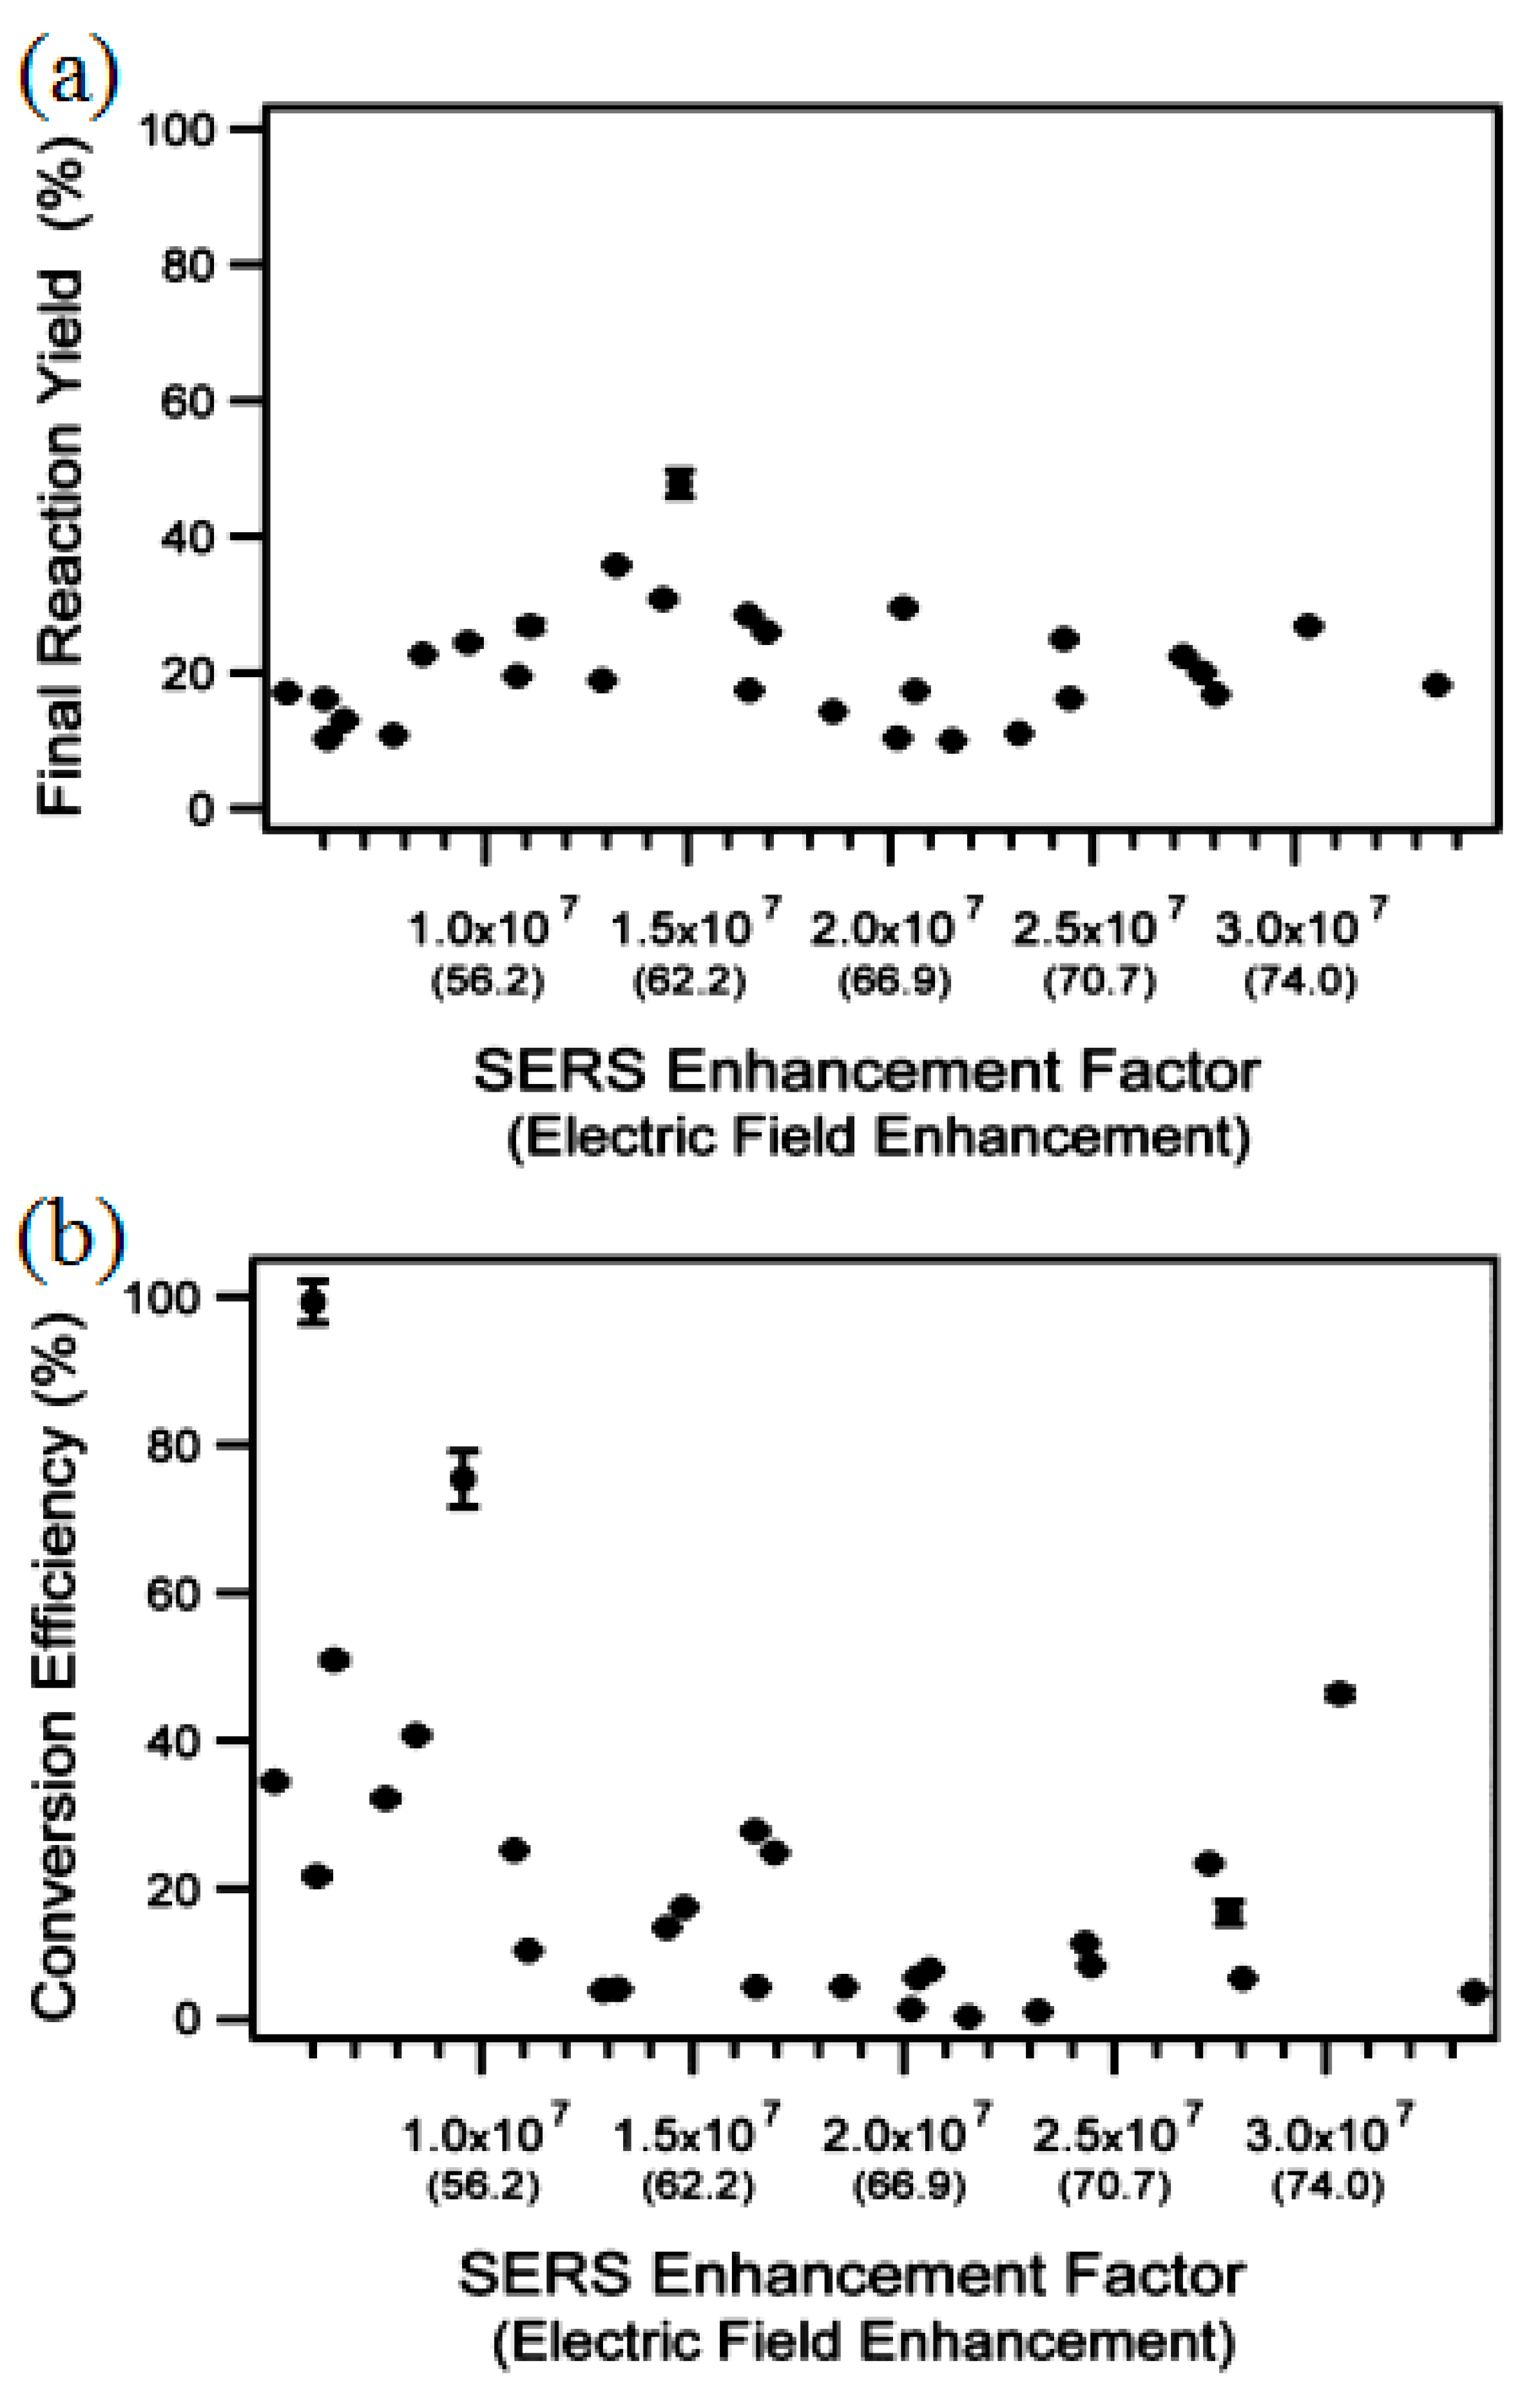
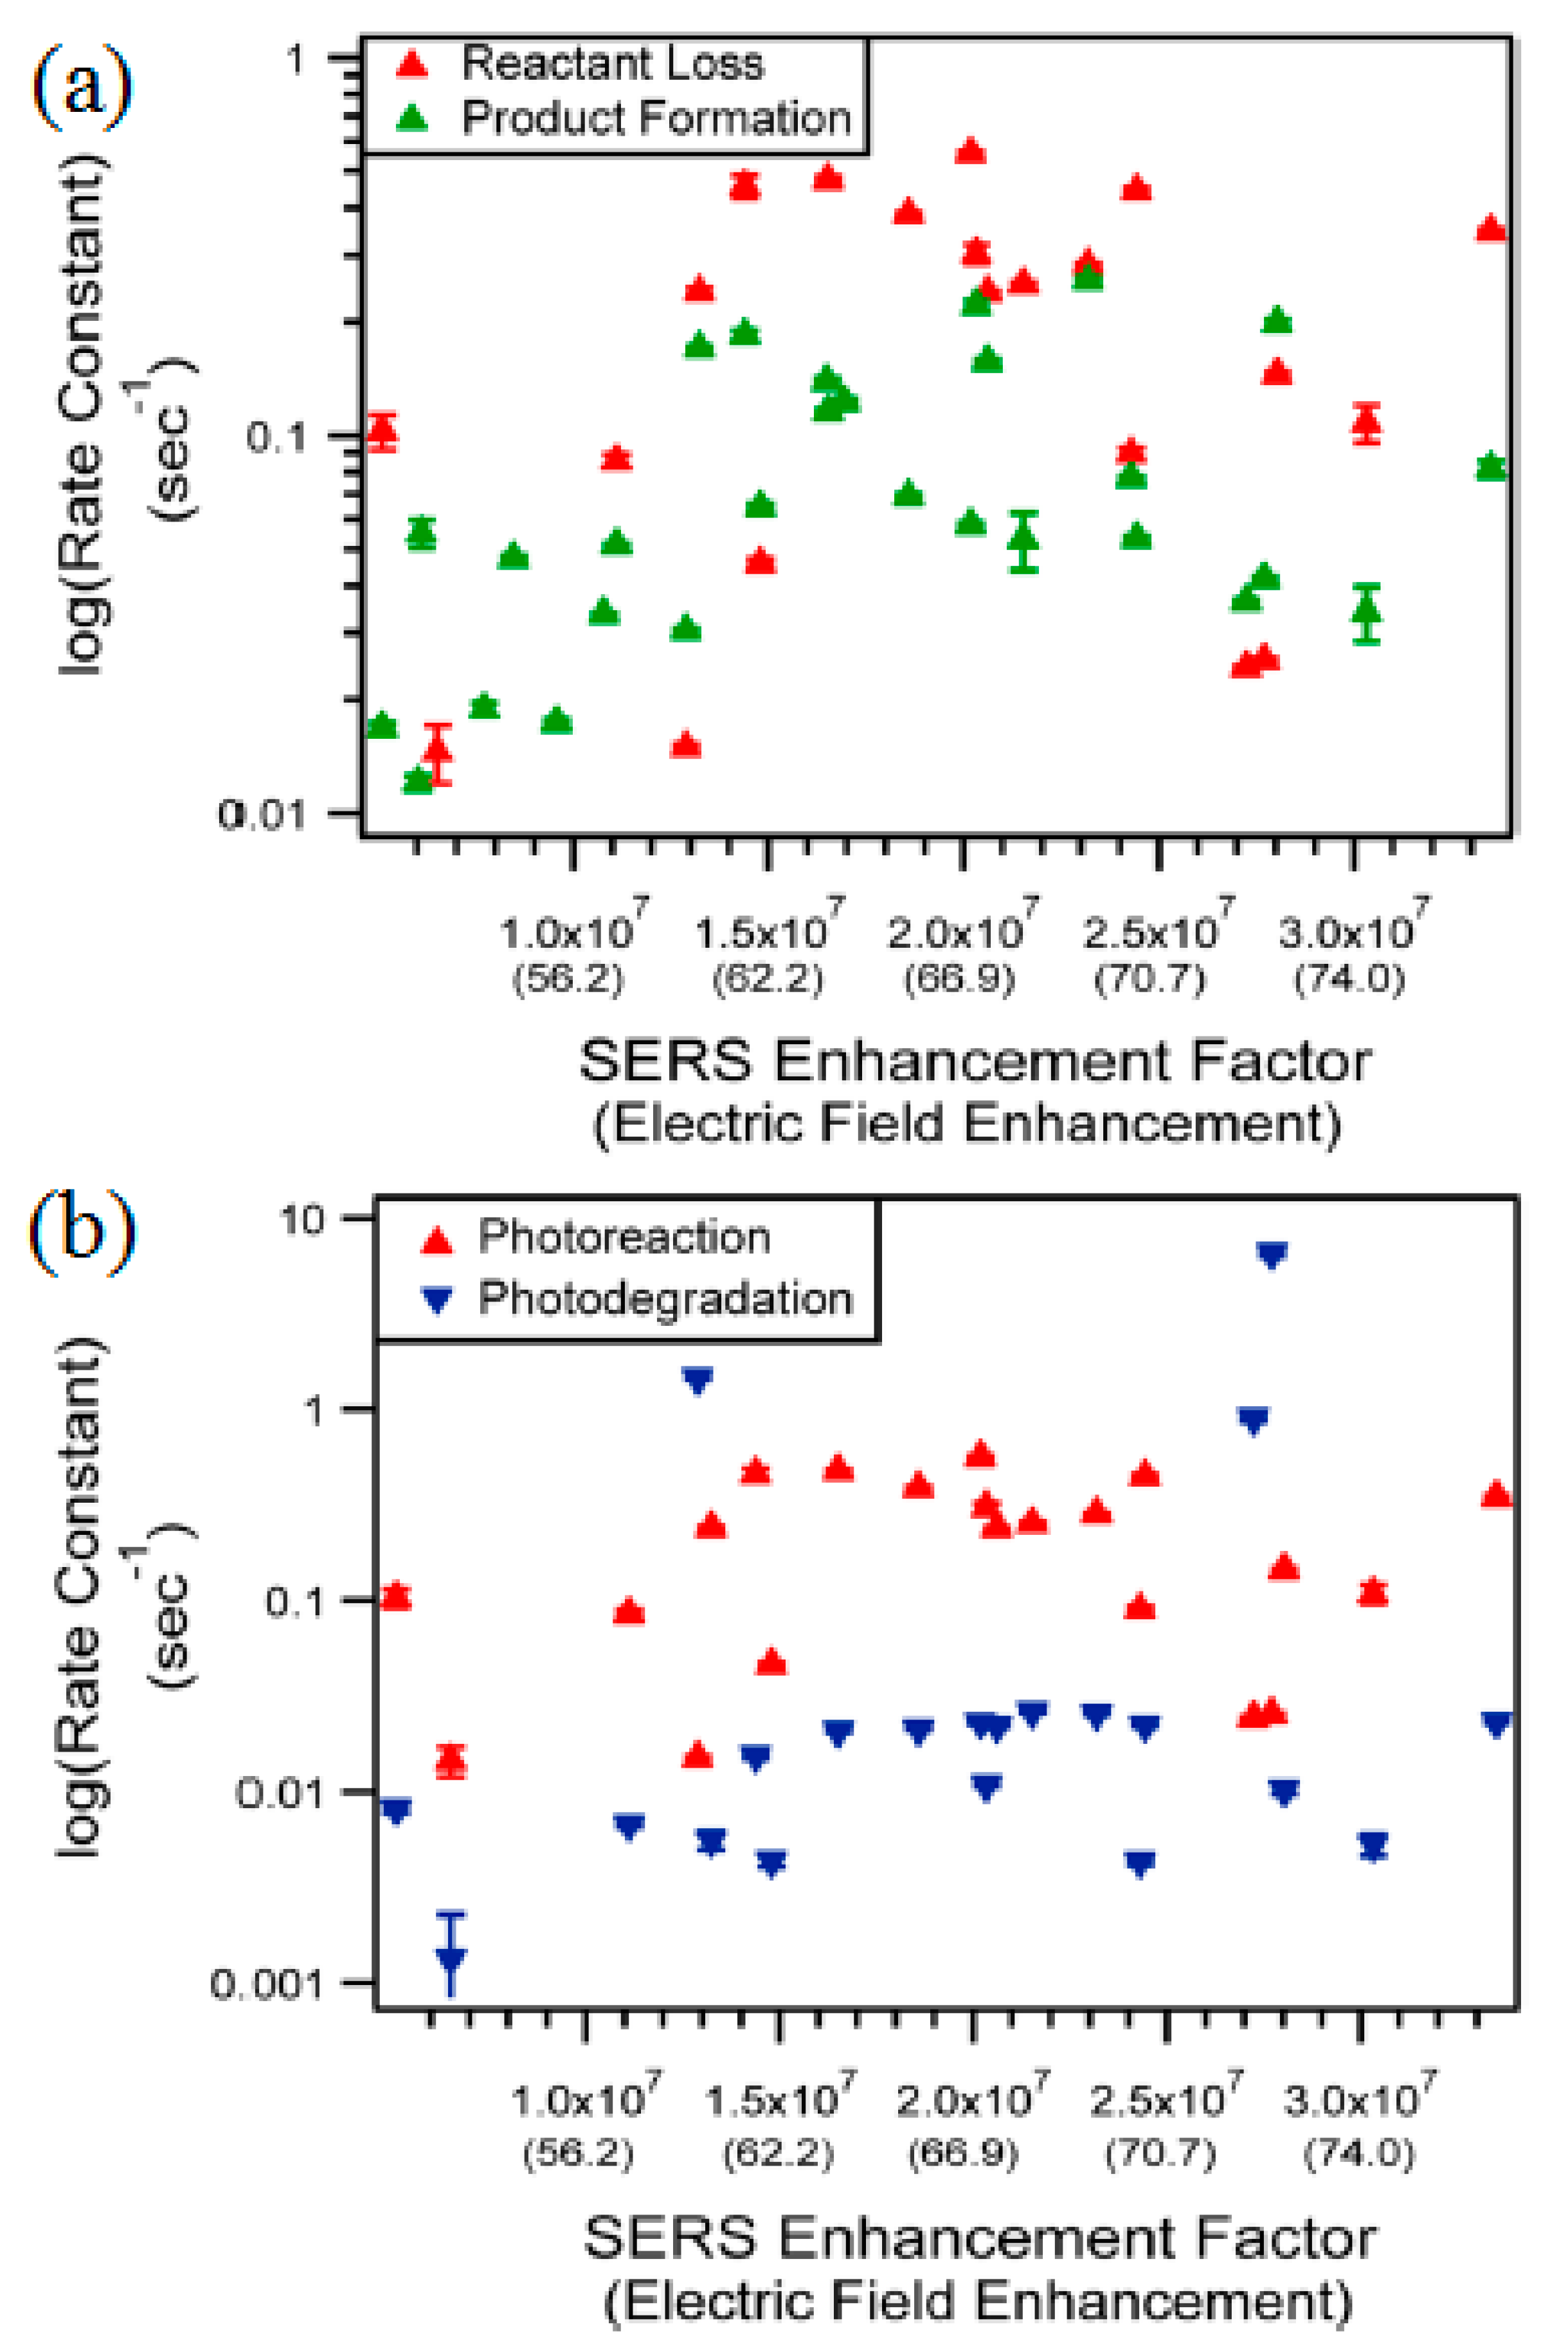
3. Competition between Reaction and Degradation Pathways in Plasmon-Driven Photochemistry of 4NBT to DMAB

Plasmon materials are important for driving photochemical reactions. Previous studies showed that plasmon induced many photochemical reactions, but the corresponding reaction mechanism was not clear. In this section, the plasmon excitation field effect of plasmon excitation to promote the conversion of 4NBT to DMAB was investigated. For this reduction reaction, the increase in DMAB and decrease in 4NBT were related to time [30,31,32].
Plasmon nanostructures significantly contribute to driving photochemical reactions due to the powerful ability of plasmon nanostructures to focus and amplify various spectra [33,34,35,36]. Therefore, plasmon materials often act as a photocatalytic platform for inducing a lot of photochemical reactions. In previous studies, photoreactions were carried out, such as dissociation of H2 [37,38], water decomposition [39,40], and reduction of CO2 to hydrocarbon compounds [41,42]. This proved that plasmon-driven photoreactions have great potential. In this section, the authors used a substrate of Au film over a nanosphere (AuFON) to measure the yield and reaction rate of 4NBT photoreactions. In general, more field enhancement resulted in higher reaction yields. Unfortunately, this conjecture was not proven with the current technology. Studies showed that, for molecular degradation reactions, the reaction yield is highly dependent on electric-field strength.
To calculate the enhancement factor (EF) of each sampling area of the AuFON substrate, the specific relationship could be expressed by the following equation (Brooks, J.L., et al.):
EF = I SERS / N surf I NRS / N vol ,
where I SERS is the Raman intensity of 4NBT when wavenumber position is 1074 cm−1 on the AuFON substrate, and the corresponding Raman intensity in the solution is I NRS . N surf is the number of molecules that are adsorbed onto the substrate of AuFON, and N vol is the number of molecules in the sample collected by normal Raman scattering spectroscopy. The Raman cross-section of cyclohexane and 4NBT was collected in previous experiments [43,44].
The AuFON substrate used here has many advantages because it was spherical, its random variation changed the detected SERS EF, and the resulting value was the enhanced average in the selected region. The authors schematically illustrated the reaction of field-enhancement effects for plasmon-driven photoreaction on 4NBT transfer to DMAB, as shown in Figure 6a. It is shown in Figure 6b that defects in the spherical fill might cause a change in the local surface plasmon resonance (LSPR) of the detection region, thereby increasing/decreasing extinction and widening at the position of the excitation wavelength. In addition, Figure 6b displays the wavelength of the 785-nm laser and the scattering wavelengths of the two important vibration modes detected during the photoreactions [45]. With the red-shift of laser wavelength, the Raman peaks at 1338 and 1433 cm−1 also changed, which revealed the relationship of surface catalytic wavelength reactions.
In Figure 7 [45], we can see the time-resolved Raman spectroscopy of 4NBT plasmon-driven photocatalytic reactions. At the beginning, the vibration pattern appeared at 1338 cm−1, as shown in the red part of the figure, indicating that 4NBT corresponds to NO2 symmetric stretching vibration [46]. During laser irradiation, new Raman peaks appeared at 1140, 1388, and 1434 cm−1, as shown in the green portion of the figure. This demonstrated DMAB generation, but it could be seen from the spectrum that no intermediate was produced. As reaction time increased, the DMAB peak increased and the 4NBT peak decreased. Among them, the Raman peak appearing at a 1434 cm−1 was selected as symbolic of the growth kinetics of the reaction product because the vibration mode of such a peak was found to be a symmetric azo bond in the DMAB spectrum [47]. The authors could calculate the yield and average kinetic energy of the 4NBT-to-DMAB reduction reactions. Here, the authors estimated plasmonic-field enhancement by using SERS enhancement factors (SERS EFs) [48,49]. With the increase in radiation time, the Raman peak at 1338 cm−1 was significantly reduced, while the Raman peak at 1433 cm−1 increased, which demonstrated surface catalytic reactions.
Figure 8 displays the variation in Raman peak amplitude during growth and decay, and plots the SERS EF function. It can be seen from the figure that the amplitude of the Raman peak during the growth process was positive, and the amplitude of the Raman peak corresponding to the attenuation process was negative. Figure 8 displays an amplitude plot of the Raman peaks of the reactants and products as a function of SERS EF. Studies showed that the change in peak amplitude of reactants and products was related to SERS EF. The Raman signal amplitude of the reactants and products increased with the increase of SERS EF when the molecule was bound to the Au surface.
In order to further investigate the difference in reactant reduction and product increase in plasmon excitation reactions, reaction conversion efficiency and yield are proposed here. The reaction yield of the system is shown in Figure 9a, defining the ratio of the ending Raman amplitude of a product to a reactant. In fact, this was the percentage of the number of remaining 4NBT molecules on the surface when reactions were finished. There was no effect on the conversion efficiency of the SERS EF function. In this section, conversion efficiency is defined as the quotient of total product growth to total reactant reduction, where increase or decrease is expressed by the amplitude of the corresponding Raman peak. In contrast to the end-reaction yield, conversion efficiency concentrated on how intensely the reactant signal was lost, rather than recording the end amplitude. It can be observed from Figure 9b that, as the SERS EF increased, conversion efficiency gradually decreased. When the intensity of SERS EF was less than 107, conversion efficiency was between 20% and 100%; when the electric field was enhanced, conversion efficiency was generally low. Figure 9b displays that, when the intensity of the SERS EF was small, for example, less than 107, the conversion rate dropped significantly.
Since the ability of the AuFON substrate was significantly improved, a large amount of the product could quickly be collected at the beginning; thus, the authors focused on average reaction kinetics. Figure 10 displays three independent kinetic measurements of the plasmon-induced reactions of 4NBT to DMAB, with different local field enhancements. Comparing Figure 10a–c, it can be seen that the resulting kinetics vary extensively in different areas of the substrate. Furthermore, in Figure 10a,b, product growth increased significantly within 10 s before the reactions, as indicated by the broken green line. In Figure 10c, we can see that the product was produced at a slower rate. It is, therefore, concluded that there was significant loss of reactant signal during product formation.
From Figure 10a,b, it can be found that 4NBT amplitude gradually decreased, and a strange phenomenon occurred after reactions proceeded for approximately 30 s. The 4NBT amplitude quickly decreased, but the DMAB amplitude was substantially unchanged. As demonstrated in Figure 10b, the authors detected minor decrease in the signal of DMAB amplitude, indicating a similar degradation-reaction process. However, it can be seen in Figure 10c that 4NBT signal amplitude did not significantly decrease, and exhibited a lower mean field enhancement. In this region, the rate of 4NBT reduction was very slow and consistent with DMAB product-formation kinetics.
Figure 11a displays the relationship between the photoreaction rate constant and the field enhancement. This was achieved by measuring product increase and reactant reduction. In general, the rate constant for reactant loss was generally higher compared to the rate constant of product increase, although the two constants were independent of the SERS EF. Thus, the rate-limiting stage of the photoconversion of the 4NBT molecule to DMAB reduction was independent of plasmon-field enhancement. In addition, the hydration layer was the root cause of the difference in photoreaction rate constants of the reactants and product. Studies showed that, in order for the reaction to better proceed, the nitro 4NBT group should be reduced, and protonation is needed to produce reaction intermediates [50,51,52,53,54]. In addition, the protons that came from the hydration layer on the Au surface were needed to limit the photoreaction rate [35,36,37,38,39].
Figure 11b displays the relationship between the rate constant of 4NBT degradation and photoreactions and field enhancement. Similarly, there was no significant relationship between field enhancement and rate constant for the scope of observed SERS EFs. Studies showed that, for other detection areas, the photoreaction rate constant was significantly higher than the degradation rate constant. This indicated that the reaction process was generally much quicker than degradation, which resulted in loss of light due to prolonged light exposure.

4. Conclusions

In this review, we described plasmon catalyzed applications, such as plasmon-driven dissociations of hydrogen, nitrogen, water, and carbon dioxide. Photoreaction and degradation processes dominated under different environmental conditions. Therefore, in order to improve the rate of plasmon-driven processes for different chemical reactions, we should carefully consider a variety of photoinduced correlation rates.
In this work, we briefly introduced two ways to synthesize DMAB, and studied the photosynthetic reduction reaction and degradation process of 4NBT to DMAB, as well as the competitive relationship between reaction and degradation pathways. Note that the rate constant during competition is important because the degradation effect is usually more pronounced in a high field-enhancement region. The photosynthetic reaction was faster than the degradation process. However, in all regions, reactants were continuously reduced due to the progress of the degradation reaction, so a method of optimizing the process is to cause the photosynthetic reaction to occur before the degradation reaction, which effectively avoids the above problems.
In the future, plasmon–exciton interaction can promote efficiency and probability for plasmon-driven chemical reactions. Detailed information can be obtained from References [8,14,18,19,53,54,55].

Author Contributions

Resources, J.W.; data curation, Z.G. and J.J.; writing—original draft preparation, Z.G. and J.J.; writing—review and editing, Z.G. and J.W.; supervision, J.W.; project administration, J.W.; funding acquisition, J.W.

Funding

This work was supported by the National Nature Science Foundation of China (Grant No. 91436102, 11374353), the Fundamental Research Funds for the Central Universities, and the Talent Scientific Research Fund of LSHU (No. 6008).

Conflicts of Interest

The authors declare no conflicts of interest.

References

  1. Sun, M.; Zhang, Z.; Wang, P.; Li, Q.; Ma, F.; Xu, H. Remotely excited Raman optical activity using chiral plasmon propagation in Ag nanowires. Light Sci. Appl. 2013, 2, e112. [Google Scholar] [CrossRef]
  2. Quan, J.; Cao, E.; Mu, X.; Sun, M. Surface catalytic reaction driven by plasmonic waveguide. Appl. Mater. Today 2018, 11, 50–56. [Google Scholar] [CrossRef]
  3. Fang, Y.; Zhang, Z.; Sun, M. High vacuum tip-enhanced Raman spectroscope based on a scanning tunneling microscope. Rev. Sci. Instrum. 2016, 87, 033104. [Google Scholar] [CrossRef] [PubMed]
  4. Wang, J.; Qiao, W.; Mu, X. Au Tip-Enhanced Raman Spectroscopy for Catalysis. Appl. Sci. 2018, 8, 2026. [Google Scholar] [CrossRef]
  5. Lin, W.; Ren, X.; Cui, L.; Zong, H.; Sun, M. Electro-optical tuning of plasmon-driven double reduction interface catalysis. Appl. Mater. Today 2018, 11, 189–192. [Google Scholar] [CrossRef]
  6. Lin, W.; Xu, X.; Quan, J.; Sun, M. Propagating surface plasmon polaritons for remote excitation surface-enhanced Raman scattering spectroscopy. Appl. Spectrosc. Rev. 2018, 53, 771–782. [Google Scholar] [CrossRef]
  7. Cao, E.; Lin, W.; Sun, M.; Liang, W.; Song, Y. Exciton-plasmon coupling interactions: From principle to applications. Nanophotonics 2018, 7, 145–167. [Google Scholar] [CrossRef]
  8. Liu, W.; Lin, W.; Zhao, H.; Wang, P.; Sun, M. The nature of plasmon-exciton codriven surface catalytic reaction. J. Raman Spectrosc. 2017, 49, 383–387. [Google Scholar] [CrossRef]
  9. Zhang, Z.; Sheng, S.; Wang, R.; Sun, M. Tip-Enhanced Raman Spectroscopy. Anal. Chem. 2016, 88, 9328–9346. [Google Scholar] [CrossRef]
  10. Wang, X.; Cao, E.; Zong, H.; Sun, M. Plasmonic electrons enhanced resonance Raman scattering (EERRS) and electrons enhanced fluorescence (EEF) spectra. Appl. Mater. Today 2018, 13, 298–302. [Google Scholar] [CrossRef]
  11. Sun, M.T.; Xu, H.X. A novel application of plasmonics: Plasmon-driven surface-catalyzed reactions. Small 2012, 8, 2777–2786. [Google Scholar] [CrossRef] [PubMed]
  12. Wang, J.; Mu, X.; Wang, X.; Wang, N.; Ma, F.; Liang, W.; Sun, M. The thermal and thermoelectric properties of in-plane C-BN hybrid structures and graphene/h-BN van der Waals heterostructures. Mater. Today Phys. 2018, 5, 29–57. [Google Scholar] [CrossRef]
  13. Li, R.; Zhang, Y.; Xu, X.; Zhou, Y.; Chen, M.; Sun, M. Optical characterizations of two-dimensional materials using nonlinear optical microscopies of CARS, TPEF, and SHG. Nanophotonics 2018, 7, 873–881. [Google Scholar] [CrossRef] [Green Version]
  14. Lin, W.; Cao, Y.; Wang, P.; Sun, M. Unified treatment for plasmon-exciton co-driven reduction and oxidation reactions. Langmuir 2017, 33, 12102–12107. [Google Scholar] [CrossRef] [PubMed]
  15. Ding, Q.; Li, R.; Chen, M.; Sun, M. Ag nanoparticles-TiO2 film hybrid for plasmon-exciton co-driven surface catalytic reactions. Appl. Mater. Today 2017, 9, 251–258. [Google Scholar] [CrossRef]
  16. Fang, Y.; Li, Y.; Xu, H.; Sun, M. Ascertaining p,p-dimercaptoazobenzene produced from p-aminothiophenol by selective catalytic coupling reaction on silver nanoparticles. Langmuir 2010, 26, 7737–7746. [Google Scholar] [CrossRef] [PubMed]
  17. Li, P.; Ma, B.; Yang, L.; Liu, J. Hybrid single nanoreactor for in situ SERS monitoring of plasmon-driven and small Au nanoparticles catalyzed reactions. Chem. Commun. 2015, 51, 11394–11397. [Google Scholar] [CrossRef]
  18. Cao, E.; Guo, X.; Zhang, L.; Shi, Y.; Lin, W.; Liu, X.; Fang, Y.; Zhou, L.; Sun, Y.; Song, Y.; et al. Electroopical synergy on plasmon-exciton-codriven surface reduction reactions. Adv. Mater. Interfaces 2017, 4, 1700869. [Google Scholar] [CrossRef]
  19. Lin, W.; Cao, E.; Zhang, L.; Xu, X.; Song, Y.; Liang, W.; Sun, M. Electrically enhanced hot hole driven oxidation catalysis at the interface of a plasmon-exciton hybrid. Nanoscale 2018, 10, 5482–5488. [Google Scholar] [CrossRef]
  20. Sun, M.; Zhang, Z.; Zheng, H.; Xu, H. In-situ plasmon-driven chemical reactions revealed by high vacuum tip-enhanced Raman spectroscopy. Sci. Rep. 2013, 2, 647. [Google Scholar] [CrossRef]
  21. Choi, H.K.; Shon, H.K.; Yu, H.; Lee, T.G.; Kim, Z.H. b2 Peaks in SERS Spectra of 4-Aminobenzenethiol: A Photochemical artifact or a real chemical enhancement? J. Phys. Chem. Lett. 2013, 4, 1079–1086. [Google Scholar] [CrossRef] [PubMed]
  22. Sun, M.; Fang, Y.; Zhang, Z.; Xu, H. Activated vibrational modes and Fermi resonance in tip-enhanced Raman spectroscopy. Phys. Rev. E 2013, 87, 020401. [Google Scholar] [CrossRef] [PubMed]
  23. Van Schrojenstein Lantman, E.M.; Deckert-Gaudig, T.; Mank, A.J.; Deckert, V.; Weckhuysen, B.M. Catalytic processes monitored at the nanoscale with tip-enhanced Raman spectroscopy. Nat. Nanotechnol. 2012, 7, 583–586. [Google Scholar] [CrossRef] [PubMed]
  24. Xie, W.; Walkenfort, B.; Schiucker, S. Label-free SERS monitoring of chemical reactions catalyzed by small gold nanoparticles using 3D plasmonic superstructures. J. Am. Chem. Soc. 2013, 135, 1657–1660. [Google Scholar] [CrossRef] [PubMed]
  25. Kim, K.; Choi, J.Y.; Shin, K.S. Photoreduction of 4-nitrobenzenethiol on Au by hot electrons plasmonically generated from Ag nanoparticles: Gap-mode surface-enhanced Raman scattering observation. J. Phys. Chem. C 2015, 119, 5187–5194. [Google Scholar] [CrossRef]
  26. Lee, S.J.; Kim, K. Surface-induced photoreaction of 4-nitrobenzenethiol on silver: Influence of SERS-active sites. Chem. Phys. Lett. 2003, 378, 122–127. [Google Scholar] [CrossRef]
  27. Shin, K.S.; Lee, H.S.; Joo, S.W.; Kim, K. Surface-induced photoreduction of 4-nitrobenzenethiol on Cu revealed by surface enhanced Raman scattering spectroscopy. J. Phys. Chem. C 2007, 111, 15223–15227. [Google Scholar] [CrossRef]
  28. Mia, X.; Wang, Y.; Li, R.; Sun, M.; Zhang, Z.; Zheng, H. Multiple surface plasmon resonances enhanced nonlinear optical microscopy. Nanophotonics 2019, 8. [Google Scholar] [CrossRef]
  29. Dong, B.; Fang, Y.; Chen, X.; Xu, H.; Sun, M. Substrate-, wavelength-, and time-dependent plasmon-assisted surface catalysis reactions of 4-nitrobenzenethiol dimerizing to p,p′-dimercaptoazobenzene on Au, Ag, and Cu films. Langmuir 2011, 27, 10677–10682. [Google Scholar] [CrossRef]
  30. Kim, K.; Kim, K.L.; Shin, K.S. Photoreduction of 4,4′-dimercaptoazobenzene on Ag revealed by Raman scattering spectroscopy. Langmuir 2013, 29, 183–190. [Google Scholar] [CrossRef]
  31. Zhang, Z.; Xu, P.; Yang, X.; Liang, W.; Sun, M. Surface plasmon-driven photocatalysis in ambient, aqueous and high-vacuum monitored by SERS and TERS. J. Photochem. Photobiol. C Photochem. Rev. 2016, 27, 100–112. [Google Scholar] [CrossRef]
  32. Zhang, Q.; Wang, H. Facet-dependent catalytic activities of Au nanoparticles enclosed by high-index facets. ACS Catal. 2014, 4, 4027–4033. [Google Scholar] [CrossRef]
  33. Brongersma, M.L.; Halas, N.J.; Nordlander, P. Plasmon-induced hot carrier science and technology. Nat. Nanotechnol. 2015, 10, 25–34. [Google Scholar] [CrossRef] [PubMed]
  34. Xu, X.; Shi, Y.; Liu, X.; Sun, M. Femtosecond dynamics of monolayer MoS2-Ag nanoparticles hybrid probed at 532 nm. Chem. Phys. Lett. 2018, 692, 208–213. [Google Scholar]
  35. Hou, W.; Cronin, S.B. A review of surface plasmon resonance-enhanced photocatalysis. Adv. Funct. Mater. 2013, 23, 1612–1619. [Google Scholar] [CrossRef]
  36. Lin, W.; Shi, Y.; Yang, X.; Li, J.; Cao, E.; Xu, X.; Pullerits, T.; Liang, W.; Sun, M. Physical mechanism on exciton-plasmon coupling revealed by femtosecond pump-probe transient absorption spectroscopy. Mater. Today Phys. 2017, 3, 33–40. [Google Scholar] [CrossRef]
  37. Mukherjee, S.; Libisch, F.; Large, N.; Neumann, O.; Brown, L.V.; Cheng, J.; Lassiter, J.B.; Carter, E.A.; Nordlander, P.; Halas, N.J. Hot electrons do the impossible: Plasmon-induced dissociation of H2 on Au. Nano Lett. 2013, 13, 240–247. [Google Scholar] [CrossRef] [PubMed]
  38. Amenomiya, Y. Adsorption of hydrogen and H2-D2 exchange reaction on alumina. J. Catal. 1971, 22, 109–122. [Google Scholar] [CrossRef]
  39. Mubeen, S.; Lee, J.; Singh, N.; Kramer, S.; Stucky, G.D.; Moskovits, M. An autonomous photosynthetic device in which all charge carriers derive from surface plasmons. Nat. Nanotechnol. 2013, 8, 247–251. [Google Scholar] [CrossRef]
  40. Liu, Z.; Hou, W.; Pavaskar, P.; Aykol, M.; Cronin, S.B. Plasmon resonant enhancement of photocatalytic water splitting under visible illumination. Nano Lett. 2011, 11, 111–1116. [Google Scholar] [CrossRef]
  41. Hou, W.; Hung, W.H.; Pavaskar, P.; Goeppert, A.; Aykol, M.; Cronin, S.B. Photocatalytic conversion of CO2 to hydrocarbon fuels via plasmon-enhanced absorption and metallic interband transitions. ACS Catal. 2011, 1, 929–936. [Google Scholar] [CrossRef]
  42. Kleinman, S.L.; Frontiera, R.R.; Henry, A.L.; Dieringer, J.A.; Van Duyne, R.P. Characterizing, and controlling chemistry with SERS hot spots. Phys. Chem. Chem. Phys. 2013, 15, 21–36. [Google Scholar] [CrossRef] [PubMed]
  43. Valley, N.; Greeneltch, N.; Van Duyne, R.P.; Schatz, G.C. A look at the origin and magnitude of the chemical contribution to the enhancement mechanism of surface-enhanced Raman spectroscopy (SERS): Theory and experiment. J. Phys. Chem. Lett. 2013, 4, 2599–2604. [Google Scholar] [CrossRef]
  44. Mccreery, R.L. Raman Spectroscopy for Chemical Analysis; Wiley-Interscience: New York, NY, USA, 2000. [Google Scholar]
  45. Brooks, J.L.; Frontiera, R.R. Competition between reactions and degradation pathways in plasmon-driven photochemistry. J. Phys. Chem. C 2016, 120, 20869–20876. [Google Scholar] [CrossRef]
  46. Skadtchenko, B.O.; Aroca, R. Surface-enhanced Raman scattering of p-nitrothiophenol. Spectrochim. Acta Part A 2001, 57, 1009–1016. [Google Scholar] [CrossRef]
  47. Kim, K.; Shin, D.; Kim, K.L.; Shin, K.S. Surface-enhanced Raman scattering of 4,4′-dimercaptoazobenzene trapped in Au nanogaps. Phys. Chem. Chem. Phys. 2012, 14, 4095–4100. [Google Scholar] [CrossRef]
  48. Hao, E.; Schatz, G.C. Electromagnetic fields around silver nanoparticles and dimers. J. Chem. Phys. 2004, 120, 357–366. [Google Scholar] [CrossRef]
  49. Stranahan, S.M.; Willets, K.A. Super-resolution optical imaging of single-molecule SERS hot spots. Nano Lett. 2010, 10, 3777–3784. [Google Scholar] [CrossRef]
  50. Xu, P.; Kang, L.; Mack, N.H.; Schanze, K.S.; Han, X.; Wang, H.L. Mechanistic understanding of surface plasmon assisted catalysis on a single particle: Cyclic redox of 4-aminothiophenol. Sci. Rep. 2013, 3, 2997. [Google Scholar] [CrossRef]
  51. Dong, B.; Fang, Y.R.; Xia, L.; Xu, H.X.; Sun, M.T. Is 4-nitrobenzenethiol converted to p,p′-dimercaptoazobenzene or 4-aminothiophenol by surface photochemistry reaction? J. Raman Spectrosc. 2011, 42, 1205–1206. [Google Scholar] [CrossRef]
  52. Wang, J.; Wang, X.; Mu, X. Plasmonic Photocatalysts Monitored by Tip-Enhanced Raman Spectroscopy. Catalysts 2019, 9, 109. [Google Scholar] [CrossRef]
  53. Wang, J.; Lin, W.; Xu, X.; Ma, F.; Sun, M. Plasmon-Exciton Coupling Interaction for Surface Catalytic Reactions. Chem. Rec. 2018, 18, 481–490. [Google Scholar] [CrossRef] [PubMed]
  54. Wang, J.; Feng, N.; Sun, Y.; Mu, X. Nanoplasmon–Semiconductor Hybrid for Interface Catalysis. Catalysts 2018, 8, 429. [Google Scholar] [CrossRef]
  55. Cao, E.; Sun, M.; Song, Y.; Liang, W. Exciton-plasmon hybrids for surface catalysis detected by SERS. Nanotechnology 2018, 29, 372001. [Google Scholar] [CrossRef] [PubMed]
Figure 1. Chemical structures of (a) 4,4′-dimercaptoazobenzene (DMAB), and (b) 4-nitrobenzenethiol (4NBT) [28].
Catalysts 09 00193 g001
Figure 2. Atomic force microscopy (AFM) images of the (a) Au, (b) Ag, and (c) Cu films [29].
Catalysts 09 00193 g002
Figure 3. Surface-enhanced Raman scattering (SERS) spectra of 4NBT at the junction of an Ag nanoparticle (NP) on the Au film at incident wavelengths of (a) 514.5 nm and (b) 632.8 nm [29].
Catalysts 09 00193 g003
Figure 4. Ag NP–Au film at an incident wavelength of 632.8 nm [29].
Catalysts 09 00193 g004
Figure 5. Mechanism of plasmon-assisted surface-catalyzed reaction [29].
Catalysts 09 00193 g005
Figure 6. (a) Depiction of plasmon-driven conversion of 4NBT to DMAB; (b) localized surface plasmon (SP) measurements of SERS substrates. Different spots on the surface have varying plasmon-resonance wavelengths, affecting the SERS enhancement factor (EF) and electric-field enhancement [45].
Catalysts 09 00193 g006
Figure 7. Time-resolved SERS measurements during the plasmon-driven conversion of 4NBT to DMAB. The reactant peak at 1338 cm−1 decays during SERS measurement, and the product peak at 1434 cm−1 grows during SERS measurement [45].
Catalysts 09 00193 g007
Figure 8. Total change in the reactant (red) and product (green) peak amplitudes as a function of SERS EF. The y-axes for reactant and product are different to clearly highlight the correlation with the SERS EF [45].
Catalysts 09 00193 g008
Figure 9. (a) Final reaction yield, which is the ratio between product final amplitudes and reactant amplitudes of photoreactions and dependence on SERS EF. As localized field enhancement increased, the reaction yield stayed between 10% and 40%; (b) dependence of conversion efficiency, defined as the ratio between the amplitude changes of the product and reactant amplitudes on the SERS EF. As field enhancement increased, the reactant peak (1338 cm−1) decayed more significantly than the product peak formed (1434 cm−1) [45].
Catalysts 09 00193 g009
Figure 10. Reaction kinetics of 4NBT to DMAB plasmon-induced photoreactions. (a) The 4NBT reactant amplitude rapidly decreases with concurrent growth of product amplitude. At longer times, reactant peak experiences additional decay, while product amplitude remains constant; (b) similar to (a), but with a slight decrease in product amplitude at longer times; (c) in a weakly enhancing environment, reactions occur more slowly [45].
Catalysts 09 00193 g010
Figure 11. Rate constants for plasmon-induced processes. (a) Comparison of photoreaction rate constants with the loss of the 4NBT reactant (red), and formation of the DMAB product (green); (b) comparison of the photoreaction rate for 4NBT (red) and the photodegradation rate of 4NBT (blue). All observed ensemble-averaged rates are independent of field enhancement for the range of probed EFs [45].
Catalysts 09 00193 g011

