Article

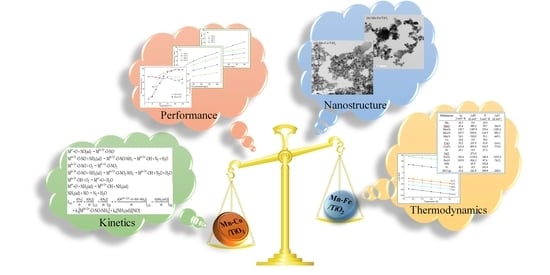
Comprehensive Comparison between Nanocatalysts of Mn−Co/TiO2 and Mn−Fe/TiO2 for NO Catalytic Conversion: An Insight from Nanostructure, Performance, Kinetics, and Thermodynamics

1
Key Laboratory of Renewable Energy Building Application Technology of Shandong Province, Shandong Jianzhu University, Jinan 250101, China
2
Department of Thermal Engineering, Shandong Jianzhu University, Jinan 250101, China
3
Engineering Laboratory of Power Plant Thermal System Energy Saving of Shandong Province, Shandong University, Jinan 250061, China
*
Author to whom correspondence should be addressed.
Catalysts 2019, 9(2), 175; https://doi.org/10.3390/catal9020175
Submission received: 15 January 2019 / Revised: 7 February 2019 / Accepted: 9 February 2019 / Published: 13 February 2019
(This article belongs to the Special Issue Emissions Control Catalysis)

Abstract

:
The nanocatalysts of Mn−Co/TiO2 and Mn−Fe/TiO2 were synthesized by hydrothermal method and comprehensively compared from nanostructures, catalytic performance, kinetics, and thermodynamics. The physicochemical properties of the nanocatalysts were analyzed by N2 adsorption, transmission electron microscope (TEM), X-ray diffraction (XRD), H2-temperature-programmed reduction (TPR), NH3-temperature-programmed desorption (TPD), and X-ray photoelectron spectroscopy (XPS). Based on the multiple characterizations performed on Mn−Co/TiO2 and Mn−Fe/TiO2 nanocatalysts, it can be confirmed that the catalytic properties were decidedly dependent on the phase compositions of the nanocatalysts. The Mn−Co/TiO2 sample presented superior structure characteristics than Mn−Fe/TiO2, with the increased surface area, the promoted active components distribution, the diminished crystallinity, and the reduced nanoparticle size. Meanwhile, the Mn4+/Mnn+ ratios in the Mn−Co/TiO2 nanocatalyst were higher than Mn−Fe/TiO2, which further confirmed the better oxidation ability and the larger amount of Lewis acid sites and Bronsted acid sites on the sample surface. Compared to Mn−Fe/TiO2 nanocatalyst, Mn−Co/TiO2 nanocatalyst displayed the preferable catalytic property with higher catalytic activity and stronger selectivity in the temperature range of 75–250 °C. The results of mechanism and kinetic study showed that both Eley-Rideal mechanism and Langmuir-Hinshelwood mechanism reactions contributed to selective catalytic reduction of NO with NH3 (NH3-SCR) over Mn−Fe/TiO2 and Mn−Co/TiO2 nanocatalysts. In this test condition, the NO conversion rate of Mn−Co/TiO2 nanocatalyst was always higher than that of Mn−Fe/TiO2. Furthermore, comparing the reaction between doping transition metal oxides and NH3, the order of temperature−Gibbs free energy under the same reaction temperature is as follows: Co3O4 < CoO < Fe2O3 < Fe3O4, which was exactly consistent with nanostructure characterization and NH3-SCR performance. Meanwhile, the activity difference of MnOx exhibited in reducibility properties and Ellingham Diagrams manifested the promotion effects of cobalt and iron dopings. Generally, it might offer a theoretical method to select superior doping metal oxides for NO conversion by comprehensive comparing the catalytic performance with the insight from nanostructure, catalytic performance, reaction kinetics, and thermodynamics.

Graphical Abstract

1. Introduction

Nitrogen oxides (NOx) generated from fossil fuels are regarded as the primary reason for acid rain, ozone depletion, photochemical smog, and greenhouse effects [1]. Selective catalytic reduction of NOx with NH3 or urea as a reductant (NH3-SCR) is proposed to be the most efficient method for eliminating NOx from stationary source and mobile source [2]. In recent decades, the commercial catalyst of V2O5-WO3(MoO3)/TiO2 used for NH3-SCR process exhibited an excellent catalytic property in the typical standard SCR reaction within the temperature range of 300–400 °C [3,4].
4 NO   +   4 NH 3   +   O 2     4 N 2   +   6 H 2 O
Nowadays, for the purpose of reducing the inhibiting effects of ash and SO2 over the SCR catalysts, there is an intense interest in developing catalysts for NO reduction at lower temperature [5]. However, the V2O5−WO3(MoO3)/TiO2 catalysts demand a strict temperature window, which limits their arrangement flexibility. The vanadium-based catalysts cannot reach satisfactory efficiency of eliminating NOx as the reaction temperature lower than 250 °C. Hence, the catalysts appropriate to low temperature SCR are strongly desired, which could be placed at the downstream of electrostatic precipitator and desulfurizer [6]. A great deal of catalysts comprised of different transition metal oxides on various supports were analyzed to improve the catalytic ability for low-temperature deNOx. The typical transition metals, such as Mn [7], Co [8], Fe [9], Ni [10], Zn [11], and Cr [9], were well-reported to display satisfactory properties at the low temperature. Among the various transition metal elements applied in the catalysts for NOx reduction, manganese oxides display superior activity especially at the low temperature, which can be attributed to the various types of labile oxygen and high mobility of valence states [12]. Meanwhile, it was found that cobalt and iron species can combine with manganese to produce mixed nanoparticle-oxides and exhibit high SCR activity and excellent N2 selectivity with a wide temperature window from 100—300 °C [13,14]. These mixed nanoparticle-oxides contain abundant oxygen vacancies on the catalyst surface, forming strong interaction bands at atomic scale, such as Mn-O-Fe [15,16] and Mn-O-Co [17]. Meanwhile, the active metal species of CoOx and FeOx are also regarded as the typical promoters for NOx conversion, which serve as core catalyst components of active metal oxides, supplying surface oxygen to accelerate NOx elimination [17,18].
Another crucial field of the investigation on NH3-SCR process is the reaction mechanism on the active sites with a better understanding of the surface chemistry and developed kinetic models to evaluate the reactions. It was widely accepted that the main reaction of low temperature SCR complies with both the Eley-Rideal mechanism and Langmuir-Hinshelwood mechanism, which is further depended on the reaction temperature and the catalyst components [19,20]. According to the Eley-Rideal mechanism, the reaction occurred between NO and NH3 (adsorbed) to generate an activated transition state and further decomposed into H2O and N2 [20]. Based on the Langmuir-Hinshelwood mechanism, the reaction happened between adsorbed NO and adsorbed NH3 on the adjacent sites to form H2O and N2 [21]. Meanwhile, it was widely accepted that the first step in SCR was an oxidative abstraction of the hydrogen from adsorbed ammonia [22]. Therefore, oxidative NH3 played an important part in the mechanism of NH3-SCR, which could be evaluated by thermodynamics in details [7]. However, the comprehensive comparison of NO elimination over the nanocatalysts of MnCoOx and MnFeOx on TiO2 support, especially with an insight from structure, performance, kinetics, and thermodynamics, has not been explored clearly.
In this study, the nanocatalysts of Mn−Co/TiO2 and Mn−Fe/TiO2 were synthesized by hydrothermal method. The physicochemical properties of the obtained samples were researched by SEM, BET, XRD, H2-TPR, NH3-TPD, and XPS. In the meantime, the catalytic performance comparation of Mn−Co/TiO2 and Mn−Fe/TiO2 nanocatalysts was investigated using kinetic and thermodynamic analysis. The purpose of this work was mean to explore a comprehensive perspective for optimizing multimetals SCR catalysts, especially for the Mn-based bimetals nanocatalysts.

2. Results and Discussions

2.1. Physicochemical Properties of the Nanocatalysts
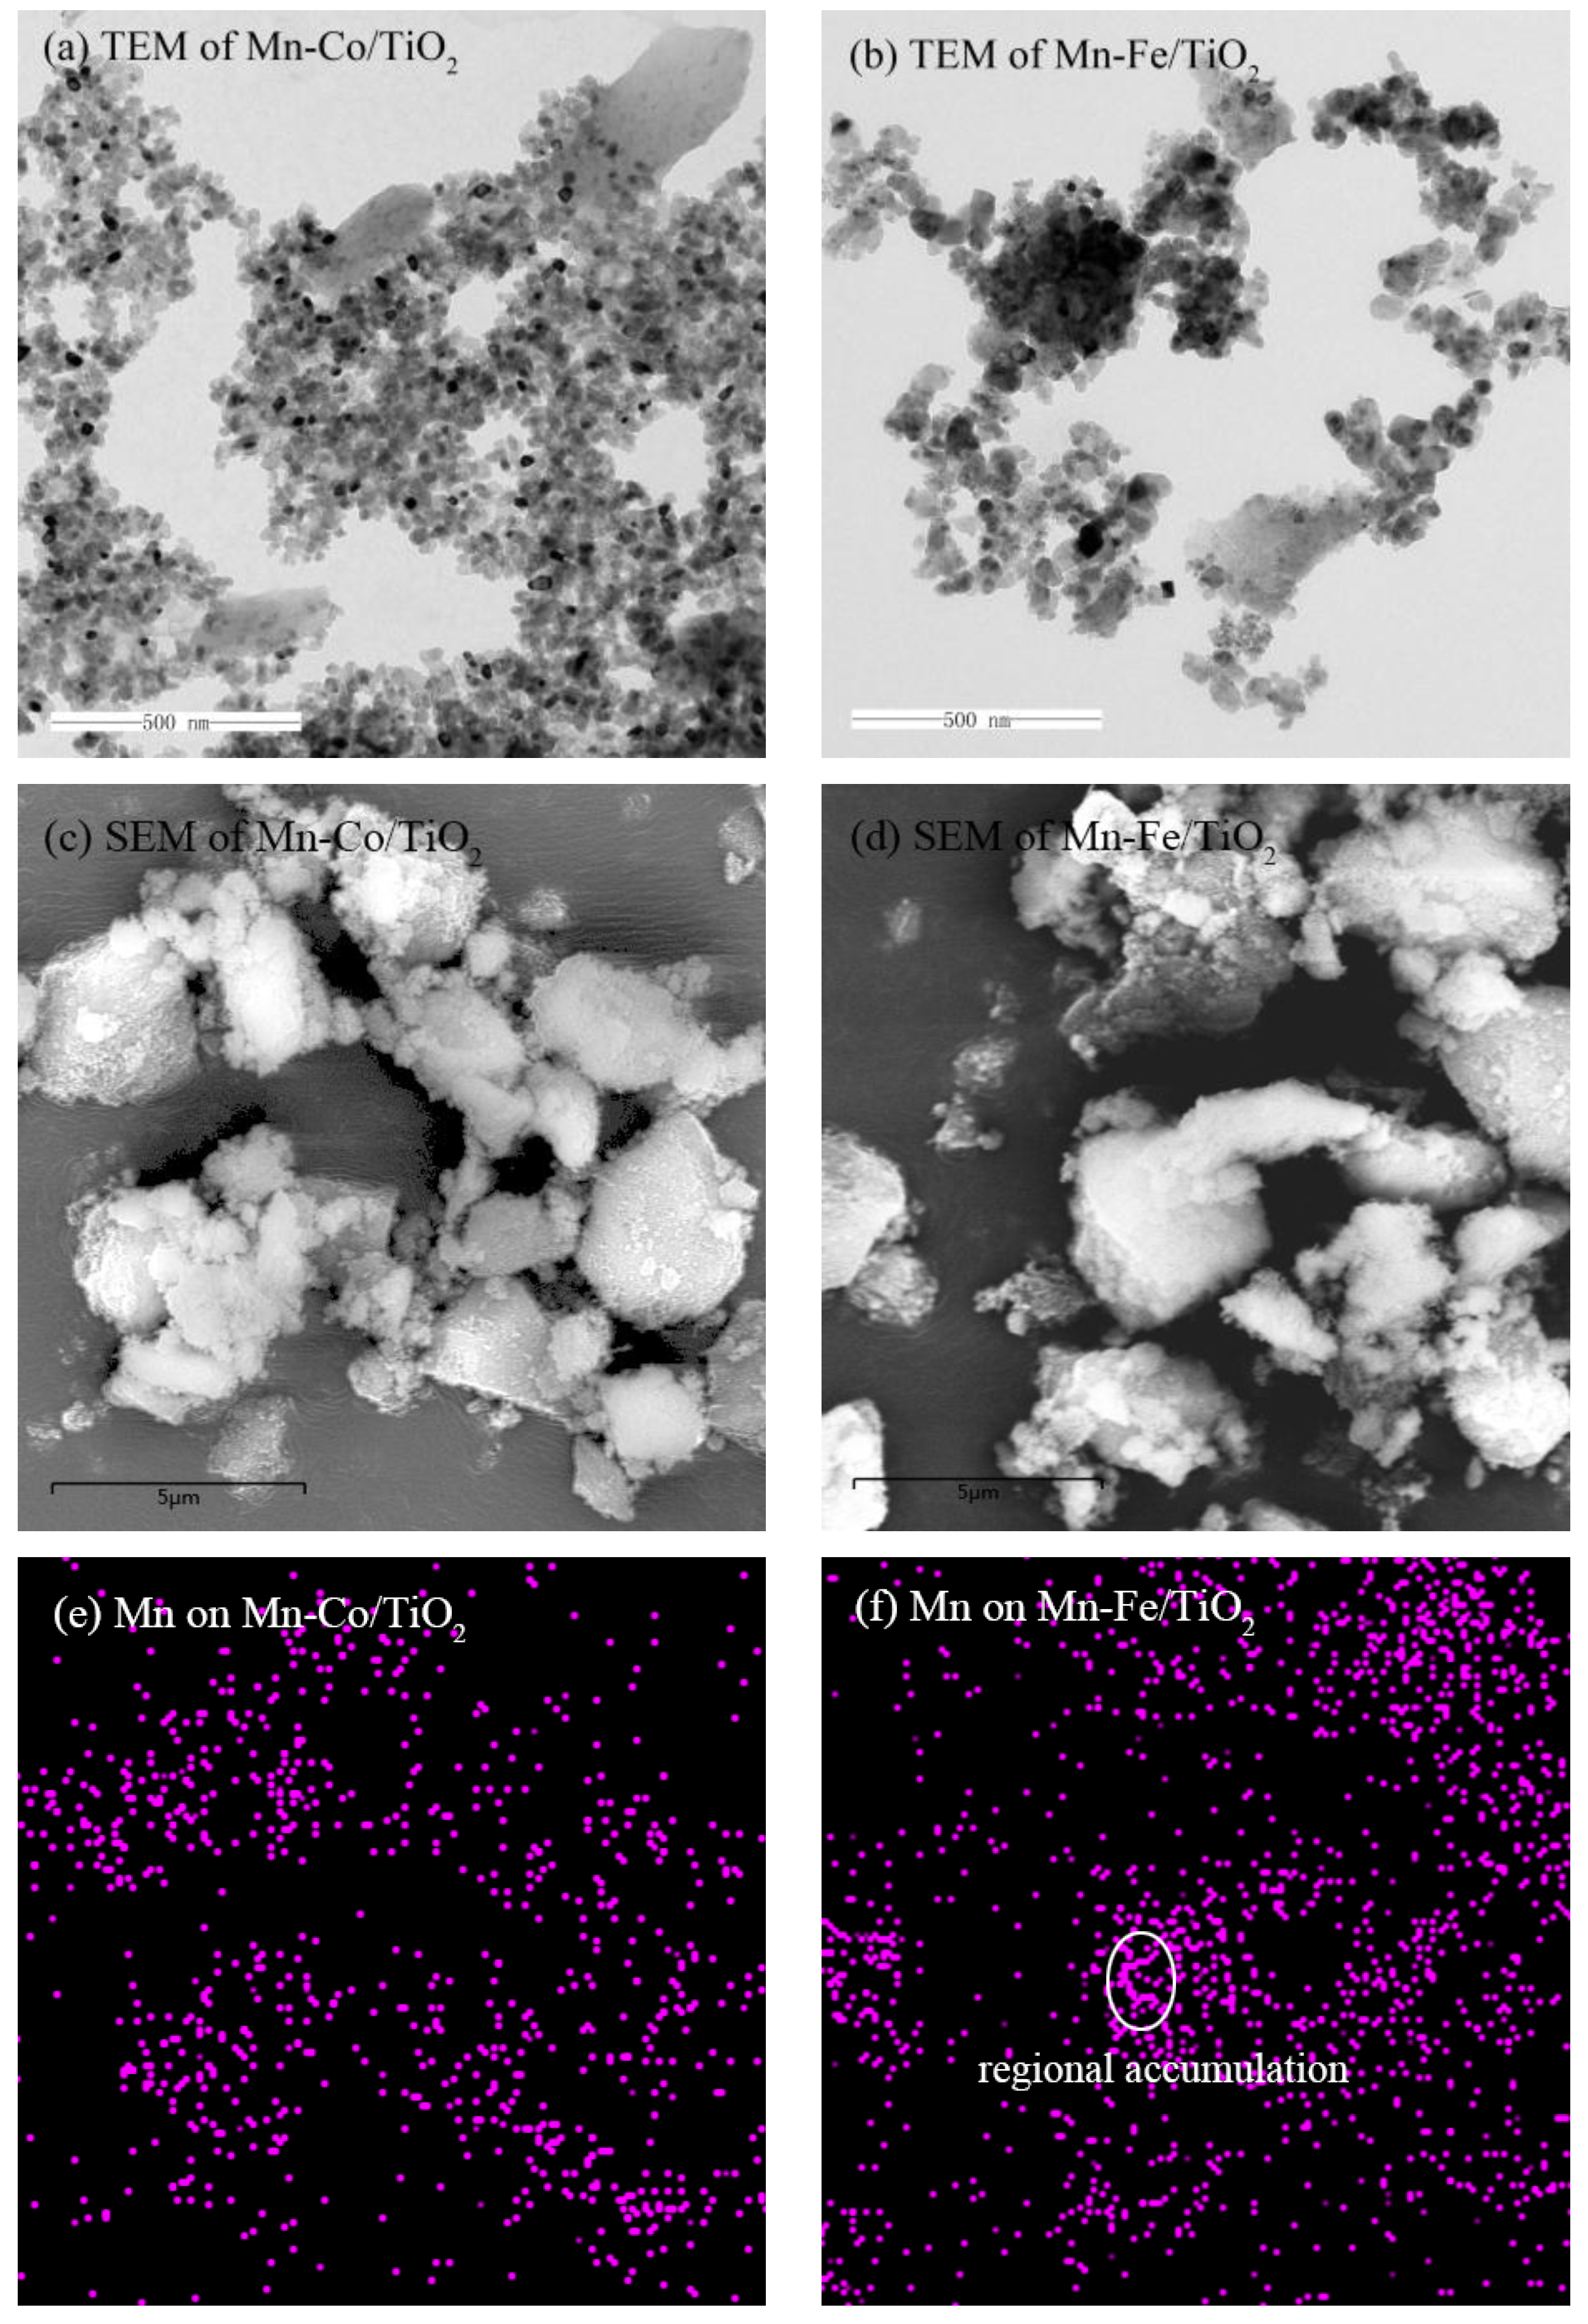
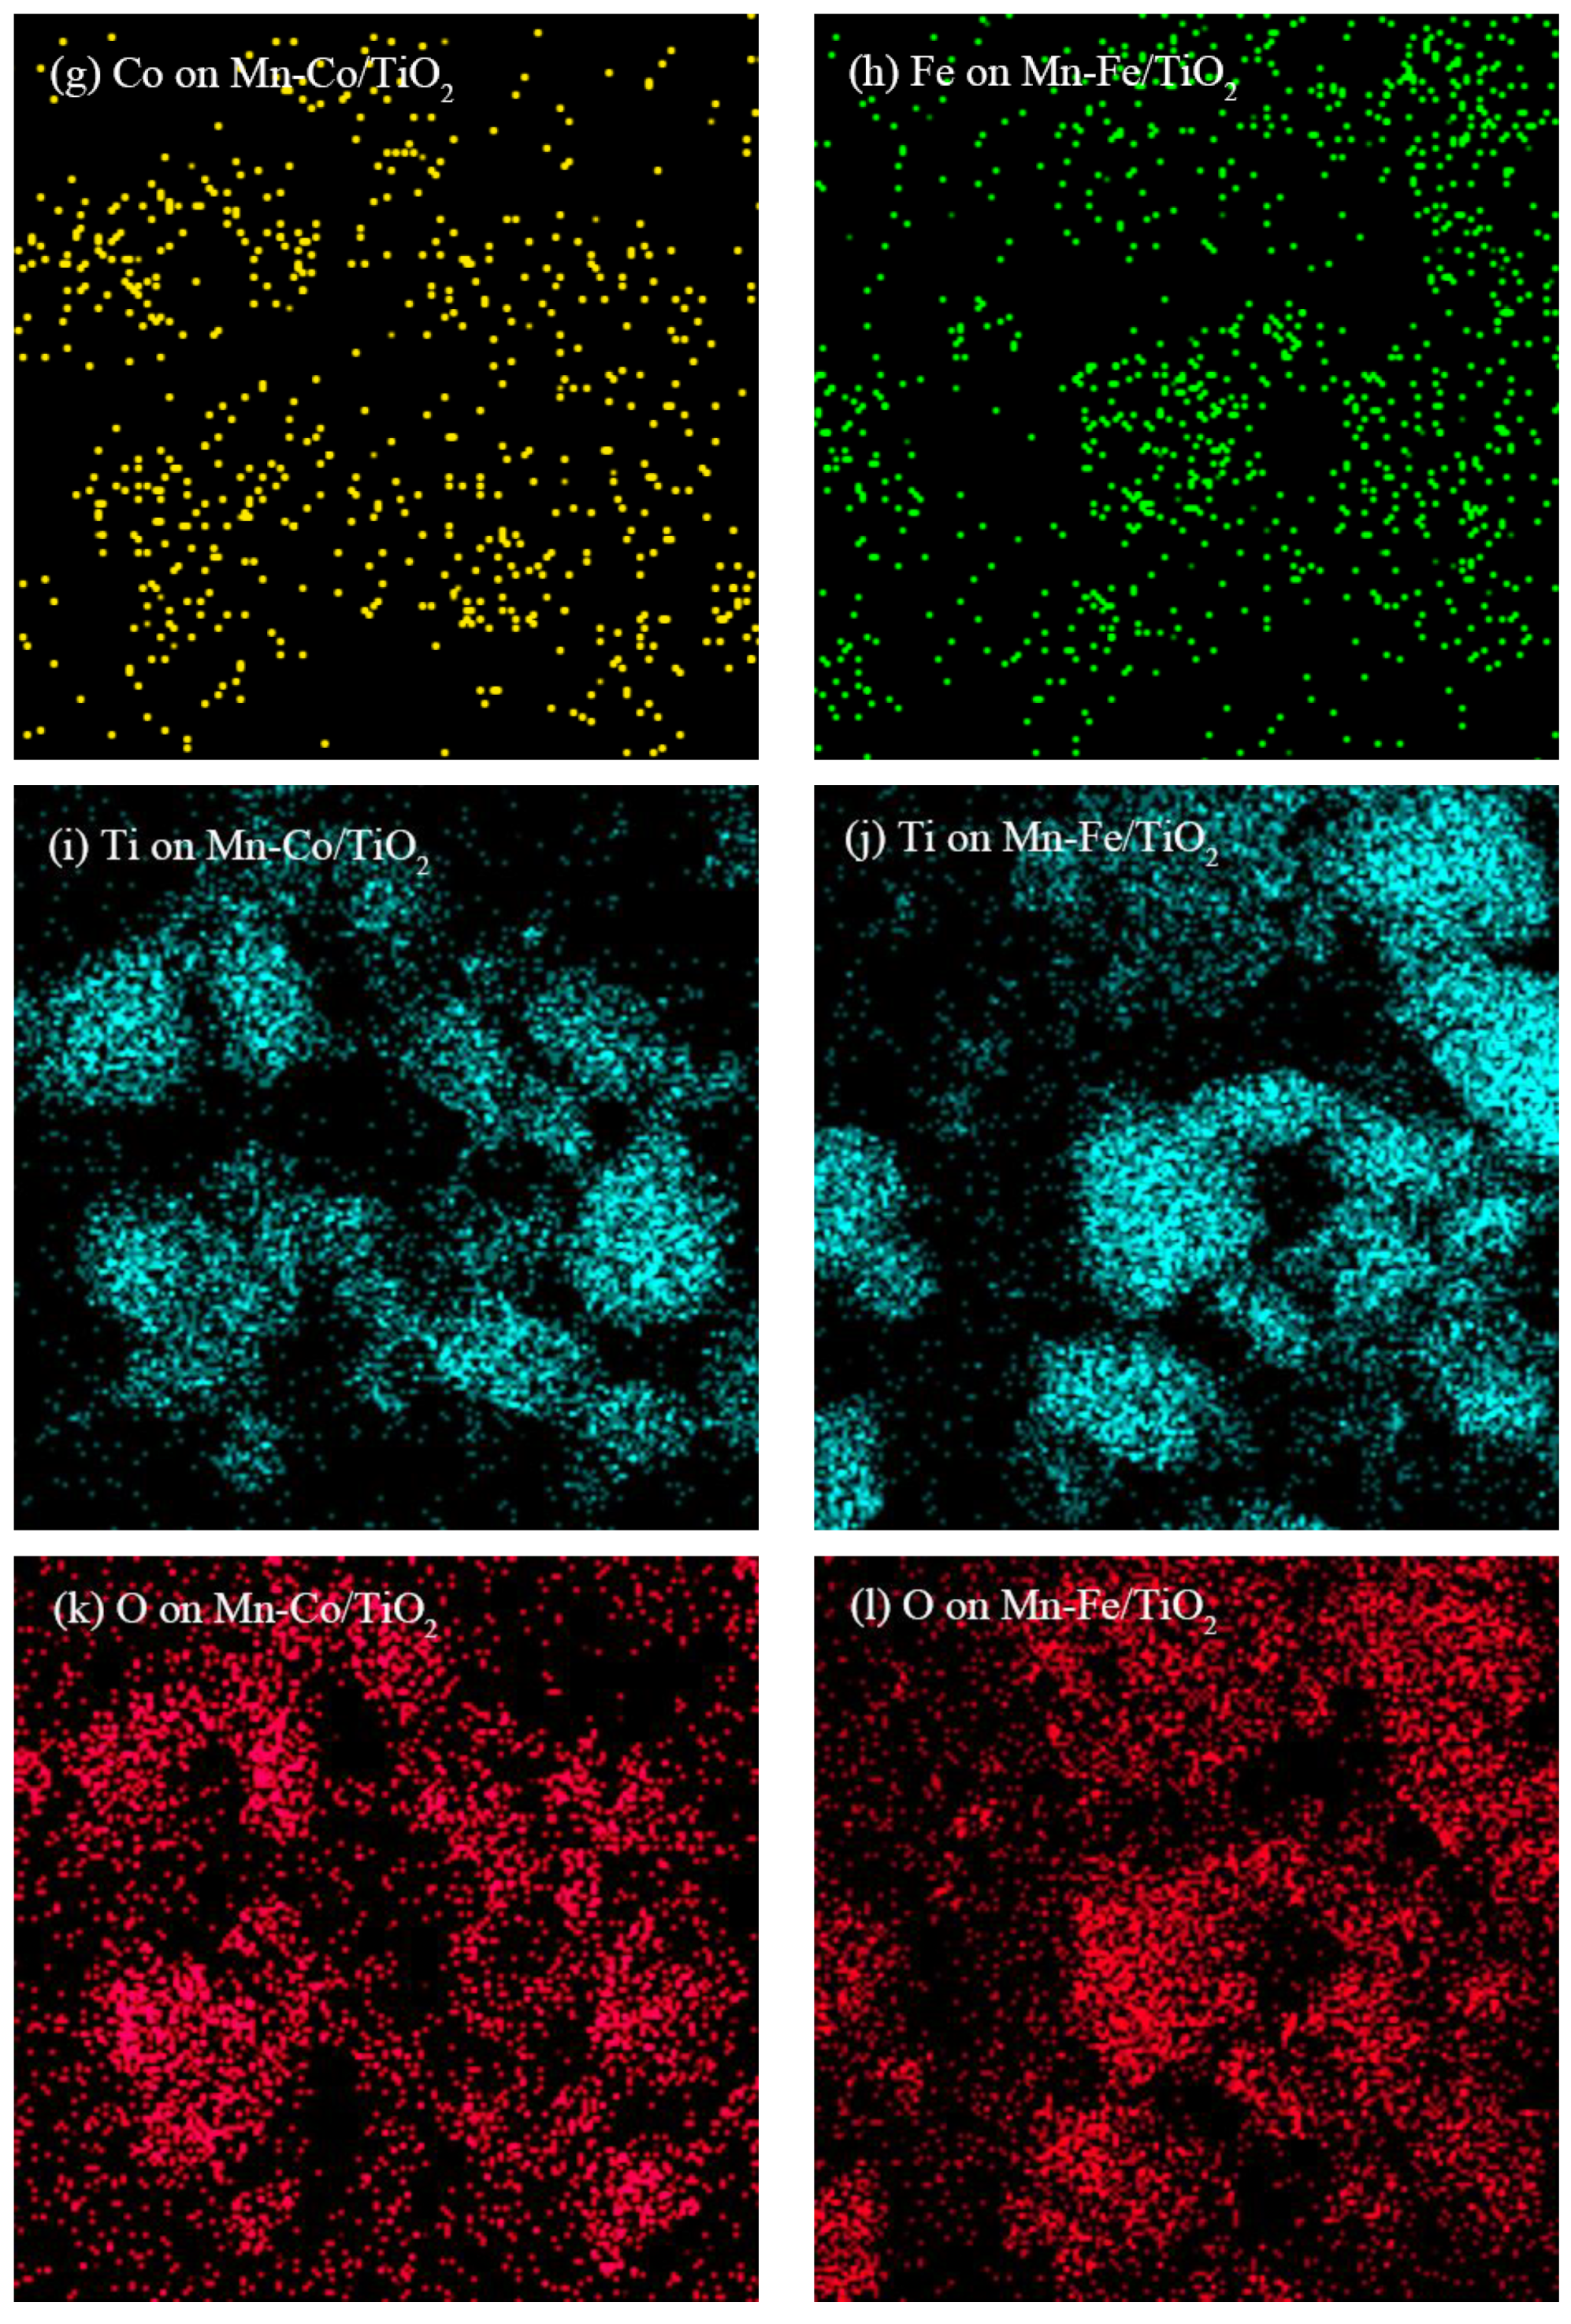
2.1.1. TEM Analysis

The topographic characteristics and the porous structures of the Mn−Co/TiO2 and Mn−Fe/TiO2 nanocatalysts were collected by TEM test. As shown in Figure 1a, the most part of Mn−Co/TiO2 nanocatalyst was formed with uniform elliptic nanoparticles with glabrous surfaces and well-proportioned size distribution and without apparent agglomeration, although there was a spot of tightly aggregated TiO2 nanoparticles interfused into the smaller regular particles. Therefore, a distinct and unbroken mesh structure of micropore was form in Mn−Co/TiO2 sample. However, according to the TEM images of Mn−Fe/TiO2 nanocatalyst from Figure 1b, a noticeable augment in the particle size was observed. The nanoparticles were irregular, lots of which stacked on the nanocatalyst surface. According to Figure 1(c)(l), captured at a larger scope, it could be found that all active elements contained in Mn−Co/TiO2 nanocatalyst were well dispersed without obvious irregular stacked particles. On the surface of Mn−Fe/TiO2 nanocatalyst, the element of manganese appeared slight regional accumulation, which might be caused by the abundant micropore structure collapsing [23].

2.1.2. BET Analysis

The structure parameters of Mn−Co/TiO2 and Mn−Co/TiO2 nanocatalysts, such as the specific surface areas, total pore volumes, and average pore diameters, were investigated by nitrogen-adsorption-desorption, and the test data was summarized in Table 1. Mn−Co/TiO2 nanocatalyst attained the larger specific surface areas than Mn−Fe/TiO2, which was possible due to the improved dispersion of MnCoOx species on the nanocatalyst surface. In the meantime, the average pore diameters increased obviously, from 33.06 nm in the Mn−Co/TiO2 sample to 54.85 nm in the Mn−Fe/TiO2 sample. Therefore, the MnCoOx species were more likely to promote nanocatalyst to form micropores compared with MnFeOx species [24,25]. Nevertheless, the difference of total pore volumes between Mn−Co/TiO2 and Mn−Fe/TiO2 nanocatalysts was not conspicuous. The total pore volumes reduced slightly from 0.531 cm3·g−1 in Mn−Co/TiO2 sample to 0.424 cm3·g-1 in Mn−Fe/TiO2 sample, which was probable due to the mesoporosity generation, which blocked the micropore formation, resulting in a small decrease of total pore volume. Considering the comprehensive test results, the Mn−Co/TiO2 nanocatalyst exhibited superior physical properties than the Mn−Fe/TiO2 sample with higher specific surface area, larger total pore volume, and smaller average pore diameter, which were contributed to abundant micropores structures.

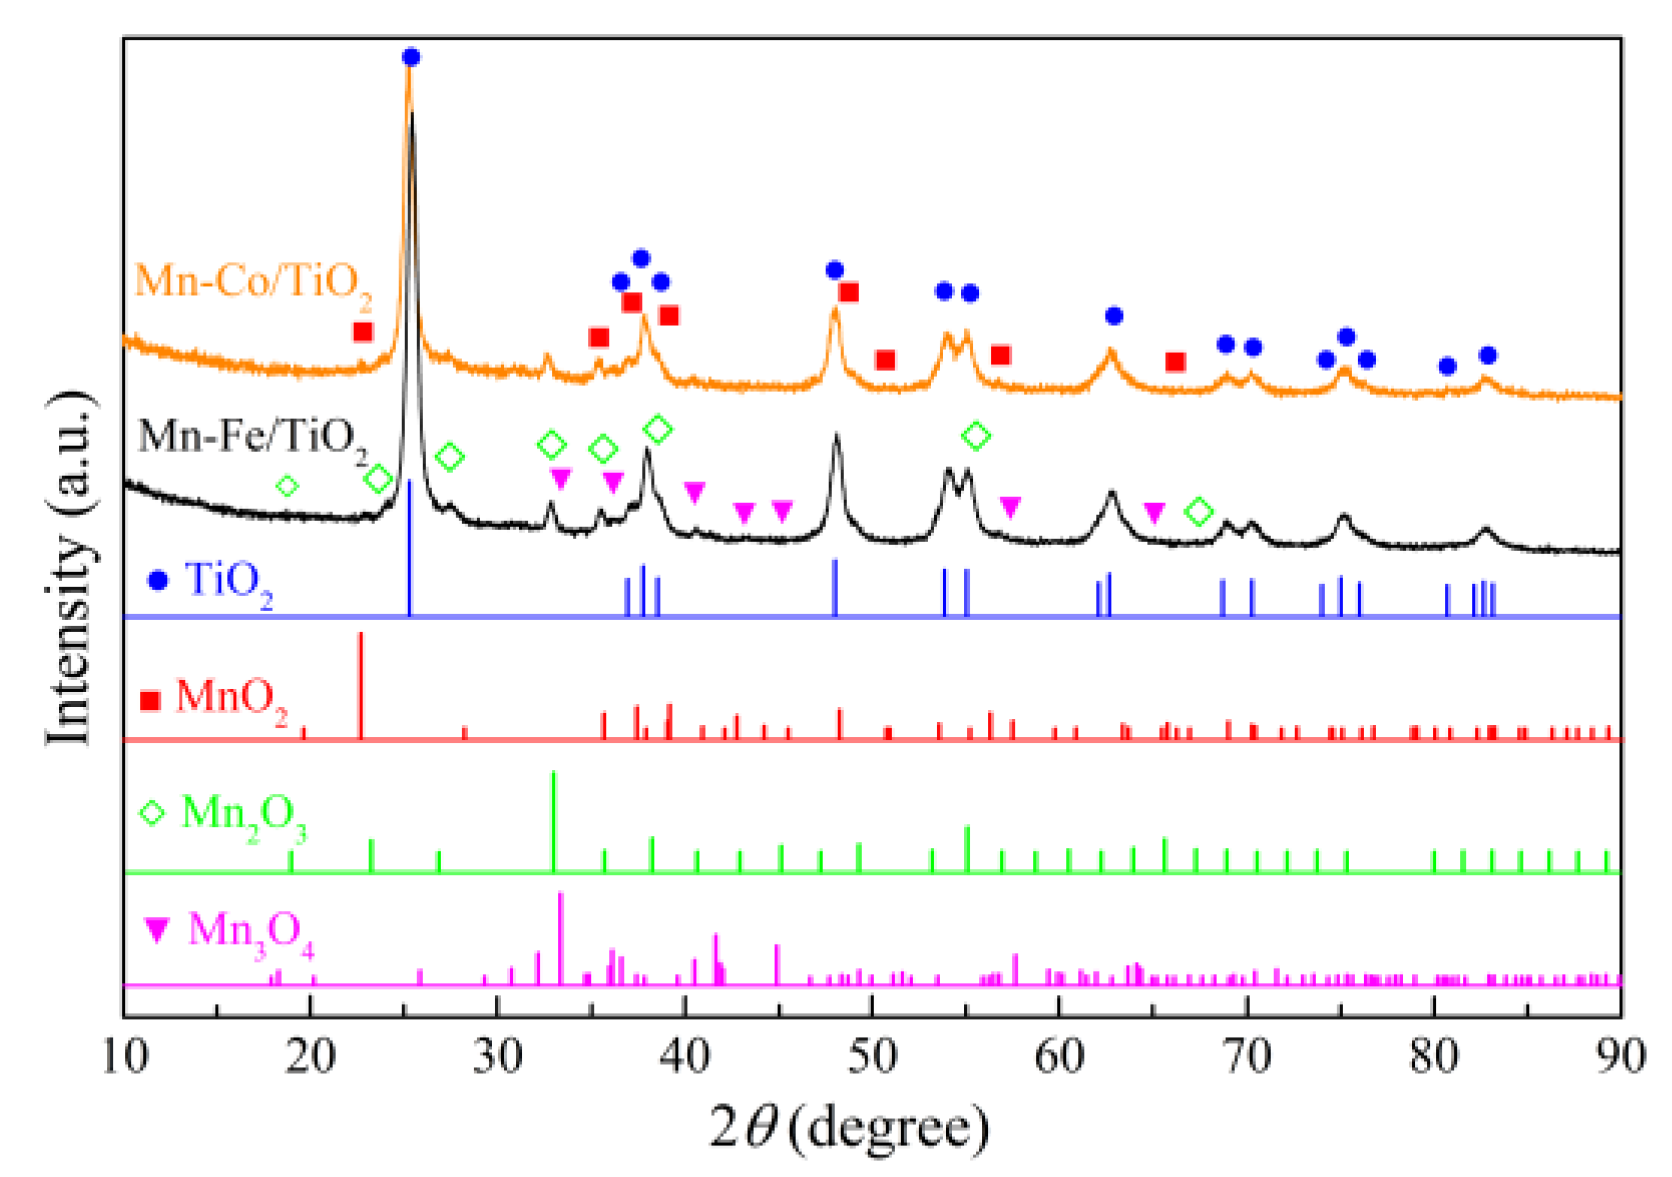
2.1.3. Components Analysis

The XRD patterns of Mn−Co/TiO2 and Mn−Fe/TiO2 nanocatalysts were displayed in Figure 2. The diffraction peaks for TiO2 support contained in the nanocatalysts were preserved entirely, with the strong and distinguished reflections appearing at 2θ = 25.3°, 37.8°, 48.0°, 53.9°, 62.7°, 68.8°, 70.3°, 75.1°, and 82.7°. These accorded with the XRD pattern of anatase TiO2 (ICDD PDF card # 71-1166) [26], with the diffraction angles of the matching peaks shifted at tiny degrees. For Mn−Co/TiO2 nanocatalyst, each corresponding peak of anatase TiO2 appeared at the lower diffraction angle, which indicated the interaction between MnCoOx and anatase TiO2 was stronger than that of MnFeOx and anatase TiO2. Meanwhile, the diffraction peaks of anatase TiO2 in the Mn−Co/TiO2 sample were broader and weaker than that in Mn−Fe/TiO2 sample, which demonstrated the crystalline of anatase TiO2 reduced with MnCoOx loading.
The diffraction peaks corresponding to MnOx contained in Mn−Co/TiO2 and Mn−Fe/TiO2 nanocatalysts were very complex due to the transformation among the incomplete crystallization of manganese oxides, such as MnO2, Mn2O3, Mn3O4, and MnO. The characterization reflections for MnOx in the Mn−Co/TiO2 sample were obviously weaker than that in Mn−Fe/TiO2 sample, which manifested the active species in the Mn−Co/TiO2 nanocatalyst, which were superior dispersed on the nanocatalyst surface or the active species incorporated into TiO2 lattice better [27]. The diffraction peaks fitted MnO2 (ICDD PDF card # 82-2169) precisely at about 2θ values of 22.10°, 35.19°, 36.96°, 38.72°, 47.86°, and 57.166°, which were coinciding with the crystallographic plane reflections of (110), (310), (201), (111), (311), and (420), respectively [12]. Meanwhile, both Mn−Co/TiO2 and Mn−Fe/TiO2 nanocatalysts exhibited the diffraction peaks corresponding to Mn2O3 and Mn3O4, apparently. The Mn2O3 (ICDD PDF card # 78-0390) was well-matched with intensive distinct signals at 2θ = 23.08°, 26.72°, 32.87°, and 56.89°, attributed to the crystallographic plane reflections of (211), (220), (222), and (433), respectively. The Mn3O4 (ICDD PDF card # 75-0765) was fitted to characteristic peaks at 36.28°, 40.67°, 41.80°, 57.73° and 64.17°, ascribed to the crystallographic plane reflections of (112), (130), (131), (115), and (063), respectively [23].
Comparing the XRD patterns of the Mn−Co/TiO2 and Mn−Fe/TiO2 nanocatalysts, it could be observed that the diffraction peaks of both Mn2O3 and Mn3O4 were visibly weakened in the Mn−Co/TiO2 sample. In the meantime, the diffraction peaks of anatase TiO2 in the Mn−Co/TiO2 sample were also notably lower than that in Mn−Fe/TiO2 sample. It was believed that the doping of cobalt into MnOx obtained superior enhancement than iron on reducing the crystallization of MnOx and TiO2 simultaneously. Moreover, in the XRD patterns of the Mn−Co/TiO2 nanocatalyst, there were no distinguished diffraction peaks for CoOx, which manifested the doping of cobalt not only improved MnOx dispersion, but also enhanced CoOx dispersing on the nanocatalyst surface completely. The similar results were received over Mn−Fe/TiO2 sample. Based on the phase characteristics comparation between Mn−Co/TiO2 and Mn−Fe/TiO2 nanocatalysts, it was believed that the Mn−Co/TiO2 sample exhibited more excellent properties with smaller crystallinities of chemical compounds and better distribution of the active species, which were conducive to catalytic reactions.

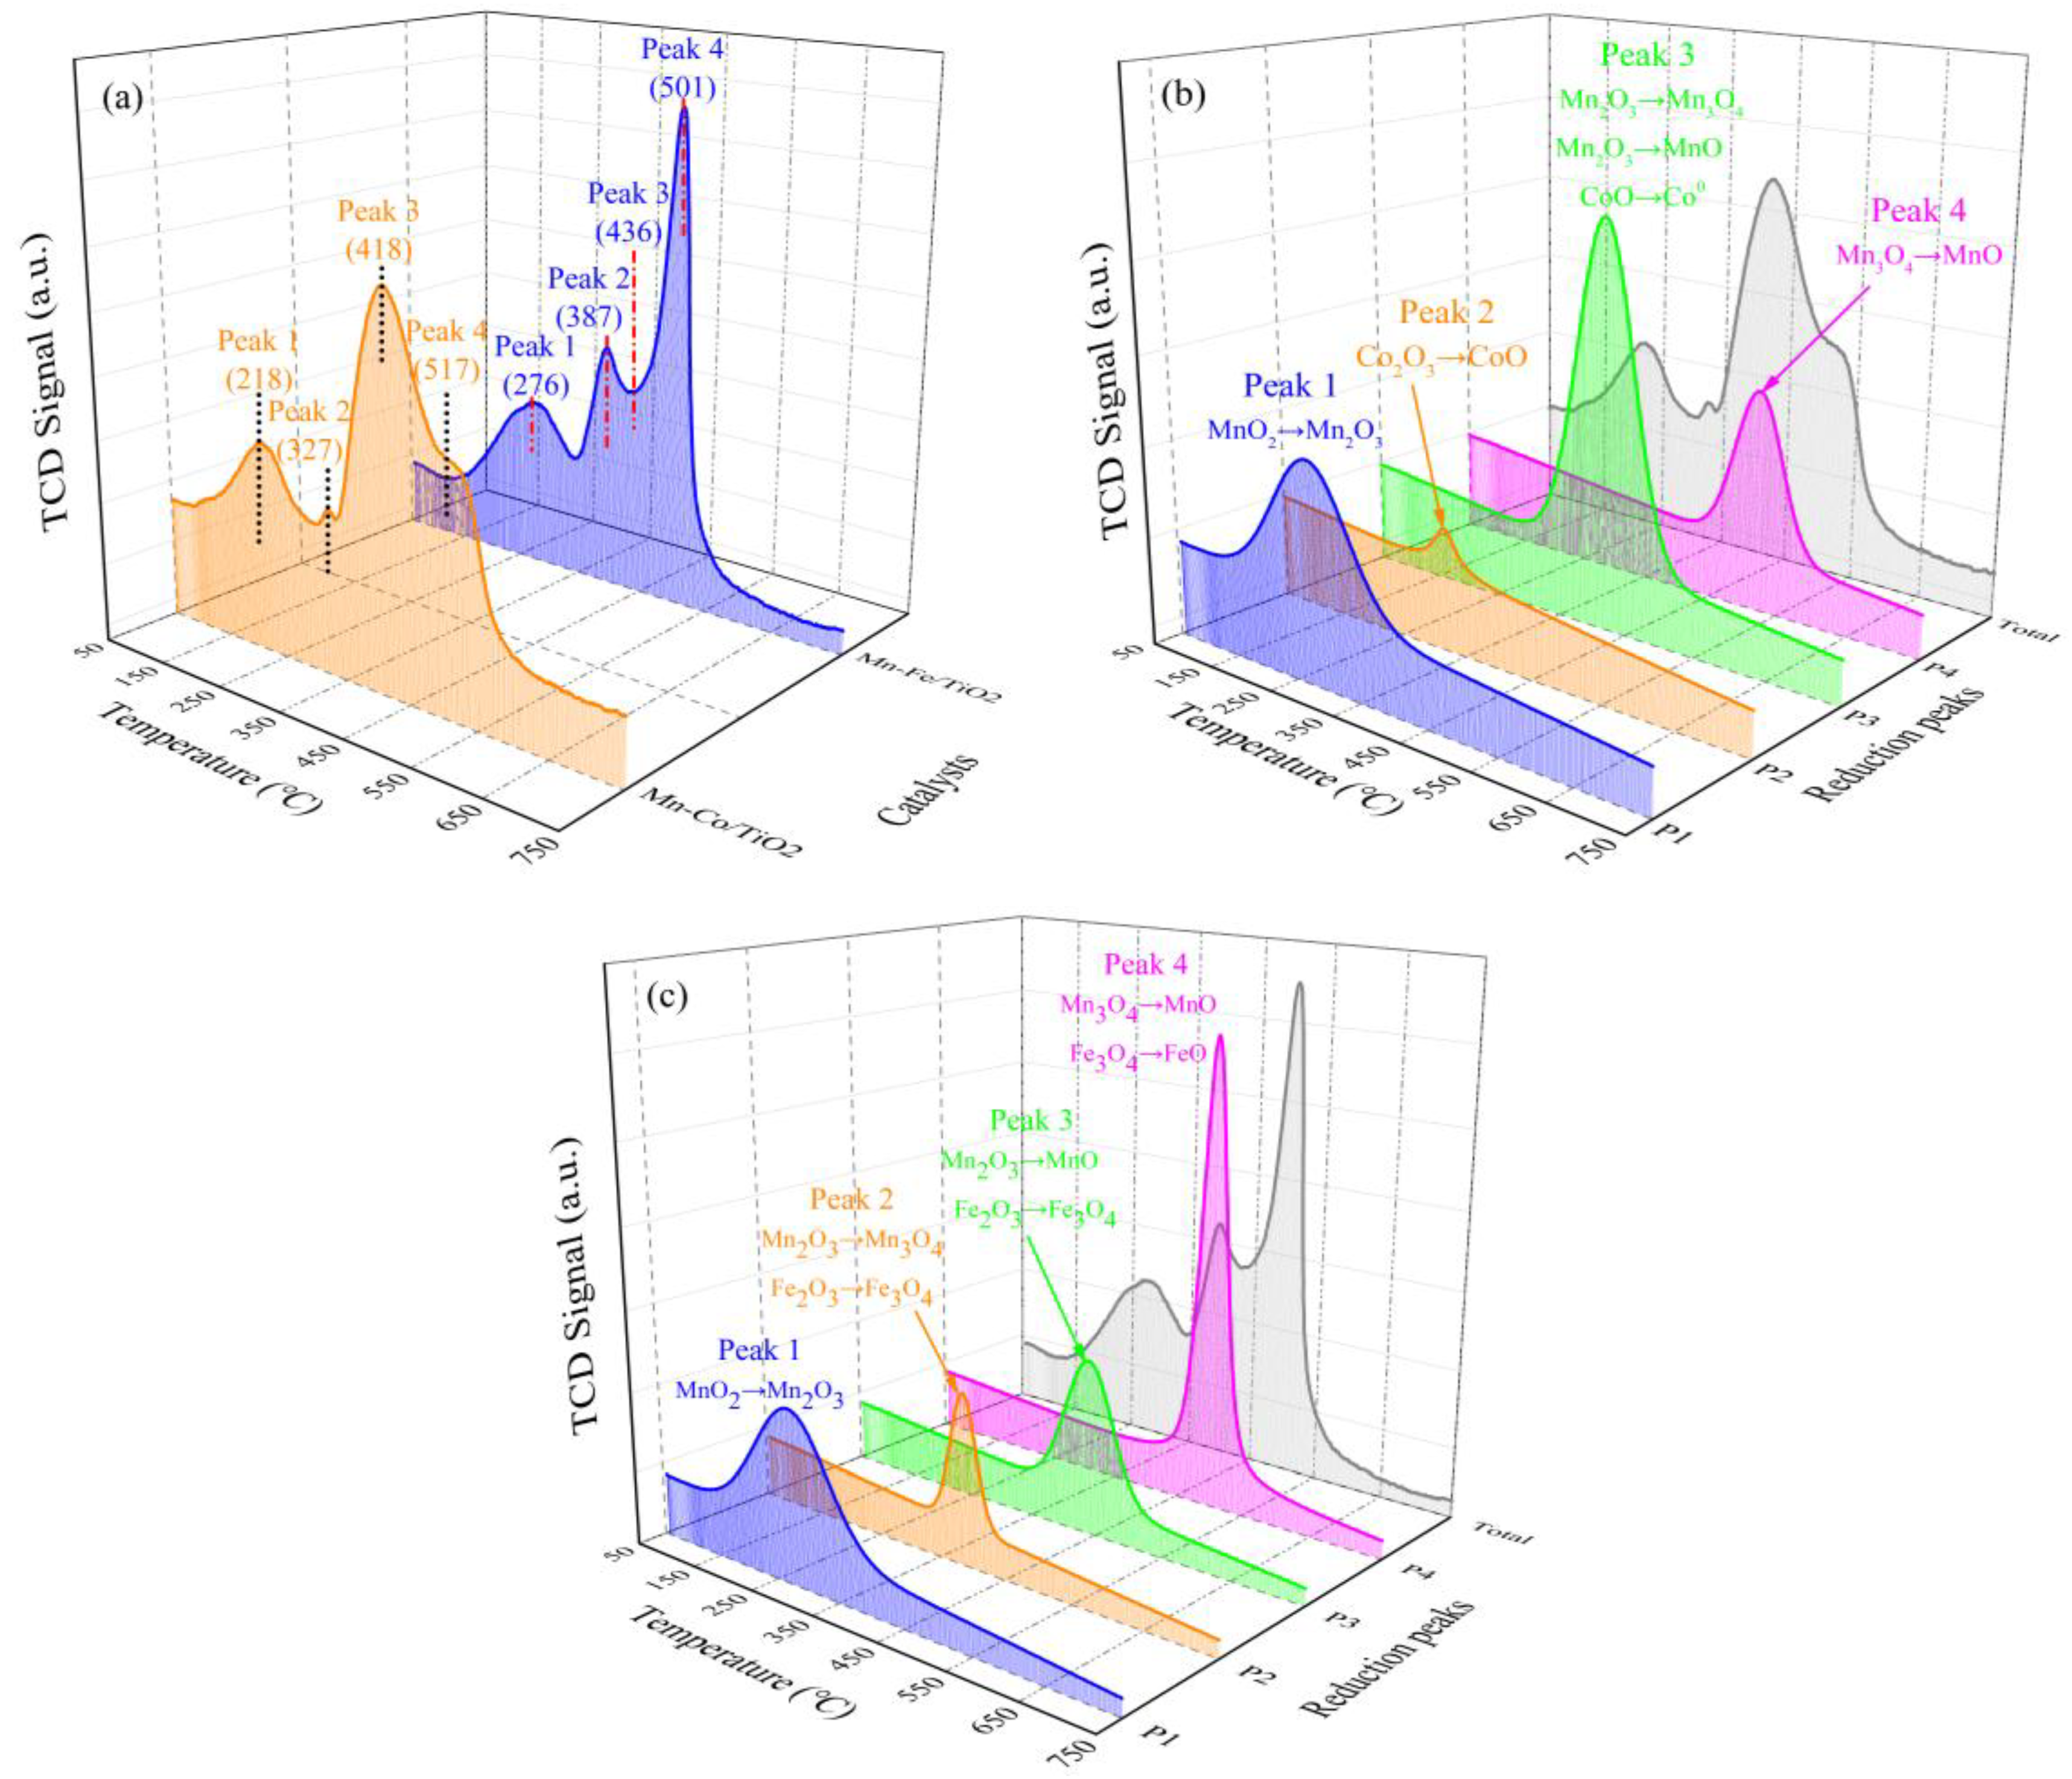
2.1.4. Reducibility Properties

The oxidation states of the active compounds contained in nanocatalysts of Mn−Co/TiO2 and Mn−Fe/TiO2 were tested by H2-TPR. The H2 consumption curve was fitted by reduction peak separation with Gaussian function, as shown in Figure 3. The details of H2 consumptions and reduction temperatures for each peak were listed in Table 2. In Mn−Co/TiO2 and Mn−Fe/TiO2 nanocatalysts, the anatase TiO2 support did not bring remarkable reduction peaks within the test temperature range. Hence, all H2 consumption could be attributed to the reduction process of MnOx, CoOx, and FeOx. It was proposed that the typical reduction process of MnOx contained in the nanocatalysts of Mn−Co/TiO2 and Mn−Fe/TiO2 complied with the following order: MnO2 → Mn2O3 (Mn3O4) →MnO [28]. Mn−Co/TiO2 nanocatalyst exhibited four reduction peaks with temperature rising from 50—850 °C, as shown in Figure 3b. The first reduction peak centered, at about 218 °C, was attributed to the high oxidation state of manganese ion converting from MnO2 to Mn2O3 [29]. The dominant reduction peak (Peak 3) was caused by two sequential processes of Mn2O3 reducing to Mn3O4 and Mn2O3 reducing to MnO, as reported in previous literatures [12,28]. The reduction process of Mn2O3 to Mn3O4 was more liable to happen over the original amorphous Mn2O3 [30], while reduction process of Mn2O3 to MnO preferred to occur at relatively higher temperature [31]. For the Mn−Co/TiO2 sample, the typical reduction process of cobalt oxides commonly displayed two separated peaks, the one of Co2O3 reducing to CoO appeared at around 327 °C, presenting as an asymmetrical reduction peak (Peak 2), the other one of CoO reducing to Co0 occurred at about 418 °C and overlapped with MnOx reduction peaks in whole or partly (Peak 3) [8,32]. Therefore, the fourth medium reduction peak in the Mn−Co/TiO2 nanocatalyst was related to the reduction processes of Mn3O4 to MnO.
In comparison, the peak intensions and the reduction temperatures of the Mn−Fe/TiO2 nanocatalyst were evidently different from that of the Mn−Co/TiO2 sample. The peak of MnO2 reducing to Mn2O3 weakened remarkably and shifted to higher temperature (276 °C). There were wide joint peaks (Peak 2 and Peak 3) at temperature of 330–530 °C, which were ascribed to the coinstantaneous reduction processes of Mn2O3 to Mn3O4 and Fe2O3 to Fe3O4. It was proposed that the majority of Fe2O3 was reduced at around 380 °C, which located at effortlessly reducible sites in the form of oligomeric clusters, nanoparticles or isolated ions [33]. After the majority of Fe2O3 reduction, there was a small quantity of residual Fe2O3 reducing to Fe3O4 at the higher temperature [34]. The dominating peak (Peak 4), at around 501 °C, was assigned to the overlapped peaks of Mn3O4 to MnO and Fe3O4 to FeO. Figure 4 provided a graphical representation of the reduction process, in which each active component embodied qualitatively [1,35]. In these two kinds of nanocatalysts, Mn−Co/TiO2 sample displayed the higher low-temperature reducibility and exhibited a noticeable medium temperature reduction peak at the same time, which manifested the higher oxidation states of manganese ion (Mn4+ and Mn3+) constituted the dominating phase [31].
According to Table 2, the total H2 consumption of Mn−Co/TiO2 nanocatalyst was 4.43 mmol·g−1 much larger than that of Mn−Fe/TiO2 sample. Meanwhile, the starting reduction peak temperature of Mn−Co/TiO2 nanocatalyst was at 218 °C lower than that of Mn−Fe/TiO2, which was regarded as an important factor influencing the reducibility. It was believed that the catalyst performed superior catalytic ability at low temperatures as the reduction peaks arising in lower temperature regions [1].

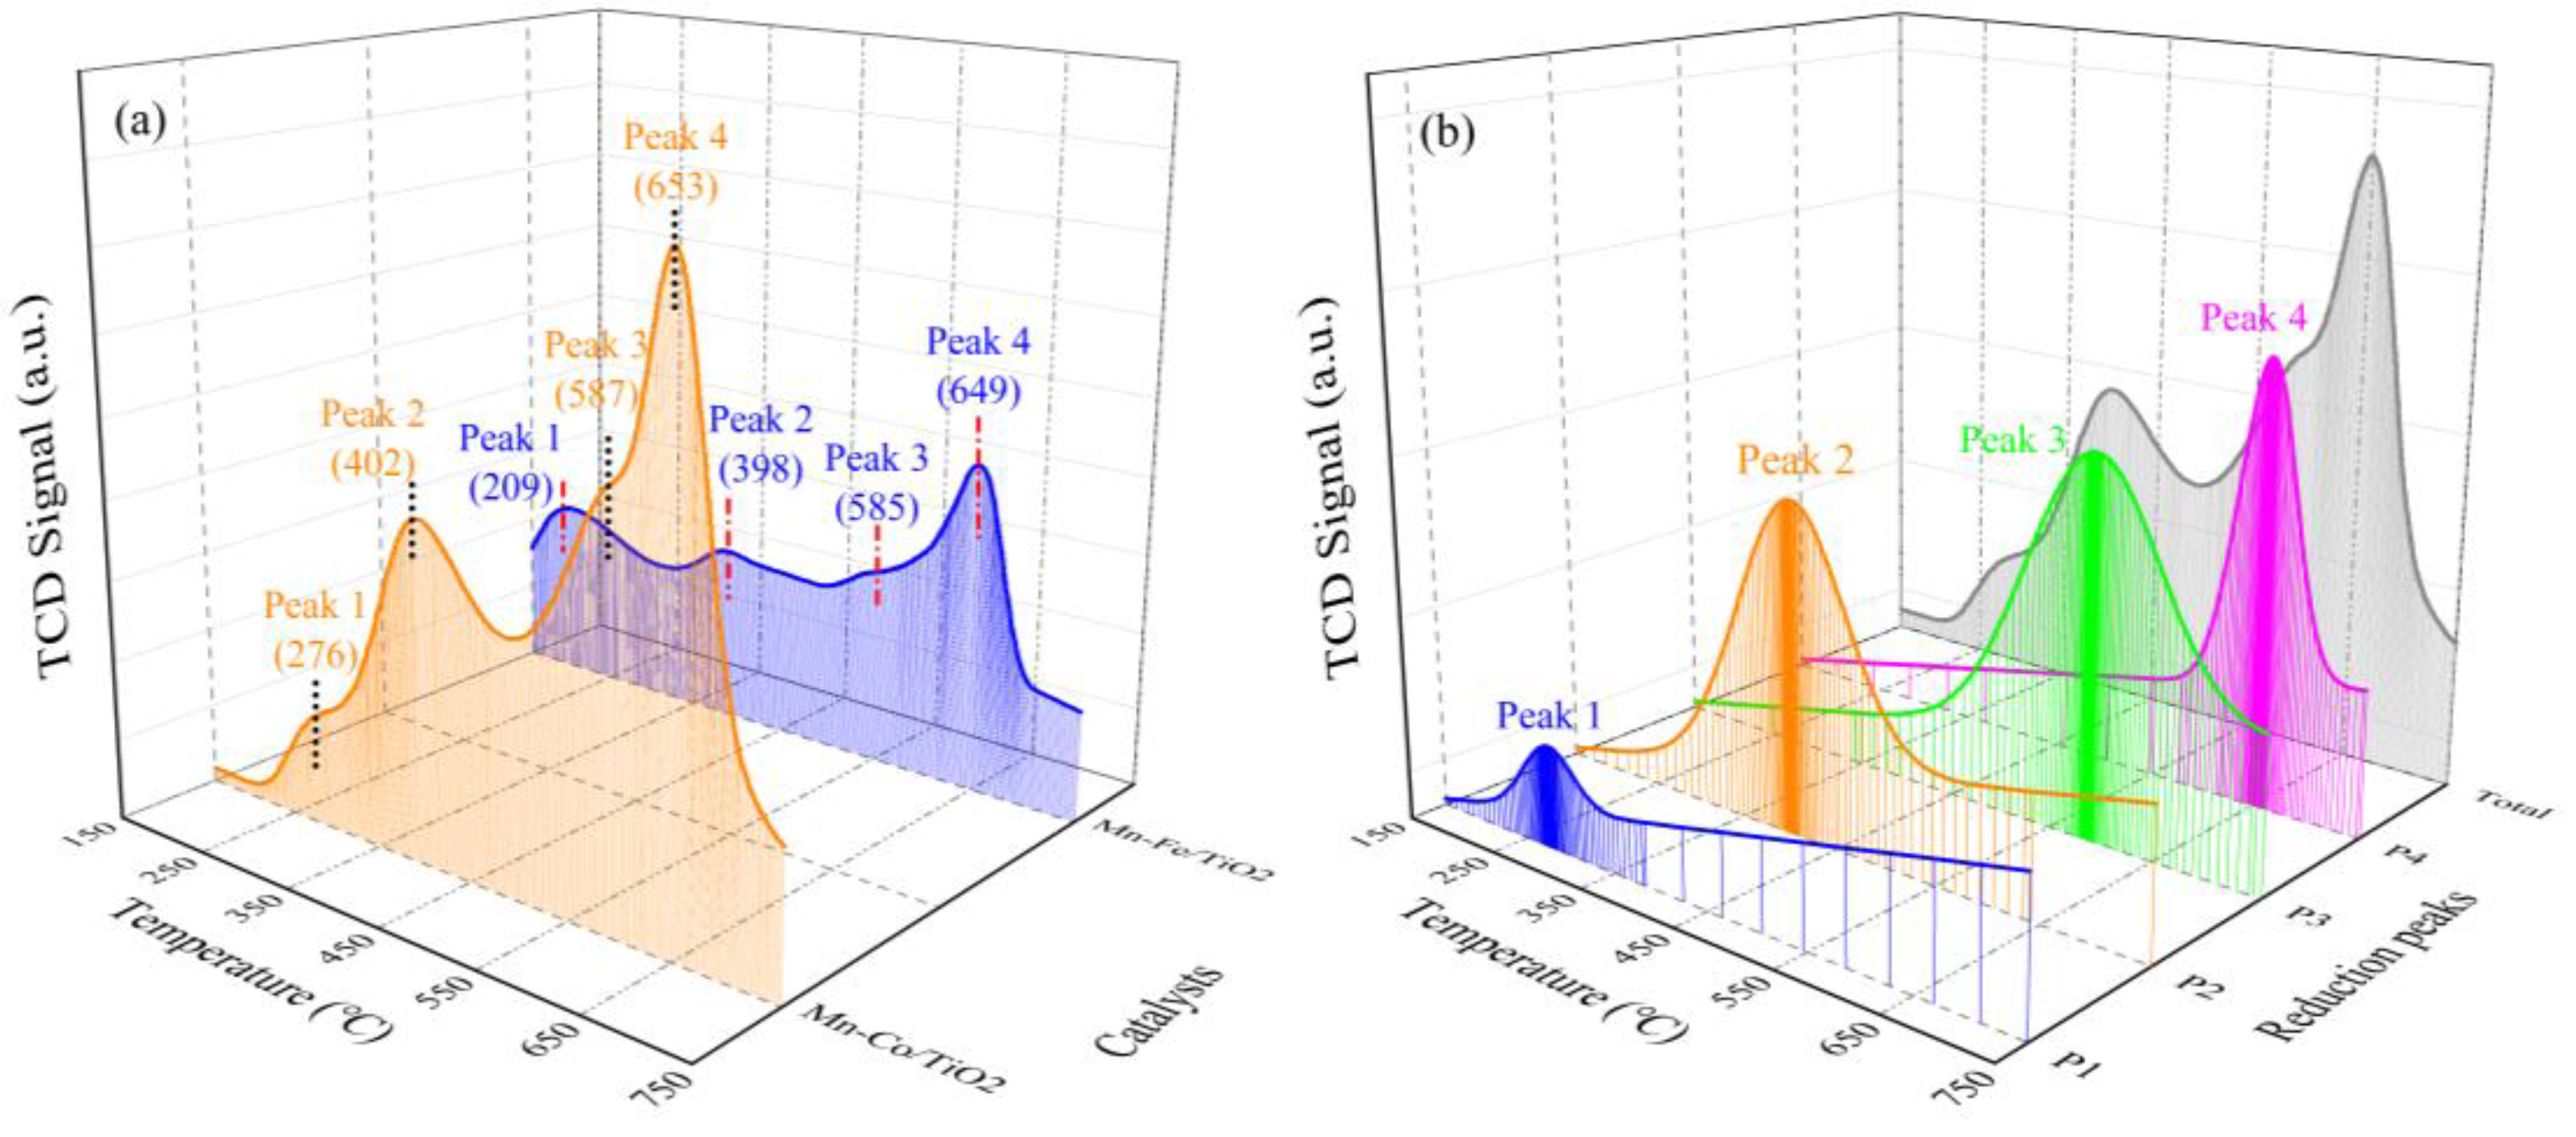
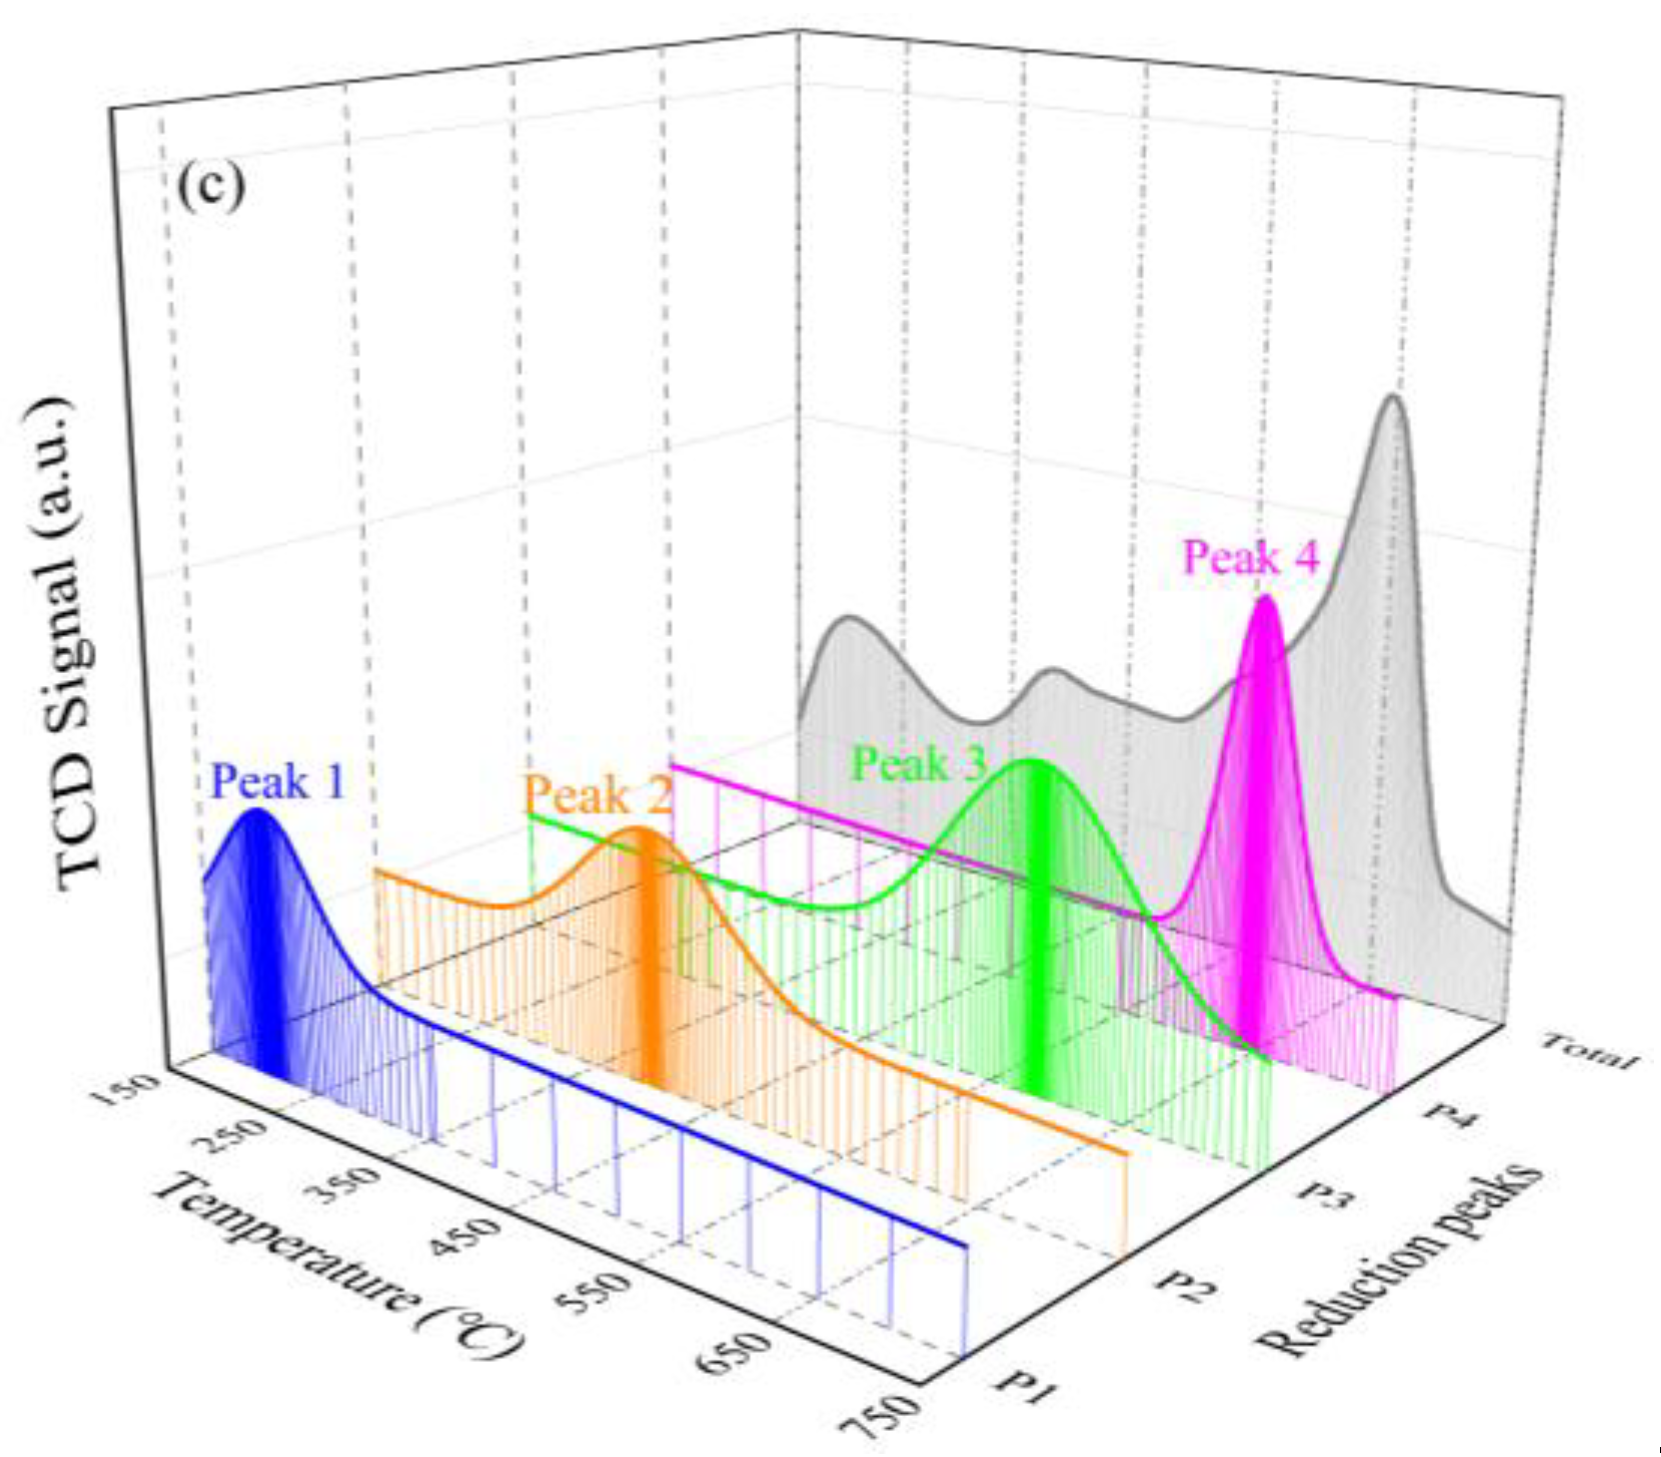
2.1.5. Ammonia Adsorption Properties

The acid capacity of the Mn−Co/TiO2 and Mn−Fe/TiO2 nanocatalysts was measured by NH3-TPD test, which was another crucial factor effecting the catalyst performance in SCR process [36]. The results were exhibited in Figure 5 and Table 3, respectively. The NH3-TPD curves for the Mn−Co/TiO2 and Mn−Fe/TiO2 nanocatalysts were ascribed to four desorption peaks of chemisorbed NH3 with the temperature rising from 150 °C to 750 °C. For Mn−Fe/TiO2 nanocatalyst, the first NH3 desorption peak occurred at around 209 °C, attributed to NH3 desorption from weak acid sites, which was too feeble to bound NH3 steadily in the gas mixture during SCR process [36]. Peak 2 and peak 3 were combined from 398 °C to 585 °C, which were attributed to the medium strong acid sites on the nanocatalyst surface. Peak 4, at around 649 °C, was assigned to the strong acid sites, which were regarded as abundant Lewis acid sites adsorbing a great deal of strongly bound NH3 [37]. In comparation, the NH3 desorption results of the Mn−Co/TiO2 nanocatalyst exhibited better acidity capacity at medium and high temperatures. However, there was an undesired temperature shift to higher temperature occurred in the meantime. For Mn−Co/TiO2 sample, the desorption temperature of weak acid sites, medium strong acid sites and strong acid sites were 276 °C (Peak 1), 402 °C (Peak 2), 587 °C (Peak 3), and 653 °C (Peak 4), respectively. It was obvious that the medium strong acid sites and the strong acid sites were enriched in the Mn−Co/TiO2 sample, which were positive to form more abundant Brønsted acid sites and Lewis acid sites promoting NH3 adsorption on the nanocatalyst surface [38,39].
The quantitative comparation of the total acid capacity between the Mn−Co/TiO2 and Mn−Fe/TiO2 nanocatalysts was performed and summarized in Table 3. The Mn−Co/TiO2 sample achieved larger total NH3 desorption of 1.44 mmol·g−1 than Mn−Fe/TiO2, which further confirmed the superior enhancement of MnCoOx on the surface acidity than MnFeOx. Although the Mn−Fe/TiO2 sample generated weak acid sites at the lower temperature, the NH3 desorption on the weak acid sites was only 0.14 mmol·g−1, which was too little to offer enough NH3 for SCR process. However, it was reported that NH3 could restrain the adsorption and activation of NO onto the active sites on catalyst surface via the undesirable electron transfer between the adsorbed NH3 and the metal sites [40]. Consequently, the excessive adsorbed NH3 could inhibit SCR reactions. Therefore, the surface acidity properties of the Mn−Co/TiO2 and Mn−Fe/TiO2 nanocatalysts were bound up with their reducibility properties.

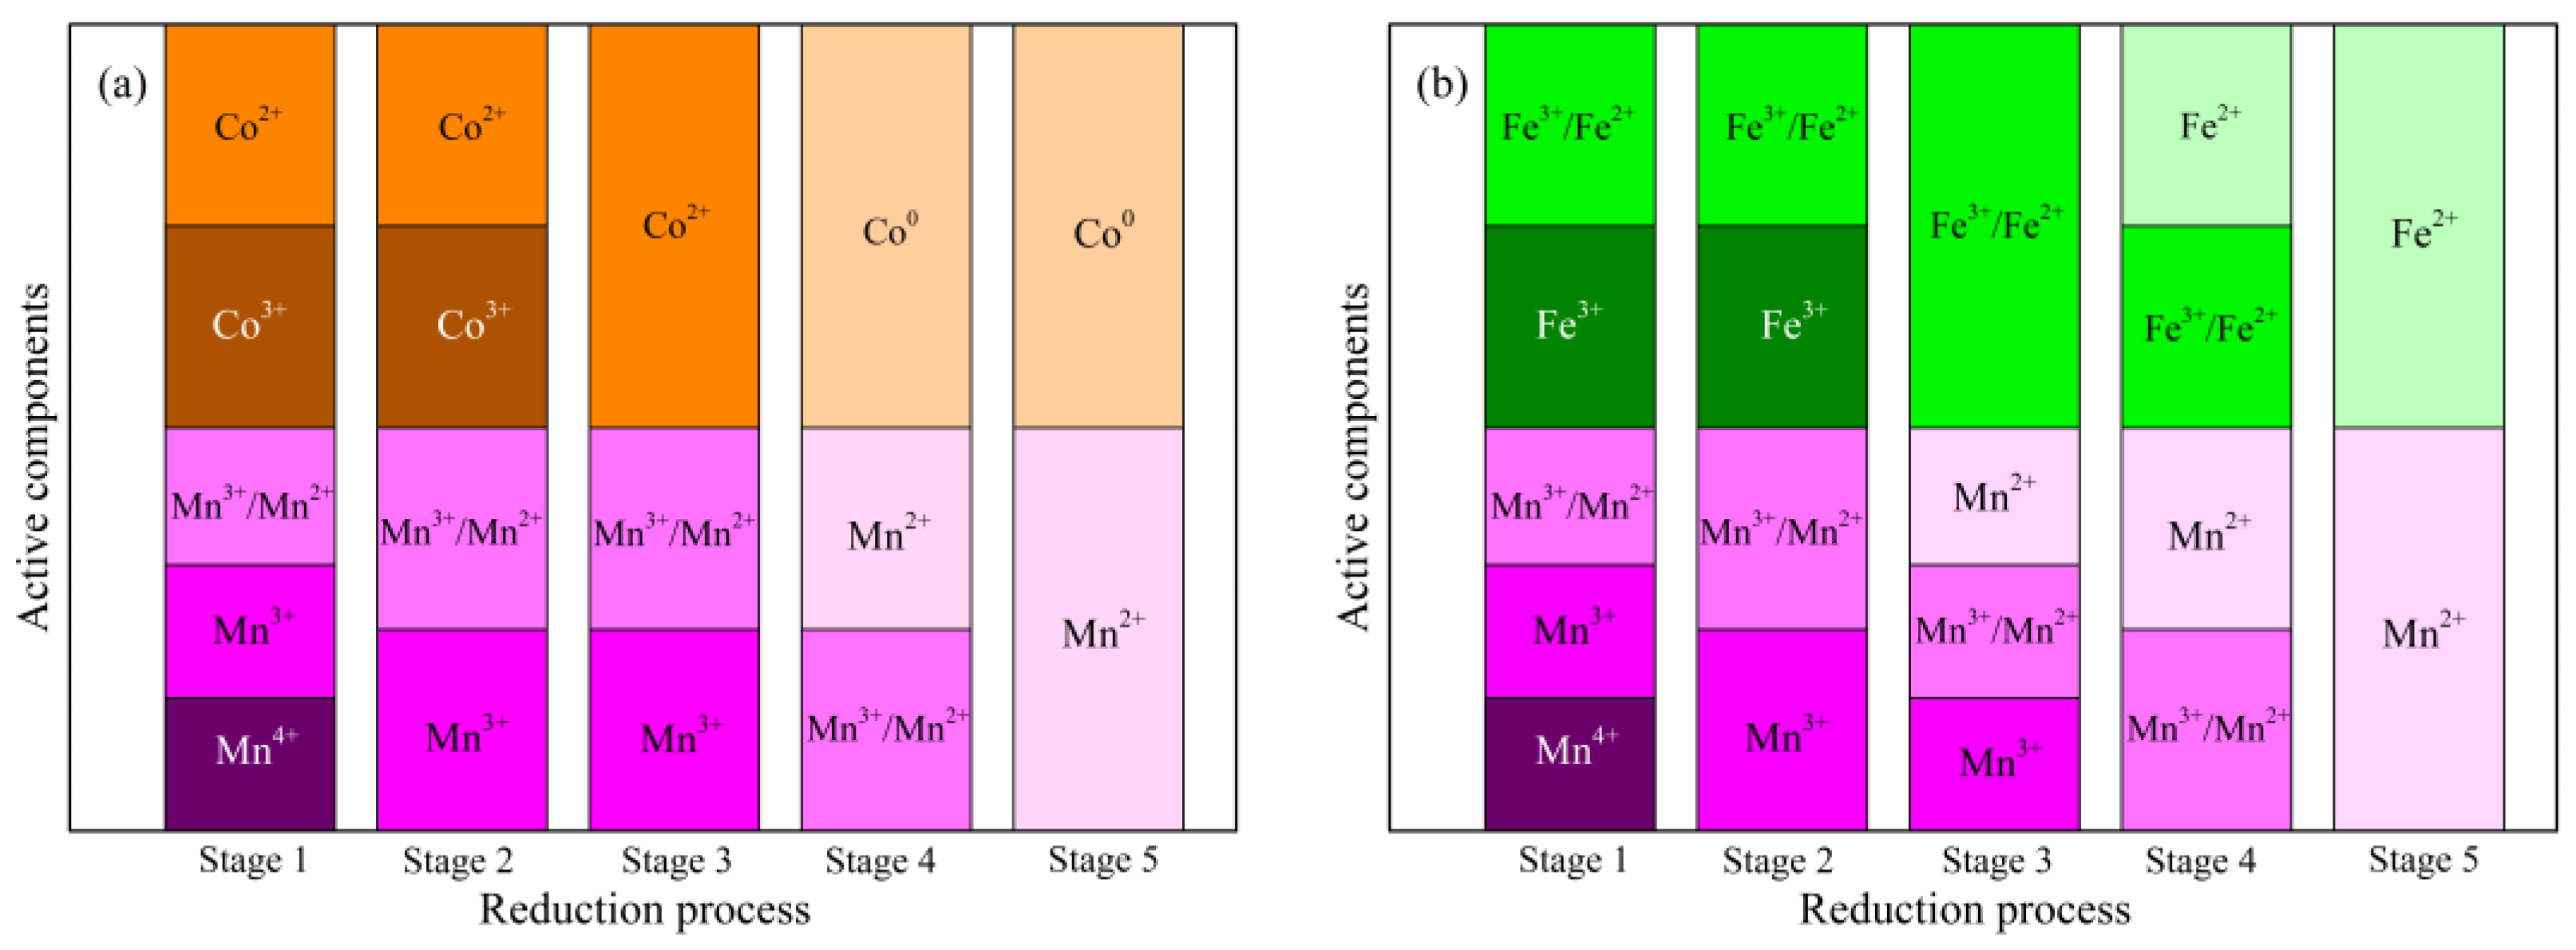
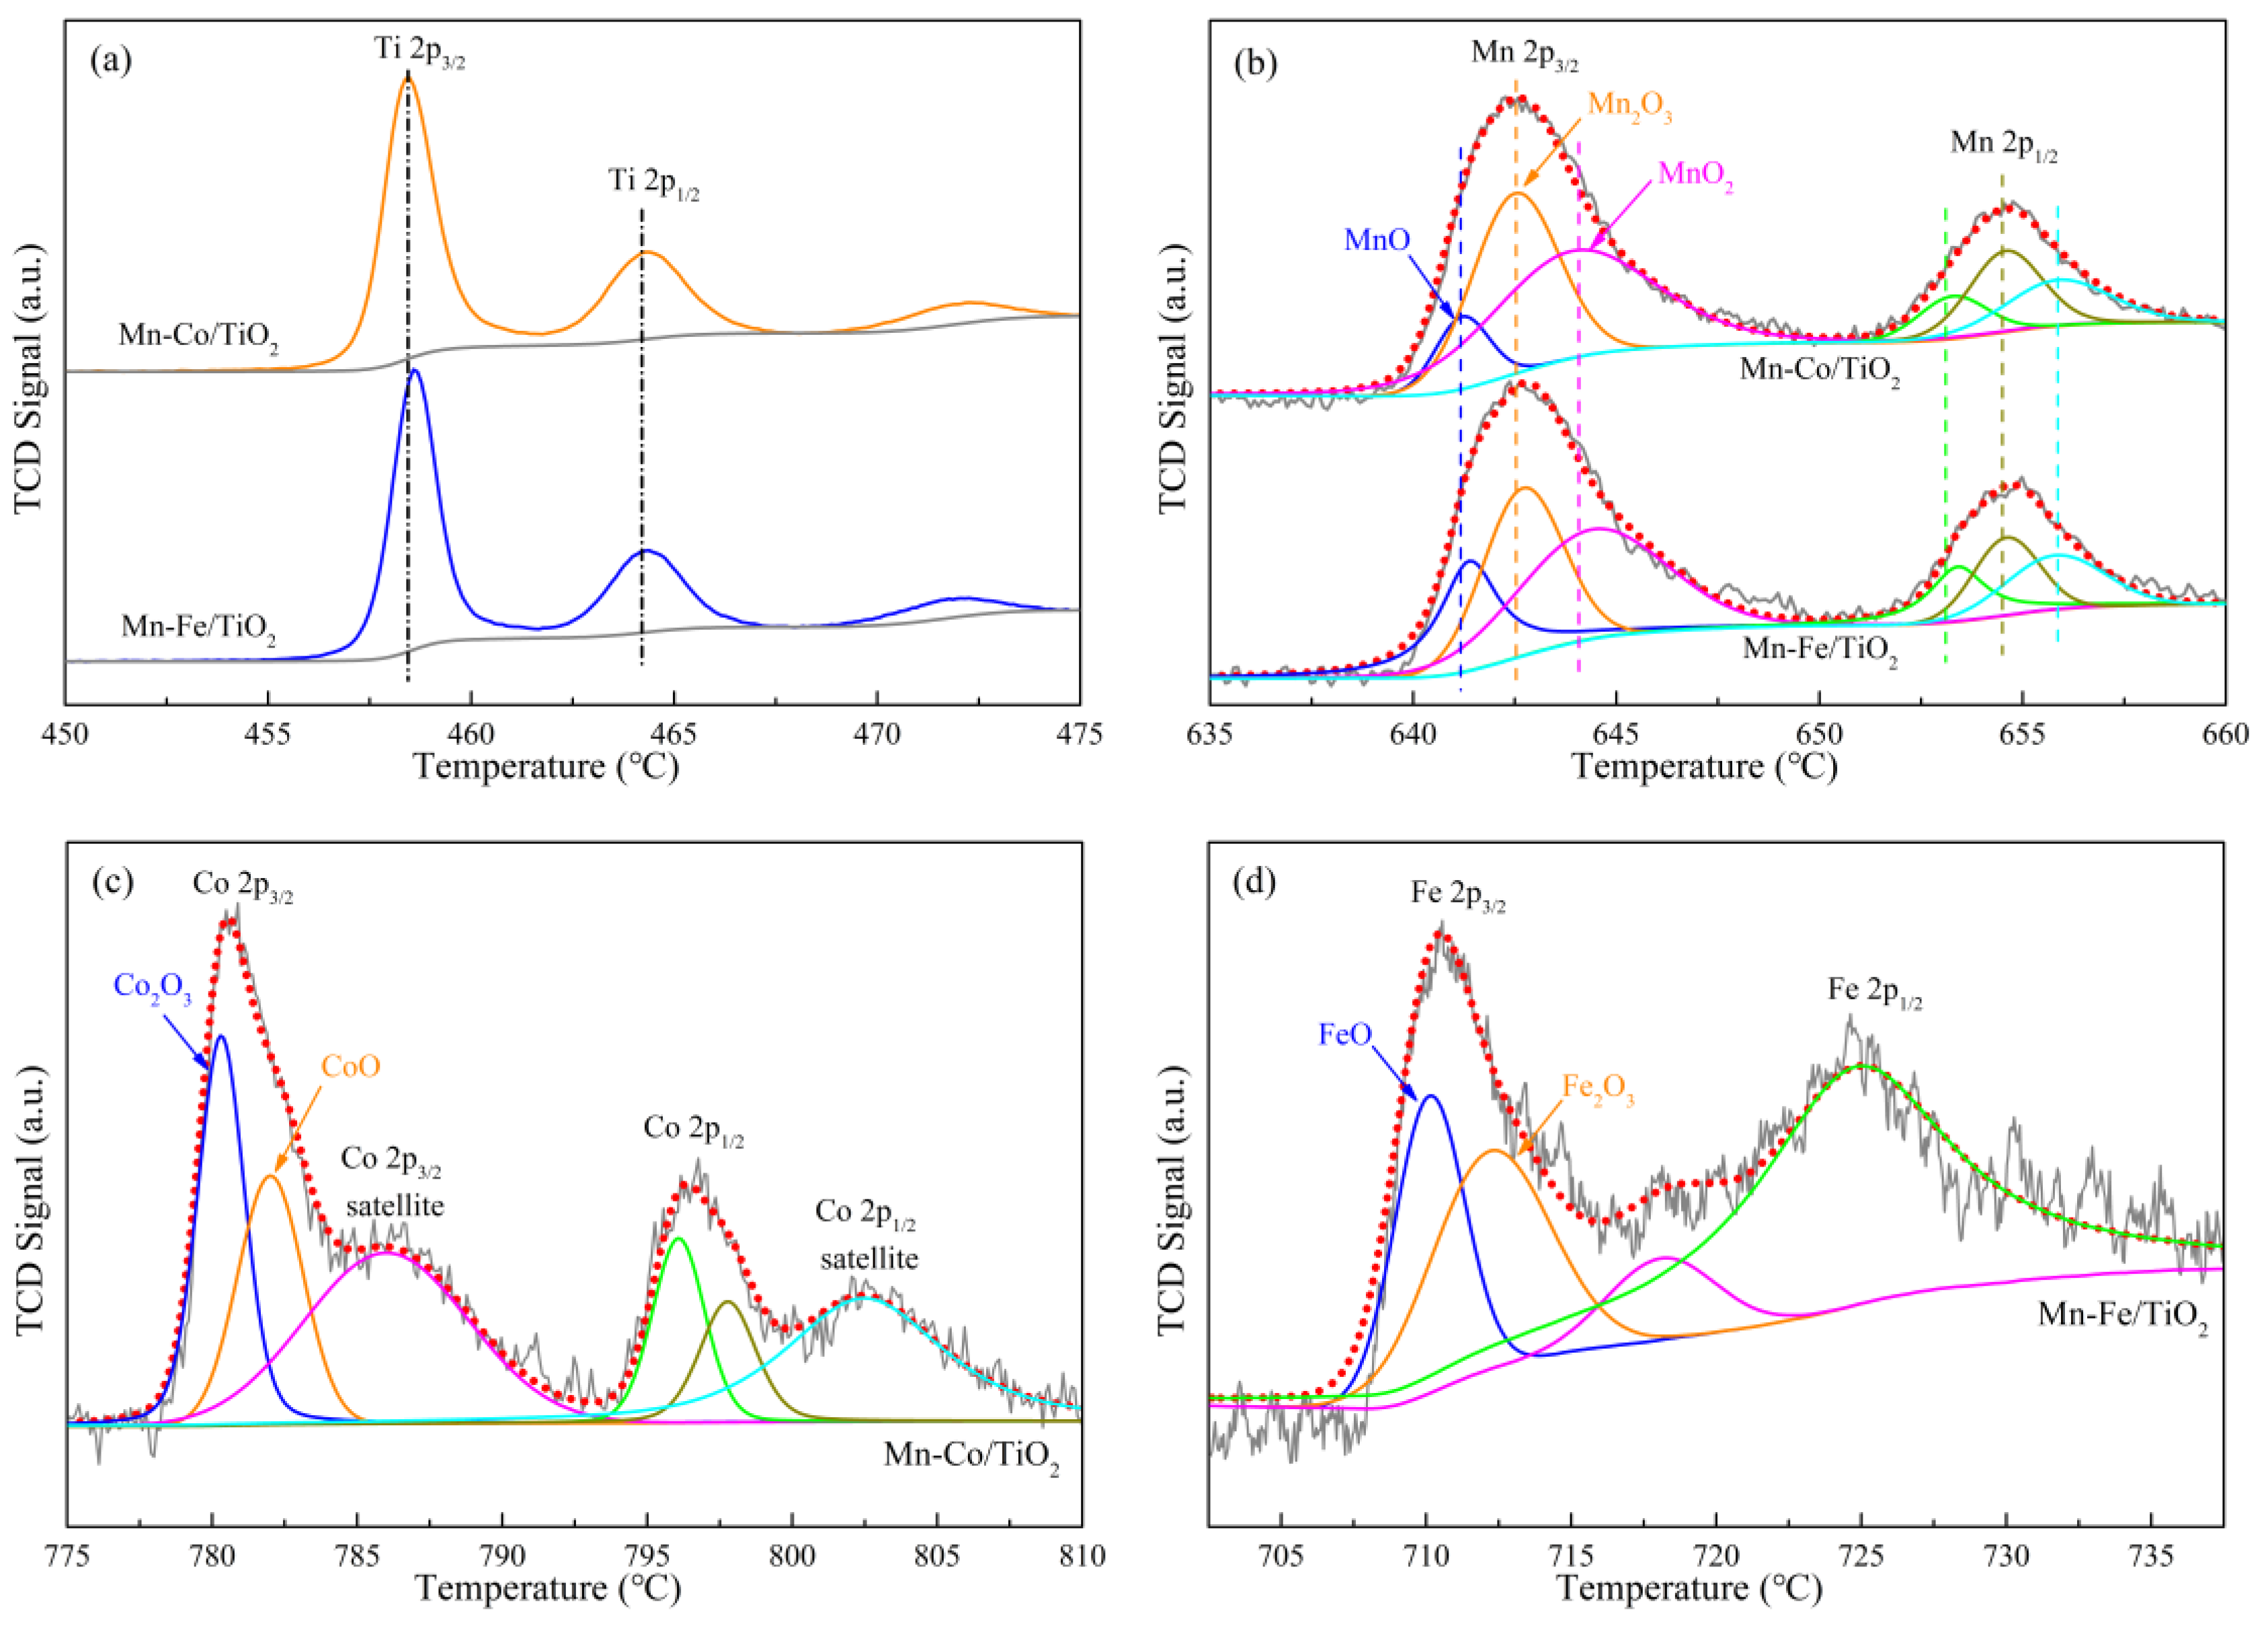
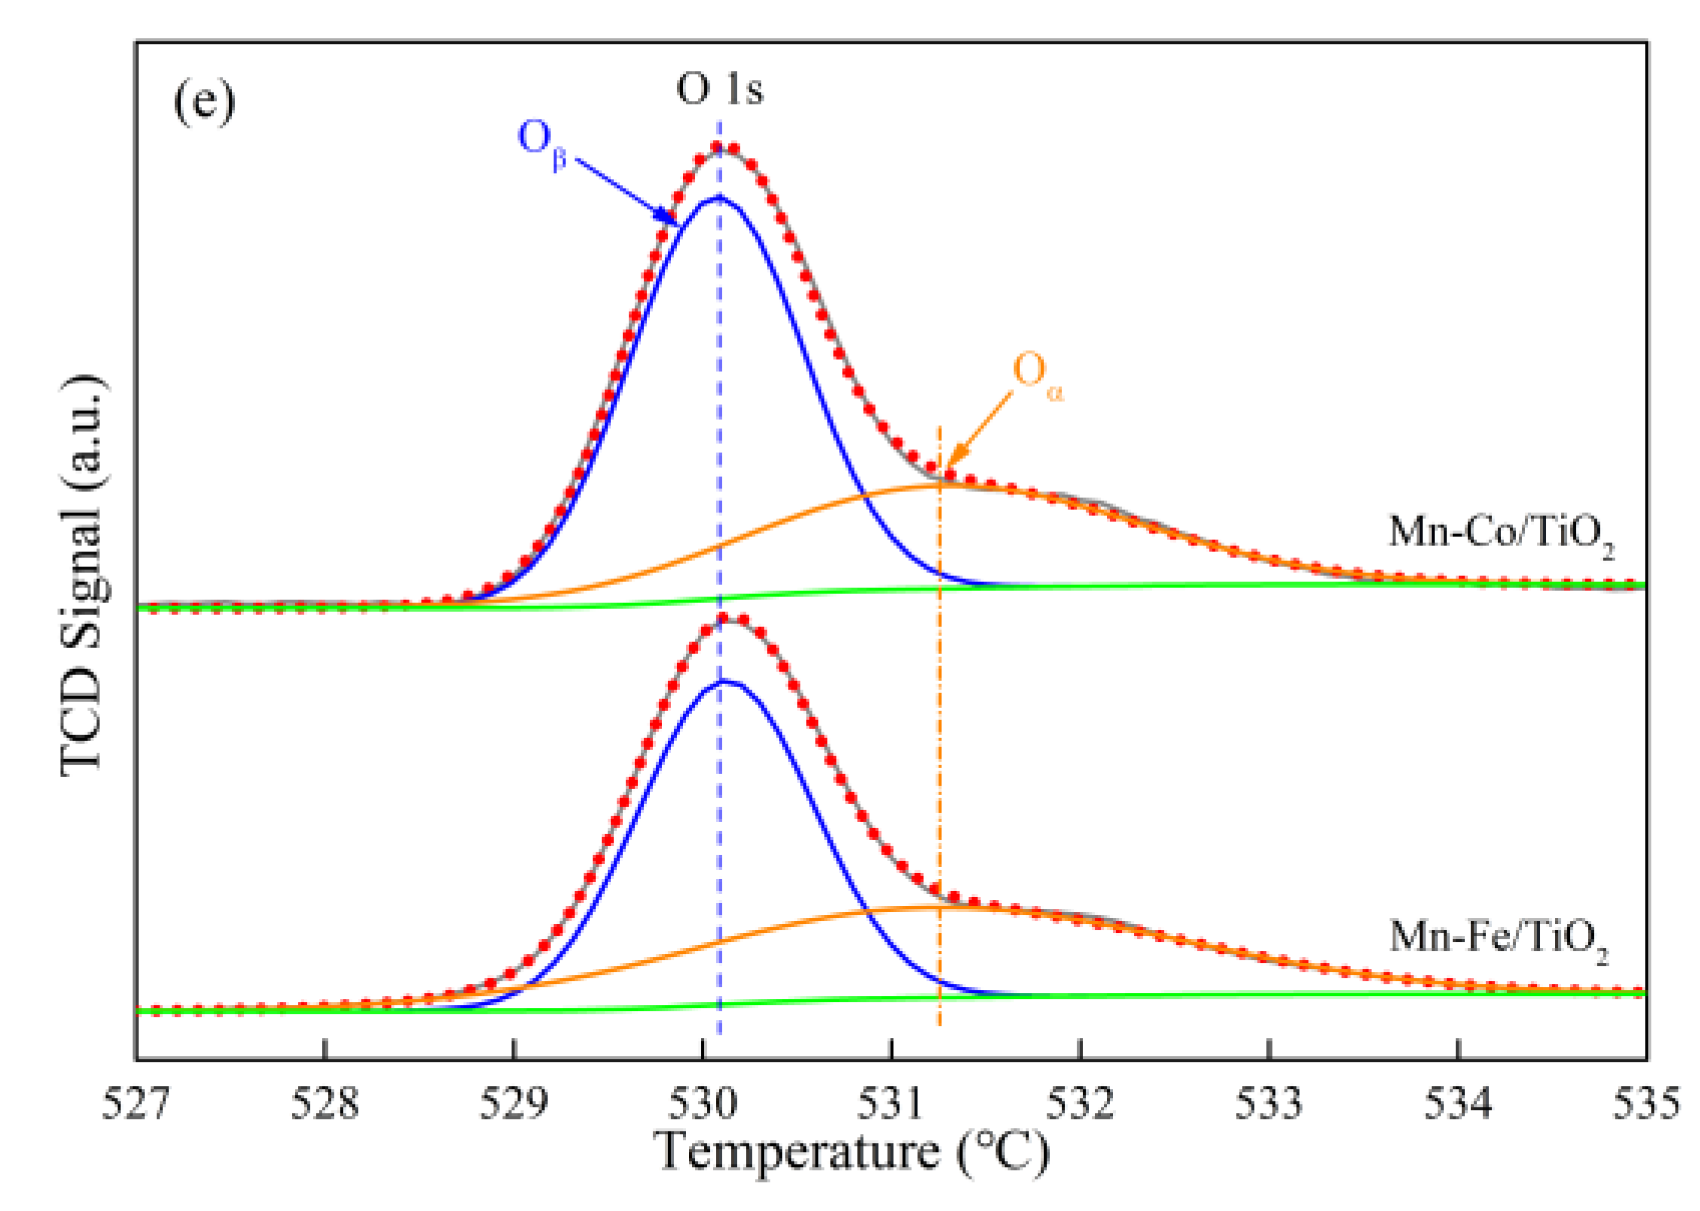
2.1.6. Oxidation States of Active Species

In order to better understand the oxidation states and the atomic concentrations of active species on the surface of Mn−Co/TiO2 and Mn−Fe/TiO2 nanocatalysts, the XPS spectra of Ti 2p, Mn 2p, Co 2p, Fe 2p, and O 1 s were tested and numerically analyzed by Gaussian fitting, respectively, as shown in Figure 6. The binding energy and atomic concentration of each element was summarized in Table 4.
As shown in Figure 8a, the XPS spectrum of Ti 2p was consisted of two characteristic peaks, attributed to Ti 2p1/2 at around 464.3 eV and Ti 2p3/2 at about 458.7 eV, respectively [41]. It was obvious that Ti4+ ion was stabilized on the catalyst surface and appeared as the dominating state in the nanocatalysts of Mn−Co/TiO2 and Mn−Fe/TiO2. The XPS spectra of Mn 2p was composed of Mn 2p1/2 peak at about 653 eV and Mn 2p3/2 peak at around 642 eV [42], as exhibited in Figure 6b. The Mn 2p3/2 peak could be further split into three peaks for Mn2+ at 641.2 ± 0.3 eV, Mn3+ at 642.6 ± 0.2 eV, and Mn4+ at 644.1 ± 0.5 eV, respectively, according to the multi-peaks Gaussian fitting results [43]. It is evidently difficult to distinguish the three valence states of manganese in MnOx with the binding energy difference value less than 3.7 eV. For accurate comparison of the atomic concentration of Mnn+ on the surface of Mn−Co/TiO2 and Mn−Fe/TiO2 nanocatalysts, a quantitative analysis was performed according to the integral area under every divided peak, as exhibited in Table 4. It was widely accepted that the catalytic ability of MnOx ranked as: MnO2 > Mn2O3 > Mn3O4 [12,22,30]. The abundant MnO2 generated on the nanocatalyst surface was beneficial to SCR reactions [5]. As listed in Table 4, the major amount of manganese in both Mn−Co/TiO2 and Mn−Fe/TiO2 nanocatalysts was Mn4+. Meanwhile, the Mn4+/Mnn+ atomic composition was 46.8 % in Mn−Co/TiO2 sample higher than that of 40.2 % in Mn−Fe/TiO2 sample, generating more lattice oxygen and plenty of oxygen vacancy on the catalyst surface [1], which was regarded as the main reason for higher reducibility properties of Mn−Co/TiO2 sample as discussed above.
In Co 2p spectrum of Mn−Co/TiO2 nanocatalyst, the two individual peaks were attributed to Co 2p1/2 at about 796.5 eV and Co 2p3/2 at around 780.6 eV, respectively. Both of these two main peaks had satellite peaks at 803.1 eV and 786.8 eV, correspondingly, as shown in Figure 6c. The gentler and broader satellite peaks appeared at relatively higher binding energy, which were introduced by the metal-to-ligand electron transfer or the shakeup process of cobalt in its high spin state. However, this shakeup process was only observed with the high spin state of Co2+ ion, but did not appear with the diamagnetic low-spin Co3+ ion [13]. The intense peak of Co 2p3/2 was composed of two overlapped peaks, one attributed to Co3+ seated at about 780.0 eV and the other ascribed Co2+ and located at around 781.6 eV. These two distinguishing peaks indicated the co-occurrence of cobalt in +2 and +3 valence states on the Mn−Co/TiO2 nanocatalyst surface. There was a dynamic equilibrium sustained on the nanocatalyst surface with the electron transfer between Mn and Co ions during the catalytic oxidation process, expressed as Co3+ + Mn3+ Co2+ + Mn4+ [44]. Moreover, Co3+ species were exhibited as the major atomic concentration of 60.7%, which were at the comparatively higher valence state of Con+ generating vast anionic defects, forming abundant surface oxygen and facilitating adsorption and oxidation during SCR process [45].
In Fe 2p spectra of the Mn−Fe/TiO2 nanocatalyst, as shown in Figure 6d, the two main peaks were ascribed to Fe 2p1/2 at about 724 eV and Fe 2p3/2 at around 710 eV. There was a satellite peak at 718.3 eV assigned to Fe3+ in Fe2O3 [46]. The XPS spectra of Fe 2p3/2 was composed of two characteristic peaks, ascribed to Fe3+ at around 711.6 eV and Fe2+ at about 709.6 eV, which meant these two kinds of Fen+ coexisted on the surface of the Mn−Fe/TiO2 nanocatalyst. It was proposed that the promotion effect between manganese and iron was attributed to the electron transfer in the redox reaction: Mn3+ + Fe3+ Mn4+ + Fe2+ [47].
The O 1 s spectrum of Mn−Co/TiO2 and Mn−Fe/TiO2 nanocatalysts were compared in Figure 6e, which was composed of the chemisorbed oxygen peak at 531.2–531.6 eV (Oα) and the lattice oxygen peak at 530.2–530.3 eV (Oβ). According to the curve-fitting results, the binding energy of Oα shifted to higher values from 531.4 eV in Mn−Co/TiO2 sample to 531.6 eV in Mn−Fe/TiO2 sample. Meanwhile, the similar changes happened to the binding energy of Oβ. It was believed that the chemisorbed oxygen (Oα) was the most active oxygen species owing to its high mobility [48]. On the surface of Mn−Co/TiO2 nanocatalyst, the atomic concentration of Oα reached 33.7% much higher than that of Mn−Fe/TiO2 sample, which was regarded as another reason for its superior redox ability.

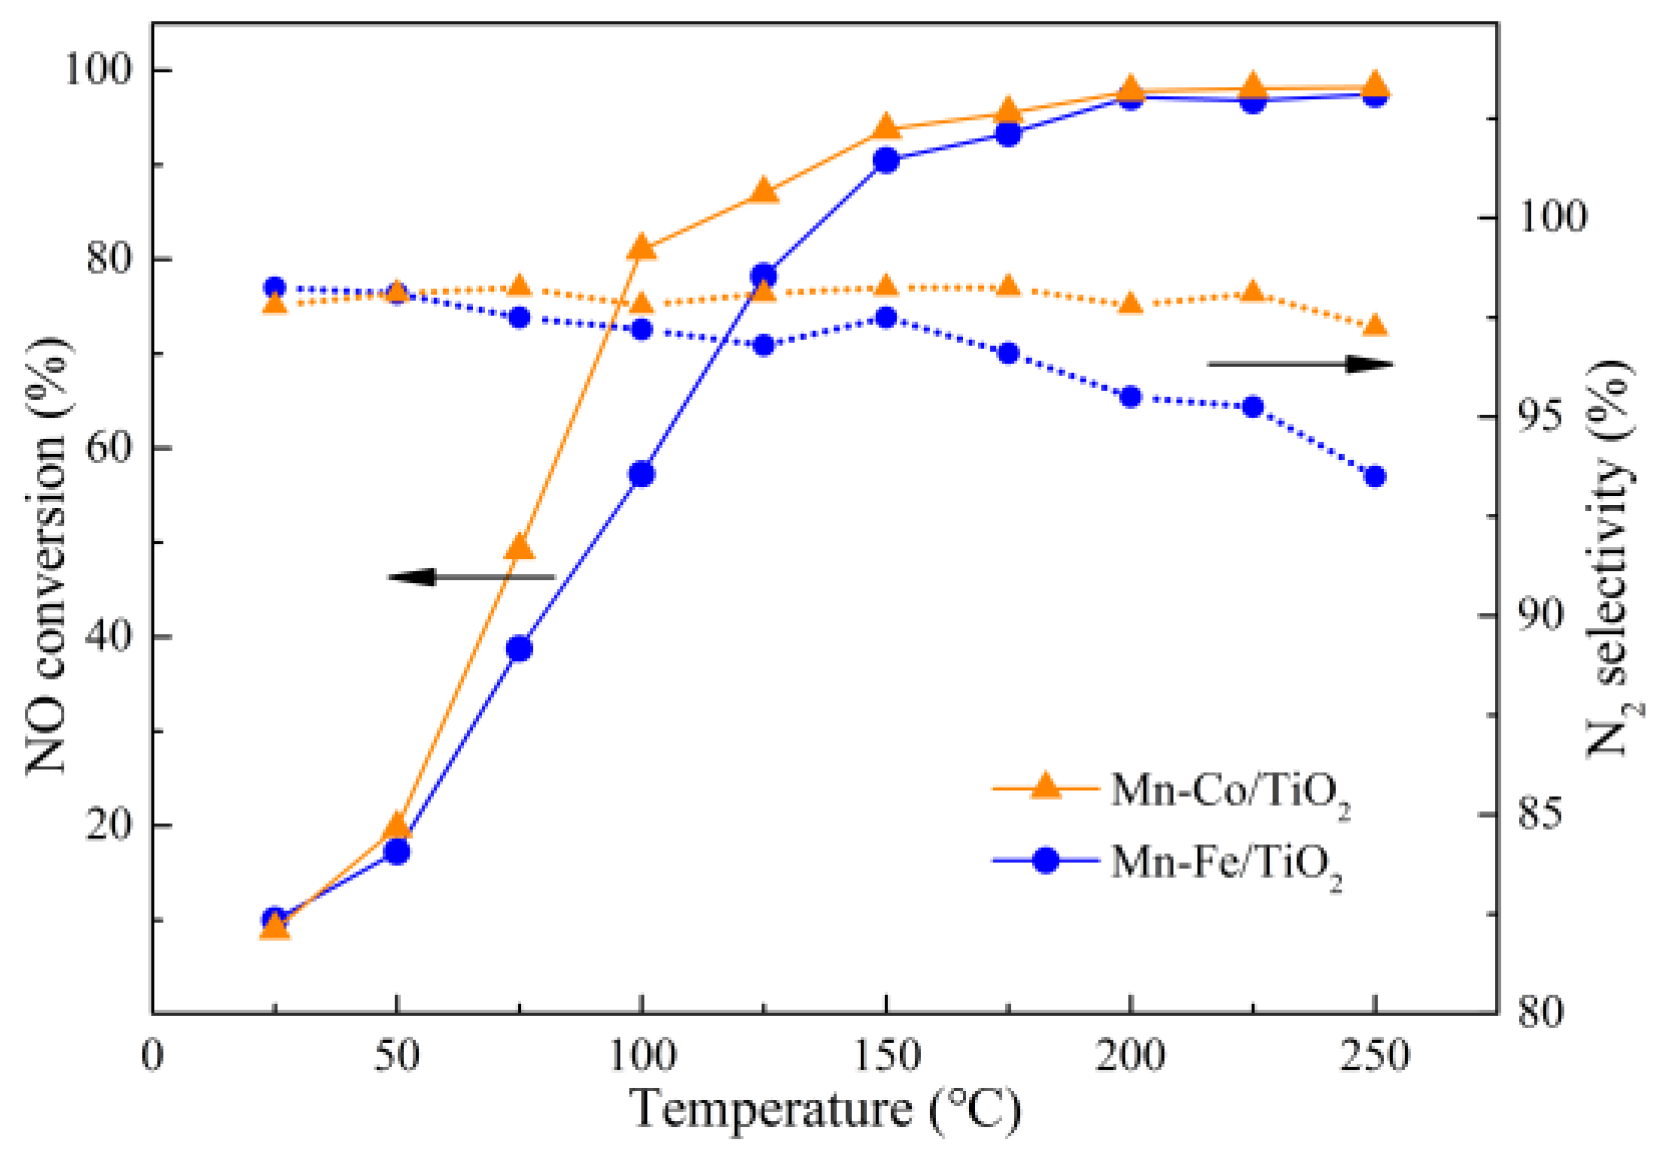
2.2. Catalytic Performance

Figure 7 exhibited the NO conversion and catalytic selectivity over Mn−Co/TiO2 and Mn−Fe/TiO2 nanocatalysts. It can be seen that the NO conversion improved conspicuously with the temperature increasing from 25 °C to 250 °C. For both Mn−Co/TiO2 and Mn−Fe/TiO2 nanocatalysts, the satisfactory conversion (>90%) was obtained above 150 °C. Meanwhile, the Mn−Ce/TiO2 nanocatalyst exhibited higher catalytic activity than the Mn−Fe/TiO2 sample within the temperature range of 50–175 °C. Furthermore, the catalytic selectivity of Mn−Ce/TiO2 nanocatalyst was higher than that of Mn−Fe/TiO2 within 75–250 °C. Therefore, both the catalytic activity and the catalytic selectivity over Mn−Co/TiO2 were remarkably improved compared to Mn−Fe/TiO2, potentially due to the interaction between manganese and cobalt stronger than that between manganese and iron, which enhanced the generation of Brønsted acid sites and Lewis acid sites on the nanocatalyst surface, resulting in promoting Langmuir–Hinshelwood mechanism reactions and Eley-Rideal mechanism reactions, simultaneously [49].

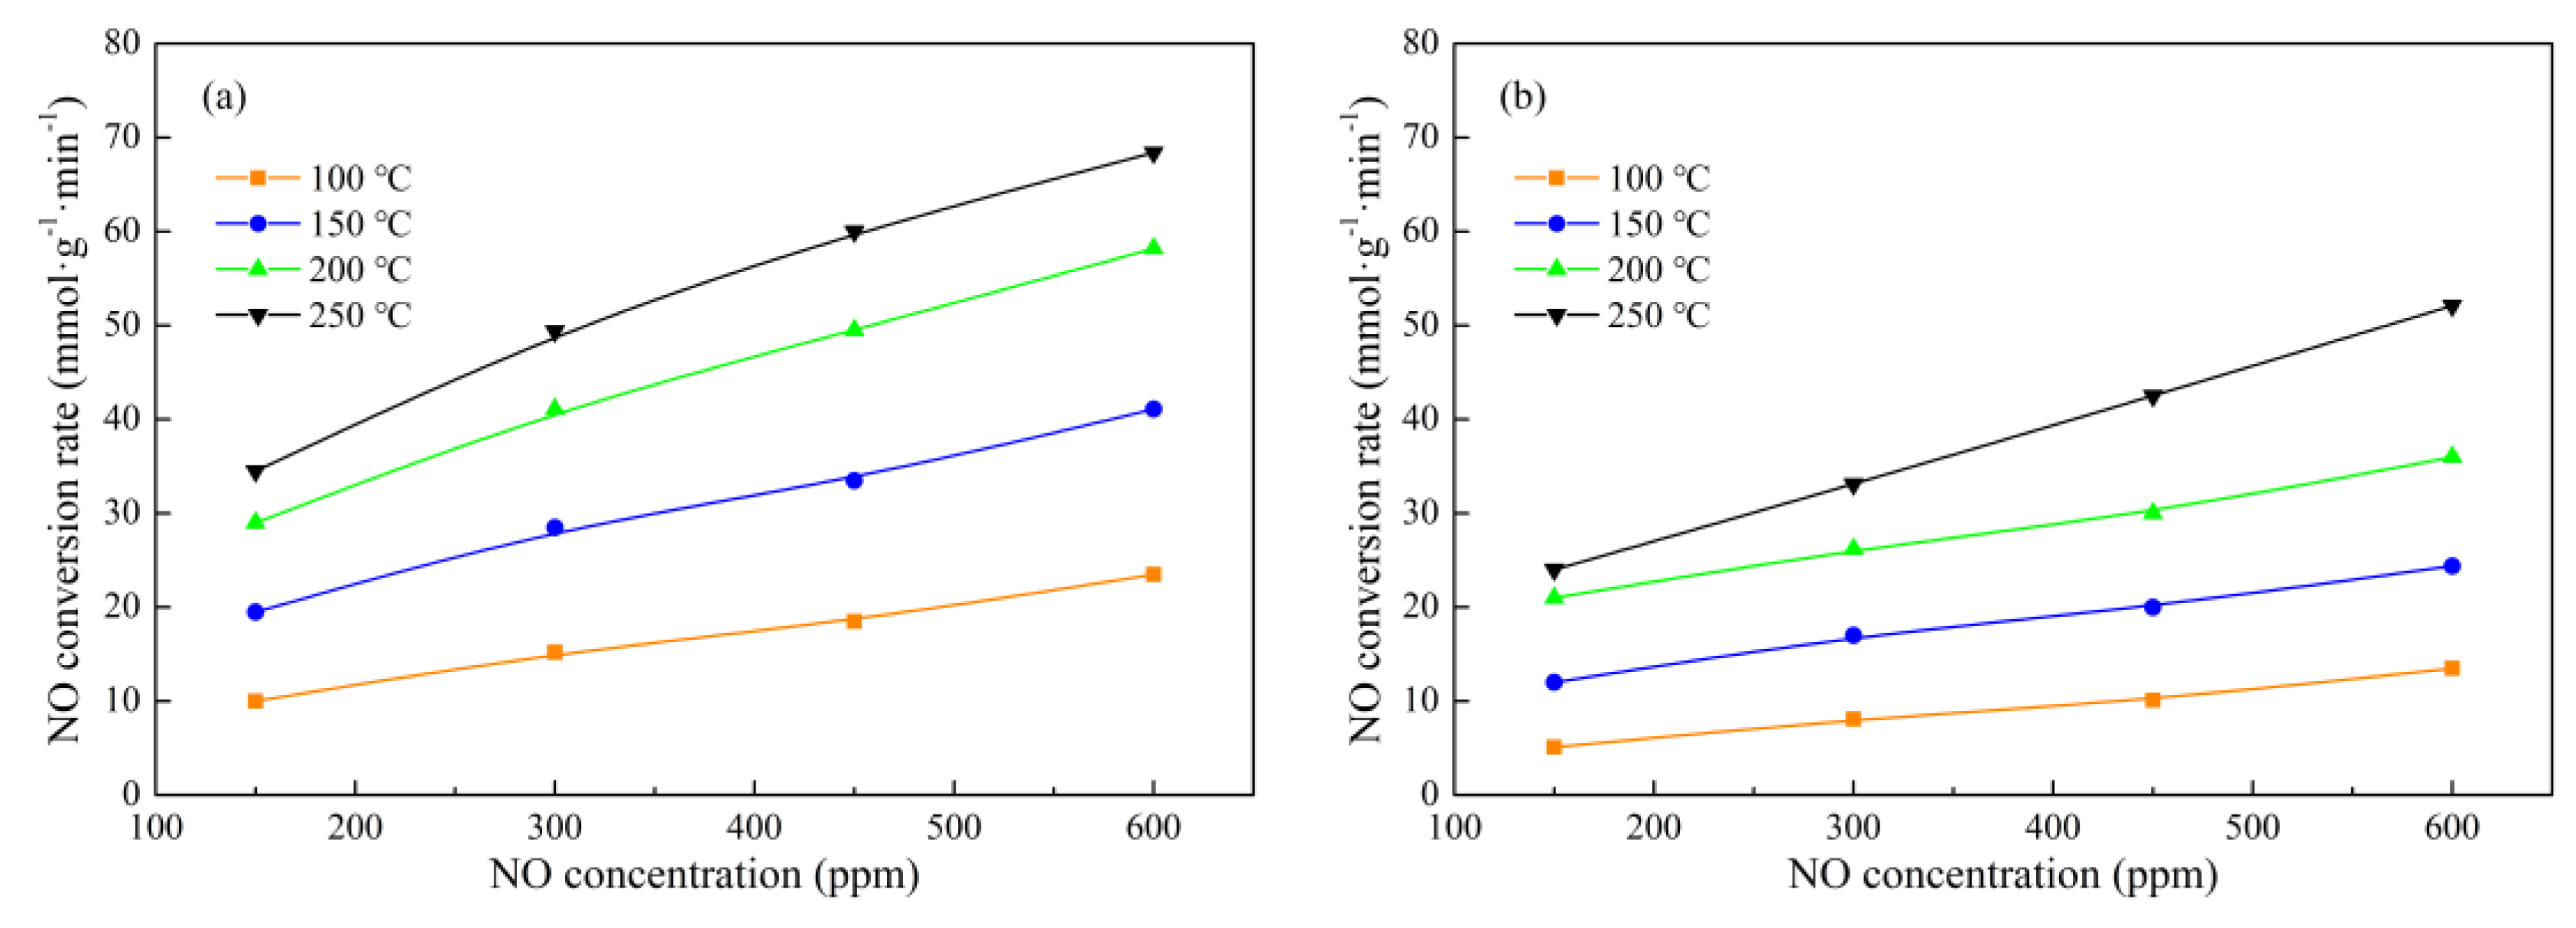
2.3. Reaction Kinetic Study

It was proposed that both the Langmuir–Hinshelwood mechanism and the Eley–Rideal mechanism contributed to the SCR reactions over nanostructured Fe-Mn oxides [36]. According to Langmuir-Hinshelwood mechanism, the SCR reactions over Mn−Co/TiO2 and Mn−Fe/TiO2 nanocatsalysts could be approximately described as:
M n +   =   O   +   NO   ( ad )     M ( n - 1 ) + - O - NO
M ( n - 1 ) + - O - NO   +   NH 3 ( ad )     M ( n - 1 ) + - O - NO - NH 3     M ( n - 1 ) + - OH   +   N 2   +   H 2 O
M ( n - 1 ) + - O - NO   +   O 2     M ( n - 1 ) + - O - NO 2
M ( n - 1 ) + - O - NO   +   NH 3 ( ad )     M ( n - 1 ) + - O - NO 2   -   NH 3     M ( n - 1 ) + - OH   +   N 2 O   +   H 2 O
M ( n - 1 ) + - OH   +   O 2     M n + =   O   +   H 2 O
The adsorbed NO(ad) was oxidized by Mn+ (Mn4+, Mn3+, Co3+, Fe3+) on the nanocatalyst surface to form NO 2 (Reaction 2). The NO 2 reacted with adsorbed NH3(ad) to generate NH4NO2 and decomposed to N2 and H2O, subsequently (Reaction 2). In the meantime, an undesired oxidization reaction occurred on NO 2 which was oxidized to NO 3 under O2 (Reaction 4). The formed NO 3 reacted with adsorbed NH3(ad) to generate NH4NO3 and further decomposed to N2O and H2O (Reaction 5). Finally, the active species M ( n - 1 ) +   -   OH was oxidized by O2 to regenerate M n + =   O (Reaction 6).
According to the Eley-Rideal mechanism, the SCR reactions over Mn−Co/TiO2 and Mn−Fe/TiO2 nanocatsalysts could be described as:
M n + =   O   +   NH 3 ( ad )     M ( n - 1 ) + - OH   +   NH 2 ( ad )
NH 2 ( ad )   +   NO     N 2   +   H 2 O
The adsorbed NH3(ad) on the nanocatalyst surface was activated by Mn+ to generate NH2 (Reaction 7). Then, the NH2 reacted with NO to form N2 and H2O (Reaction 8).
However, in addition to the main Eley-Rideal mechanism reactions, undesirable side reactions occurred on the active species of M n + =   O .
M n + =   O   +   NH 2 ( ad )     M ( n - 1 ) + - OH   +   NH ( ad )
M n + =   O   +   NH ( ad )   +   NO     M ( n - 1 ) + - OH   +   N 2 O
M n + =   O   +   NH ( ad )   +   O 2     M ( n - 1 ) + - OH   +   NO
The activated NH2(ad) formed in Reaction 7 was further oxidized to NH(ad) over M n + =   O . Then NH(ad) reacted with NO to form N2O or react with O2 to generate NO.
According to Reactions 3 and 8, the kinetic equations of N2 formation rates via the Langmuir-Hinshelwood mechanism and the Eley-Rideal mechanism could be described as:
k scr   =   d [ N 2 ] dt   =   d [ N 2 ] d t | LH + d [ N 2 ] d t | ER =   d [ M ( n 1 ) + - O - NO - NH 3 ] d t | LH d [ N H 2 ( a d ) ] d t | ER =   k 3 [ M ( n - 1 ) + - O - NO - NH 3 ]   +   k 8 [ NH 2 ( ad ) ] [ NO ]
where k3 and k8 were the kinetic constants of Reactions 3 and 8,   [ M ( n 1 ) + - O - NO - NH 3 ] , [ NH 2 ( ad ) ] , and [ NO ] were the concentrations of NH4NO2, NH2(ad), and NO, respectively. When the reactions above reached stable conditions, the concentrations of NH4NO2 and NH2(ad) on the surface of Mn−Co/TiO2 and Mn−Fe/TiO2 nanocatalysts could be regarded as constants without connecting with the gaseous concentrations of NH3 and NO [50]. Therefore, the SCR reaction rate was in a linear relationship with NO concentration as exhibited in Equation (13), the slope and the intercept could be obtained from the linear regression in Figure 8, as listed in Table 5.
k scr   =   k SCR - LH   +   k SCR - ER [ NO ]
k SCR - LH   =   k 3 [ M ( n - 1 ) + - O - NO - NH 3 ]
k SCR - ER   =   k 8 [ NH 2 ( ad ) ]

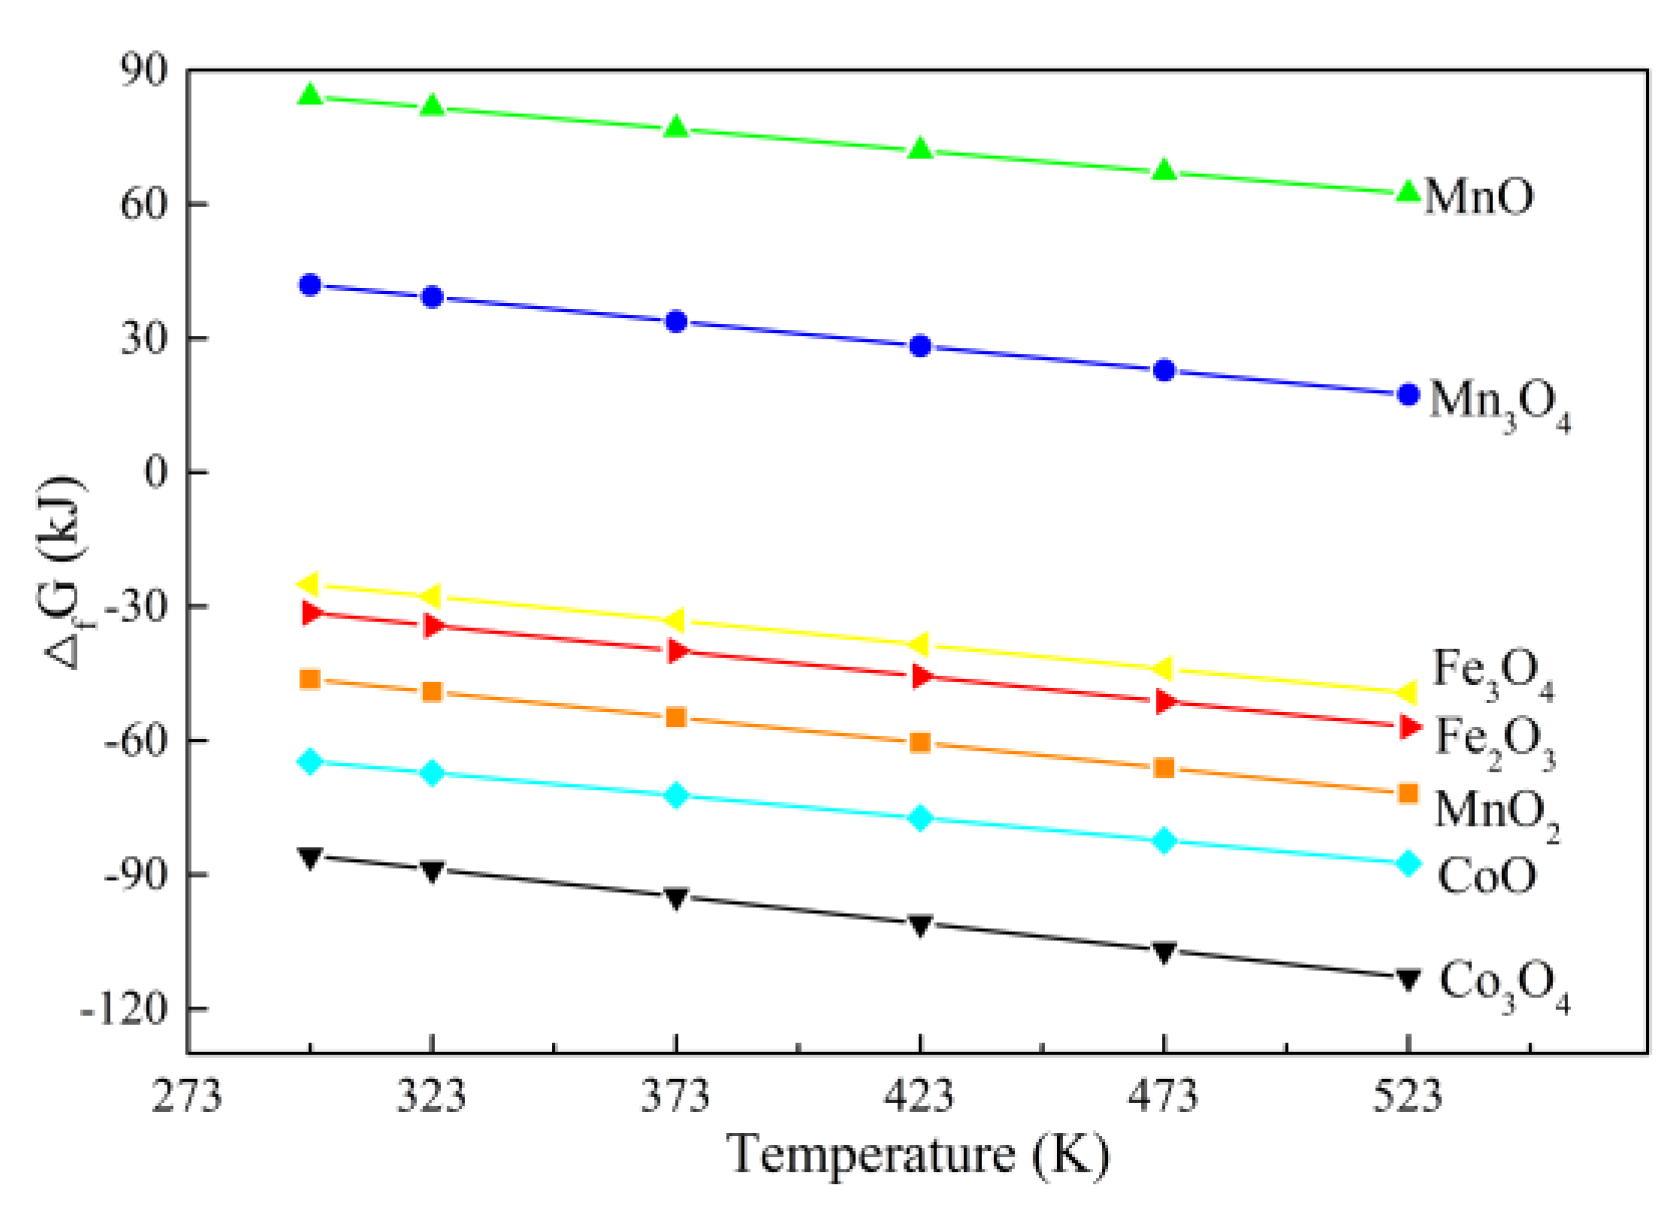
2.4. Thermodynamic Calculation

The standard thermodynamic characteristics of the chemical individual species of MxOy and M in crystalline states, as well as NH3, N2 and H2O in gaseous states, were listed in Table 6. The oxidative capacities of MxOy were evident according to the reliable standard thermodynamic parameters, which was a convincing support for investigating the roles of MxOy in NH3-SCR process. The Gibbs free energies for the reactions between MxOy species and ammonia were calculated for estimating their oxidative capacities according to Equation (16), displayed in Table 7. In order to discuss the reaction mechanism conveniently, simplifying assumptions were introduced as follows. Only the kind of main oxidation state was considered in the thermodynamic calculation, although there were several kinds of oxidation states for each MxOy [51]. Meanwhile, it was assumed that every MxOy was reduced into metal, although the metallic oxide in the high-oxidation state was reduced step-by-step in the actual process. It had been proved that the entropy of metals would vary drastically as the metal physical states transforming [52]. Furthermore, the transformation could bring about the changes of the straight slope of the temperature–Gibbs free energy curve which was named Ellingham diagrams. The Ellingham diagrams were a particular graphical form of the principle that the thermodynamic feasibility of a reaction depends on the Gibbs free energy change (ΔfG0), which could be calculated using Equation (16), where ΔfH0 was the enthalpy change and ΔS0 was the entropy change under standard state.
Δ f G 0   =   Δ f H 0   -   T Δ S 0
The Ellingham diagram plotted ΔfG for each oxidation reaction as a function of temperature. In order to compare different reactions, all ΔfG values referred to the same quantity of oxygen, chosen as one mole O (1/2 mol O2) [53], as shown in Equation (17)
1 y M x O y + 2 3 NH 3 x y M + 1 3 N 2 + H 2 O
According to Equations (16) and (17), the redox reactions that happened between MxOy and NH3 were discussed under thermodynamic calculation, assuming that the enthalpy, entropy, and Gibbs free energy remained unchanged with temperature. The ΔfG in Table 7 for each kind of MxOy was calculated in order to estimate its oxidative capacities and gain semiquantitative conclusions. Meanwhile, this research just focused on the catalytic performance and reaction mechanism of cobalt and iron doped in the Mn/TiO2 nanocatalysts, so that only one MxOy was different at a time. The negative ΔfG values for Co3O4 (the compound of Co2O3 and CoO) and Fe2O3 indicated MxOy was effective for the oxidative abstraction of the hydrogen from adsorbed ammonia [7].
The Ellingham diagrams for the Gibbs free energy of reactions between MxOy and NH3 with the reaction temperature rising was displayed in Figure 9. As the △fG was negative (△fG < 0), the reaction took place more easily. On the contrary, the reaction would happen at higher temperature or would not happen if the △fG was positive (△fG > 0). Under the same reaction temperature, the order of temperature−Gibbs free energy for the reaction between MxOy and NH3 is as follows: Co3O4 (compound of Co2O3 and CoO) < CoO < Fe2O3 < Fe3O4 (only considering the doping transition metals). These results were exactly consistent with the NH3-SCR performance and almost coincided with the data of the nanostructure characterization, as discussed above, which demonstrated the simplifying assumptions used in the thermodynamic calculations was reasonable. However, the activity of MnOx exhibited in Ellingham Diagrams was not in well accord with the reducibility properties, which might be on account of positive kinetics or simplifying assumptions during the thermodynamic calculations [51,53]. It manifested that MnOx, as the dominate phase in nonacatalysts of Mn−Co/TiO2 and Mn−Fe/TiO2, was activated by the doping of cobalt or iron. A large number of researches had been carried out focusing on optimizing catalysts via doping transition metals in order to enhance NO catalytic conversion remarkably. Based on the thermodynamic study, Ellingham diagrams would provide a novel insight for developing catalysts doped proper metal oxides with higher NH3-SCR activity.

3. Materials and Methods

3.1. Catalysts Preparation

The noncatalysts of Mn−Co/TiO2 and Mn−Fe/TiO2 were prepared by hydrothermal method. Co(CH3COO)2·4H2O (analytical pure 99.9%, Kermel, Tianjin, China) and Fe(NO3)3·9H2O (analytical pure 99.9%, Sinopharm, Shanghai, China) were used as the precursors of CoOx and FeOx, respectively. The aqueous solution of Mn(NO3)2 (analytical pure 50.0%, Sinopharm, Shanghai, China) was used as the precursors of MnOx. The tetrabutyl titanate was introduced as the precursors of anatase TiO2 to support the bimetals oxides. The precursors were added into deionized water at room temperature. One-hundred fifty mL glycol was added into the above mixture with magnetic stirring continuously to regulate the reaction rate of hydrothermal reaction. Then the homogeneous solution was heat at 180 °C for 8 h in a Teflon-lined stainless steel autoclave. After that, tetrabutyl titanate was added into the solution and reheated in the autoclave at 180 °C for 3 h. The precipitate was obtained by reduplicative centrifugation and wash. In the end, the nanocatalysts were dried at 150 °C for 12 h and calcined in air at 500 °C for 4 h. The nanocatalyst was denoted as Mn−Co/TiO2 and Mn−Fe/TiO2 with the molar ratios of Mn:M:Ti = 2:1:7.

3.2. Catalysts Characterization

The advanced microstructural image data and the surface element contents of the nanocatalysts was achieved by a high resolution transmission electron microscope JEOL JEM-2010 (Japan electronics corporation, Tokyo, Japan) combined with EDS. The Maxon Tristar II 3020 micropore-size analyzer (Maxon, Chicago, IL, USA) was used for testing N2 adsorption isotherms of the prepared nanocatalysts at −196 °C. The surface areas and the pore-size distributions of the nanocatalysts were measured after the nanocatalysts degassing in vacuum at 350 °C for 10 h. BET plot linear portion was used to determine the nanocatalysts specific surface areas, and the desorption branch with Barrett–Joyner–Halenda (BJH) formula was introduced to calculate the pore-size distributions. The XRD data was captured by a Bruker D8 advance analyzer (Bruker, Frankfurt, Germany) with Mo Kα radiation, diffraction intensity from 10° to 90°, point counting time of 1 s and point counting step of 0.02°. The element phases contained in the nanocatalysts were distinguished by comparing characteristic peaks presented in the XRD patterns with the International Center for Diffraction Data (ICDD). H2-TPR and NH3-TPD tests were performed with a Micromeritics Autochem II 2920 chemical adsorption instrument (Micromeritics, Houston, TX, USA). During H2-TPR experiment, nanocatalysts were pretreatment in He at 400 °C for 1 h, and then cooled to environment temperature in H2 and He gas mixture at 30 mL/min. The test temperature range of H2 consumptions was from 50 °C to 850 °C with the heating rate of 10 °C/min. The operating process of NH3-TPD test was similar to that of H2-TPR test with NH3 replacing H2. XPS analysis was performed on a Thermo ESCALAB 250XI (Thermo Fisher, Boston, MA, USA) with pass energy 46.95 eV, Al Kα radiation 1486.6 eV, X-ray source 150 W, and binding energy precision ±0.3 eV. The C 1 s line at 284.6 eV was measured as a reference.

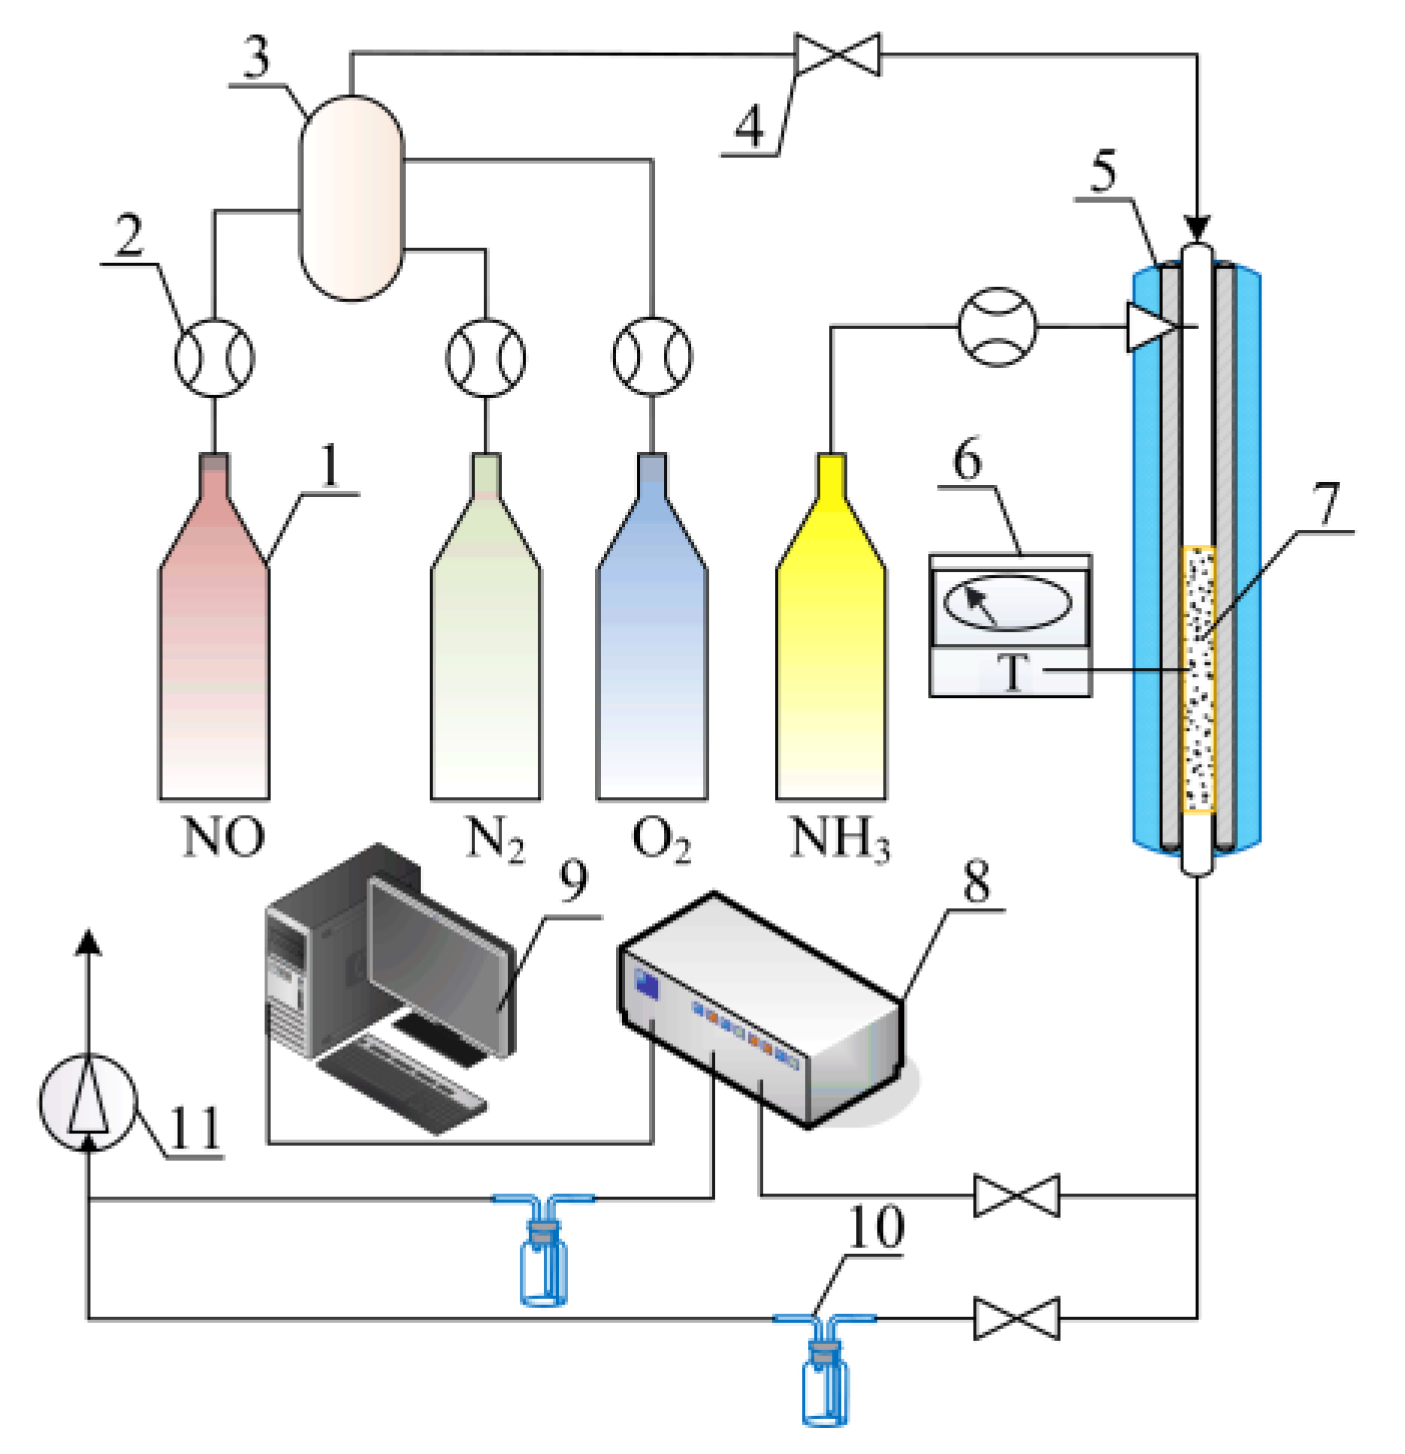
3.3. Catalytic Performance Tests

The catalytic properties of the Mn−Co/TiO2 and Mn−Fe/TiO2 nanocatalysts were tested on a fixed-bed quartz tube reactor including a tube furnace and a temperature control unit, as shown in Figure 10. The mass of the catalyst was 250 mg with the particle diameter of 40–60 mesh. During NO conversion test, 5 mL nanocatalyst with the particle diameter of 40–60 mesh was used under the total flow rate of 2000 mL/min, corresponding to the gas hourly space velocity (GHSV) of 24,000 h−1. The feed gas contained 300 ppm NO, 300 ppm NH3, 5% O2, and N2 as balance gas. During reaction kinetic study, the reaction conditions were NO 150–600 ppm, NH3 600 ppm, O2 5%, catalyst mass of 200 mg, total flow rate at 4000 mL/min, and GHSV at 1 200 000 cm3·g−1·h−1. The concentrations of NO, N2O, and NH3 in the outlet were continually monitored using German MRU MGA-5 analyzer (MRU, Berlin, Germany) joint with an external special detector for N2O and NH3. The NO conversion was calculated according to Equation (18). The N2 selectivity was calculated by the concentrations of N2O and NO, as show in Equation (19). Each experiment was repeated three times to confirm the results accuracy.
NO   conversion   =   ( [ NO ] in   -   [ NO ] out [ NO ] in ) × 100 %
  N 2   selectivity = 1   -   2 [ N 2 O ] out [ NO ] in   -   [ NO ] out × 100 %

4. Conclusions

The multiple characterizations performed on the Mn−Co/TiO2 and Mn−Fe/TiO2 nanocatalysts indicated that the Mn−Co/TiO2 sample obtained the superior structure characteristics than Mn−Fe/TiO2 with the surface area increased by 85.3 m2·g−1, the nanoparticle size reduced by 21.79 nm, the active components distribution improved, and the crystallinity decreased. Meanwhile, these results further confirmed the catalytic property was highly dependent on the phase compositions of the catalysts. The ratios of Mn4+/Mnn+ in the Mn−Co/TiO2 sample was 46.8% higher than that of 40.2% in the Mn−Fe/TiO2 sample, which demonstrated the better oxidation ability and the larger amount of Bronsted acid sites and Lewis acid sites on the sample surface. Both Mn−Co/TiO2 and Mn−Fe/TiO2 nanocatalysts exhibited the satisfactory conversion (>90%) above 150 °C. When compared to the Mn−Fe/TiO2 nanocatalyst, the Mn−Ce/TiO2 sample displayed the preferable catalytic property with higher catalytic activity and stronger selectivity in the temperature range of 75—250 °C. In the meantime, the mechanism and kinetic study showed that Langmuir-Hinshelwood mechanism and Eley-Rideal mechanism reactions contributed to NH3-SCR catalysis, simultaneously. Under the same test conditions, the NO conversion rate of Mn−Co/TiO2 nanocatalyst was always higher than that of Mn−Fe/TiO2 sample. Furthermore, Ellingham Diagrams of Mn−Co/TiO2 and Mn−Fe/TiO2 nanocatalysts were in accordance with their catalytic performances, based on the Gibbs free energy calculation of the reactions between ammonia and each kind of active metal oxide. Generally, Mn−Co/TiO2 nanocatalyst exhibited the better catalytic properties than Mn−Fe/TiO2 sample according to the comprehensive comparison in this research. The comparison with the insight from structure, performance, kinetics, and thermodynamics might supply a theoretical method to select superior metal oxides for NH3-SCR.

Author Contributions

Conceptualization, Y.G.; Funding acquisition, Y.G., T.L.; Methodology, Y.G., T.L. Project administration, Y.G.; Writing—original draft, Y.G.; Writing—review & editing, T.L.; Data curation, S.Z., W.J., W.F., H.J.

Funding

This work was supported by Shandong Provincial Science and Technology Development Plan (2011GSF11716), Doctoral research fund project of Shandong Jianzhu university (XNBS1835), Shandong Jianzhu university open experimental project (2018yzkf023, 2018wzkf013), and the Shandong electric power engineering consulting institute science and technology project (37-K2014-33).

Conflicts of Interest

The authors declare no conflict of interest.

References

  1. France, L.J.; Yang, Q.; Li, W.; Chen, Z.; Guang, J.; Guo, D.; Wang, L.; Li, X. Ceria modified FeMnOx —Enhanced performance and sulphur resistance for low-temperature SCR of NOx. Appl. Catal. B Environ. 2017, 206, 203–215. [Google Scholar] [CrossRef]
  2. Gillot, S.; Tricot, G.; Vezin, H.; Dacquin, J.-P.; Dujardin, C.; Granger, P. Induced effect of tungsten incorporation on the catalytic properties of CeVO4 systems for the selective reduction of NOx by ammonia. Appl. Catal. B Environ. 2018, 234, 318–328. [Google Scholar] [CrossRef]
  3. Liu, J.; Li, X.; Zhao, Q.; Ke, J.; Xiao, H.; Lv, X.; Liu, S.; Tadé, M.; Wang, S. Mechanistic investigation of the enhanced NH3-SCR on cobalt-decorated Ce-Ti mixed oxide: In situ FTIR analysis for structure-activity correlation. Appl. Catal. B Environ. 2017, 200, 297–308. [Google Scholar] [CrossRef]
  4. Gao, Y.; Luan, T.; Lu, T.; Cheng, K.; Xu, H. Performance of V2O5-WO3-MoO3/TiO2 Catalyst for Selective Catalytic Reduction of NOx by NH3. Chin. J. Chem. Eng. 2013, 21, 1–7. [Google Scholar] [CrossRef]
  5. Huang, J.; Huang, H.; Jiang, H.; Liu, L. The promotional role of Nd on Mn/TiO2 catalyst for the low-temperature NH3 -SCR of NOx. Catal. Today 2018, 411, 338–346. [Google Scholar] [CrossRef]
  6. Zhang, R.; Yang, W.; Luo, N.; Li, P.; Lei, Z.; Chen, B. Low-temperature NH3-SCR of NO by lanthanum manganite perovskites: Effect of A-/B-site substitution and TiO2/CeO2 support. Appl. Catal. B Environ. 2014, 146, 94–104. [Google Scholar] [CrossRef]
  7. Fang, D.; He, F.; Mei, D.; Zhang, Z.; Xie, J.; Hu, H. Thermodynamic calculation for the activity and mechanism of Mn/TiO2 catalyst doped transition metals for SCR at low temperature. Catal. Commun. 2014, 52, 45–48. [Google Scholar] [CrossRef]
  8. Qiu, M.; Zhan, S.; Yu, H.; Zhu, D. Low-temperature selective catalytic reduction of NO with NH3 over ordered mesoporous MnxCo3−xO4 catalyst. Catal. Commun. 2015, 62, 107–111. [Google Scholar] [CrossRef]
  9. Zhou, C.; Zhang, Y.; Wang, X.; Xu, H.; Sun, K.; Shen, K. Influence of the addition of transition metals (Cr, Zr, Mo) on the properties of MnOx –FeOx catalysts for low-temperature selective catalytic reduction of NOx by Ammonia. J. Colloid Interface Sci. 2013, 392, 319–324. [Google Scholar] [CrossRef]
  10. Wang, R.; Wu, X.; Zou, C.; Li, X.; Du, Y. NOx Removal by Selective Catalytic Reduction with Ammonia over a Hydrotalcite-Derived NiFe Mixed Oxide. Catalysts 2018, 8, 384. [Google Scholar] [CrossRef]
  11. Li, W.; Guo, R.-T.; Wang, S.-X.; Pan, W.-G.; Chen, Q.-L.; Li, M.-Y.; Sun, P.; Liu, S.-M. The enhanced Zn resistance of Mn/TiO2 catalyst for NH3 -SCR reaction by the modification with Nb. Fuel Process. Technol. 2016, 154, 235–242. [Google Scholar] [CrossRef]
  12. Gao, F.; Tang, X.; Yi, H.; Chu, C.; Li, N.; Li, J.; Zhao, S. In-situ DRIFTS for the mechanistic studies of NO oxidation over α-MnO2, β-MnO2 and γ-MnO2 catalysts. Chem. Eng. J. 2017, 322, 525–537. [Google Scholar] [CrossRef]
  13. Hu, H.; Cai, S.; Li, H.; Huang, L.; Shi, L.; Zhang, D. Mechanistic Aspects of deNOx Processing over TiO2 Supported Co–Mn Oxide Catalysts: Structure–Activity Relationships and In Situ DRIFTs Analysis. ACS Catal. 2015, 5, 6069–6077. [Google Scholar] [CrossRef]
  14. Yang, S.; Wang, C.; Li, J.; Yan, N.; Ma, L.; Chang, H. Low temperature selective catalytic reduction of NO with NH3 over Mn–Fe spinel: Performance, mechanism and kinetic study. Appl. Catal. B Environ. 2011, 110, 71–80. [Google Scholar] [CrossRef]
  15. Zhang, Y.; Zheng, Y.; Wang, X.; Lu, X. Preparation of Mn–FeOx/CNTs catalysts by redox co-precipitation and application in low-temperature NO reduction with NH3. Catal. Commun. 2015, 62, 57–61. [Google Scholar] [CrossRef]
  16. Gao, Y.; Jiang, W.; Luan, T.; Li, H.; Zhang, W.; Feng, W.; Jiang, H. High-Efficiency Catalytic Conversion of NOx by the Synergy of Nanocatalyst and Plasma: Effect of Mn-Based Bimetallic Active Species. Catalysts 2019, 9, 103. [Google Scholar] [CrossRef]
  17. Qiu, L.; Pang, D.; Zhang, C.; Meng, J.; Zhu, R.; Ouyang, F. In situ IR studies of Co and Ce doped Mn/TiO2 catalyst for low-temperature selective catalytic reduction of NO with NH3. Appl. Surf. Sci. 2015, 357, 189–196. [Google Scholar] [CrossRef]
  18. Chen, Y.; Wang, J.; Yan, Z.; Liu, L.; Zhang, Z.; Wang, X. Promoting effect of Nd on the reduction of NO with NH3 over CeO2 supported by activated semi-coke: An in situ DRIFTS study. Catal. Sci. Technol. 2015, 5, 2251–2259. [Google Scholar] [CrossRef]
  19. Wang, X.; Shi, Y.; Li, S.; Li, W. Promotional synergistic effect of Cu and Nb doping on a novel Cu/Ti-Nb ternary oxide catalyst for the selective catalytic reduction of NOx with NH3. Appl. Catal. B Environ. 2018, 220, 234–250. [Google Scholar] [CrossRef]
  20. Yang, S.; Fu, Y.; Liao, Y.; Xiong, S.; Qu, Z.; Yan, N.; Li, J. Competition of selective catalytic reduction and non selective catalytic reduction over MnOx/TiO2 for NO removal: the relationship between gaseous NO concentration and N2O selectivity. Catal. Sci. Technol. 2014, 4, 224–232. [Google Scholar] [CrossRef]
  21. Wei, L.; Cui, S.; Guo, H.; Ma, X. Study on the role of Mn species in low temperature SCR on MnOx/TiO2 through experiment and DFT calculation. Mol. Catal. 2018, 445, 102–110. [Google Scholar] [CrossRef]
  22. Kapteijn, F.; Singoredjo, L.; Andreini, A.; Moulijn, J.A. Activity and selectivity of pure manganese oxides in the selective catalytic reduction of nitric oxide with ammonia. Appl. Catal. B Environ. 1994, 3, 173–189. [Google Scholar] [CrossRef]
  23. Gao, Y.; Luan, T.; Zhang, W.; Li, H. The promotional effects of cerium on the catalytic properties of Al2O3-supported MnFeOx for NO oxidation and fast SCR reaction. Res. Chem. Intermed. 2019, 45, 663–686. [Google Scholar] [CrossRef]
  24. Liu, Z.; Yi, Y.; Zhang, S.; Zhu, T.; Zhu, J.; Wang, J. Selective catalytic reduction of NOx with NH3 over Mn-Ce mixed oxide catalyst at low temperatures. Catal. Today 2013, 216, 76–81. [Google Scholar] [CrossRef]
  25. Li, X.; Zhang, S.; Jia, Y.; Liu, X.; Zhong, Q. Selective catalytic oxidation of NO with O2 over Ce-doped MnOx/TiO2 catalysts. J. Nat. Gas Chem. 2012, 21, 17–24. [Google Scholar] [CrossRef]
  26. Ma, Z.; Yang, H.; Li, Q.; Zheng, J.; Zhang, X. Catalytic reduction of NO by NH3 over Fe–Cu–Ox/CNTs-TiO2 composites at low temperature. Appl. Catal. A Gen. 2012, 427–428, 43–48. [Google Scholar] [CrossRef]
  27. Shi, Y.; Chen, S.; Sun, H.; Shu, Y.; Quan, X. Low-temperature selective catalytic reduction of NOx with NH3 over hierarchically macro-mesoporous Mn/TiO2. Catal. Commun. 2013, 42, 10–13. [Google Scholar] [CrossRef]
  28. Gong, P.; Xie, J.; Fang, D.; Han, D.; He, F.; Li, F.; Qi, K. Effects of surface physicochemical properties on NH3-SCR activity of MnO2 catalysts with different crystal structures. Chin. J. Catal. 2017, 38, 1925–1934. [Google Scholar] [CrossRef]
  29. Boningari, T.; Pappas, D.K.; Ettireddy, P.R.; Kotrba, A.; Smirniotis, P.G. Influence of SiO2 on M/TiO2 (M = Cu, Mn, and Ce) Formulations for Low-Temperature Selective Catalytic Reduction of NOx with NH3: Surface Properties and Key Components in Relation to the Activity of NOx Reduction. Ind. Eng. Chem. Res. 2015, 54, 2261–2273. [Google Scholar] [CrossRef]
  30. Luo, S.; Zhou, W.; Xie, A.; Wu, F.; Yao, C.; Li, X.; Zuo, S.; Liu, T. Effect of MnO2 polymorphs structure on the selective catalytic reduction of NOx with NH3 over TiO2–Palygorskite. Chem. Eng. J. 2016, 286, 291–299. [Google Scholar] [CrossRef]
  31. Jiang, H.; Wang, C.; Wang, H.; Zhang, M. Synthesis of highly efficient MnOx catalyst for low-temperature NH3-SCR prepared from Mn-MOF-74 template. Mater. Lett. 2016, 168, 17–19. [Google Scholar] [CrossRef]
  32. Meng, D.; Xu, Q.; Jiao, Y.; Guo, Y.; Guo, Y.; Wang, L.; Lu, G.; Zhan, W. Spinel structured CoaMnbOx mixed oxide catalyst for the selective catalytic reduction of NOx with NH3. Appl. Catal. B Environ. 2018, 221, 652–663. [Google Scholar] [CrossRef]
  33. Stanciulescu, M.; Caravaggio, G.; Dobri, A.; Moir, J.; Burich, R.; Charland, J.P.; Bulsink, P. Low-temperature selective catalytic reduction of NOx with NH3 over Mn-containing catalysts. Appl. Catal. B Environ. 2012, 123–124, 229–240. [Google Scholar] [CrossRef]
  34. Kong, F.; Qiu, j.; Liu, H.; Zhao, R.; Zeng, H. Effect of NO/SO2 on Elemental Mercury Adsorption by Nano-Fe2O3. Korean J. Chem. Eng. 2010, 30, 43–48. [Google Scholar] [CrossRef]
  35. Gao, Y.; Luan, T.; Zhang, M.; Zhang, W.; Feng, W. Structure–Activity Relationship Study of Mn/Fe Ratio Effects on Mn−Fe−Ce−Ox/γ-Al2O3 Nanocatalyst for NO Oxidation and Fast SCR Reaction. Catalysts 2018, 8, 642. [Google Scholar] [CrossRef]
  36. Zhang, C.; Chen, T.; Liu, H.; Chen, D.; Xu, B.; Qing, C. Low temperature SCR reaction over Nano-Structured Fe-Mn Oxides: Characterization, performance, and kinetic study. Appl. Surf. Sci. 2018, 457, 1116–1125. [Google Scholar] [CrossRef]
  37. Jin, R.; Liu, Y.; Wu, Z.; Wang, H.; Gu, T. Low-temperature selective catalytic reduction of NO with NH3 over MnCe oxides supported on TiO2 and Al2O3: A comparative study. Chemosphere 2010, 78, 1160–1166. [Google Scholar] [CrossRef]
  38. Xiong, Z.-b.; Liu, J.; Zhou, F.; Liu, D.-y.; Lu, W.; Jin, J.; Ding, S.-f. Selective catalytic reduction of NOx with NH3 over iron-cerium-tungsten mixed oxide catalyst prepared by different methods. Appl. Surf. Sci. 2017, 406, 218–225. [Google Scholar] [CrossRef]
  39. Liu, F.; He, H.; Zhang, C.; Shan, W.; Shi, X. Mechanism of the selective catalytic reduction of NOx with NH3 over environmental-friendly iron titanate catalyst. Catal. Today 2011, 175, 18–25. [Google Scholar] [CrossRef]
  40. Fan, X.; Qiu, F.; Yang, H.; Tian, W.; Hou, T.; Zhang, X. Selective catalytic reduction of NOX with ammonia over Mn–Ce–OX/TiO2-carbon nanotube composites. Catal. Commun. 2011, 12, 1298–1301. [Google Scholar] [CrossRef]
  41. Guan, D.S.; Wang, Y. Synthesis and growth mechanism of multilayer TiO2 nanotube arrays. Nanoscale 2012, 4, 2968–2977. [Google Scholar] [CrossRef] [PubMed]
  42. Lu, X.; Shen, C.; Zhang, Z.; Barrios, E.; Zhai, L. Core–Shell Composite Fibers for High-Performance Flexible Supercapacitor Electrodes. ACS Appl. Mater. Interfaces 2018, 10, 4041–4049. [Google Scholar] [CrossRef]
  43. Wang, C.; Yu, F.; Zhu, M.; Wang, X.; Dan, J.; Zhang, J.; Cao, P.; Dai, B. Microspherical MnO2-CeO2-Al2O3 mixed oxide for monolithic honeycomb catalyst and application in selective catalytic reduction of NOx with NH3 at 50–150 °C. Chem. Eng. J. 2018, 346, 182–192. [Google Scholar] [CrossRef]
  44. Deng, L.; Ding, Y.; Duan, B.; Chen, Y.; Li, P.; Zhu, S.; Shen, S. Catalytic deep combustion characteristics of benzene over cobalt doped Mn-Ce solid solution catalysts at lower temperatures. Mol. Catal. 2018, 446, 72–80. [Google Scholar] [CrossRef]
  45. Li, K.; Tang, X.; Yi, H.; Ning, P.; Kang, D.; Wang, C. Low-temperature catalytic oxidation of NO over Mn–Co–Ce–Ox catalyst. Chem. Eng. J. 2012, 192, 99–104. [Google Scholar] [CrossRef]
  46. Zhang, W.; Wang, F.; Li, X.; Liu, Y.; Liu, Y.; Ma, J. Fabrication of hollow carbon nanospheres introduced with Fe and N species immobilized palladium nanoparticles as catalysts for the semihydrogenation of phenylacetylene under mild reaction conditions. Appl. Surf. Sci. 2017, 404, 398–408. [Google Scholar] [CrossRef]
  47. Wang, T.; Wan, Z.; Yang, X.; Zhang, X.; Niu, X.; Sun, B. Promotional effect of iron modification on the catalytic properties of Mn-Fe/ZSM-5 catalysts in the Fast SCR reaction. Fuel Process. Technol. 2018, 169, 112–121. [Google Scholar] [CrossRef]
  48. Marbán, G.; Valdés-Solı́s, T.; Fuertes, A.B. Mechanism of low-temperature selective catalytic reduction of NO with NH3 over carbon-supported Mn3O4: Role of surface NH3 species: SCR mechanism. J. Catal. 2004, 226, 138–155. [Google Scholar] [CrossRef]
  49. Liu, Z.; Zhu, J.; Li, J.; Ma, L.; Woo, S.I. Novel Mn–Ce–Ti Mixed-Oxide Catalyst for the Selective Catalytic Reduction of NOx with NH3. ACS Appl. Mater. Interfaces 2014, 6, 14500–14508. [Google Scholar] [CrossRef] [PubMed]
  50. Xiong, S.; Liao, Y.; Xiao, X.; Dang, H.; Yang, S. Novel Effect of H2O on the Low Temperature Selective Catalytic Reduction of NO with NH3 over MnOx-CeO2: Mechanism and Kinetic Study. J. Phys. Chem. C 2015, 119, 4180–4187. [Google Scholar] [CrossRef]
  51. Lu, J.J.; Murray, N.V.; Rosenthal, E. Signed formulas and annotated logics. In Proceedings of the [1993] Proceedings of the Twenty-Third International Symposium on Multiple-Valued Logic; Institute of Electrical and Electronics Engineers (IEEE): Piscatville, NJ, USA, 2002; pp. 48–53. [Google Scholar]
  52. Lee, J.D. A New Concise Inorganic Chemistry; Van Nostrand Reinhold: Berkshire, UK, 1991; ISBN 0-412-40290-4. [Google Scholar]
  53. Cooksy, A. Physical Chemistry: Thermodynamics, Statistical Mechanics, and Kinetics; PEARSON EDUCATION: Boston, MA, USA, 2012; ISBN 0-321-81415-0. [Google Scholar]
  54. Lide, D.R. CRC Handbook of Chemistry and Physics, 90th ed.; CRC Press: Boca Raton, FL, USA, 2010; ISBN 978-1439820773. [Google Scholar]
  55. Koebel, M.; Elsener, M. Selective catalytic reduction of NO over commercial DeNOx-catalysts: Experimental determination of kinetic and thermodynamic parameters. Chem. Eng. Sci. 1998, 53, 657–669. [Google Scholar] [CrossRef]
Figure 1. TEM, SEM, and Mapping of Mn−Co/TiO2 and Mn−Co/TiO2 nanocatalysts. (a) TEM of Mn−Co/TiO2; (b) TEM of Mn−Fe/TiO2; (c) SEM of Mn−Co/TiO2; (d) SEM of Mn−Fe/TiO2; (e) Mapping of Mn on Mn−Co/TiO2; (f) Mapping of Mn on Mn−Fe/TiO2; (g) Mapping of Co on Mn−Co/TiO2; (h) Mapping of Fe on Mn−Fe/TiO2; (i) Mapping of Ti on Mn−Co/TiO2; (j) Mapping of Ti on Mn−Fe/TiO2; (k) Mapping of O on Mn−Co/TiO2; (l) Mapping of O on Mn−Fe/TiO2.
Catalysts 09 00175 g001aCatalysts 09 00175 g001b
Figure 2. XRD patterns of Mn−Co/TiO2 and Mn−Fe/TiO2 nanocatalysts.
Catalysts 09 00175 g002
Figure 3. H2-TPR profiles of Mn−Co/TiO2 and Mn−Fe/TiO2 nanocatalysts: (a) Total H2-TPR curves; (b) Multi-peaks Gaussian fitting for Mn−Co/TiO2 nanocatalyst; (c) Multi-peaks Gaussian fitting for Mn−Fe/TiO2 nanocatalyst.
Catalysts 09 00175 g003
Figure 4. The qualitative component states of active elements during reduction process.
Catalysts 09 00175 g004
Figure 5. NH3-TPD profiles of Mn−Co/TiO2 and Mn−Fe/TiO2 nanocatalysts: (a) Total NH3-TPD curves; (b) Multi-peaks Gaussian fitting for Mn−Co/TiO2 nanocatalyst; (c) Multi-peaks Gaussian fitting for Mn−Fe/TiO2 nanocatalyst.
Catalysts 09 00175 g005aCatalysts 09 00175 g005b
Figure 6. XPS analysis of Mn−Co/TiO2 and Mn−Fe/TiO2 nanocatalysts: (a) XPS spectra for Ti 2p; (b) XPS spectra for Mn 2p; (c) XPS spectra for Co 2p; (d) XPS spectra for Fe 2p; (e) XPS spectra for O 1s.
Catalysts 09 00175 g006aCatalysts 09 00175 g006b
Figure 7. Catalytic performance of Mn−Co/TiO2 and Mn−Fe/TiO2 nanocatsalysts.
Catalysts 09 00175 g007
Figure 8. Effect of NO concentration on selective catalytic reduction (SCR) reaction rate.
Catalysts 09 00175 g008
Figure 9. Temperature−Gibbs free energy curve for the reaction between MxOy and NH3.
Catalysts 09 00175 g009
Figure 10. The schematic diagram of SCR experiments. 1, standard gas; 2, mass flowmeter; 3, gas mixer; 4, shutdown valve; 5, resistance furnace; 6, temperature controller; 7, nanocatalysts; 8, flue gas analyzer; 9, record system; 10, gas washing bottle; 11, induced draft fan.
Catalysts 09 00175 g010
Table 1. Physical properties of Mn−Co/TiO2 and Mn−Fe/TiO2 nanocatalysts.
SamplesSpecific Surface Aarea (m2·g−1)Total Pore Volume (cm3·g−1)Average Pore Diameter (nm)
Mn−Co/TiO2189.90.53133.06
Mn−Fe/TiO2104.60.42454.85
Table 2. H2-TPR quantitative analysis of Mn−Co/TiO2 and Mn−Fe/TiO2 nanocatalysts.
SamplesTemperature (°C) / H2 Consumption (mmol·g−1)
Peak 1Peak 2Peak 3Peak 4Total
Mn−Co/TiO2218/1.14327/0.21418/2.12517/0.96- /4.43
Mn−Fe/TiO2276/0.83387/0.41436/0.54501/1.59- /3.37
Table 3. Quantitative analysis of NH3-TPD profiles.
SamplesTemperature (°C) / NH3 composition (mmol·g−1)
Peak 1Peak 2Peak 3Peak 4Total
Mn−Co/TiO2276/0.11402/0.49587/0.52653/0.32--/1.44
Mn−Fe/TiO2209/0.14398/0.24585/0.39649/0.20--/0.97
Table 4. Surface atomic compositions of the catalysts determined by XPS.
SamplesBinding Energy (eV) / Atomic Composition (%)
MnFeCoO
Mn2+Mn3+Mn4+Fe2+Fe3+Co2+Co3+OαOβ
Mn−Co/TiO2641.2/
13.8
642.6/
39.4
644.1/
46.8
-/--/-779.6
39.3
782.1/
60.7
531.4/
33.7
530.3/
66.3
Mn−Fe/TiO2641.4/
21.3
642.8/
38.5
644.6/
40.2
709.6/
43.4
711.7/
56.6
-/--/-531.6/
28.2
530.3/
71.8
Table 5. Reaction kinetic constants of NO reduction.
SampleTemperature (°C)kSCR-ER/106kSCR-LHR2kSCRa
Mn−Co/TiO21000.0295.750.99323.5
1500.04613.250.99441.1
2000.06420.500.98858.2
2500.07525.010.98468.4
Mn−Fe/TiO21000.0182.350.98913.5
1500.0278.250.99024.4
2000.03316.010.99136.0
2500.06214.500.99852.1
a [NO] = [NH3] = 600 ppm.
Table 6. Standard thermodynamic properties of MxOy [7,53,54,55].
Cp
J mol−1 K
fH0
kJ mol−1
S0
J mol−1 K
fG0
kJ mol−1
Mn26.30.032.0-
MnO45.4−385.259.7−362.9
Mn3O4139.7−1387.8155.6-1283.2
Mn2O3107.7−959.0110.5−881.1
MnO254.1−520.053.1−465.1
Co24.80.030.0-
CoO55.2−237.953.0−214.2
Co3O4123.4−891.0102.5−774.0
Fe25.10.027.3-
FeO-−272.0--
Fe3O4143.4−1118.4146.4−1015.4
Fe2O3103.9−824.287.4−742.2
NH3-45.9192.8-
N229.10.0191.6-
H2O (g)33.6−241.8188.8−228.6
Table 7. Gibbs free energy for the reaction between MxOy and NH3 under different temperatures.
SubstancefG /kJ
298 K323 K373 K423 K473 K523 K
MnO2−46.25−49.09−54.77−60.45−66.12−71.80
Mn3O442.0039.2733.8128.3422.8817.42
MnO84.0681.6576.8372.0167.1962.37
Co3O4 a−85.71−88.74−94.79−100.84−106.89−112.94
CoO−64.64−67.17−72.22−77.28−82.34−87.39
Fe2O3−31.40−34.23−39.89−45.55−51.21−56.87
Fe3O4−24.99−27.69−33.09−38.49−43.89−49.29
a Co3O4 was regard as the compound of Co2O3 and CoO

