Article

Catalytic Decomposition of Oleic Acid to Fuels and Chemicals: Roles of Catalyst Acidity and Basicity on Product Distribution and Reaction Pathways

1
College of Biological, Chemical Science and Engineering, Jiaxing University, 118 Jiahang road, Jiaxing 314001, China
2
Department of Chemical Engineering, University of New Brunswick, 15 Dineen Drive, Fredericton, NB E3B 5A3, Canada
3
Department of Chemical and Biochemical Engineering, Western University, 1151 Richmond Street, London, ON N6A 3K7, Canada
4
National Centre for Upgrading Technology, Canmet ENERGY-Devon, 1 Oil Patch Drive, Edmonton, AB T9G 1A8, Canada
5
Xi’an modern Chemistry Research Institute, Xi’an 710065, China
*
Authors to whom correspondence should be addressed.
As the co-first author.
Catalysts 2019, 9(12), 1063; https://doi.org/10.3390/catal9121063
Submission received: 28 October 2019 / Revised: 4 December 2019 / Accepted: 6 December 2019 / Published: 13 December 2019
(This article belongs to the Special Issue Catalysis for the Production of Sustainable Fuels and Chemicals)

Abstract

:
The roles of catalyst acidity and basicity playing in catalytic conversion of oleic acid were studied in a fixed-bed micro-reactor at atmospheric pressure. The chemical compositions of the petroleum-like products were obtained and the reaction pathways of different catalysts are discussed. The metal oxides are suitable for upgrading oleic acid into organic liquid products (OLPs). Over 98% oxygen was removed when CaO, MgO, and TiO2 were implemented, whereas a minimum oxygen removal lower than 20% was obtained by using quartz. The oxygen removal was 73% by alumina; however, the light oil yield (to feed) and the valuable product yield received were the highest in all investigated catalysts. The hydrocarbons in OLPs, overwhelmingly presenting in the product, were found to be alkenes and cycloalkenes, followed by saturated hydrocarbons, and then aromatics lower than 4%. For Lewis acidic catalysts, higher acidity of the catalyst is beneficial to deoxygenation but also secondary cracking. CaO has higher dehydrogenation capability than MgO does.

1. Introduction

With the development of the economy, the consumption of crude oil and its products keeps increasing. On the other hand, petroleum is non-renewable energy; therefore, oil products are becoming scarce. Furthermore, the ongoing strengthen environmental policies make the emission limitation continuously strict. Therefore, researchers have transferred their focus onto biofuels [1,2]. However, biofuels cannot be directly utilized because of the existence of oxygenates and unsaturated carbon–carbon double bonds [3]. Catalytic cracking is one of effective processes for biofuel upgrading [4,5,6,7].
As the structure, the active (acidic or basic) sites, and the bond between the metal and oxygen enhance the adsorption of reactants on the active sites, metal oxides are often used as biofuel upgrading catalysts [6]. The early acidic and basic cracking catalysts for biofuels upgrading dated back to the 1980s [8]. At 300~500 °C, Both acid and base metal oxide catalysts were found to be effective catalysts in the deoxygenation of fatty acids or triglycerides to a mixture of oxygen containing products and hydrocarbons [4,9,10,11,12]. The various impacts of oxygenates upgraded by both acid and base catalysts were also compared [13,14,15,16]. The Al2O3 was able to remove 94 wt.% of oxygen from waste cooking oil at the temperature of 470 °C [4]. The basic sites in a catalyst were found to be capable of strongly inhibiting secondary cracking, which resulted in high residual oil yields and low gas yields. Xu et al. found that the amounts of carboxylic acids and aldehydes, as well as the high acid value of liquid products, were significantly decreased by using base catalysts, and that the catalysts were modified by using base catalysts such as CaO rather than Al2O3. Furthermore, at low temperature, the product of the formers showed good solubility in diesel, good cold flow properties, and high heat value [14,15,16]. This is contributed to by the neutralization reactions taking place between the basic sites on catalysts and acidic intermediates in liquid products. The produced neutral hydrocarbons had more similar molecular structure to diesel fuels and better properties than acidic oxygenate intermediates.
Some literature reported the reaction processes of the catalytic cracking oxygenates to petroleum-like products over metal oxide catalysts; however, most of the catalytic cracking work has been performed using acid catalysts, and the effect of the basic sites on catalyst performance and reaction mechanisms have not been sufficiently discussed. In this study, the specific roles that the acidity and basicity, and the types of acidic sites of the catalyst, played in the product distribution of oleic acid were investigated.

2. Results and Discussion

2.1. Catalyst Characterization

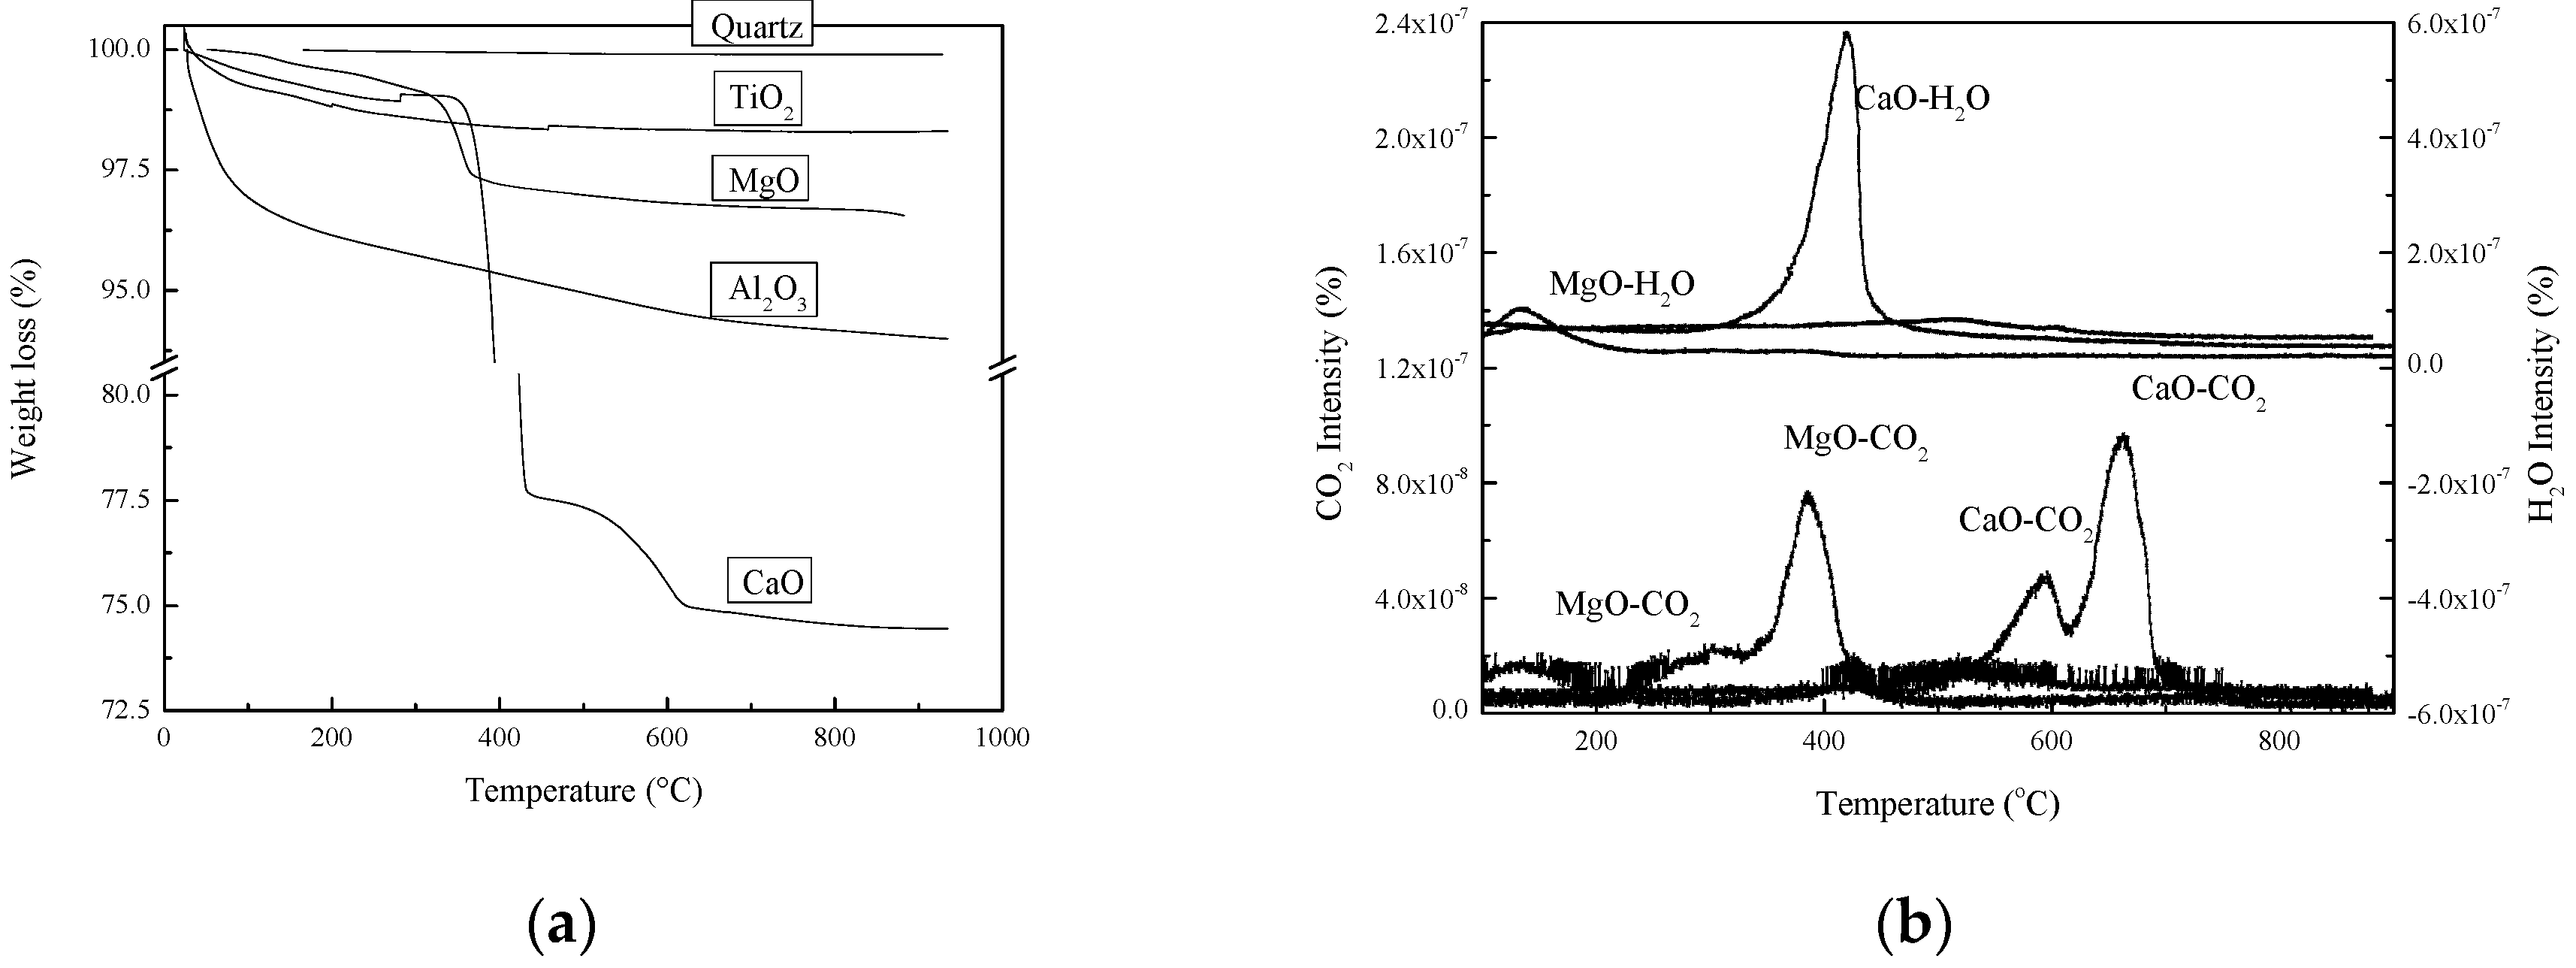
2.1.1. Thermal Treatment

Catalyst thermal treatment results are shown in Figure 1a,b. The weight loss of the titania and alumina are only due to the absorbed water, and there was no weight loss during quartz thermal treatment. There was obvious weight loss in CaO and MgO thermal treatment process, which corresponded to the released water and CO2. Therefore, CaO and MgO were undergone in-situ drying with nitrogen at the temperature of 800 °C for 2 h before activity performance evaluation.

2.1.2. Physical Properties

The properties of all catalysts are given in Table 1.
Compared to other catalysts, quartz, the neutral catalyst, is bare of pore structures, and has extremely low surface area, and rather small pore volume. Generally speaking, acidic catalysts have higher surface areas and lager pore volume than alkaline catalysts do, which are in accordance with pore size distribution in Figure S1.

2.1.3. Amount, Types, and Strength of Active Sites

The amount and strength of active sites on acidic and alkaline catalysts are listed in Table 1. Compared to Al2O3, TiO2 has a higher amount of acids with higher strength. Both the amount and the strength of active sites on CaO are higher than those on MgO. There is no active site on quartz.
Figure S2a,b shows the Py-FTIR spectra of Al2O3 and TiO2, respectively. The peaks around 1450 cm−1, 1540 cm−1, and 1490 cm−1 are indicative of Lewis acids, Bronsted acid, and both [17]. Lewis acids are the only one appearing on these two catalysts.

2.2. Products

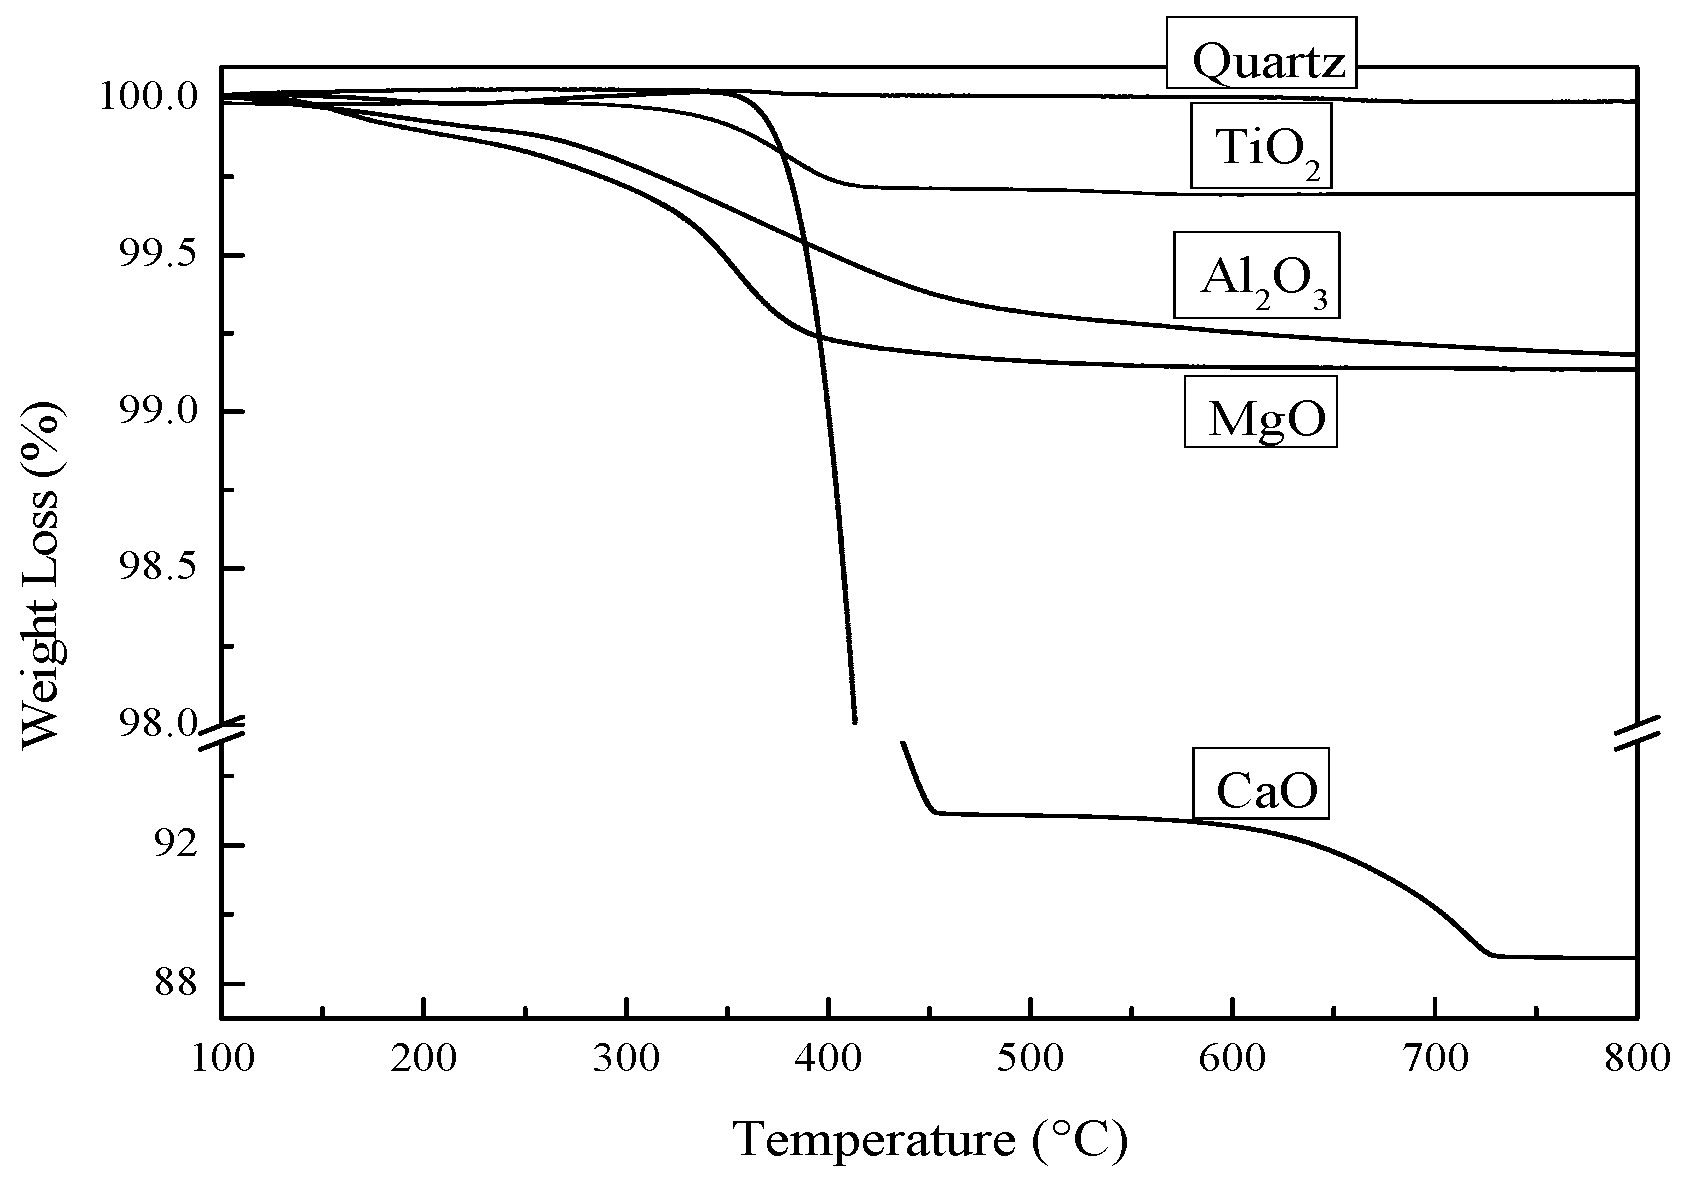
2.2.1. Catalytic Upgrading by TGA

Figure S3 shows the oleic acid decomposition process catalyzed by different catalysts by TGA tests. The corresponded MS spectra are shown in Figure S4. From Figure S3, the decomposition temperature of oleic acid ranged from 200 to 500 °C. As shown in Figure S3, 450–500 °C is an appropriate temperature range for oleic acid deoxygenation by alumina under experimental conditions and therefore then temperature of 475 °C was selected in the current study.

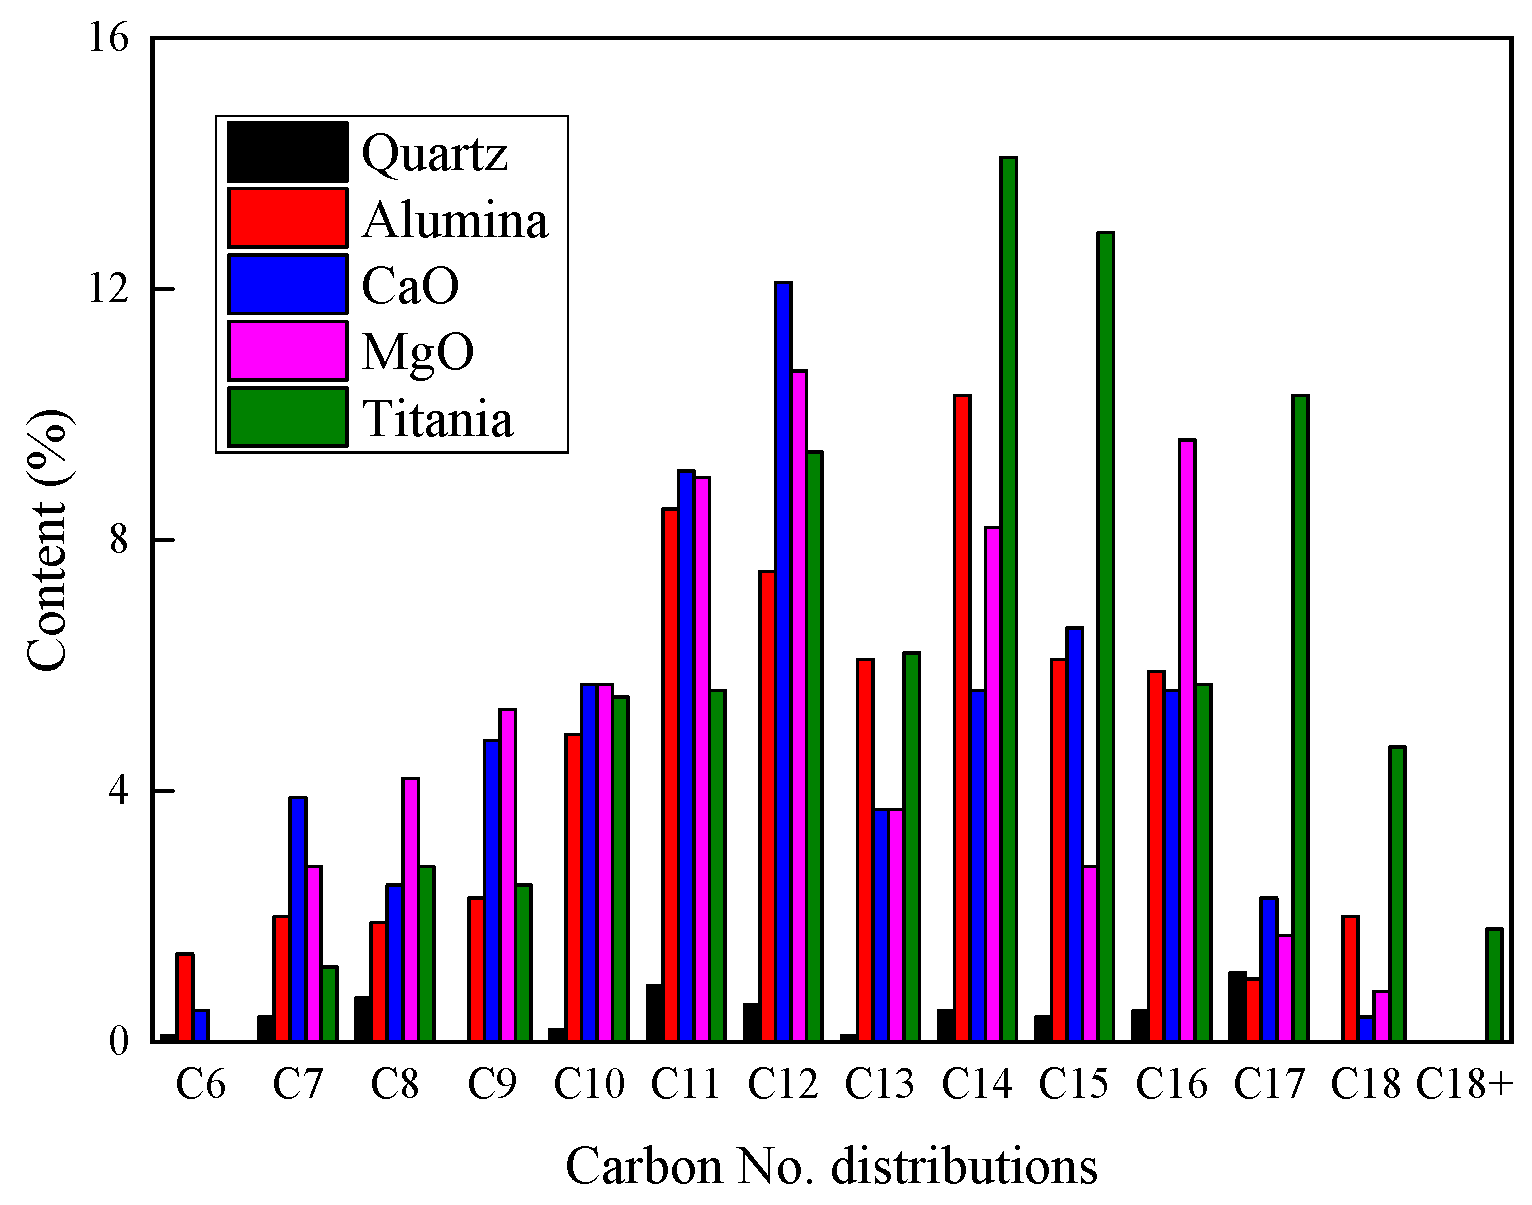
2.2.2. Product Distribution

The operational parameters and the product yield distributions are shown in Table S1 and Table 2, respectively. The total product yields reached 100 ± 5.0% during all investigated experiments. As expected, the conversion of quartz upgraded organic liquids was as low as 35%. Around 65% of the oleic acid was left in organic liquid products, and catalytic cracking resulted in lower liquid, higher gas, and higher coke yields.
All liquids spontaneously stratified into two phases: Oil and water. According to the type of catalysts, the yields of oil products are in the following order: Silica (93.4 wt.%) > alumina (82.5 wt.%) > titania (75.3 wt.%) > MgO (67.5 wt.%) > CaO (29.0 wt.%). In contrast, the total amount of water, carbon oxide, and hydrogen were found to increase during the catalytic process, indicating that dehydration, decarbonoxide reaction, and dehydrogenation were enhanced by catalyst. It has been reported that activated alumina was an effective catalyst in the decarboxylation of fatty acids under atmospheric pressure and at 450 °C, and the liquid product yields vary in the range between 65% and 79% with n-alkanes and n-alkenes [11].
Deoxygenation of oleic acid under the current condition showed variations when upgrading with different types of catalysts. All these catalysts underwent more deoxygenation by the removal of CO and CO2 than by water. The liquid yields, the gas hydrocarbon yields, and the coke yields appear to be closely associated with the types of active sites on the catalysts. Higher liquid but lower gas hydrocarbon and coke yields are achieved first by quartz, then by acidic catalysts, and finally by alkaline catalysts. The stronger the active sites on catalyst were, the lower liquid yields and the higher gas hydrocarbon yields reached. The more active sites on catalyst, the lower coke yields. However, CaO is an exception, which has lower gas hydrocarbon yield and higher coke yield than MgO.
Moreover, certain amount of hydrogen was detected by GC-RGA. Serrano et al. studied the feasibility to produce hydrogen, and received 0.12% hydrogen through the decomposition of vegetable and microalgal oils [18].
Oxygen removal and light oil yields in oil products are also shown in Table 2. The amount of active sites strongly affects the oxygen removal. Even though the oxygen removal of Al2O3 in oil products is lower than those of TiO2 and alkaline catalysts, the yield of light oils is the highest, which is supported by the previous publication [12].

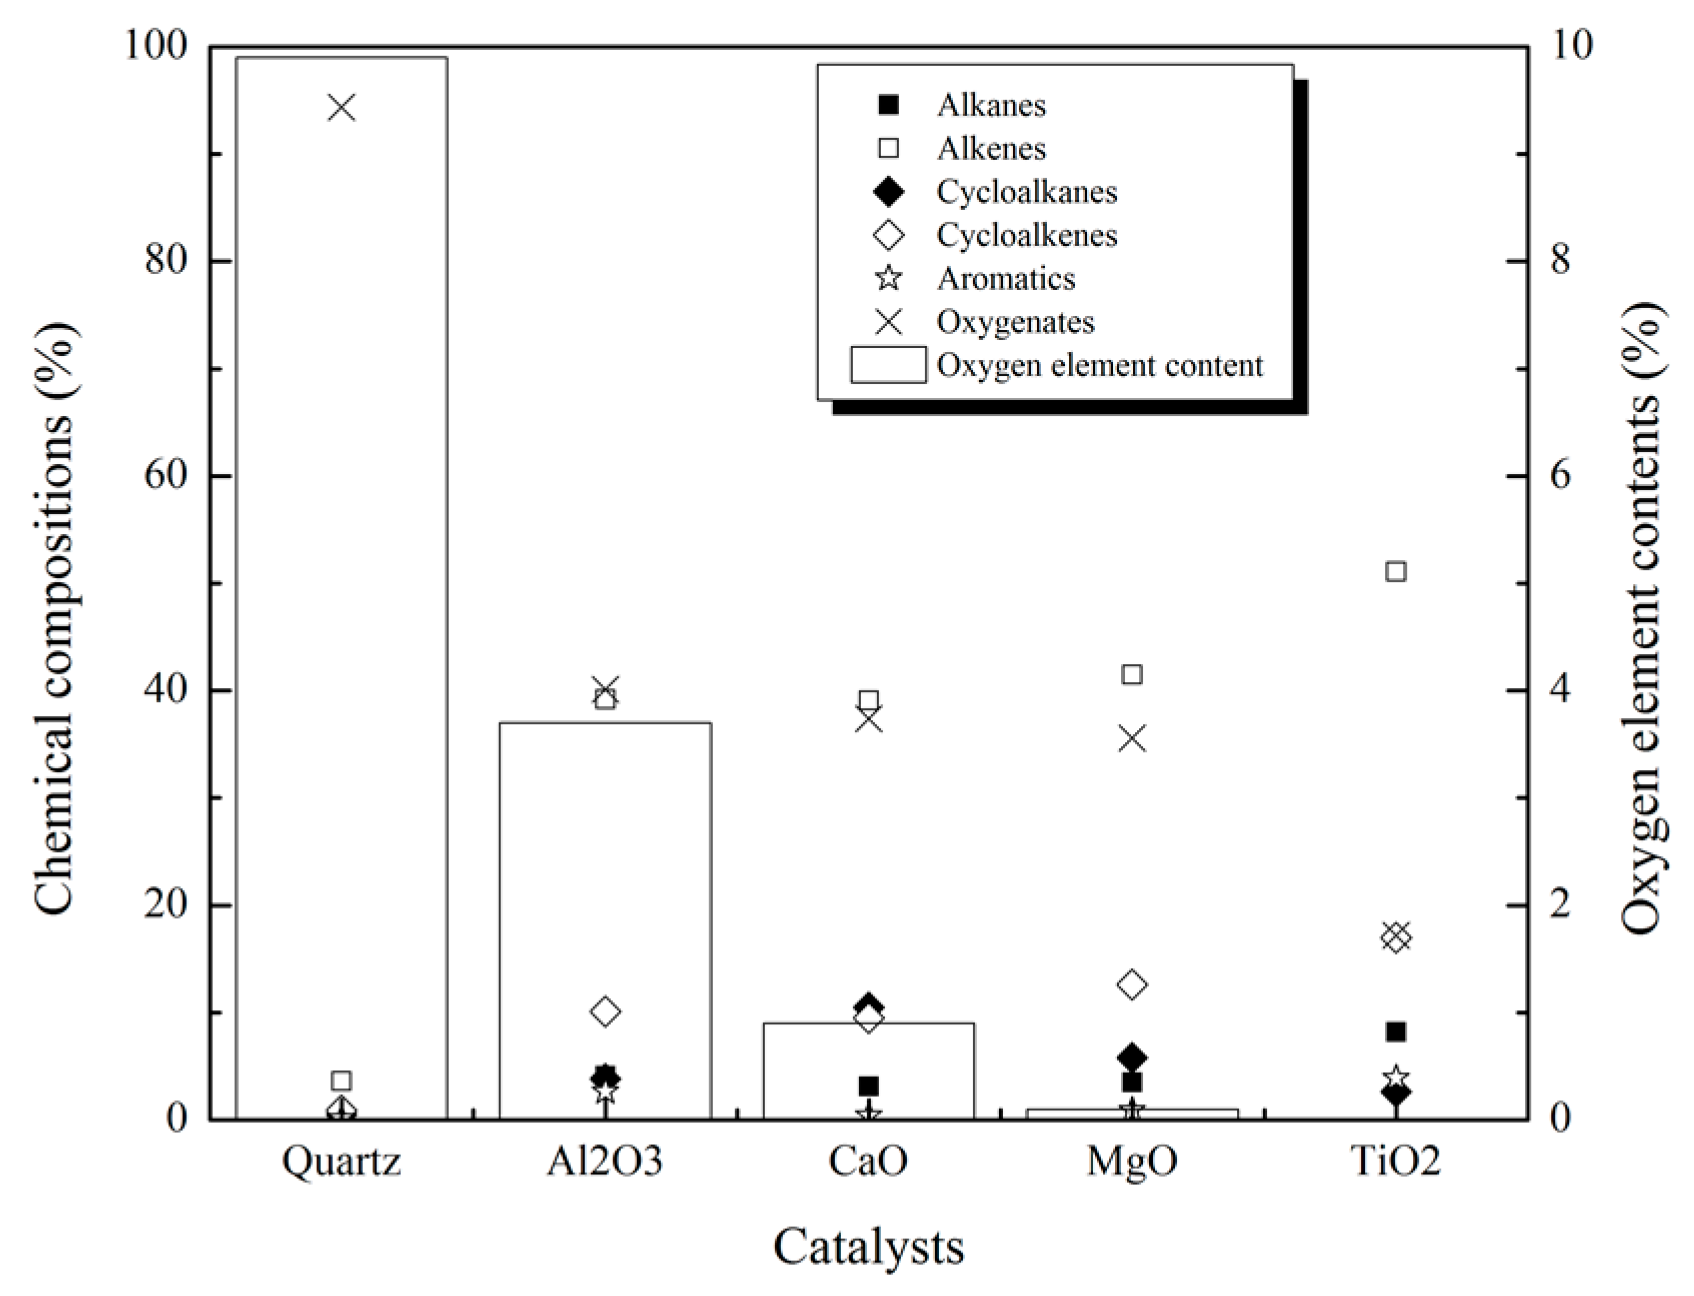
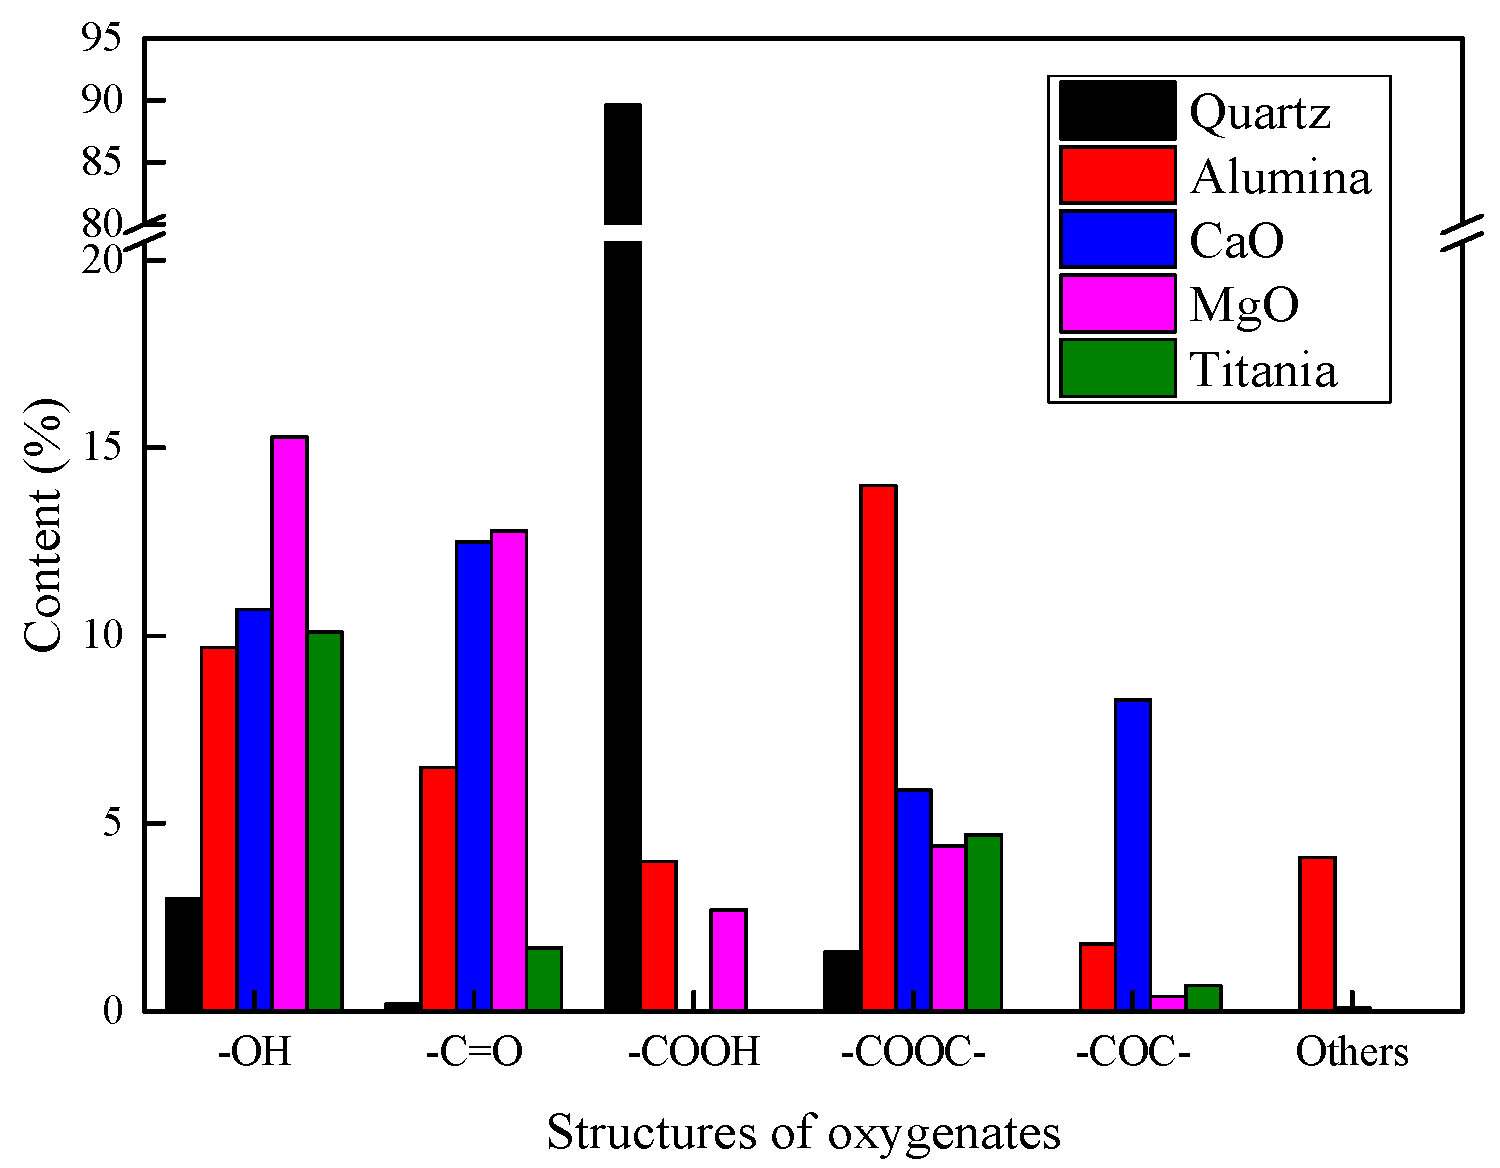
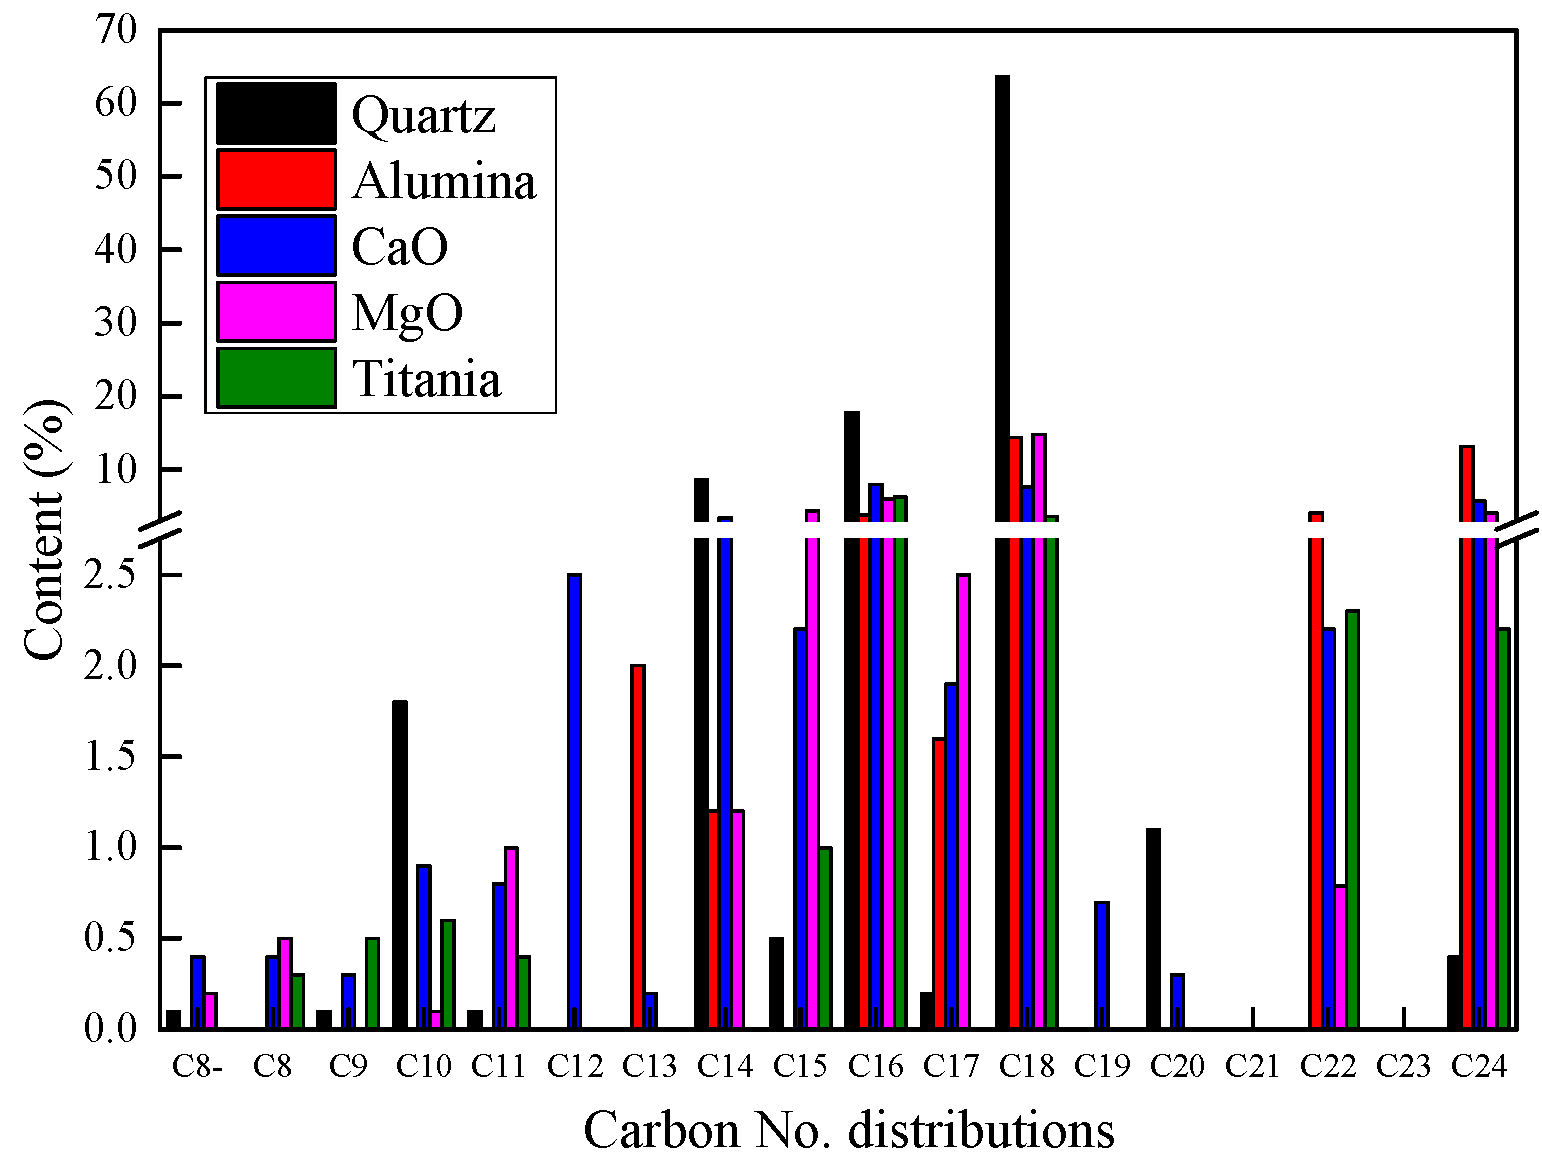
2.2.3. Product Compositions

Table S2 shows the contents of gas hydrocarbons. C1–C3 olefin and paraffin are the principal organic gas products. Generally, the contents of olefins are higher than those of paraffin with the same carbon number. Only CaO caused different results that the content of methane is relatively higher than that of other organic gases, which might be because the high concentration of hydrogen reacting with CO forms methane. It is worth of noting that the contents of paraffin upgraded by CaO are higher than those of olefin with the same carbon number. The high concentration of hydrogen may make the olefins in CaO upgrading gases saturated [19,20,21].
The group and elemental compositions, and the carbon number distribution of hydrocarbons of oil products, are shown in Figure 2 and Figure 3, respectively. The types and carbon number distributions of oxygenates in organic liquid products (OLPs) are shown in Figure 4 and Figure 5. In general, the chemical compounds does not differ greatly between acidic and alkaline upgrading oils. The OLPs contained hydrocarbons of C6 to C18, and C22 to C24, including of alkanes, alkenes, cycloalkanes, cycloalkenes, aromatics, and oxygenates. Most oxygenates were removed by acidic and alkaline catalysts. It is easy to find the low aromatics content, which is in accordance with the molar ratio of hydrogen to carbon, which was 1.81 ± 0.06 in both acidic and alkaline catalyst upgrading oil products. The oxygen content well resembled oxygenate contents in all catalytic upgrading oil products. Demirbas et al. [22] reported the same trend with low concentration of aromatics, while some researchers obtained different results.
Aldehydes, esters, ketones, and alcohols were found in the OLPs. Certain amount of di-epoxide, aldehyde, epoxide, acid, and ester were presented in some samples. Low conversion with the high concentration of fatty acids was achieved when working with quartz. Ketones and aldehydes were found in the catalytic reactions, but were not detected during thermal cracking. Esters were found in both catalytic and non-catalytic upgrading oil products.
Figure S5 shows the TPO analysis results of all investigated catalysts except for the quartz. The reason is neither oxygen was consumed, nor water and CO2 were released (same to oxygen TGA results in Figure 6). As shown in Figure 6 and Figure S5, different catalysts have significantly different TPO results. For Alumina, the released water below 250 °C should be the produced water that was absorbed by the alumina; and the weight loss between 250 °C and 700 °C is from the coke because the oxygen was consumed within this range. For titania, TPO result is very simple and clear, and only coke is burnt out in the range of 300–600 °C. For CaO, the released water and CO2 were from coke when the temperature was lower than 500 °C, while the CO2 should be decomposed from CaCO3 when the temperature was higher than 500 °C for no oxygen was consumed. The MgO TPO result is similar to the CaO one, and only the temperature and the amount of released CO2 from metal carbonate are not the same. The coke was burnt out when the temperature was higher than 400 °C, while the released CO2 ranging from 150 to 400 °C is from MgCO3. All the relevant calculations, such as the produced water and CO2, as well as the coke content, were based on those results.

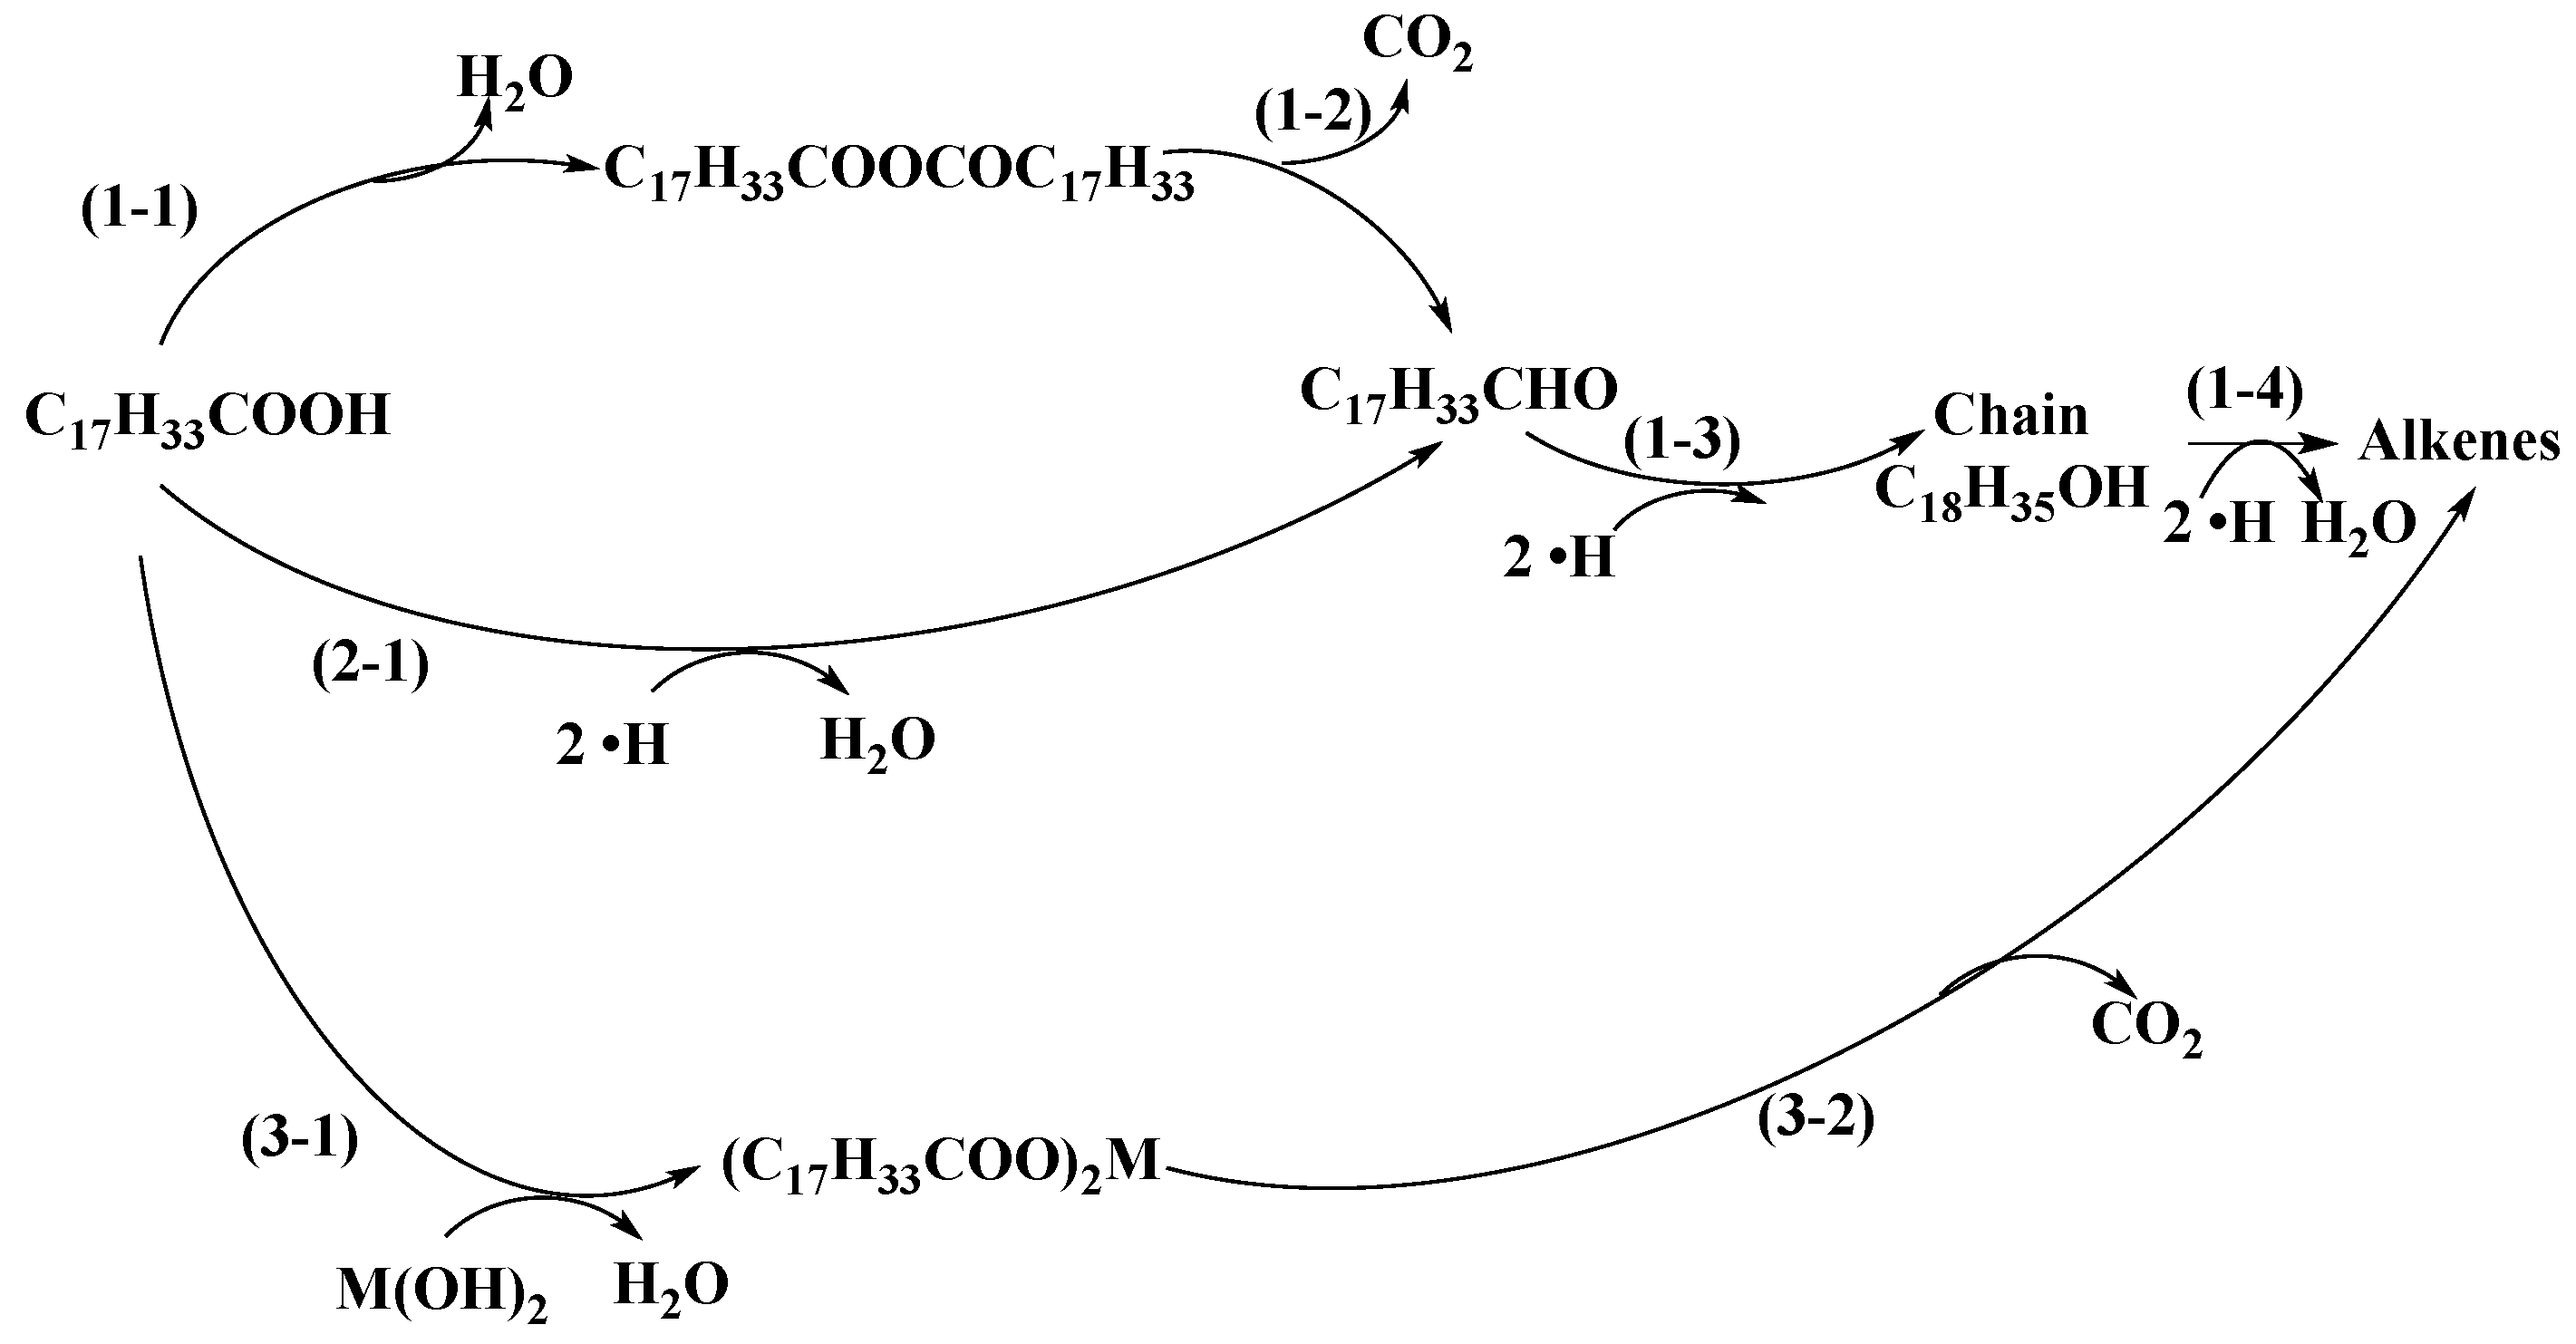
2.3. Reaction Pathways

The possible reaction mechanisms for the deoxygenation of oleic acid illustrated in Scheme 1 are included the followings [5,23]: (1) The production of anhydrides from the dehydration of acids, the decarboxylation of anhydrides to aldehyde/ketones, and the decarbonylation (or reduction) of aldehyde/ketones to alkenes (or alcohols); (2) the breaking of the C–H bond was promoted by the presence of Lewis acids and the generation of active hydrogen; the reduction of oleic acids to aldehydes, alcohols, alkenes, and eventually alkanes in turn by the produced active hydrogen; (3) the neutralization of acid and alkali to form salt, and the decarboxylation of the produced salt to form alkenes. The molarity compositions of deoxygenation products are shown in Table 3. The deoxygenation of oleic acid with nitrogen at 470 °C mainly proceed via DCO, yielding high concentration of carbon monoxide, and suggesting decarbonylation is the major deoxygenation pathway. Decarboxylation also occurred, demonstrated by the presence of carbon dioxide in Table 3. As discussed previously, CaO is still an exception, which favors decarboxylation over decarbonylation.
Deoxygenation of oleic acid under the current condition favors decarbonylation over decarboxylation. Tani et al. had the same conclusion when upgrading palm oil by silica and MgO-silica catalysts [24].
CaO is a good dehydrogenation catalyst, however, with high coke content. For other catalysts, more active sites result in higher concentrations of hydrocarbon gases and coke. When the reaction temperature is at 470 °C, CaO reacts with CO2, producing CaCO3 (see Figure 6), accelerating the water gas shift reaction (Equation (3)), resulting in a phenomenon in which carbon monoxide and water are consumed to release CO2 and H2, consequently leading to the high hydrogen concentration in CaO upgrading gas products. Gosselink gave the same explanation [19].
CO + H2O ↔ CO2 + H2

2.3.1. Acidic Catalysts

Alumina and titania were used to evaluate the effect of Lewis acids on the product distribution. Compared to other catalysts, yields of various products and compositions of gas products obtained with titania were rather close to those obtained with alumina. This is because both of them have relative high surface area, large pore volume, and rich of pore structures; proper amount and strength of acidic sites; and same acid type (Lewis acids only).
On the other hand, compositions of hydrogen and OLP obtained with titania (both higher acidity and strength) were significantly different from those with alumina. A comparison of the compositions of hydrogen obtained with various catalysts (Table 2 and Table S2) shows that the hydrogen content in the gas product with alumina catalysts was lower than those with titania. This result is in accordance with the chemical composition of OLPs shown in Figure 2, where the unsaturated hydrocarbon (alkene, cycloalkane, and aromatics) contents of OLP upgraded by titania are much higher than those by alumina. Moreover, the oxygenate amount of titania upgrading OLP is much lower than that of alumina. These results show that there was a larger involvement of dehydrogenation and deoxygenation reactions with titania than with alumina, which may be caused by the higher amount of acidic site on titania. In addition, Table 2 shows that the gas hydrocarbon yield with titania was higher than that with alumina. The high gas hydrocarbon yield with titania may be attributed to the accelerated secondary cracking due to the stronger acidity and the higher density of acidity (the acidity on per surface area of catalyst).
The reaction mechanisms for the deoxygenation of oleic acid over Lewis acidic catalysts include the followings [5,23]: The breaking of the C–H bond and the generation of active hydrogen were promoted by Lewis acids, and therefore, the reduction of oleic acids to aldehydes, alcohols, alkenes, and finally alkanes by the produced active hydrogen were enhanced. As shown in Figure S4 and Table 3, the contents of alcohols, ketones, and ethers in the acidic catalyst upgrading products were lower than those in the basic catalyst upgrading products.

2.3.2. Neutral Catalyst

Analysis of the gas products upgraded by quartz showed the existence of CO and CO2, indicating that deoxygenation reaction proceeded through decarbonylation or decarboxylation mechanisms [25]. Analysis results of the OLP revealed that alkenes and fatty acids were the primary products, especially for fatty acid, which is as high as 94.4%, and predominance of C18 (65%), C16 (18%), and C14 (8%) fatty acids. Analysis of oxygenates in OLP shows the presence of a mixture of alcohols, esters, and acids. The results indicated that at 470 °C with quartz, the conversion of oleic acid to the anhydrides was low, which resulted in the lack of ketones in the OLP [26]. Bare aromatic compounds and only a small number of alkane and cycloalkane species were detected, which implies that less secondary thermal cracking occurred. All these results agree with other researchers’ [27]. Compared to the yields and compositions obtained by all investigated catalysts, the presence of the catalyst reduced the amount of the liquid product and caused further removal of the acid groups [9].

2.3.3. Alkaline Catalysts

Tests running over calcium oxide and magnesium oxide catalysts were used to assess the effect of basic sites on the product distribution. The yields of various products and the compositions of gas and OLPs are shown in Figure 2, Figure 3, Figure 4 and Figure 5, Figure S3, and Figure S4 and Table 2 and Table 3, and Table S2. Compared to other catalysts, the yields of OLPs, coke, and gas hydrocarbons, the oxygen removal, as well as the compositions and carbon number distributions of OLPs and oxygenates in OLPs obtained with CaO, were rather close to those obtained with MgO. This is probably due to their similar surface area, pore volume, and basic sites. It was an interesting observation that there was a difference between the yield of water and that of carbon oxide and hydrogen for calcium oxide, as well as the concentration of those for magnesium oxide. As discussed in Section 2.2.3, at a reaction temperature of 470 °C, CaO reacts with CO2, producing CaCO3 (see Figure 6), accelerating the water gas shift reaction, resulting in a phenomenon where carbon monoxide and water are consumed to produce CO2 and H2. This leads to the higher yields and concentration of carbon oxide and hydrogen obtained by CaO than by MgO. In addition, CaO has a relative high dehydrogenation capability, which is confirmed by the higher aromatic, cycloalkane, and alkene concentration in CaO upgrading OLP. Furthermore, the water yield obtained by MgO was rather higher than by CaO. Different from the literature [8], the alkaline catalysts (CaO and MgO) in the current study did not inhibit the secondary cracking, which was deduced by the low oil yields and the high gas yields.
The amount of fatty acid left in the liquid products decreased most drastically and reached a rather lower level than that in other catalyst upgrading OLPs, except with titania. This was probably attributed to the saponification of the fatty acid by the base [9]. However, the removal of the acid functions in the liquid products did not necessarily lead to oxygen groups-free products. The liquid product consisted of an certain amount of ketones and aldehydes with –C=O, alcohols with –OH, esters (especially di-esters) with –COOC-, and epoxides (especially di-epoxides) with –C-O-C-, as shown in Figure 4.
MgO/CaO reacts with the produced CO2 to form MgCO3/CaCO3, which promote the decarboxylation of oleic acid. It should be noted that CaCO3 is so stable under reaction condition (470 °C) that a high temperature (>700 °C) is needed to decompose it to CaO [28]. However, MgCO3 is easy to be decomposed to CO2 and MgO under the investigated reaction conditions. In practice, the TGA-MS analysis results (Figure 1) showed that both MgCO3 and Mg(OH)2 were decomposed to MgO at 450 °C.
The reaction mechanisms for the deoxygenation of oleic acid over basic catalysts include the following: (1) The production of anhydrides from the dehydration of acids, the decarboxylation of anhydrides to aldehyde/ketones, and the decarbonylation of aldehyde/ketones to alkenes were enhanced by the basic catalysts; (2) the neutralization of acid and alkali to form salt, and the decarboxylation of the produced salt to form alkenes; and (3) the reduction of oleic acids to aldehydes, alcohols, alkenes, and eventually alkanes in succession by the produced active hydrogen. As shown in Figure S4 and Table 3, the acid and ester contents in the acidic catalyst upgrading products were much higher than those in the basic catalyst upgrading products, which further illustrates the neutralization of oleic acids with basic catalysts.

2.3.4. Aromatization

As shown in Figure 2, the aromatic contents upgraded by all investigated catalysts (neutral, base, Lewis acids only) are lower than 3.9 wt.%. Thus, the similarity in product distribution between acidic catalysts (titania and alumina) and other catalysts shows clearly that Lewis acid is not the dominative factor in aromatization involving oleic acid as feed, although Cerny et al. has reported over 40% and around 85% aromatics in the <150 °C and >150 °C fractions when a ultra-stable zeolite Y (USY, with the same amount Bronsted and Lewis acid) was used as the catalyst [29]. In addition, Omar et al. found that adding ZSM-5 (with both Bronsted and Lewis acids) catalyst produced an appreciable quantity of aromatic compounds [27]. Therefore, a key property, the existence of Bronsted acids on catalyst surface, was important to the formation of aromatics. Frety et al. got the same conclusion [30]. Part of the acidic sites (Lewis and Brønsted acids) will change to each other during the reaction process with the presence of water, which is confirmed by the higher yields of aromatic hydrocarbons when running with titania and alumina (Lewis acid only catalysts) as compared to quartz (non-acid catalyst). Other reasons, such as pore structures of catalysts [12] and high-power treatment (by microwave [27]), were found to affect the formation of aromatics.

3. Materials and Methods

3.1. Catalyst Reaction Performance Evaluation

Oleic acid (CAS No.: 112-80-1, purchased from Fisher Scientific, Canada) was used as the feed in the current study. For obtaining the information between the catalytic decomposition of oleic acid and reaction conditions, a mixture of oleic acid and catalysts was tested first by the TGA combined with an Residue gas analyzer (mass spectrometer), which was used to record the decomposed volatile gases. An amount of 10 mg catalyst was loaded in the TGA testing pan and was pretreated at 700 °C for 2 h. Then, around 10 mg oleic acid was added into the testing pan and tested with a heating rate of 10 °C/min to 800 °C. A quartz fixed-bed reactor was used as the reaction system under atmospheric pressure. The schematic of the reaction system is shown in Figure S6. This system consists of a quartz tube reactor (inner diameter: 10 mm; length: 100 mm), a nitrogen gas feed system, a liquid feeding syringe, a heater and temperature control system, a condenser, and a mixture of iced ethanol-saturated salt cooling system; in addition, liquid and gas products collection systems were also introduced. The reaction conditions are shown in Table S1 in the Supplemental Files.

3.2. Catalyst Preparation

Alumina was prepared from Boehmite. An amount of 100 g Boehmite was dissolved in about 150 mL deionized water and was acidified by HCl to the PH value at 3–4 under a temperature of 60–65 °C until the colloidal substances were produced. The solution was dried in an oven at 105 °C for 5 h and then was calcined in a muffle oven under 700 °C for 2 h [31]. TiO2 and quartz were used to maintain the state when they were purchased. CaO and MgO were undergone in-situ drying with nitrogen at 800 °C in order to remove the metal hydroxide and metal carbonate, and to remain in the state of metal oxide only during the reaction process (see Section 2.1).

3.3. Products Analysis

Compositions of inorganic gases, such as CO, CO2, and H2, were tested by GC (Varian GC-3400, Varian, Agilent Technologies, Inc., Santa Clara, CA, USA), which is equipped with an Agilent HP-PLOT Q column and combined with the residue gas analyzer (RGA-200, Stanford Research Systems, Sunnyvale, CA, USA). Compositions of hydrocarbons in gas products were determined by GC/FID (GC-17A, Shimadzu Scientific Instruments, Kyoto, Japan).
The contents of carbon, hydrogen, and oxygen were tested by LECO CHNS-932. Samples were combusted in an oxygen atmosphere at 1150 °C. Boiling point distribution of liquid products was tested in accordance with ASTM D2887, using a gas chromatography (Shimadzu GC-2010, Shimadzu, Shimadzu Scientific Instruments, Kyoto, Japan), which is equipped with Agilent Technologies DB-2887 column. The compositions of liquid products were analyzed by a gas chromatography (SHIMADZU GC-17A, Shimadzu Scientific Instruments, Kyoto, Japan) coupled with mass spectrometry (SHIMADZU MS-QP5000, Shimadzu Scientific Instruments, Kyoto, Japan) (GC/MS), which was equipped with an Agilent HP-5MS column.
The coke content of spent catalysts was determined by TGA-Q500 (TA Instruments, New Castle, DE, USA). The sample treatment procedures and analyzing program were the same to the TPO testing indicated in Section 3.4.

3.4. Catalysts Characterization

Surface area, pore volume, and pore size distribution were measured at 77K on an Autosorb-1 (ANTON PAAR USA INC., Ashland, VA, USA). The specific surface area of the catalyst powder was calculated by employing the Brunauer-Emmet-Teller (BET) method. The total pore volume of nitrogen was adsorbed under relative pressure p/p0 0.995. Pore size distribution was calculated by the Barrett-Joyner-Halenda (BJH) method.
The strength and amount of acidic/alkaline sites on the surface of catalysts was determined by NH3/CO2 temperature program desorption (TPD) using a Quantachrome Autosorb 1-C and a Residue Gas Analyzer (RGA-200, Stanford Research Systems, Sunnyvale, CA, USA). About 100–1000 mg catalyst sample was loaded into a U-shaped quartz tube, which was then installed in a furnace. The catalyst was treated in-situ at 120 °C for 1 h in helium and then was vacuumed (lower than 3000 micron) for 30 min. The catalyst underwent NH3 or CO2 adsorption at 120 °C for 1 h, and then physi-desorption at 120 °C by helium purging. Finally, the catalyst was heated up to 900 °C (at a rate of 10 °C per minute) for chemi-desorption. The weak, medium, and strong active sites of the catalyst were assigned to the peak areas of the NH3/CO2-TPD curves lower than 350 °C, between 350 and 500 °C, and above 500 °C.
The types and strengths of acids on the surface of catalysts were tested by Pyridine-FTIR. A catalyst sample of 2–15 mg was pressed to form wafers (1 cm in diameter) and installed on the support located in a cell. The cell included two KBr windows through which IR could be transmitted. The IR cell was degassed at 450 °C by an N2 flow for 1 h. When the cell’s temperature cooled down to 150 °C, the pressure of the system was evacuated to 100 micron by a high vacuum pump. Pyridine was then introduced for adsorption. The excess or physisorbed pyridine was purged by N2. Infrared spectra were recorded on a Nicolet FTIR-6700 (Thermo Fisher Scientific, Waltham, MA USA) at temperatures of 150, 250, 350, and 450 °C. Data obtained from the spectrometer were analyzed by Omnic 8 software. The characteristic bands at 1450 cm−1 and 1550 cm−1 were assigned to Lewis acid sites and Bronsted acid sites [17], respectively.
The type and the amount of coke on the spent catalysts, was determined by TPO, using a Quantachrome Autosorb 1-C and an RGA-200. About 100–200 mg sample of catalyst was loaded in a U-shaped quartz tube and installed in a furnace. The catalyst was exposed to a flow of helium (50 mL/min), and heated to 120 °C at a rate of 10 °C/min, remaining at 120 °C for 1 h. The physisorbed water in the catalyst sample was removed. Subsequently, the catalyst was heated up to 900 °C at a rate of 10 °C/min and under a flowing gas mixture of 2% vol oxygen (1 mL/min) in helium (49 mL/min).

3.5. Calculations

Oxygen removal (OR)
OR = (MOF – MOO)/MOF * 100%,
where
OR: Oxygen removal, %
MOF: Mass of Oxygen in the Feed, g. “M” means mass, “O” and “F” respectively stands for “oxygen” and “feed”.
MOO: Mass of Oxygen in the Oil products, g. “M” means mass, “O” and “O” respectively stands for “oxygen” and “oil products”.

4. Conclusions

Under inert N2 atmosphere, liquid product yields fall into the range of 29.0 and 93.4 wt.% of the feed but are lower with active sites. The higher oxygen removal (97.7–100.0 wt.%) are obtained with the presence of CaO, MgO, and Titania, whereas a minimum oxygen removal (18.5 wt.%) is obtained with quartz. Even though the oxygen removal of alumina is as high as 73.0 wt.%, light oil yield (to feed) and the valuable product yield are still the highest in all investigated catalysts. Liquid products were composed mainly of hydrocarbons ranging from 6 to 18 in the terms of carbon number, while oxygenates from 10 to 18, 20, 22, and 24. The hydrocarbons in OLPs majorly were found to be alkenes and cycloalkenes, followed by cycloalkanes and alkanes, and aromatics content was lower than 3.9 wt.%. For Lewis acidic catalysts, more acidity of the catalyst is beneficial for deoxygenation and secondary cracking as well. For basic catalysts, the saponification of oleic acid occurred. CaO has higher dehydrogenation capability than MgO does. The existence of Bronsted acids is important to the formation of aromatics.

Supplementary Materials

The following are available online at https://www.mdpi.com/2073-4344/9/12/1063/s1, Figure S1: Pore size distributions of the studied catalysts; Figure S2: Py-FTIR spectra of the acidic catalysts; Figure S3: Oleic acid decomposition process with different catalysts by TGA; Figure S4: the corresponding MS spectra of the Figure S3; Figure S5: TPO testing of the spent catalysts; Figure S6: Reaction flow chart of this study. Table S1: Operational parameters of catalyst activity performance evaluation; Table S2: Organic gas products compositions.

Author Contributions

Conceptualization, H.W., Y.Z. (Ying Zheng), and S.N.; data curation, H.W., M.S., and Y.Z. (Ying Zhao); formal analysis, H.W.; funding acquisition, H.W. and Y.Z. (Ying Zheng); investigation, H.W. and H.L.; methodology, H.W., H.L., and Y.Z. (Ying Zheng) project administration, H.W. and Y.Z. (Ying Zheng); resources, H.W. and Y.Z. (Ying Zheng); software, H.W. and H.L.; supervision, H.W. and Y.Z. (Ying Zheng); validation, H.W.; visualization, H.W. and Y.Z. (Ying Zheng); writing—original draft, H.W.; writing—review and editing, W.H., H.W., Y.Z. (Ying Zheng), S.N., and R.X.

Funding

This research was funded by the Natural Sciences and Engineering Research Council of Canada, grant number NSERC strategic: 463140-2014STPGP and NSERC DISCOVERY: RGPIN-2015-0386; the Canada Foundation for Innovation, grant number #31983; Canada Research Chairs program, grant number 950-228053; and Jiaxing University, grant number #70518034.

Conflicts of Interest

The authors declare no conflict of interest.

References

  1. Wang, H.; Li, G.; Rogers, K.; Lin, H.; Zheng, Y.; Ng, S. Hydrotreating of waste cooking oil over supported CoMoS catalyst—Catalyst deactivation mechanism study. Mol. Catal. 2017, 443, 228–240. [Google Scholar] [CrossRef]
  2. Wang, H.; Zhang, L.; Li, G.; Rogers, K.; Lin, H.; Seers, P.; Ledan, T.; Ng, S.; Zheng, Y. Application of uniform design experimental method in waste cooking oil (WCO) co-hydroprocessing parameter optimization and reaction route investigation. Fuel 2017, 210, 390–397. [Google Scholar] [CrossRef]
  3. Lu, Q.; Li, W.Z.; Zhu, X.F. Overview of fuel properties of biomass fast pyrolysis oils. Energy Convers. Manag. 2009, 50, 1376–1383. [Google Scholar] [CrossRef]
  4. Wang, H.; Lin, H.; Feng, P.; Han, X.; Zheng, Y. Integration of catalytic cracking and hydrotreating technology for triglyceride deoxygenation. Catal. Today 2017, 291, 172–179. [Google Scholar] [CrossRef]
  5. Wang, H.; Lin, H.; Zheng, Y.; Ng, S.; Brown, H.; Xia, Y. Kaolin-based catalyst as a triglyceride FCC upgrading catalyst with high deoxygenation, mild cracking, and low dehydrogenation performances. Catal. Today 2019, 319, 164–171. [Google Scholar] [CrossRef]
  6. Yigezu, Z.D.; Muthukumar, K. Catalytic cracking of vegetable oil with metal oxides for biofuel production. Energy Convers. Manag. 2014, 84, 326–333. [Google Scholar] [CrossRef]
  7. Refaat, A.A. Biodiesel production using solid metal oxide catalysts. Int. J. Environ. Sci. Technol. 2011, 8, 203–221. [Google Scholar] [CrossRef] [Green Version]
  8. Zhao, C.; Bruck, T.; Lercher, J.A. Catalytic deoxygenation of microalgae oil to green hydrocarbons. Green Chem. 2013, 15, 1720–1739. [Google Scholar] [CrossRef]
  9. Dosanjos, J.R.S.; Gonzalez, W.D.; Lam, Y.L.; Frety, R. Catalytic decomposition of vegetable oil. Appl. Catal. 1983, 5, 299–308. [Google Scholar] [CrossRef]
  10. Kirszensztejn, P.; Przekop, R.; Tolinska, A.; Mackowska, E. Pyrolytic and catalytic conversion of rape oil into aromatic and aliphatic fractions in a fixed bed reactor on Al2O3 and Al2O3/B2O3 catalysts. Chem. Pap. 2009, 63, 226–232. [Google Scholar] [CrossRef]
  11. Vonghia, E.; Boocock, D.G.B.; Konar, S.K.; Leung, A. Pathways for the deoxygenation of triglycerides to alphatic-hydrocarbons over activated alumina. Energy Fuels 1995, 9, 1090–1096. [Google Scholar] [CrossRef]
  12. Idem, R.O.; Katikaneni, S.P.R.; Bakhshi, N.N. Catalytic conversion of canola oil to fuels and chemicals: Roles of catalyst acidity, basicity and shape selectivity on product distribution. Fuel Proc. Technol. 1997, 51, 101–125. [Google Scholar] [CrossRef]
  13. Smets, K.; Roukaerts, A.; Czech, J.; Reggers, G.; Schreurs, S.; Carleer, R.; Yperman, J. Slow catalytic pyrolysis of rapeseed cake: Product yield and characterization of the pyrolysis liquid. Biomass Bioenergy 2013, 57, 180–190. [Google Scholar] [CrossRef]
  14. Xu, J.M.; Jiang, J.C.; Lu, Y.J.; Chen, J. Liquid hydrocarbon fuels obtained by the pyrolysis of soybean oils. Bioresour. Technol. 2009, 100, 4867–4870. [Google Scholar]
  15. Xu, J.; Jiang, J.; Chen, J.; Sun, Y. Biofuel production from catalytic cracking of woody oils. Bioresour. Technol. 2010, 101, 5586–5591. [Google Scholar] [CrossRef]
  16. Xu, J.; Jiang, J.; Sun, Y.; Chen, J. Production of hydrocarbon fuels from pyrolysis of soybean oils using a basic catalyst. Bioresour. Technol. 2010, 101, 9803–9806. [Google Scholar] [CrossRef]
  17. Ward, J.W. Nature of active sites on zeolite. Rare earth Y zeolite. J. Catal. 1969, 13, 321–327. [Google Scholar] [CrossRef]
  18. Serrano, D.P.; Dufour, J.; Iribarren, D. On the feasibility of producing hydrogen with net carbon fixation by the decomposition of vegetable and microalgal oils. Energy Environ. Sci. 2012, 5, 6126–6135. [Google Scholar] [CrossRef]
  19. Gosselink, R.W.; Hollak, S.A.W.; Chang, S.W.; van Haveren, J.; de Jong, K.P.; Bitter, J.H.; van Es, D.S. Reaction Pathways for the Deoxygenation of Vegetable Oils and Related Model Compounds. ChemSusChem 2013, 6, 1576–1594. [Google Scholar] [CrossRef]
  20. Rozmyslowicz, B.; Maki-Arvela, P.; Tokarev, A.; Leino, A.R.; Eranen, K.; Murzin, D.Y. Influence of Hydrogen in Catalytic Deoxygenation of Fatty Acids and Their Derivatives over Pd/C. Ind. Eng. Chem. Res. 2012, 51, 8922–8927. [Google Scholar] [CrossRef]
  21. Immer, J.G.; Kelly, M.J.; Lamb, H.H. Catalytic reaction pathways in liquid-phase deoxygenation of C18 free fatty acids. Appl. Catal. A Gen. 2010, 375, 134–139. [Google Scholar] [CrossRef]
  22. Demirbas, A.; Kara, H. New options for conversion of vegetable oils to alternative fuels. Energy Sour. Part A Recovery Util. Environ. Eff. 2006, 28, 619–626. [Google Scholar] [CrossRef]
  23. Benson, T.J.; Daggolu, P.R.; Hernandez, R.A.; Liu, S.T.; White, M.G. Catalytic deoxygenation chemistry: Upgrading of liquids derived from biomass processing. In Advances in Catalysis; Gates, B.C., Jentoft, F.C., Eds.; Academic Press: Cambridge, MA, USA, 2013; Volume 56, pp. 187–353. [Google Scholar]
  24. Tani, H.; Hasegawa, T.; Shimouchi, M.; Asami, K.; Fujimoto, K. Selective catalytic decarboxy-cracking of triglyceride to middle-distillate hydrocarbon. Catal. Today 2011, 164, 410–414. [Google Scholar] [CrossRef]
  25. Asomaning, J.; Mussone, P.; Bressler, D.C. Thermal deoxygenation and pyrolysis of oleic acid. J. Anal. Appl. Pyrolysis 2014, 105, 1–7. [Google Scholar] [CrossRef]
  26. Billaud, F.; Minh, A.K.T.; Lozano, P.; Pioch, D. Catalytic cracking of octanoic acid, Journal of Analytical and Applied Pyrolysis. J. Anal. Appl. Pyrolysis 2001, 58, 605–616. [Google Scholar] [CrossRef]
  27. Omar, R.; Robinson, J.P. Conventional and microwave-assisted pyrolysis of rapeseed oil for bio-fuel production-reaction pathways analysis by GCMS results. J. Anal. Appl. Pyrolysis 2014, 105, 131–142. [Google Scholar] [CrossRef]
  28. Yoshioka, T.; Handa, T.; Grause, G.; Lei, Z.G.; Inomata, H.; Mizoguchi, T. Effects of metal oxides on the pyrolysis of poly(ethylene terephthalate). J. Anal. Appl. Pyrolysis 2005, 73, 139–144. [Google Scholar] [CrossRef]
  29. Cerny, R.; Kubu, M.; Kubicka, D. The effect of oxygenates structure on their deoxygenation over USY zeolite. Catal. Today 2013, 204, 46–53. [Google Scholar] [CrossRef]
  30. Frety, R.; da Rocha, M.D.G.C.; Brandao, S.T.; Pontes, L.A.M.; Padilha, J.F.; Borges, L.E.P.; Gonzalez, W.A. Cracking and hydrocracking of triglycerides for renewable liquid fuels: Alternative processes to transesterification. J. Braz. Chem. Soc. 2011, 22, 1206–1220. [Google Scholar] [CrossRef]
  31. Hu, Y. Study on Direct Catalytic Cracking of High TAN Crude Oil. Ph.D. Thesis, China University of Petroleum (East China), Qingdao, China, 2011. [Google Scholar]
Figure 1. (a) Weight loss and derived weight loss of catalysts; (b) released substrates.
Catalysts 09 01063 g001
Figure 2. Chemical compositions of organic liquid products (OLPs).
Catalysts 09 01063 g002
Figure 3. Carbon number distribution of hydrocarbons.
Catalysts 09 01063 g003
Figure 4. Types of oxygenates.
Catalysts 09 01063 g004
Figure 5. Carbon number distribution of oxygenates.
Catalysts 09 01063 g005
Figure 6. Weight loss of spent catalysts.
Catalysts 09 01063 g006
Scheme 1. Possible reaction mechanisms in the current study. M stands for the metal elements.
Catalysts 09 01063 sch001
Table 1. Physical and chemical properties of catalysts.
PropertiesSurface Area (m2/g)Pore Volume (cm3/g)Amount of Active Sites (× 10−2 mmol/g) *
WeakMediumStrong
Quartz 10.14.8 × 10−40.00.00.0
MgO 111.60.220.70.00.0
CaO 113.70.10.00.0153.8
TiO2 256.90.939.810.88.0
Al2O3 2152.90.514.03.97.5
* the specific testing procedures are shown in Section 3.4 Catalyst Characterization. 1 was tested by NH3-TPD. 2 was tested by CO2-TPD.
Table 2. Product distributions and oxygen removal.
Yields (%)OilCokeGas HydrocarbonsWaterCO/CO2H2Light Oil * YieldsOR
Quartz93.40.10.90.52.60.120.818.5
Al2O382.55.13.01.610.60.440.873.0
TiO275.32.03.60.916.31.429.1100.0
MgO67.55.35.52.314.90.122.099.4
CaO29.051.23.80.019.81.016.697.7
* light oil represents that the oil product fractions with the boiling point lower than 350 °C.
Table 3. Molarity compositions of deoxygenation products.
Molarity (mol/mol Oleic Acid)COCO2H2O
Quartz0.130.050.06
Al2O30.520.210.19
TiO21.110.390.14
MgO0.820.270.30
CaO0.020.890.00

