Article

Kinetics of Fischer–Tropsch Synthesis in a 3-D Printed Stainless Steel Microreactor Using Different Mesoporous Silica Supported Co-Ru Catalysts

1
Department of Nanoengineering, Joint School of Nanoscience and Nanoengineering, North Carolina A&T State University, Greensboro, NC 27411, USA
2
Department of Chemistry, North Carolina A&T State University, Greensboro, NC 27411, USA
*
Author to whom correspondence should be addressed.
Catalysts 2019, 9(10), 872; https://doi.org/10.3390/catal9100872
Submission received: 14 September 2019 / Revised: 12 October 2019 / Accepted: 15 October 2019 / Published: 21 October 2019
(This article belongs to the Special Issue Iron and Cobalt Catalysts)

Abstract

:
Fischer–Tropsch (FT) synthesis was carried out in a 3D printed stainless steel (SS) microchannel microreactor using bimetallic Co-Ru catalysts on three different mesoporous silica supports. CoRu-MCM-41, CoRu-SBA-15, and CoRu-KIT-6 were synthesized using a one-pot hydrothermal method and characterized by Brunner–Emmett–Teller (BET), temperature programmed reduction (TPR), SEM-EDX, TEM, and X-ray photoelectron spectroscopy (XPS) techniques. The mesoporous catalysts show the long-range ordered structure as supported by BET and low-angle XRD studies. The TPR profiles of metal oxides with H2 varied significantly depending on the support. These catalysts were coated inside the microchannels using polyvinyl alcohol and kinetic performance was evaluated at three different temperatures, in the low-temperature FT regime (210–270 °C), at different Weight Hourly Space Velocity (WHSV) in the range of 3.15–25.2 kgcat.h/kmol using a syngas ratio of H2/CO = 2. The mesoporous supports have a significant effect on the FT kinetics and stability of the catalyst. The kinetic models (FT-3, FT-6), based on the Langmuir–Hinshelwood mechanism, were found to be statistically and physically relevant for FT synthesis using CoRu-MCM-41 and CoRu-KIT-6. The kinetic model equation (FT-2), derived using Eley–Rideal mechanism, is found to be relevant for CoRu-SBA-15 in the SS microchannel microreactor. CoRu-KIT-6 was found to be 2.5 times more active than Co-Ru-MCM-41 and slightly more active than CoRu-SBA-15, based on activation energy calculations. CoRu-KIT-6 was ~3 and ~1.5 times more stable than CoRu-SBA-15 and CoRu-MCM-41, respectively, based on CO conversion in the deactivation studies.

1. Introduction

Although Fischer–Tropsch (FT) synthesis was discovered by Franz Fischer and Hans Tropsch in the 1920s in Germany [1], it has gained immense attention in last few years due to depletion of non-renewable energy sources. FT synthesis is an environmental friendly route for alternative fuels and can produce liquid fuels from carbon sources by coal-to-liquid (CTL), natural gas-to-liquid (GTL) and biomass-to-liquid (BTL) [2] processes. Three types of reactors have been utilized commercially for FT synthesis: Fixed bed, fluidized bed, and slurry bubble column bed by leading GTL companies like Shell, Sasol, Exxon Mobil, and Energy Int. [3]. There is a minimum scale limit of this FT process to be economical; for example, the Pearl GTL, a collaboration between Shell and Qatar petroleum, producing 140,000 bpd (barrels per day) is considered as a profitable economic scale for the FT GTL process [4]. The limitation of the scale-up considerations to commercialize small scale plants to be more profitable has driven industries and researchers to pursue an interest in alternative technologies. Since FT synthesis is highly exothermic in nature, there is a need for much process intensification technologies. The microreactor platform, which contains microstructured units called microreactors, uses a large number of small, parallel channels with different channel designs. This technology provides an alternative platform for controlling highly exothermic reactions like FT synthesis with enhanced mass and heat transfer. It has gained much attention in process intensification of FT synthesis [5,6] as isothermal operating conditions are well maintained in a microreactor with good control over process parameters which favors quick screening of catalyst for different chemical reactions. The reaction zone for these microreactors are several parallel microchannels with small geometry. The specific surface area of the reaction zone is greatly enhanced by the design of microchannels resulting in an efficient FT synthesis. In addition to efficient heat and mass transfer with good heat dissipation, microreactors also have advantages such as high reaction throughput, easy scale-up, good portability, and lower cost over conventional reactors [6,7,8,9,10]. This has been demonstrated commercially and in R&D by Velocys and Micrometrics Corporations [11,12,13,14].
Iron, cobalt, and ruthenium catalysts have been extensively used for FT synthesis [15]. To increase the performance of catalysts, different supports have been used; some of the previous studies examined the role of Al2O3 [16,17,18,19,20], TiO2 [21,22,23,24,25,26,27,28], SiO2 [29,30,31,32,33], and CNTs [34,35,36] as supporting materials for the formation of higher alkanes. These supports tend to enhance the FT process by increasing the active number of catalytic sites and good metal dispersion with the high surface area. Therefore, the selection of support and study of its interaction with the incorporated metal ion plays an important role in catalysis. In our previous studies, sol-gel encapsulated catalysts were used in silicon microreactors for FT synthesis [37,38,39]. While Al2O3 and SiO2 sol-gel supports show similar behavior in formation of higher alkanes such as ethane, propane, and butane for the reactions at 1 atm, TiO2 has a profound effect on FT synthesis [40] and the stability of the catalysts are observed in reverse order from that observed with SiO2 and Al2O3. However, in all these studies, sol-gel coated catalysts in silicon microreactors tend to have challenges such as low surface area, clogging of microchannels and difficulty in reducing the metal oxides to expose active sites. In addition, the Si-microreactors are fragile and they break easily and require a large infrastructure for fabrication. Further, it’s more difficult to increase pressure for FT studies using Si-microreactors. Thus, we have turned our attention to 3D printed stainless steel (SS) microreactors which are easy to fabricate by direct metal laser sintering layer-by-layer additive manufacturing technique. Recently, 3D printed microreactors have been used as flow devices in many chemical reactions such as fast difluoromethylation [41], a customizable Lab-On-Chip device for optimization of carvone semicarbazon [42], a micro fuel cell [43,44], and wide range of organic and inorganic reactions [45,46,47]. Further, these metal printed microreactors have been used for high pressure and temperature chemical reactions providing a new fast developing reactor technology in process development to industrial scale [47], which makes them suitable for reactions like FT synthesis due to its good mechanical and thermal properties. Although the specific surface area of stainless steel microreactor is less when compared to silicon microreactors used in our previous studies [40], the use of stainless steel material increases heat transfer, its chemical and mechanical resistances play a major role in process intensification of chemical processes. In order to increase specific surface area of the reaction zone in microreactors, we synthesized catalysts with surface area greater than 1000 m2/g using mesoporous MCM-41 support. The use of high surface area MCM-41 for FT catalysis stems from our previous studies, which can be prepared easily by one-pot hydrothermal procedure and are extremely stable, for steam reforming of methanol to produce hydrogen [48,49,50,51]. Bimetallic catalysts containing Co and one other metal—Fe, Ru, or Ni—were prepared to investigate the synergistic effect of bi-metallic species on the FT performance (manuscript submitted), The results show that CoRu-MCM-41 is more active than other bimetallic catalysts in producing longer-chain hydrocarbons at one atmosphere.
In this manuscript, we have focused on the kinetics of FT synthesis in a 3-D printed Stainless Steel(SS) microreactor using CoRu bimetallic catalysts supported by MCM-41, and two other mesoporous silica supports: SBA-15 and KIT-6. In order to translate new advancements in the laboratory as well as industry on both catalysis and microreactors for FT synthesis, chemical kinetics is a key issue in developing mathematical models for the reactors. However, to our knowledge, the kinetics of FT synthesis using mesoporous materials in a microreactor is relatively unknown in the literature. So, in order to understand more about the interaction between silica mesoporous materials and the metal, and especially kinetics, three different types of silica mesoporous materials (MCM-41, SBA-15, and KIT-6) containing cobalt and ruthenium metals were synthesized by one-pot hydrothermal method. To address the thermodynamic stability of the catalysts, CO-conversion using these three catalysts in the 3-D printed SS microchannel microreactor was also investigated.

2. Results and Discussion

2.1. Catalyst Characterization

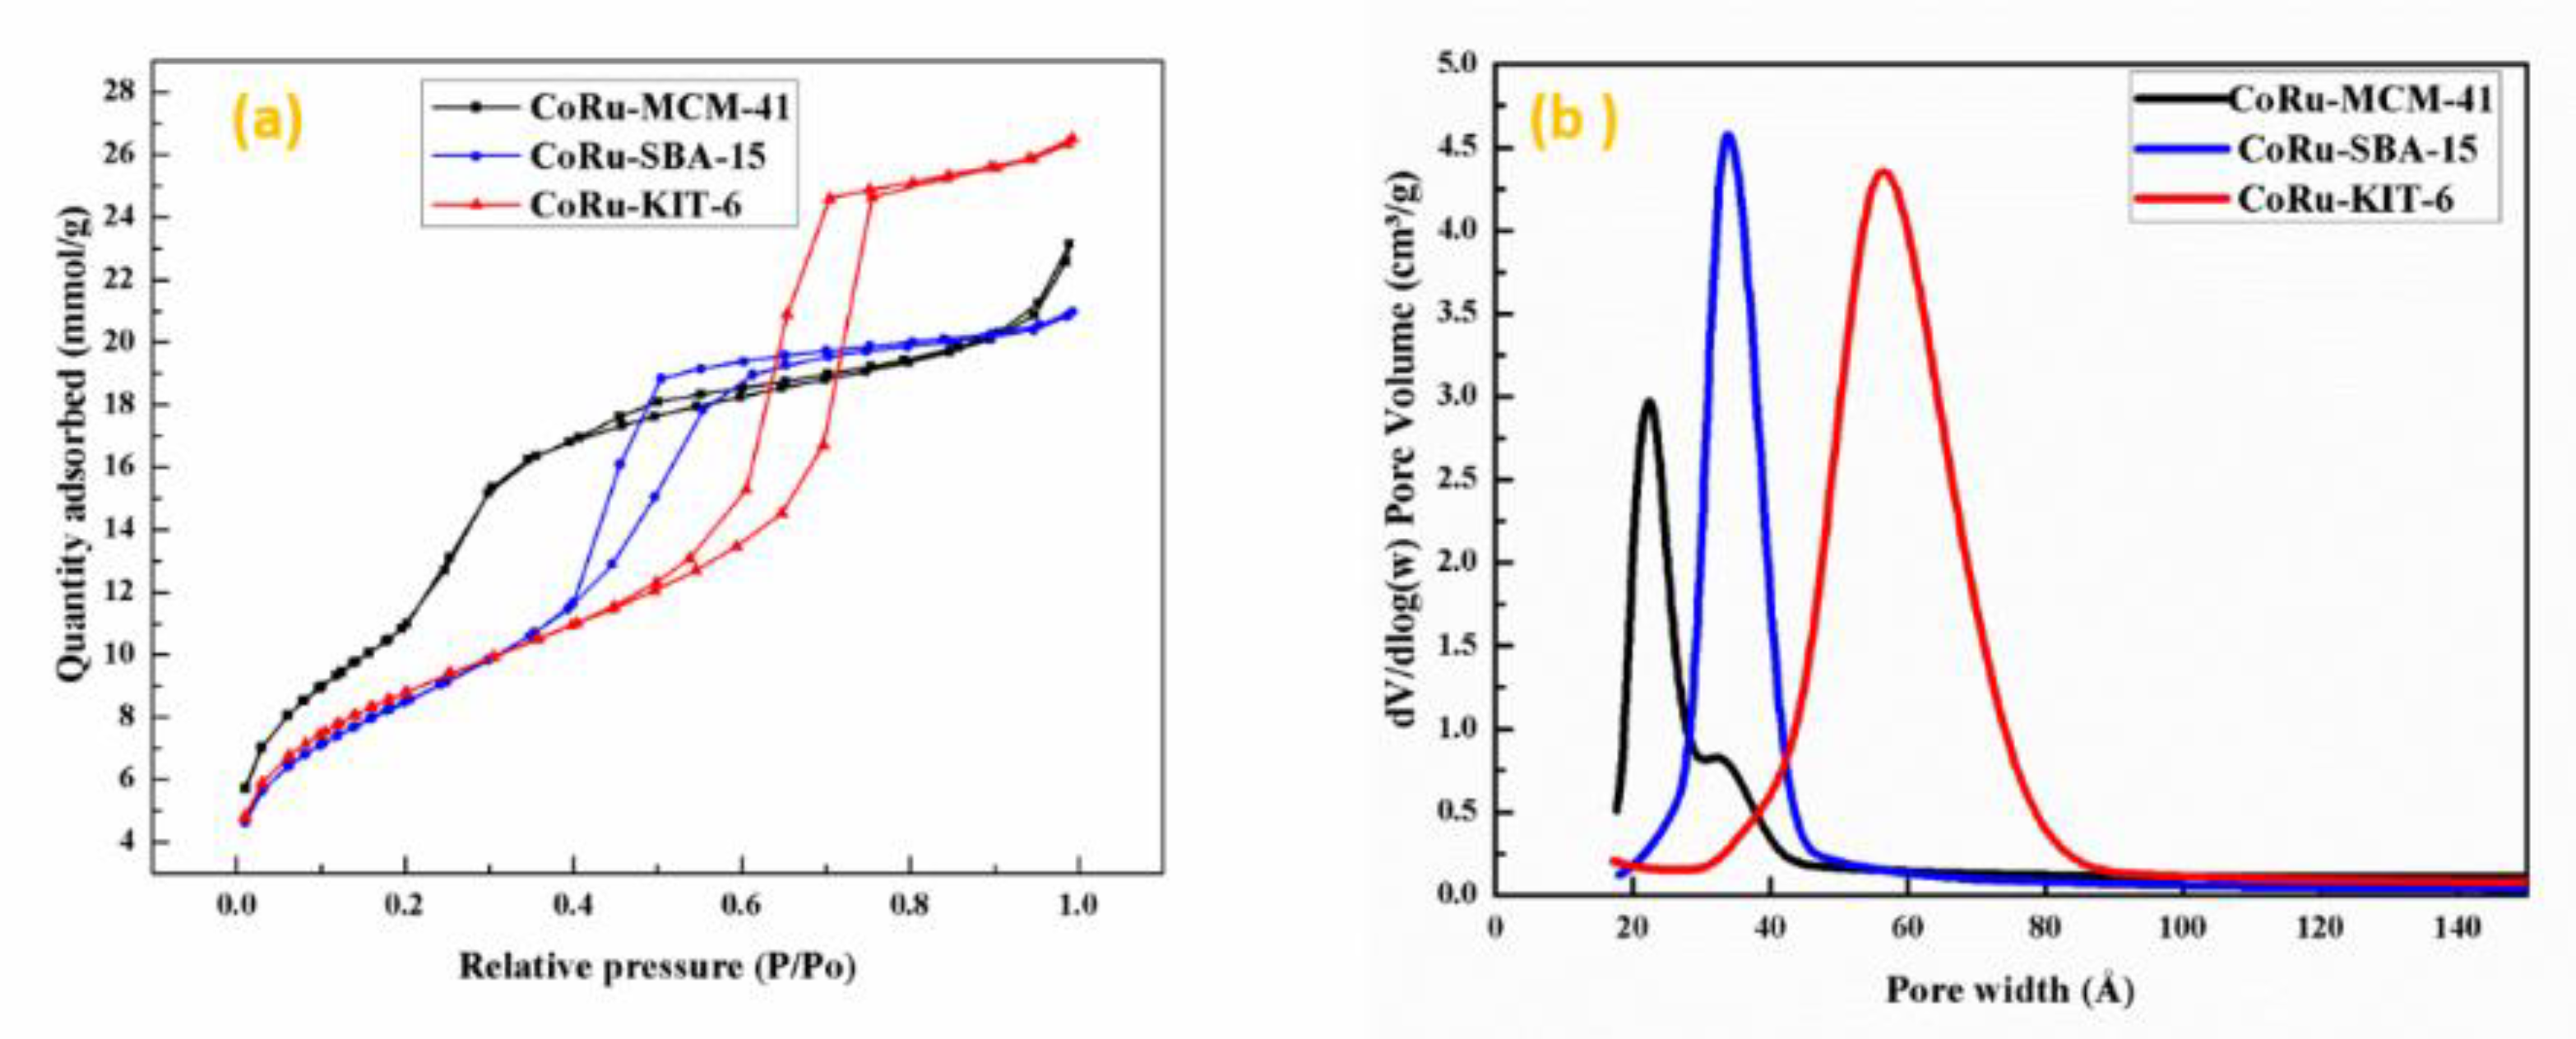
2.1.1. Textural Evaluation of Catalysts

The textural properties of the catalysts were evaluated using nitrogen Brunner–Emmett–Teller (BET) physisorption analysis. Table 1 shows the BET surface area, pore volume and the average pore diameter of all three catalysts. The surface areas of the catalysts are different depending upon the type of silica support. While the surface area of CoRu-MCM-41 was 1025 m2/g, that of CoRu-SBA-15 and CoRu-KIT-6 was around 691 m2/g and 690 m2/g, respectively. The general trend is consistent with that reported in the literature [48,52,53]. The pore diameter in the range of 3.2–5.3 nm was obtained from BJH desorption plot. The pore volume was in the range of 0.77–0.92 cm3/g. Figure 1a shows nitrogen adsorption–desorption isotherms for all the catalysts with pore size distribution of mesoporous materials. These isotherms represent the category of Type IV isotherms which is typical for mesoporous materials as mentioned in IUPAC classification [54]. These isotherms are classified into three different types of regions. The initial part of isotherm is a linear increment of nitrogen uptake at lower relative pressures (P/P0 = 0–0.2) called Type II isotherm. This is due to the adsorption of N2 on monolayer and multilayer within the pore walls of the catalyst. For relative pressure in the range of P/P0 = 0.2–0.4, there is an exponential increment in the isotherms which indicates the ordered mesoporous structure of the catalysts. Especially, the steepness of CoRu-MCM-41 is sharp when compared to the other two samples which indicate that MCM-41 support is more ordered in the nature of all the catalysts. Finally, the third region, in the relative pressure range of P/P0 = 0.4–0.95, has a long plateau for all the catalysts and it corresponds to the multilayer adsorption on the outer surface of the catalyst. The hysteresis loop for the samples is associated with condensation of N2 uptake in the interstitial voids of mesopores of the support [55]. Figure 1b shows pore size distribution obtained from BJH desorption plots. A sharp single peak for pore size with narrow distribution is observed for all the catalysts covering uniformly the pores with sizes in the range of 3.2 to 5.3 nm as shown in Table 1. The pore sizes of KIT-6 support appear to be larger and wider when compared to that of MCM-41 and SBA-15 supports. Furthermore, the pore distribution of MCM-41 is bi-modal, having major pores distributed in the range of 2 to 3 nm and minimal pore distribution between 3–4 nm.

2.1.2. SEM-EDX Analysis

The metal loadings in the catalysts (wt%) and the surface morphology were obtained by SEM-EDX analysis. Figure S1 shows the SEM-EDX images of a typical MCM-41 catalyst showing uniform metal distribution with porous morphology. The actual and intended metal loadings are quite similar (Table 1) and suggest that the one-pot hydrothermal synthesis is one of the best routes to prepare mesoporous materials with uniform metal distribution. This uniformity plays a key role in the activity of FT catalysts; it not only decreases sintering but also increases the thermal stability of the catalysts for long-term studies.

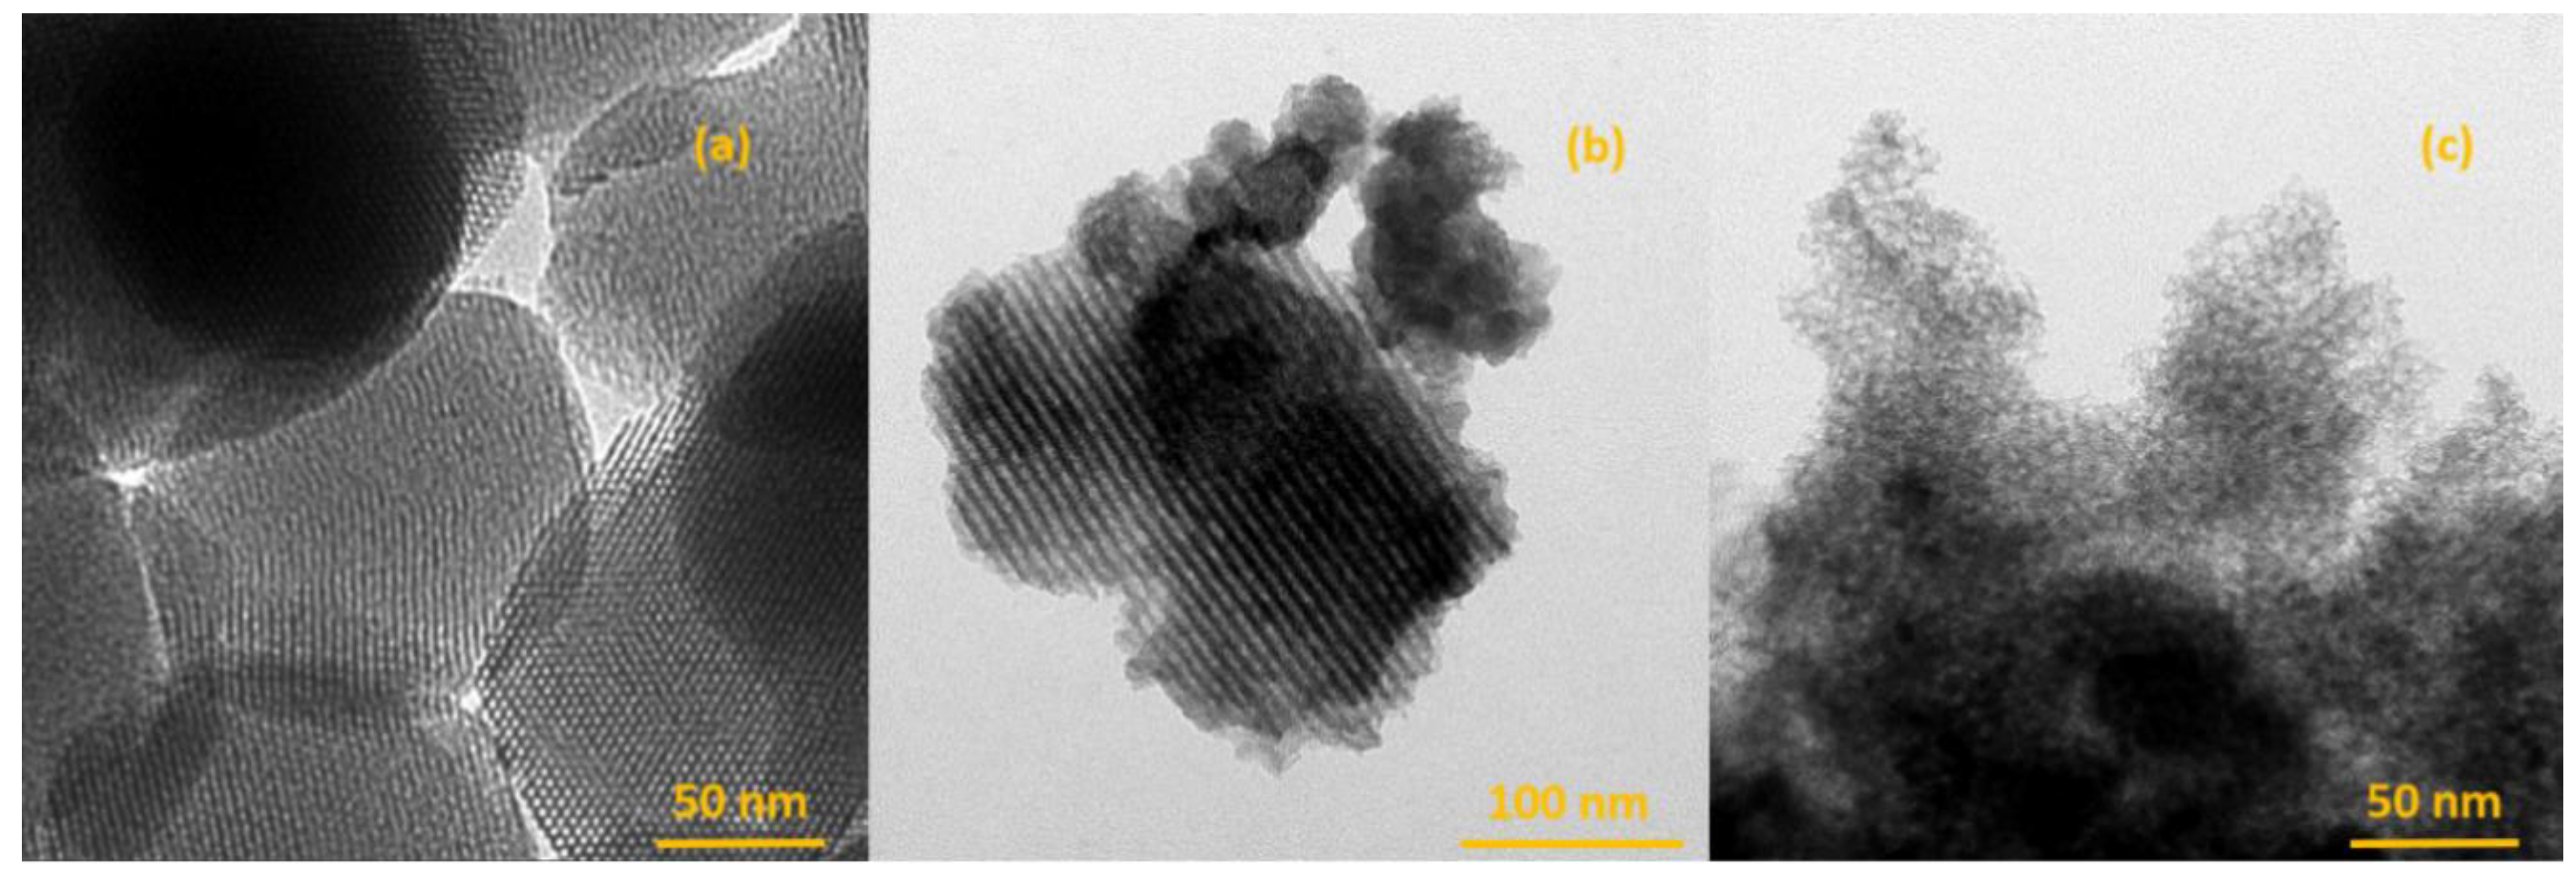
2.1.3. Transmission Electron Microscopic (TEM) Imaging

The size of the metal particles and the structure of the mesoporous support in all catalysts were obtained from TEM studies. The high magnification images in Figure 2 show the uniform ordered hexagonal pores present in the support. It is also worth noting that MCM-41 support has well defined hexagonal pores when compared to KIT-6 and SBA-15 and this is consistent with the BET surface area and the low angle XRD studies (discussed below). A uniform metal distribution with black dots, as shown in Figure S2, having almost circular in shape is clearly evident in the mesoporous silica matrix.

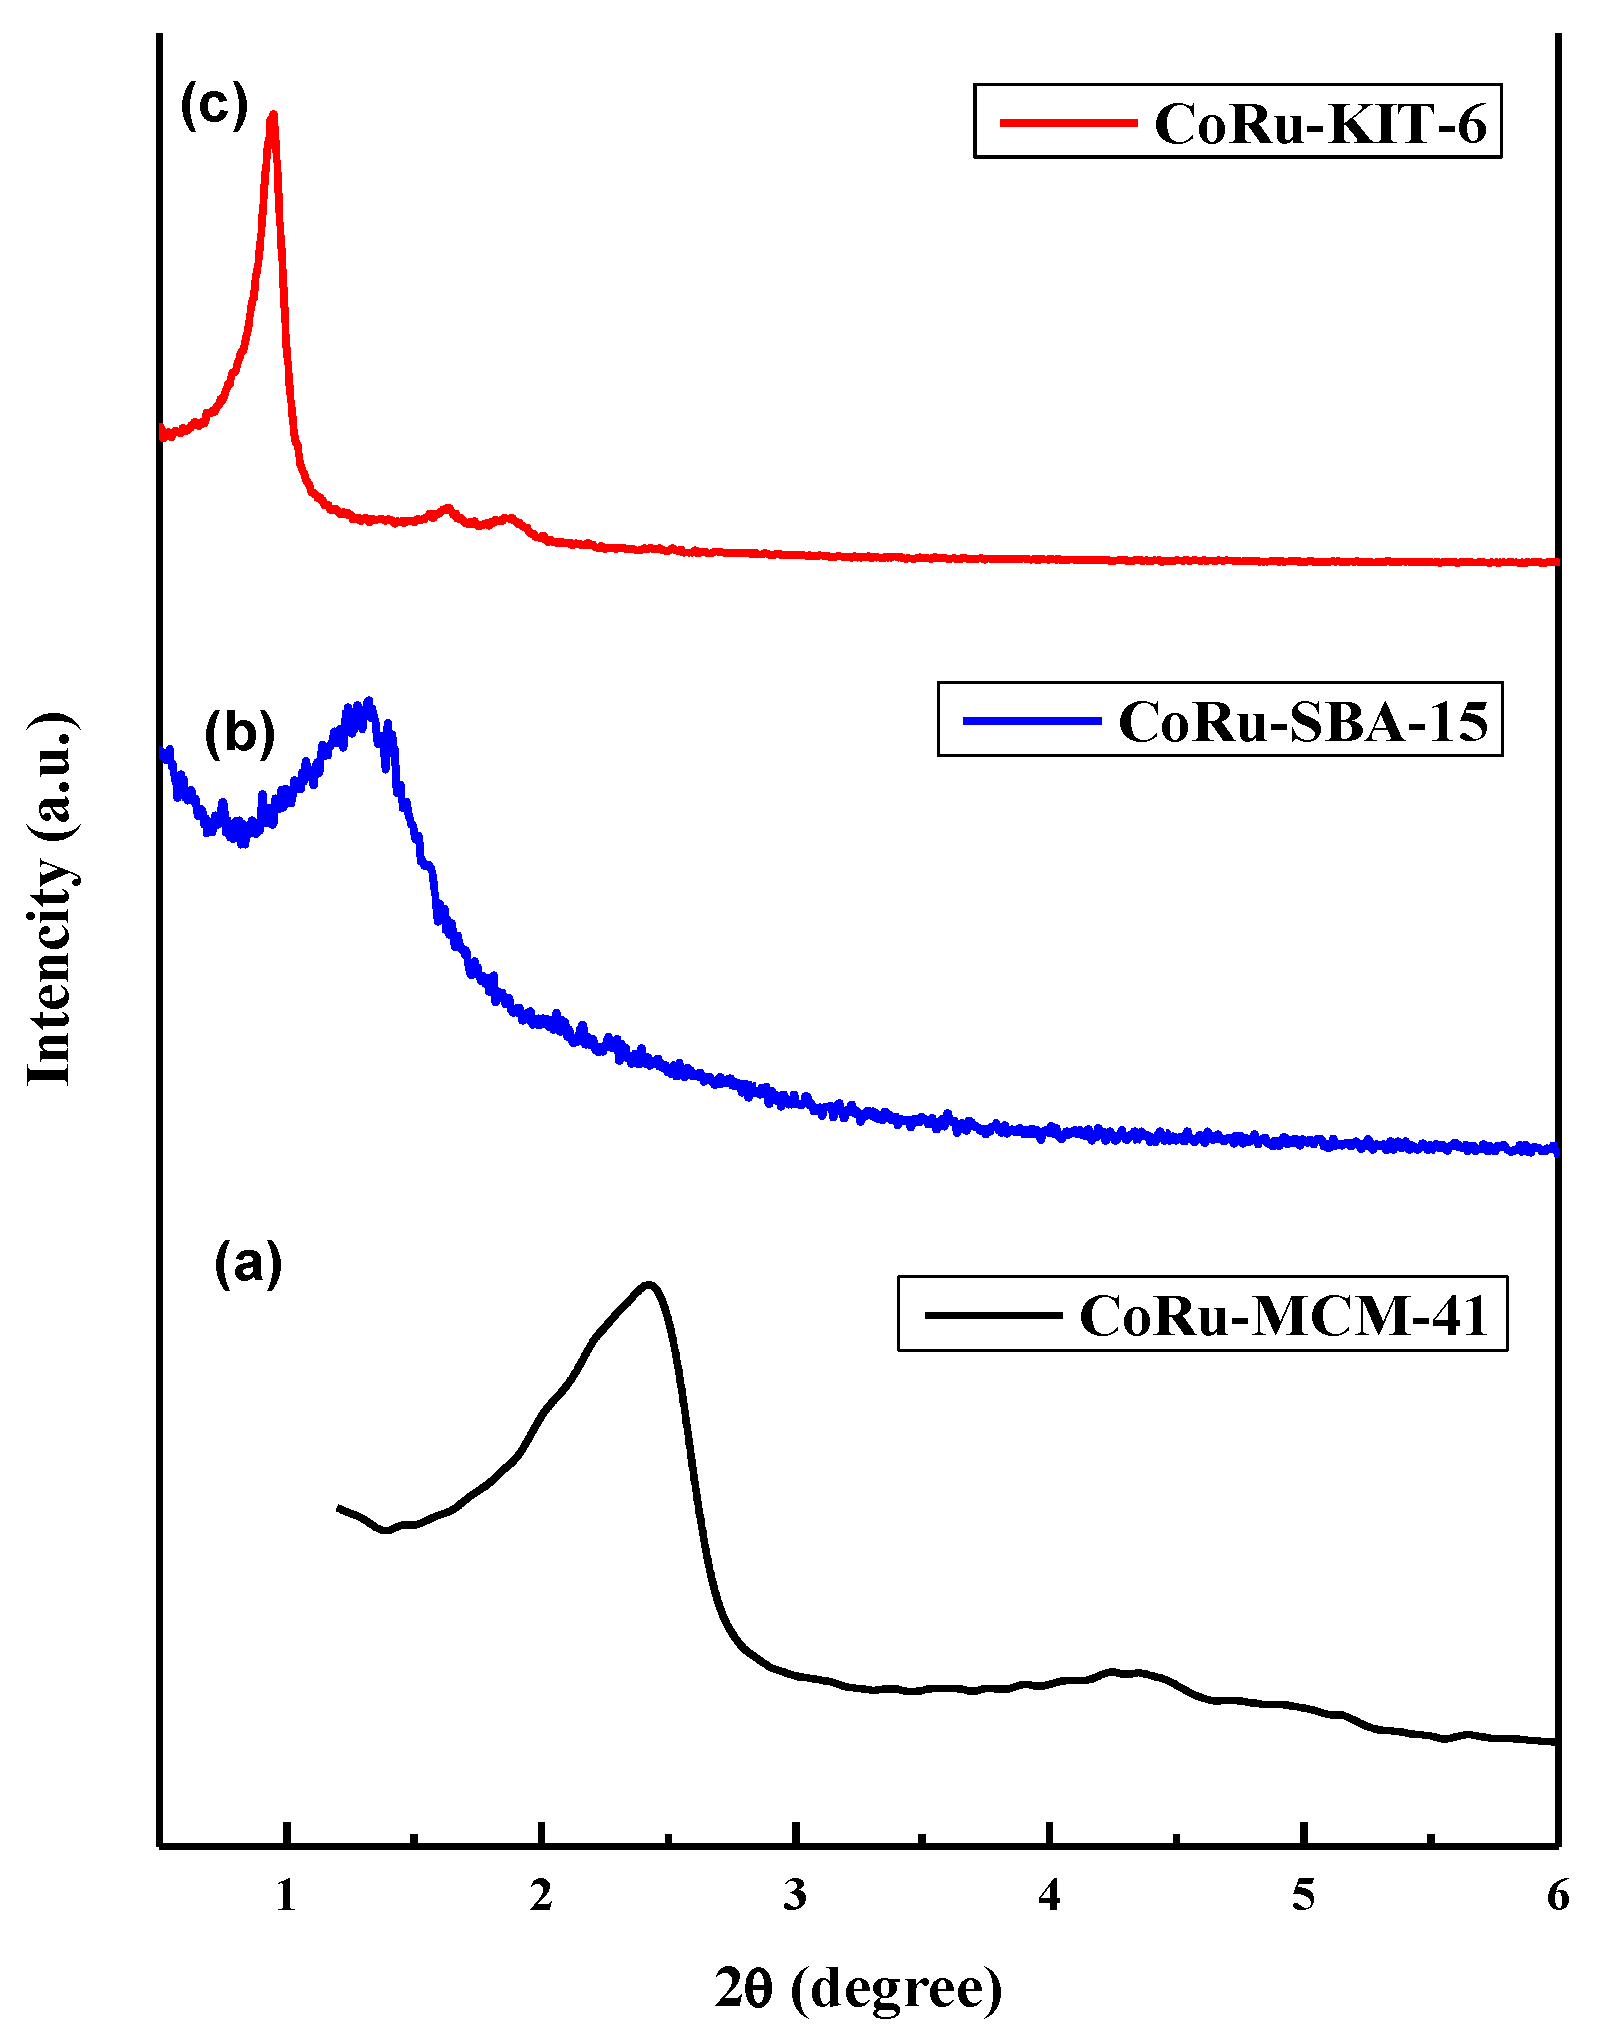
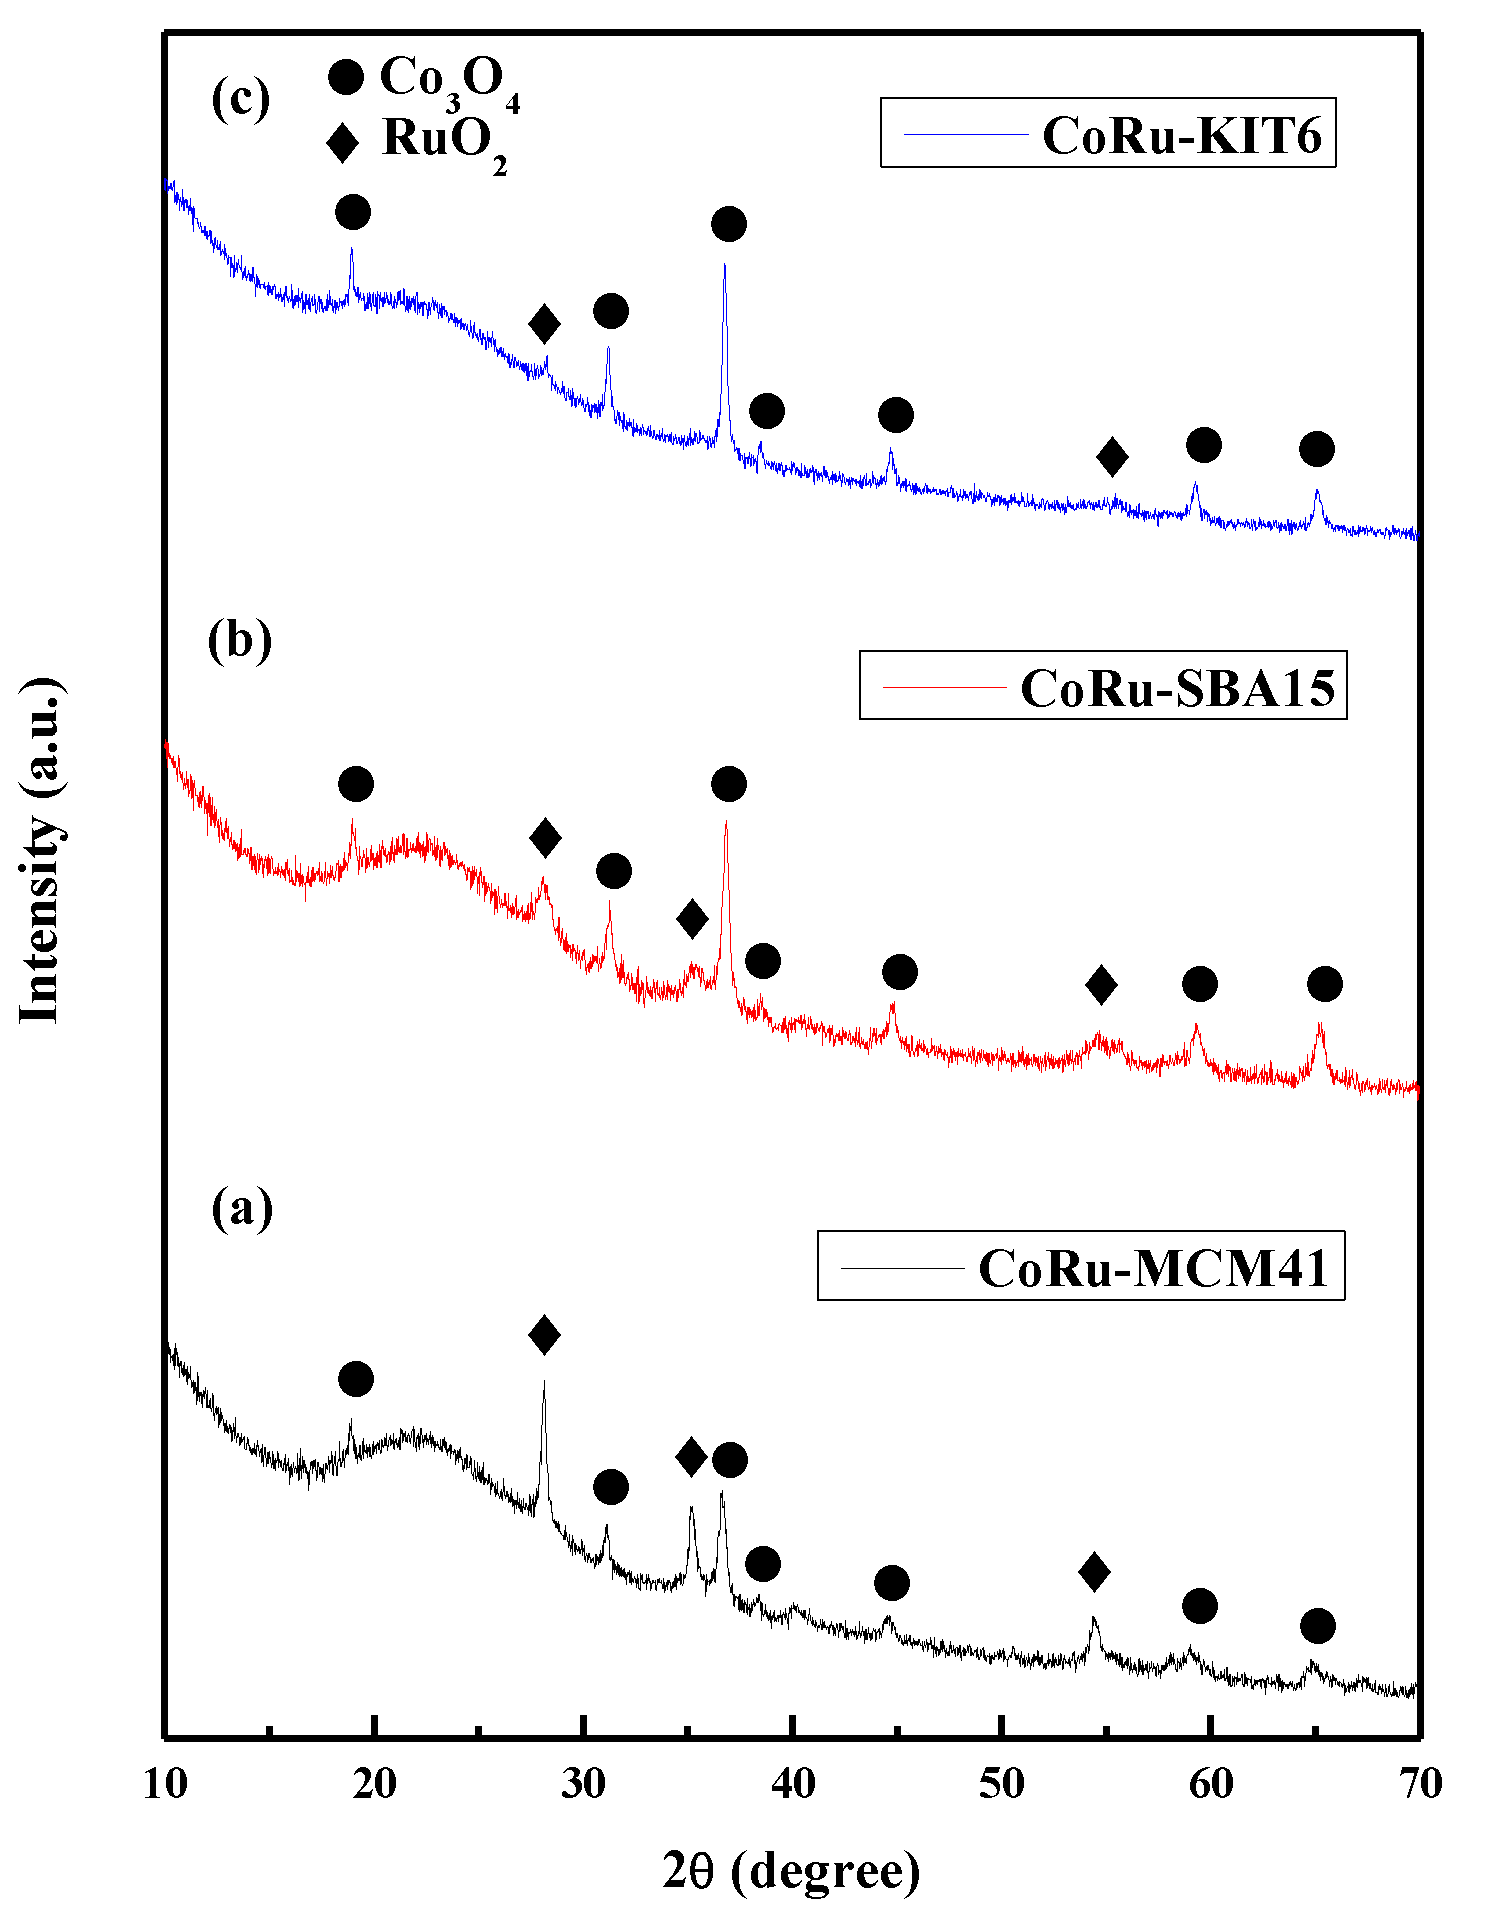
2.1.4. Powder X-Ray Diffraction (XRD) Studies of Calcined Catalysts

In order to obtain information about the structural phases of the catalysts, XRD studies were carried out. Figure 3 shows the small angle XRD diffraction patterns for different mesoporous silica supported catalysts. The variations of peaks are probably due to the presence of metal nanoparticles present in the catalyst. For CoRu-MCM-41 catalyst, a sharp intense peak between 2-theta values 2–3° and two broad peaks between 2-theta values 4–5.5° corresponds to (100), (110), and (200) reflections of hexagonal mesoporous structure. This confirms that these catalysts are highly ordered mesoporous in nature with no deformation of hexagonal framework even after the addition of metals and this is consistent with the observed TEM images. For CoRu-SBA-15 catalyst, the peak between 2-theta value 1–2° indicates the mesoporous structure with 2D hexagonal symmetry with p6mm space group and long range ordered mesoporous structure [56]. For CoRu-KIT-6 catalyst, the peak at 2-theta value 0.94° corresponds to (211) plane and two low intensity peaks between 1.5–2° ascribes to (420) and (332) diffraction planes. These planes confirmed the characteristic three-dimensional nature of mesoporous KIT-6 reported in the literature [57].
The wide-angle XRD (WAXRD) analysis was carried out to determine the crystallinity of metal oxides in different mesoporous supports. Figure 4 shows the WAXRD patterns of these samples. The observed 2θ angles are compared with the JCPDS (Joint Committee on Powder Diffraction Standards) database. For all catalysts, the peaks at 18.90° (111), 31.09° (220), 36.74° (311), 38.36° (222), 44.72° (400), 59.25° (511), and 65.26° (440) correspond to the cubic structure of Co3O4 (JCPDS-42-1467) [58,59]. The orthorhombic structure of RuO2 (JCPDS-88-0323) is consistent with the observed peaks at 28.18° (110), 35.27° (101), and 54.56° (211) in all the catalysts.

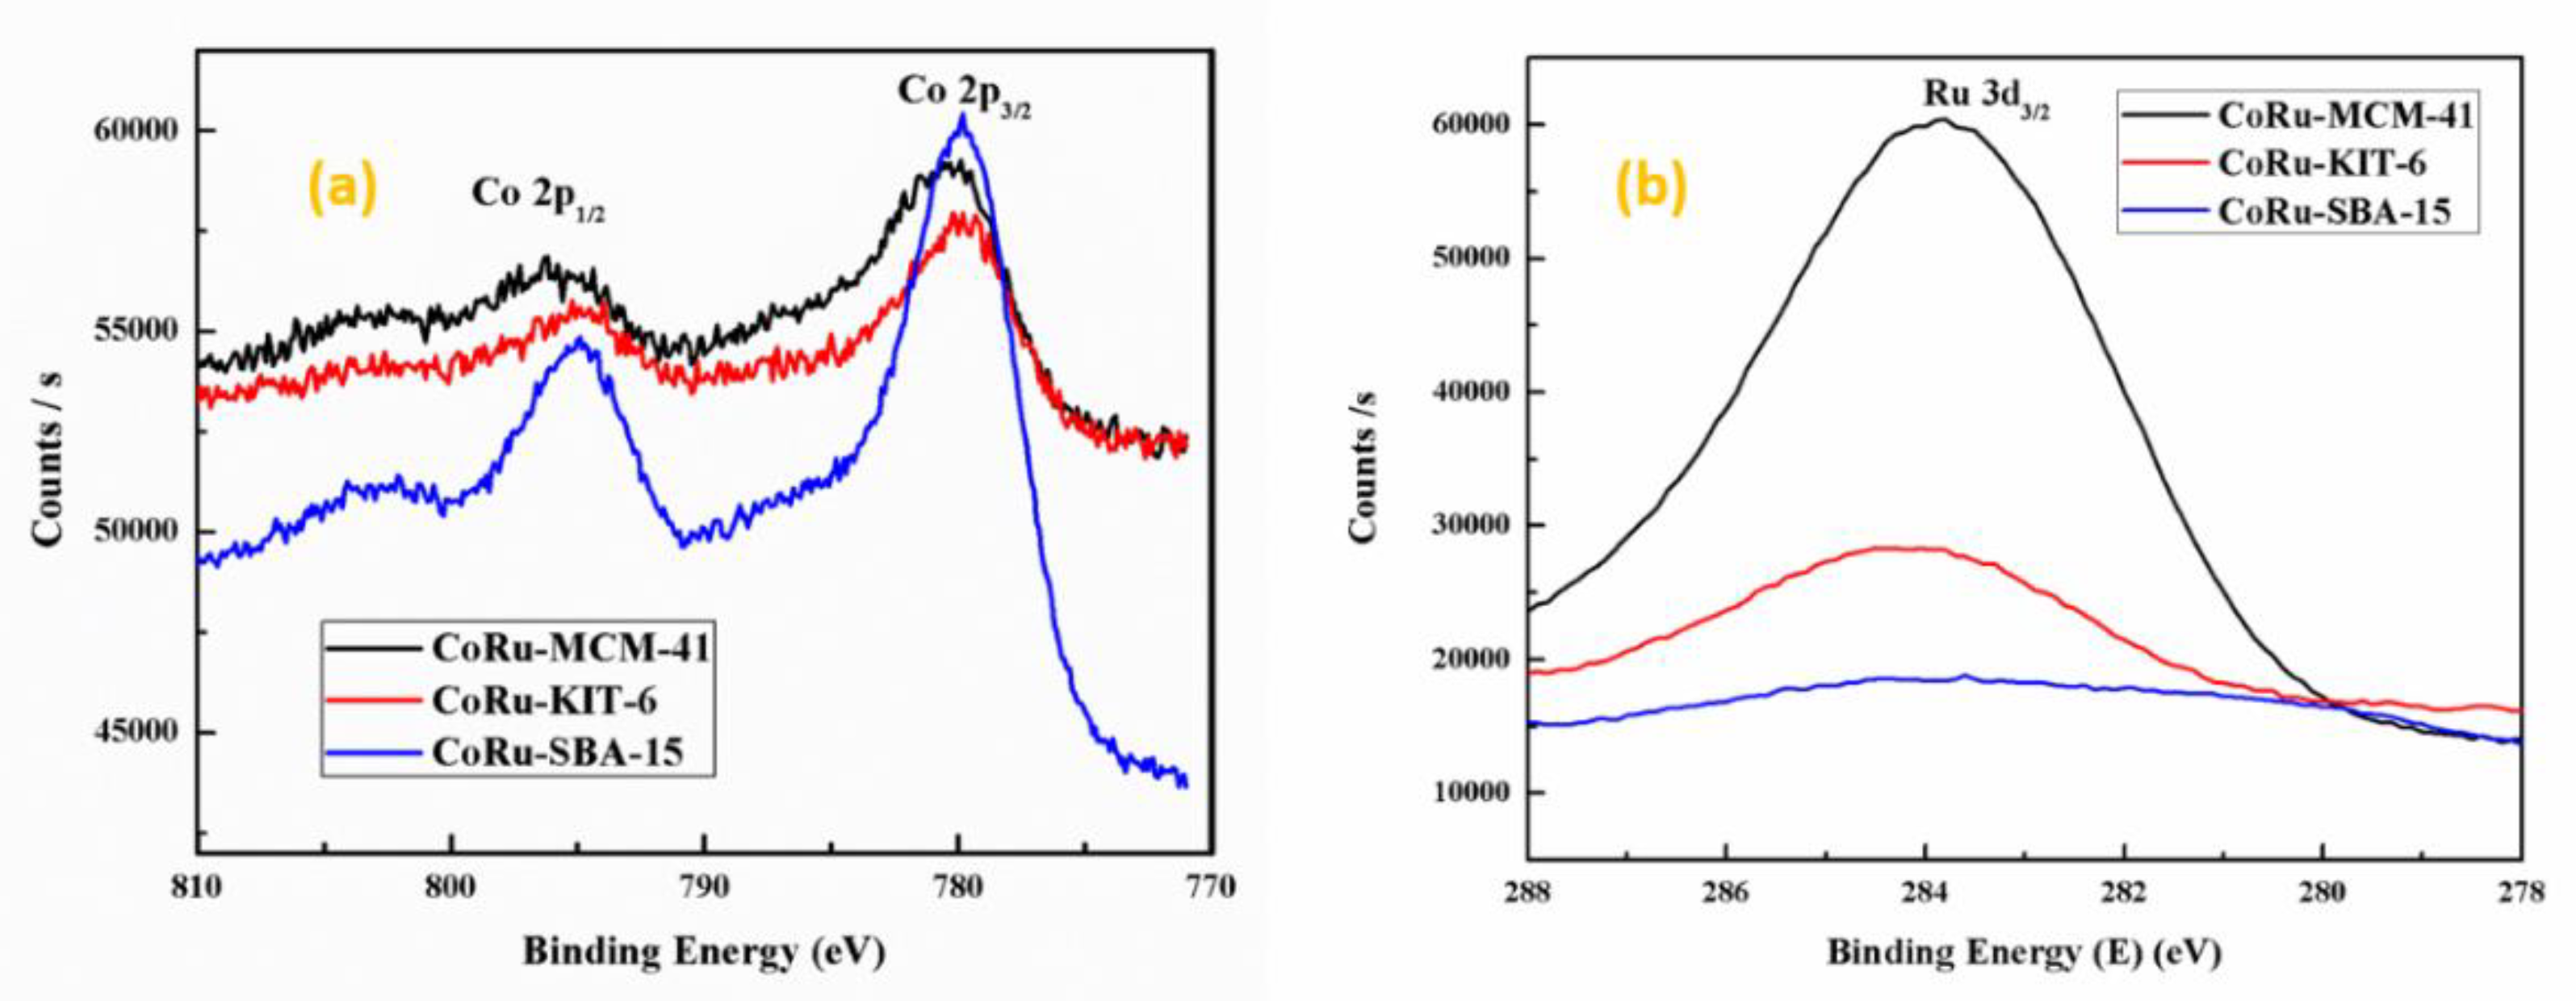
2.1.5. X-Ray Photoelectron Spectroscopy (XPS)

To determine the oxidation states of Co and Ru in MCM-41, KIT-6, and SBA-15, XPS studies were performed. Figure S3 shows the XPS spectra of Si 2p and O 1s containing a single spectrum which is centered at 104 eV and 532 eV, respectively, and confirms the presence of silicates in the sample. Figure 5a shows the Co 2p spectra for all the samples; the Co 2p3/2, and Co 2p1/2 peaks are clearly observed to indicate the presence of cobalt in two oxidation states in the silica matrix [60,61,62]. The peaks centered at 780.5 eV and 796.2 eV are associated with Co 2p3/2 and Co 2p1/2, respectively in the MCM-41 matrix. Whereas, in the case of KIT-6, the peaks for Co 2p3/2 and Co 2p1/2 are observed at 779.6 eV and 795.8 eV, respectively. For SBA-15, the similar peaks are noticed at 779.7 eV and 794.8 eV, respectively. It is clear from these data that the binding energy for cobalt in the MCM-41 matrix is distinctly higher when compared to that of cobalt in KIT-6 and SBA-15. This suggests that cobalt in two oxidation states in MCM-41 is in a different environment from that of SBA-15 and KIT-6. This is also consistent with temperature programmed reduction (TPR) profile showing much higher reduction temperatures for CoRu-MCM-41 catalyst as discussed below. Similar XPS spectra for Co 2p were observed and analyzed by Bhoware et al., [63]. Figure 5b shows the XPS spectra for the ruthenium metal in the catalyst. The presence of Ru in the sample is confirmed by the Ru 3d spectra which is centered almost at 284.8 eV and it is associated with the Ru 3d3/2 oxidation state [64]. However, in contrast to cobalt, there is no significant difference in the binding energy of the Ru metal ions in different mesoporous silica supports.

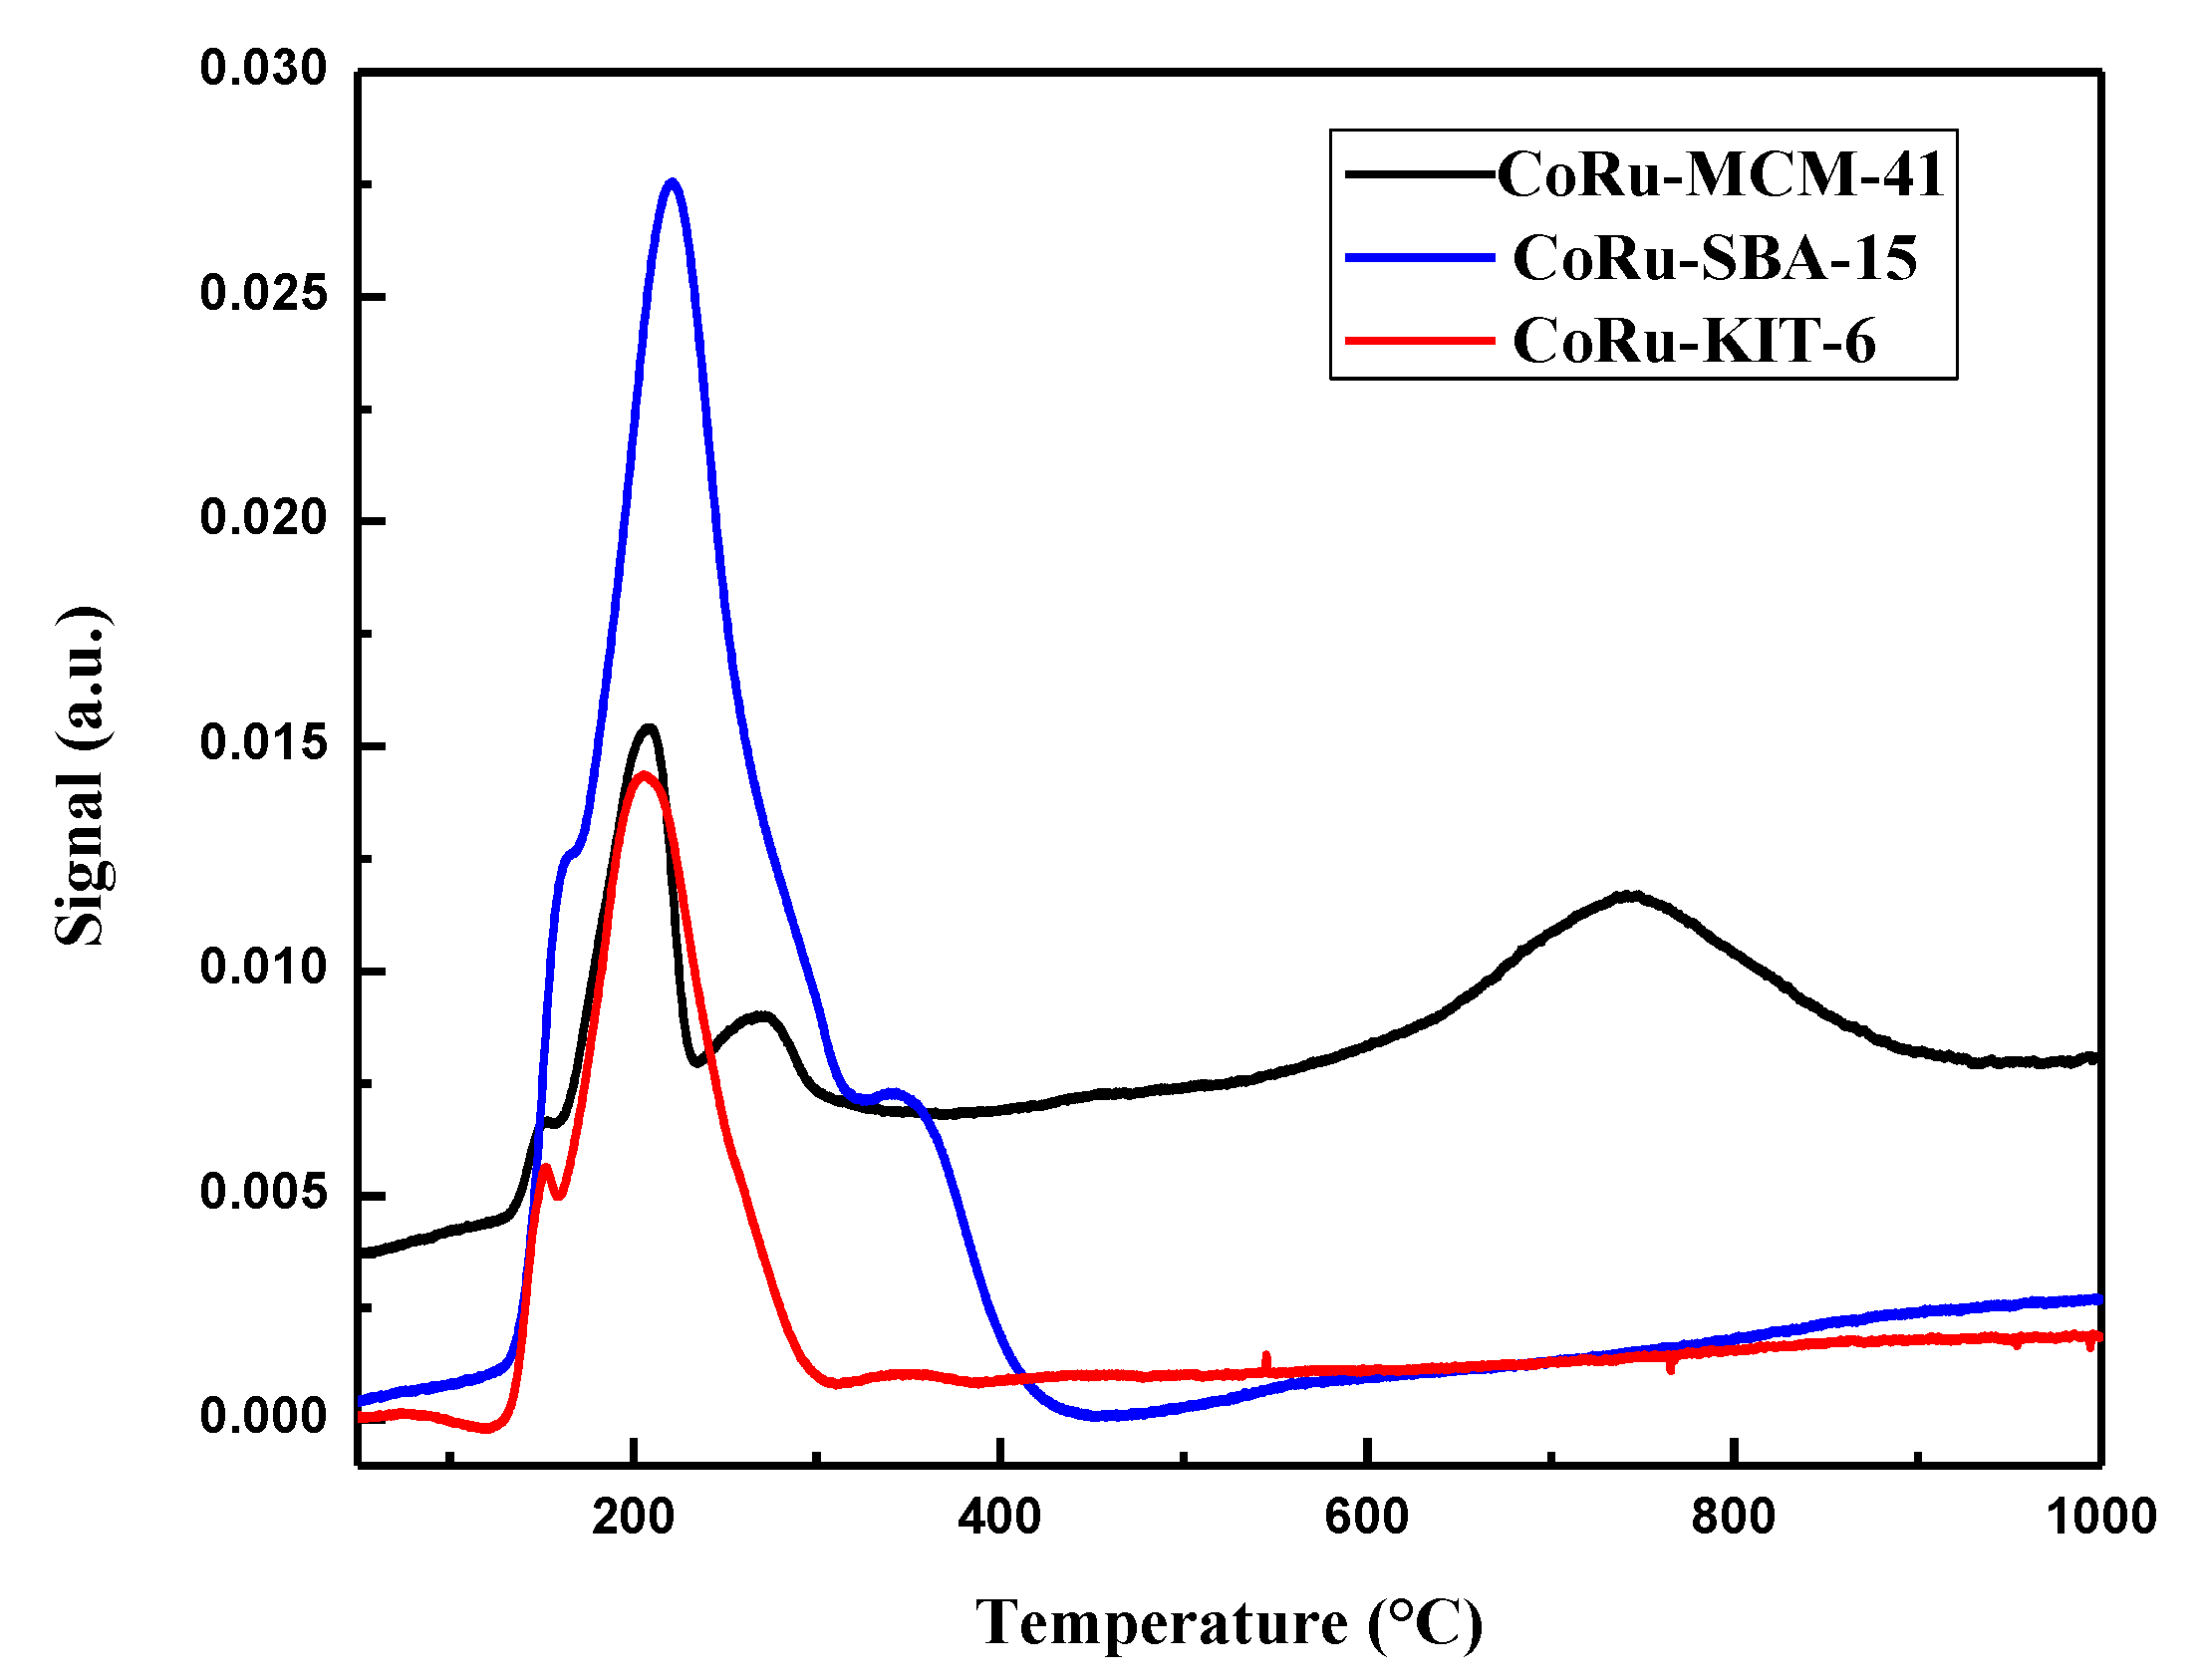
2.1.6. H2 Temperature Programmed Reduction (H2 TPR)

Temperature programmed reduction (TPR) is an ideal technique to analyze the reduction behavior of metal oxides in mesoporous silica. It helps to investigate the interaction between metal and the support by providing information on physiochemical properties of the material. All the calcined catalysts are treated with 10%H2 to record TPR profiles for Co and Ru metal oxides shown in Figure 6. All the samples contain well defined peaks for ruthenium at low reduction temperatures and cobalt at much higher reduction temperatures. The TPR profiles of all the catalysts show that the ruthenium oxide is reduced with H2 at a relatively lower temperature between 100 °C and 250 °C with main hydrogen consumption peaks for Ru3+ to Ru0 which is also reported by Panpranot et al. [65]. However, the reduction behavior of Co3O4 (Co3O4 → CoO → Co0) [66] in three samples to Co0 is remarkably different depending on the type of support. For MCM-41, as reported by Lim et al., the small peak centered around 310 °C ascribes the reduction of cobalt to CoO, while the second main peak corresponds to the reduction of CoO to metal ions Co2+ into the silica network [67]. The last hydrogen uptake has a peak centered almost 780 °C which suggests that the cobalt and the MCM-41 support have strong interaction which is also confirmed by the binding energy obtained from XPS in Figure 5a [48,68]. This could be due to the formation of a spinel structure as cobalt silicates [69] and consistent with the XPS and XRD data. Unlike MCM-41, the reduction temperatures of Co inSBA-15 and KIT-6 were quite low around 365 °C and 375 °C, respectively, confirming weaker metal interactions with SBA-15 and KIT-6 supports [53]. However, no separate three peaks were observed for the reduction of cobalt, this may be due to the absence of silicates in SBA-15 and KIT-6 samples. The shift in the reduction peaks to the lower temperatures can also be due to the incorporation of Ru metal in the support [70]. Although the 5% weight of Ru is maintained in the catalyst sample, there might be a slight difference in the actual loadings of the Ru metal as shown in EDX Table 2. Qin et al., have studied the effect of the Ru metal on Co-SBA-15 catalyst at different loading and found a remarkable effect on the activity of catalyst during the FT synthesis [70]. Thus, the overall interactions of metal–metal and metal–support have a strong influence on the reducibility and reactivity of the catalysts for FT synthesis. Since the operating temperature zone of the FT synthesis is less than 350 °C, the activity of the catalyst is more dependent on the ease of reducibility of the metal oxides to pure metals (active sites) in the support.
The amount of hydrogen consumed by CoRu-MCM-41, CoRu-SBA-15, and CoRu-KIT-6 catalysts was calculated and quantified to be 0.108, 0.05, and 0.032 mmol H2/gm, respectively in the temperature range of 25 to 1000 °C. The amount of hydrogen consumed by CoRu-MCM-41 was found almost two times more than that of CoRu-SBA-15 and 3 times more than by CoRu-KIT-6. Higher hydrogen uptake by CoRu-MCM-41 is most likely due to the reduction of Co-silicates ~750 °C.
Although MCM-41 exhibits higher hydrogen consumption than other catalysts, the amount of hydrogen adsorbed by CoRu-KIT-6 in the temperature range of 25–311 °C is higher when compared to that by CoRu-MCM-41 and CoRu-SBA-15 in the same range of temperature.

2.2. FT Reaction Mechanism

In order to have a better understanding of the effect of metal and support interaction on catalysts, kinetic studies were carried out in the SS microchannel microreactors. The main difficulty to describe the FT kinetics is the complexity of its mechanism and a larger number of possible chemical species involved. Kinetic models of FT synthesis using Co based catalysts are less abundant than Fe based catalysts in literature [71]. Most of the existing models are mainly based on power-law models where Langmuir–Hinselwood (LH) type equations have been used by different researchers [72,73,74,75,76]. Although the simple power-law expression is widely recognized in the field of catalysis, it was recognized to have limited application in FT synthesis due to the narrow range of reaction conditions [77,78]. However, LH type equations are widely used for prediction of rates over a wide range of reaction conditions. As an example, Yates and Satterfield [72] worked on Co-catalyst and fitted the rate data obtained at 220–240 °C. They found that the rate data were best fitted with simple LH expression. Rautavuoma and van dar Baan [79] reported the rate of reaction at 1 atm pressure and 250 °C. They observed that reaction proceeds through CO dissociation and formation of -CH2- surface intermediate.

2.2.1. Reaction Mechanism

In the microchannels of the microreactor, the flow of reactants is basically laminar. The complexity of the microchannel microreactor increases due to the parabolic type velocity profile; so, an average velocity profile is approximated during the development of the model for the microreactor system [80]. The outlet concentrations of the limiting reactant (CO), which was related to the rate of reaction, were calculated by an in-line GCMS. The following differential equation was used for a reactor model defined as Equation (1):
W c a t F i n , C O = X C O , i n X C O , o u t d X C O r C O
  • W c a t = Wt. of the catalyst
  • F i n , C O = Molar feed rate of CO
  • X C O = Conversion of CO
  • r C O = Disappearance rate of CO
Equation (2), below, is used to calculate the disappearance rate of CO
r C O = X C O F i n , C O W c a t
The following boundary conditions (BC) were used:
  • W = 0; Fi =Fi(inlet)
  • W = Wcat; Fi = Fi(exit)
The partial pressure of the compound was calculated using the following equations:
p i = m i i = 1 N c m i P T
where pi is the partial pressure of the component, PT is the total pressure of the reactor at the inlet (1 atm) and Nc is the total number of components. mi is the number of moles of component i.

2.2.2. Mechanism and Kinetics

In order to determine the most suitable kinetic model for a particular catalyst, all possible combinations of FT reactions were considered and rate equations were developed based on CO conversion. A number of Langmuir–Hinshelwood and Eley–Rideal models have been developed for kinetics of CO hydrogenation to hydrocarbons in different types of reactors over the past few years [80,81,82]. In this study, it was assumed that the FT reactions occur only at active sites and proposed six possible mechanisms for FT reactions to develop kinetic models in the microchannel microreactor as shown in Table 2. In order to derive an appropriate model that describes a suitable FT equation, we considered six cases with different elementary reaction steps for each case as shown in Table 2.
In FT-1, CO is adsorbed on active site (*) of catalyst to form a CO* intermediate. Then, CO* reacts with H2 to give the products C (hydrocarbons) and D (H2O). Similarly, H2 can be adsorbed on the catalyst site (*) to form H2* intermediate and this intermediate subsequently reacted with CO to yield products in the FT-2 mechanism. There are two steps of adsorption in the FT-3 mechanism. In 1st and 2nd steps, CO and H2 both are adsorbed on catalyst active site (*) to form two intermediates (CO* and H2*). In the last step (surface reaction), these two intermediates react with each other to give products C and D. The FT-4 model consisted of three different steps. In the 1st step (adsorption), CO is adsorbed on catalyst site (*) to form CO*. In 2nd step (surface reaction), the intermediate (CO*) reacts with H2 to form another intermediate (COH2*). In the last step (desorption), the final intermediate gave products (C and D). Like FT-4, FT-5 also consists of three different steps—adsorption, surface reaction, and desorption. In the 1st step (adsorption), H2 is adsorbed on catalyst site (*) to form the H2* intermediate. This intermediate reacts with CO to form another intermediate (COH2*) in the 2nd step (surface reaction). In 3rd step, the products (C and D) are formed from the intermediate (COH2*). In contrast to other models, FT-6 consists of four different steps. The 1st and 2nd steps are like that of the FT-3 mechanism. The 3rd step is the surface reaction where two intermediates (CO* and H2*) react with each other to give another intermediate COH2* and released one active site (*). In last step (desorption), the intermediate (COH2*) yields products (C and D).
Using the six models described above, six rate equations can be deduced for FT reactions by considering surface reaction and rate-limiting desorption as shown in Table 3. (See Appendix A for the rate equation derived using the FT-3 kinetic model).
All the models presented in Table 3 were verified against experimental data to obtain the best suitable mechanism with the best fit. The models FT-1, FT-2, FT-4, and FT-5 are based on Eley–Rideal-type mechanism. In this case, one reactant gets adsorbed and another reactant reacts directly from the gas phase to form intermediates that yield products. Other models FT-3 and FT-6 are based on the Langmuir–Hinshelwood mechanism, which means all reactants are adsorbed on the catalyst surface before the products are formed. The kinetic parameter (k) and equilibrium constants (K1, K2, K3) at each temperature were evaluated by non-linear regression analysis based on Levenberg–Marquart algorithm in POLYMATH software by minimizing the sum of squared residuals of reaction rates [83,84]. The objective function is defined as:
F = i = 1 N ( r c a l i r exp i ) 2
where, N is the number of total observations, r c a l i and r exp i are calculated from the model equation and experimental rates at the different reaction temperatures.
The rate constants and the equilibrium constants can be related to The Arrhenius equation and van’t Hoff laws as shown below:
k i ( T ) = A exp ( E a i R T )
K i ( T ) = K exp ( Δ H i R T )
where ki and Ki are reaction and equilibrium constants, respectively. Eai and ΔHi are the apparent activation energy and standard enthalpy change of i species.

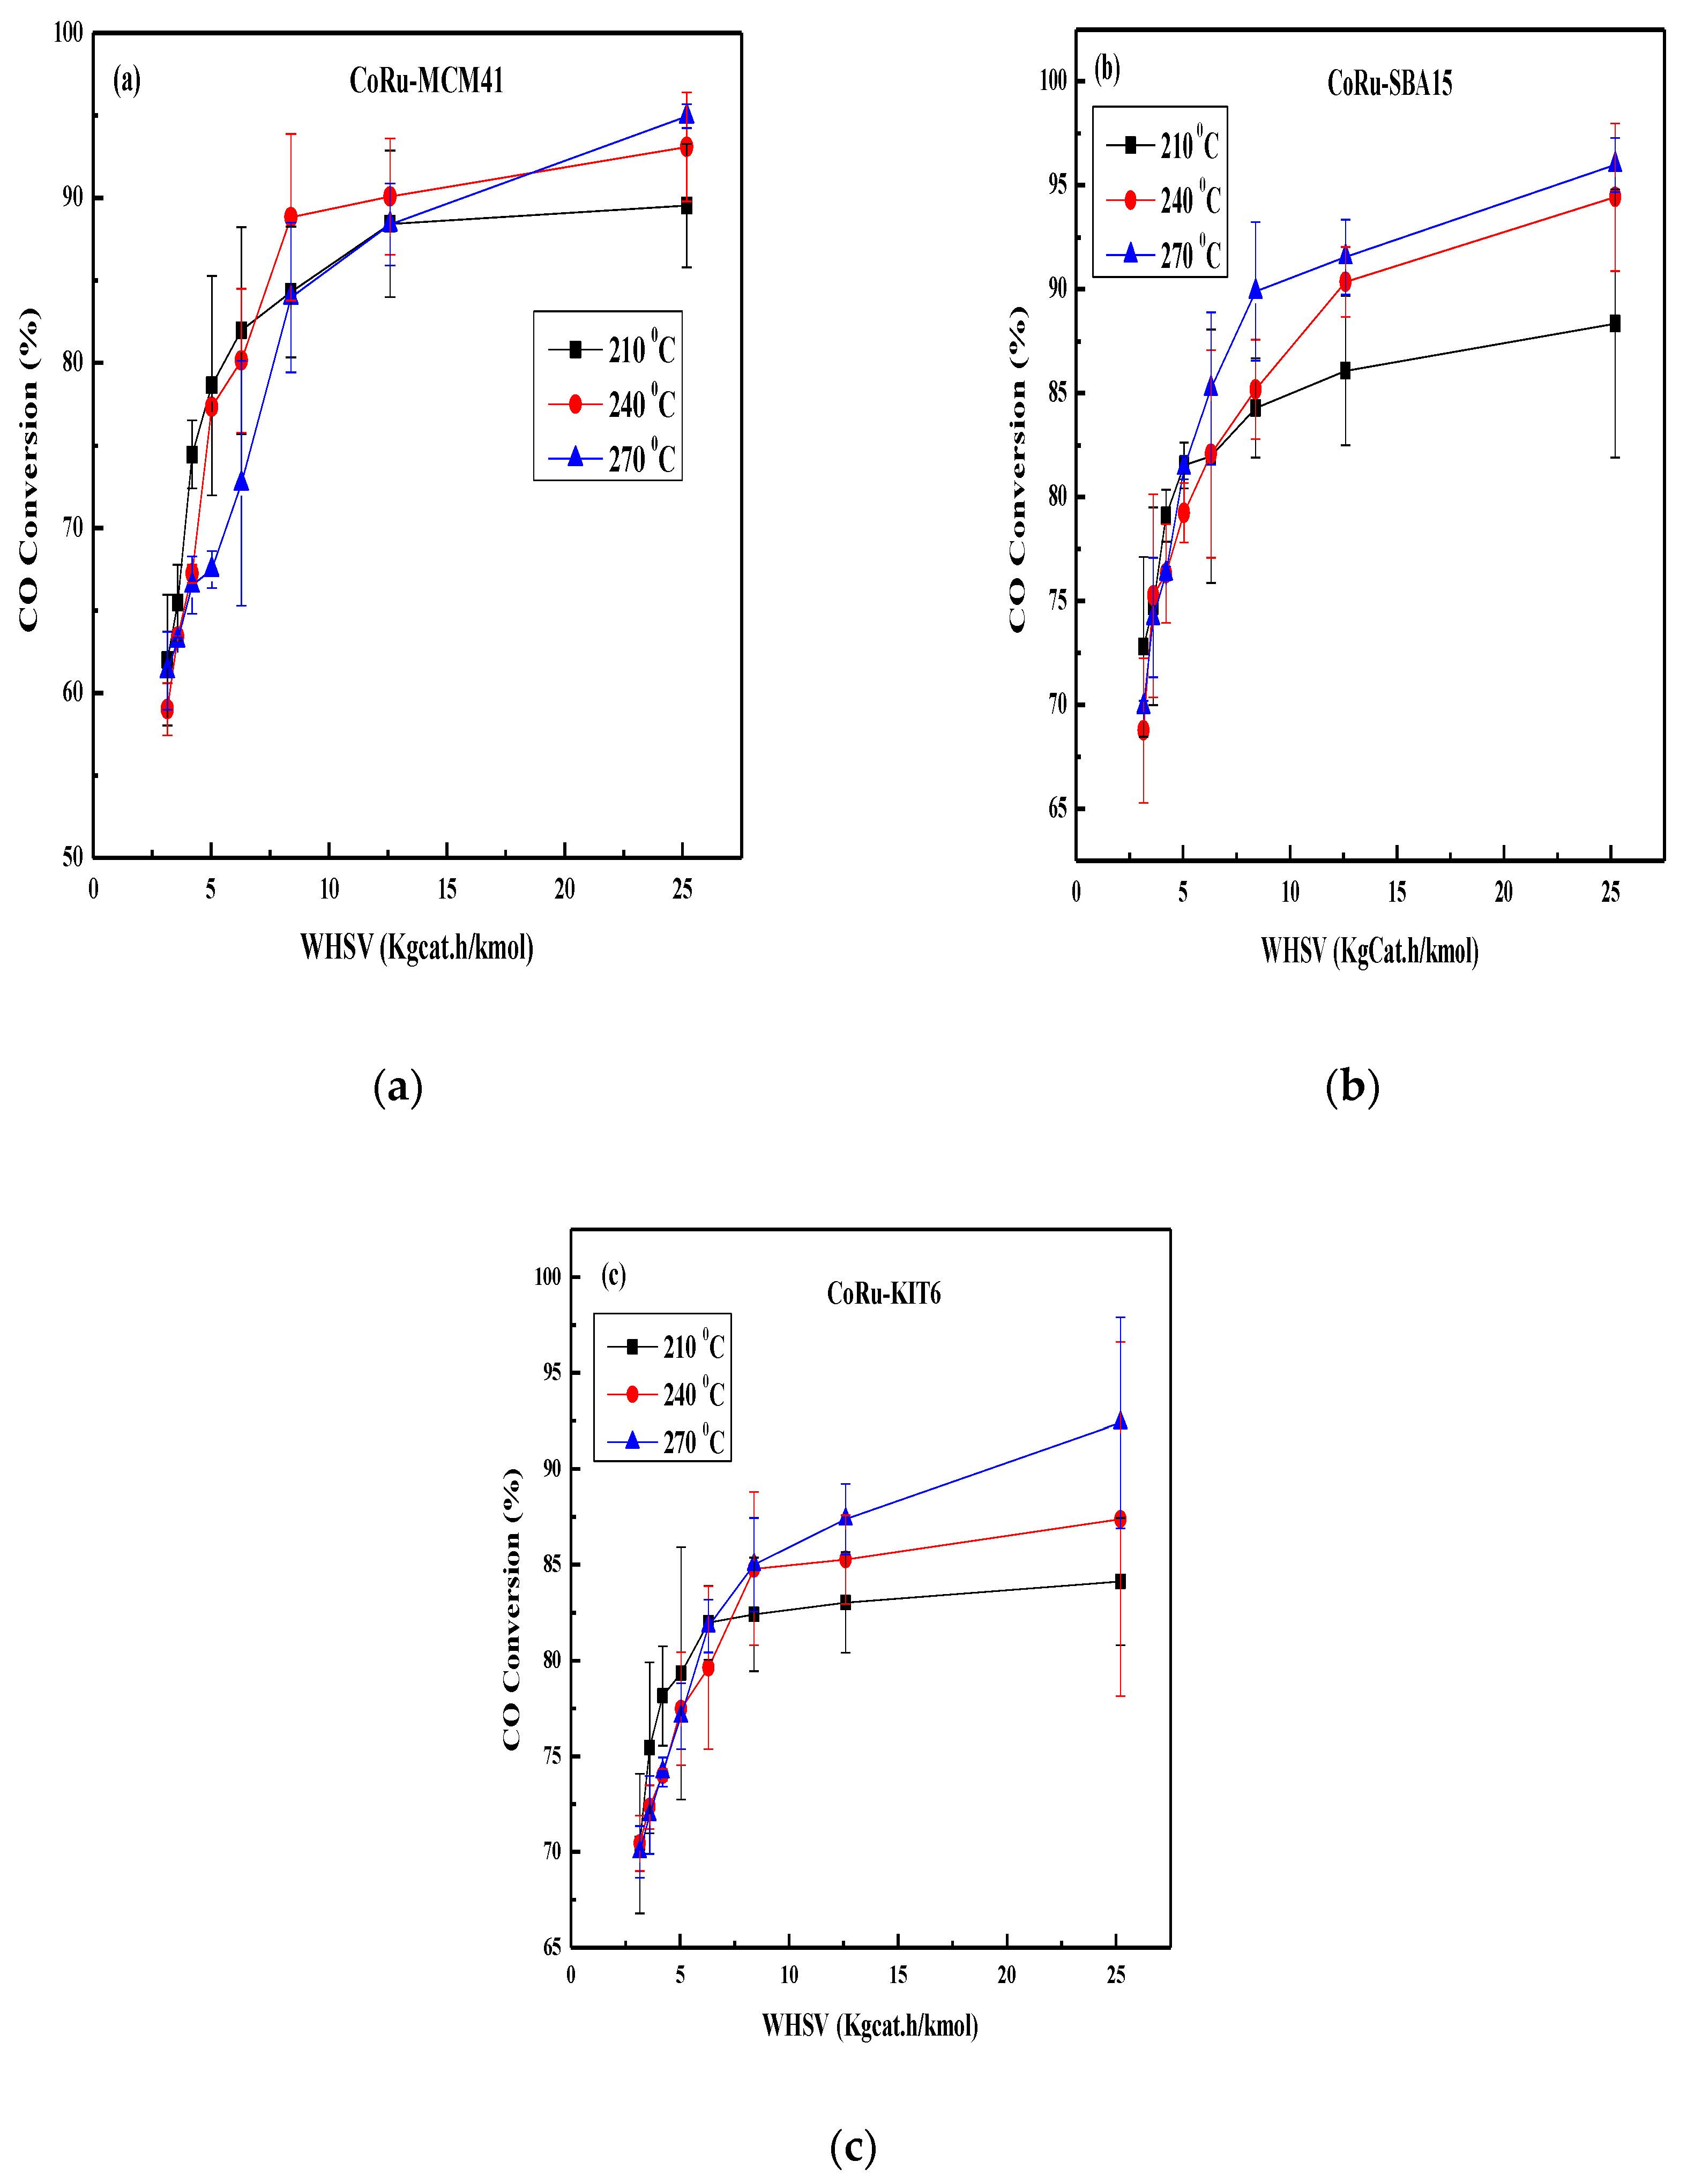
2.3. Effect of Space Velocity on CO Conversion

The influence of the weight hourly space velocity (WHSV) on the CO conversion for three different catalysts at 1 atm and H2/CO molar ratio 2 with error bar is shown in Figure 7a–c. The reactions were carried out at three different temperatures (210 °C, 240 °C, and 270 °C). CO conversion increases with the increase of space velocity and temperature. While CO conversion increases quickly with the increase of space velocity at the beginning, it remains almost constant at higher space velocity as the reaction reaches the equilibrium state. The variation of CO conversion was within 10% as observed during these reactions.

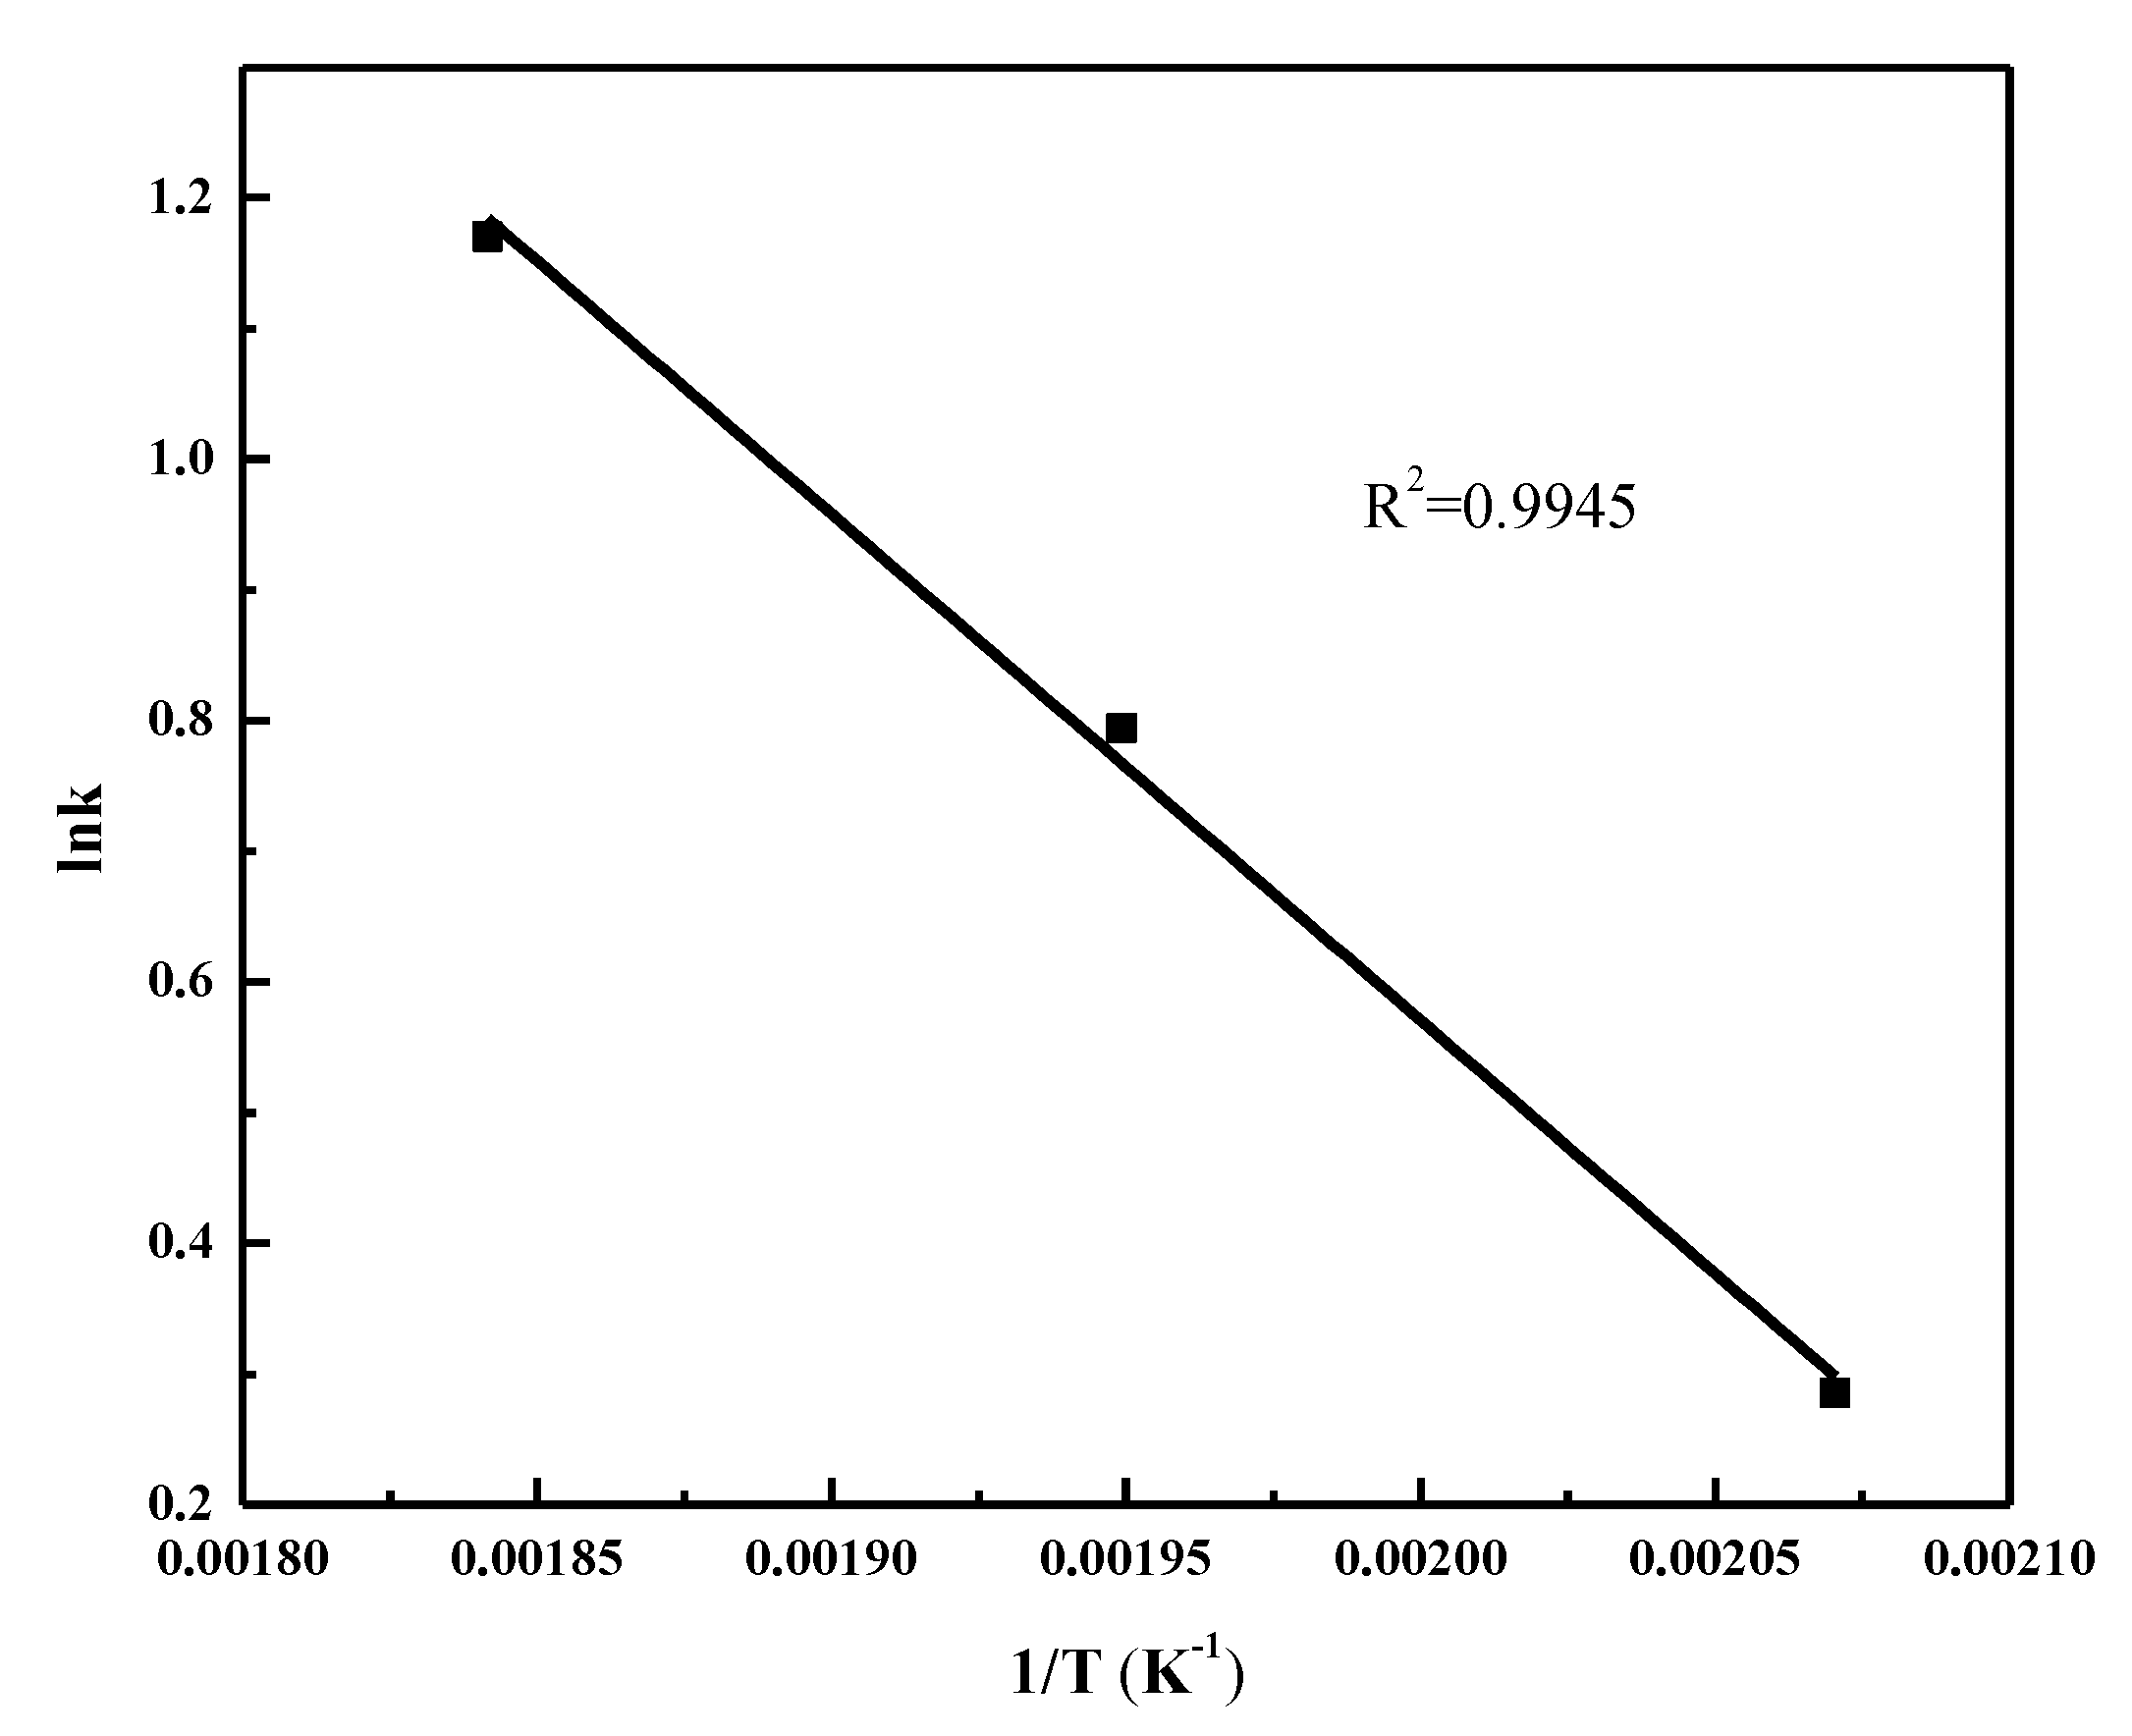
2.4. FT Kinetic Model

The kinetic models derived from Langmuir–Hinshelwood and Eley–Rideal mechanisms consider elementary reactions consuming CO and H2 to produce hydrocarbons and water. Recently, the mechanistic aspects of FT synthesis were well investigated by computational catalysis studies using DFT-based quantum chemical models [85,86,87]. However, the use of Langmuir–Hinshelwood and Eley–Rideal models facilitates understanding of the FT mechanism more easily. In this work, all the kinetic models derived based on these mechanisms are investigated and fitted with experimental data to check the feasibility of the proposed mechanism. The objective function (F) in Equation (4) was utilized to measure the goodness of the model to select the best-fitted mechanism for FT synthesis. Table 4 shows the experimental data obtained for all catalysts at 210 °C, 240 °C, and 270 °C.
The kinetic parameters obtained for all the mechanisms for CoRu-MCM-41 are shown in Table 5. It can be inferred from data that the value of the rate constant (k) increases with increasing temperature with only one of the 6 mechanisms which is FT-3. Therefore, for CoRu-MCM-41, the model FT-3 is best fitted with the kinetic data.
In order to determine the activation energy and the frequency factor from the Arrhenius equation, the logarithm of the rate constant was plotted against the inverse of reaction temperature as shown in Figure 8. The activation energy was determined to be 32.21 kJ/mol and the frequency factor was 4099 kmol/KgCat.hr. (atm)2 for CoRu-MCM-41 catalyst. Table 6 shows that the rate constant increases with the increase of reaction temperature. However, the two adsorption equilibrium constants (K1 and K2) decrease with the increase of reaction temperature. Since adsorption is an exothermic process, the adsorption equilibrium constant decreases with rise in temperature.
Table 4 shows the experimental data of the kinetic runs for CoRu-SBA-15 at 210 °C, 240°C, and 270 °C. When the data are fit against all the kinetic models, FT-2 was the best-fitted model obtained for CoRu-SBA-15. The kinetic parameters for all of the proposed mechanisms are shown in Table 6.
The activation energy and frequency factor of this catalyst were evaluated from the Arrhenius equation by plotting the logarithm of the rate constant to the inverse of reaction temperature as shown in Figure 9. The activation energy was determined to be 13.39 kJ/mol and the frequency factor was 254 kmol/KgCat.hr. atm. Table 6 shows that for FT-3 mechanism, the reaction rate constant increases with reaction temperature and adsorption equilibrium constant (K1) decreases with the increase of reaction temperature.
Table 4 shows the experimental data for CoRu-KIT-6 catalyst. All the models were fitted with this experimental kinetic data and FT-6 was found to be the best fitted model for CoRu-KIT-6. The kinetic parameters for all the proposed mechanisms are shown in Table 7 and the activation energy from Figure 10 was determined to be 12.59 kJ/mol and the frequency factor was 39 kmol/KgCat.hr. atm.
Based on our experimental and kinetic model data, it can be concluded that only one of the six mechanisms for each catalyst is statistically relevant for fitting the model. The rate constant (k), for some of the other five mechanisms, does not show an increasing trend with the increase in temperature or remains constant, while the equilibrium constants, K1 and K2, did not show the decreasing trend with the increase in temperature. Thus, FT-3, FT-2, and FT-6 mechanisms were considered as kinetically relevant model equations for CoRu-MCM-41, CoRu-SBA-15, and CoRu-KIT-6, respectively.
The results from our studies in a microreactor are similar to those reported in literature. Mansouri et al., developed a similar mechanism to estimate kinetic parameters for FT synthesis using cobalt-based catalyst with silica support and found that the experimental data were best fitted with surface reaction mechanism proposed based on Langmuir-Hineshelwood model and the optimal activation for the proposed kinetic model was found to be 31.57 kJ/mol [88]. Very recently, Sonal et al., detailed mechanistic approach for FT synthesis based on Langmuir–Hinshelwood–Hougen–Watson (LHHW) and Eley–Rideal using Fe–Co based catalyst. They claimed that a mechanism based on the adsorption and desorption have a satisfactory fit to the experimental data with the activation energies for the formation of methane, paraffin and olefin to be around 70 kJ/mol, 113 kJ/mol, and 91 kJ/mol, respectively [89]. In order to improve the efficiency of FT synthesis significantly, detailed kinetic rate expressions were derived which is very similar to our work reported in literature for both fixed bed reactor as well as microreactor using iron or cobalt-based catalyst [80,81,90,91]. The elementary steps in the above studies were used to develop kinetic mechanisms considering FT reactions with and without water gas shift (WHS) reactions occurring on the surface of the catalysts forming intermediates with active sites. A similar approach was considered in this present study where CO*, COH2* are assumed to form as intermediates, where * is an active site of the catalyst. From the activation energy calculations, shown in Figure 8, Figure 9 and Figure 10, the FT activation energy is observed in the order, CoRu-MCM-41 > CoRu-SBA-15 > CoRu-KIT-6. Almost 20 kJ/mol less activation energy was obtained for SBA-15 supported catalyst than that of MCM-41 catalyst. The activation energy of KIT-6 supported catalyst is a bit less than that of SBA-15 supported catalyst. This reflects that activation energy depends on metal–support interactions in different mesoporous catalysts. The variation of activity in different mesoporous catalysts might arise due to experimental uncertainties and operating conditions [92]. In addition, the FT activation energy is sensitive to the reactor system. Sun et al., [93] reported that the activation energy in a microchannel microreactor is smaller than that observed in a fixed bed reactor (FBR).
Figure 11 shows the variation of the model predicted rate with the experimental rate for all catalysts. The best fitted models i.e., FT-3, FT-2, and FT-6 for CoRu-MCM-41, CoRu-SBA-15, CoRu-KIT-6, respectively, were chosen to plot the graph for predicted and experimental rates. The correlation coefficient (R2) for all cases was above or equal to 0.95 with an error band of ±15% to ±30%. This indicates that the error between experimental and predicted values lies within the statistical permissible limits at all reaction temperatures for all the catalysts and consistent with the mechanistic models proposed in the literature. Moazami et al., conducted kinetic studies for FT synthesis in a fixed bed reactor with cobalt-based catalyst over silica support and found that 60% of the results were predicted with a relative error of less than 15%, while the rest of the proposed kinetic models has error less than 32% with confidence interval of 0.99 [94]. They also proposed a pseudo-homogenous one-dimensional model to evaluate the kinetic performance of the catalyst and achieved less than 8% error with the predicted data for kinetic experiments [95]. More recently, Marchese et al., performed kinetic studies with Co-Pt/γ-Al2O3 catalyst in a lab-scale tubular reactor and reported an error band around ± 25% with a confidence level of 0.95 stating it lies in the suitable acceptable limits with many mechanistic models proposed in the literature [89,96,97,98].

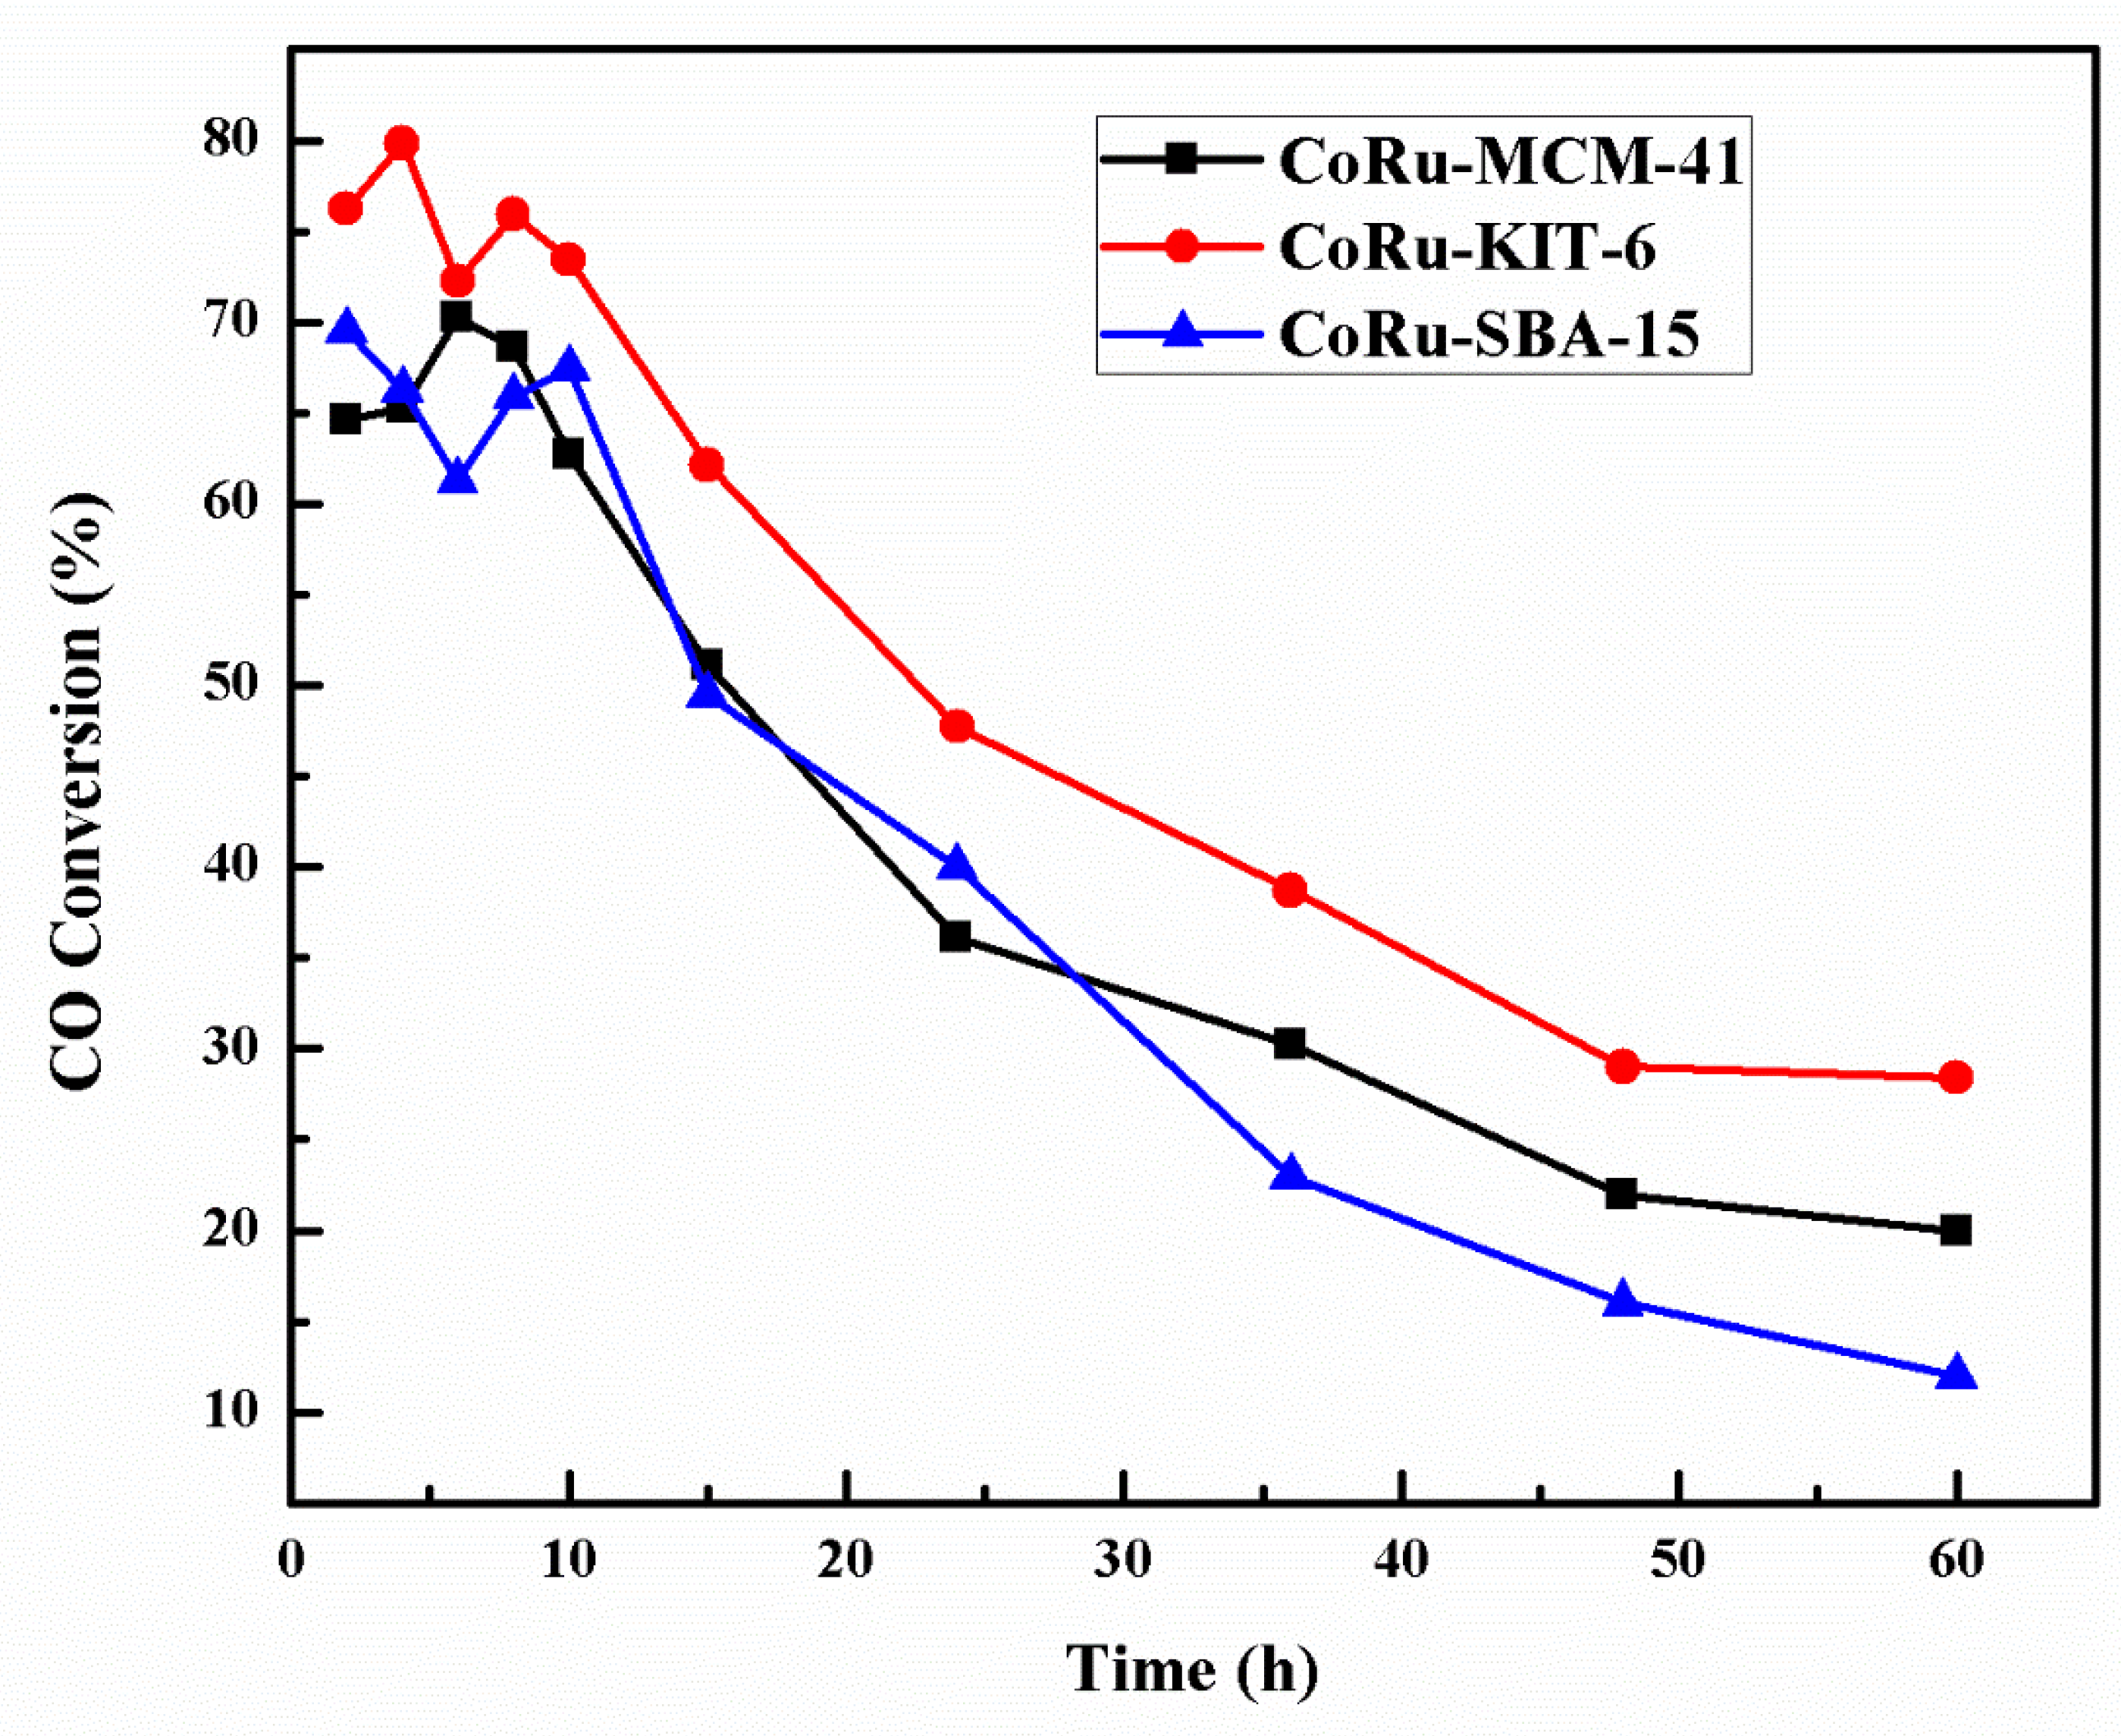
2.5. Deactivation Studies

In order to further understand how the interaction of Co and Ru metals with different mesoporous silica supports affects the stability of the FT catalysts, deactivation studies were performed. Figure 12 shows the deactivation rates of the catalysts tested continuously for 60 h at 240 °C, 1 atm, and H2:CO ratio of 2:1. All the catalysts maintained fairly consistent CO conversion with very little fluctuation during the first 10 h. More specifically, the catalysts maintained 65%–79% CO conversion in the first 10 h of the reaction with CoRu-KIT-6 exhibiting the highest conversion and CoRu-MCM-41, the lowest. The activity of all the catalysts dropped by 20% after 24 h and then started to decline further. At the end of 60 h, the activity of the CoRu-MCM-41 dropped by 70% whereas, in the case of CoRu-KIT-6 and CoRu-SBA-15, the CO conversion decreased by 64% and 84%, respectively. Our results suggest that in terms of stability, the support has a significant impact on FT performance. More significantly, MCM-41 and KIT-6 supports are more stable when compared to the FT stability studies with SBA-15.
Many deactivation mechanisms have been proposed for FT studies that include catalysts poisoning, sintering, oxidation, the effect of water, carbon deposition and surface reconstruction [99]. The syngas used in our studies is a mixture of ultrahigh pure 5.0 CO and H2 gases; therefore, there is very little or no chance of catalyst deactivation due to poisoning by the gas feed at the inlet to the reactor. It was also observed in our previous studies that the support (SiO2 vs TiO2) can enhance the stability of the catalyst to resist deactivation [38,40]. Iglesia et al., noticed that silica supported materials are less stable when compared to the other supports like Al2O3 [100] in their FT studies with Co-based catalyst. They also reported that CoRu-TiO2 and CoRu-SiO2 were found to have almost the same activation energy upon the addition of Ru to the Co catalyst; however, there were strong differences in the deactivation rates of catalysts depending upon the support [101]. Based on our CO- conversion studies, the ability of catalysts to withstand or retard the FT deactivation rate was in the order of CoRu-KIT-6 > CoRu-MCM-41 > CoRu-SBA-15.

3. Materials and Methods

3.1. Materials

The reagents used for catalysis synthesis were of analytical grade with no further purification. Tetramethyl orthosilicate, 99% (TMOS) and ammonium hydroxide, Tetraethyl orthosilicate reagent grade, 98% (TEOS), Pluronic acid (P123), Hydrochloric acid (HCl), Cetyltrimethylammoniumbromide (CTAB), Co(NO3)2.6H2O, RuCl3·xH2O were purchased from Sigma Aldrich. Ethanol (anhydrous), Butanol and acetone, ACS grade, were obtained from Fischer Scientific, Branchburg, New Jersey, USA.

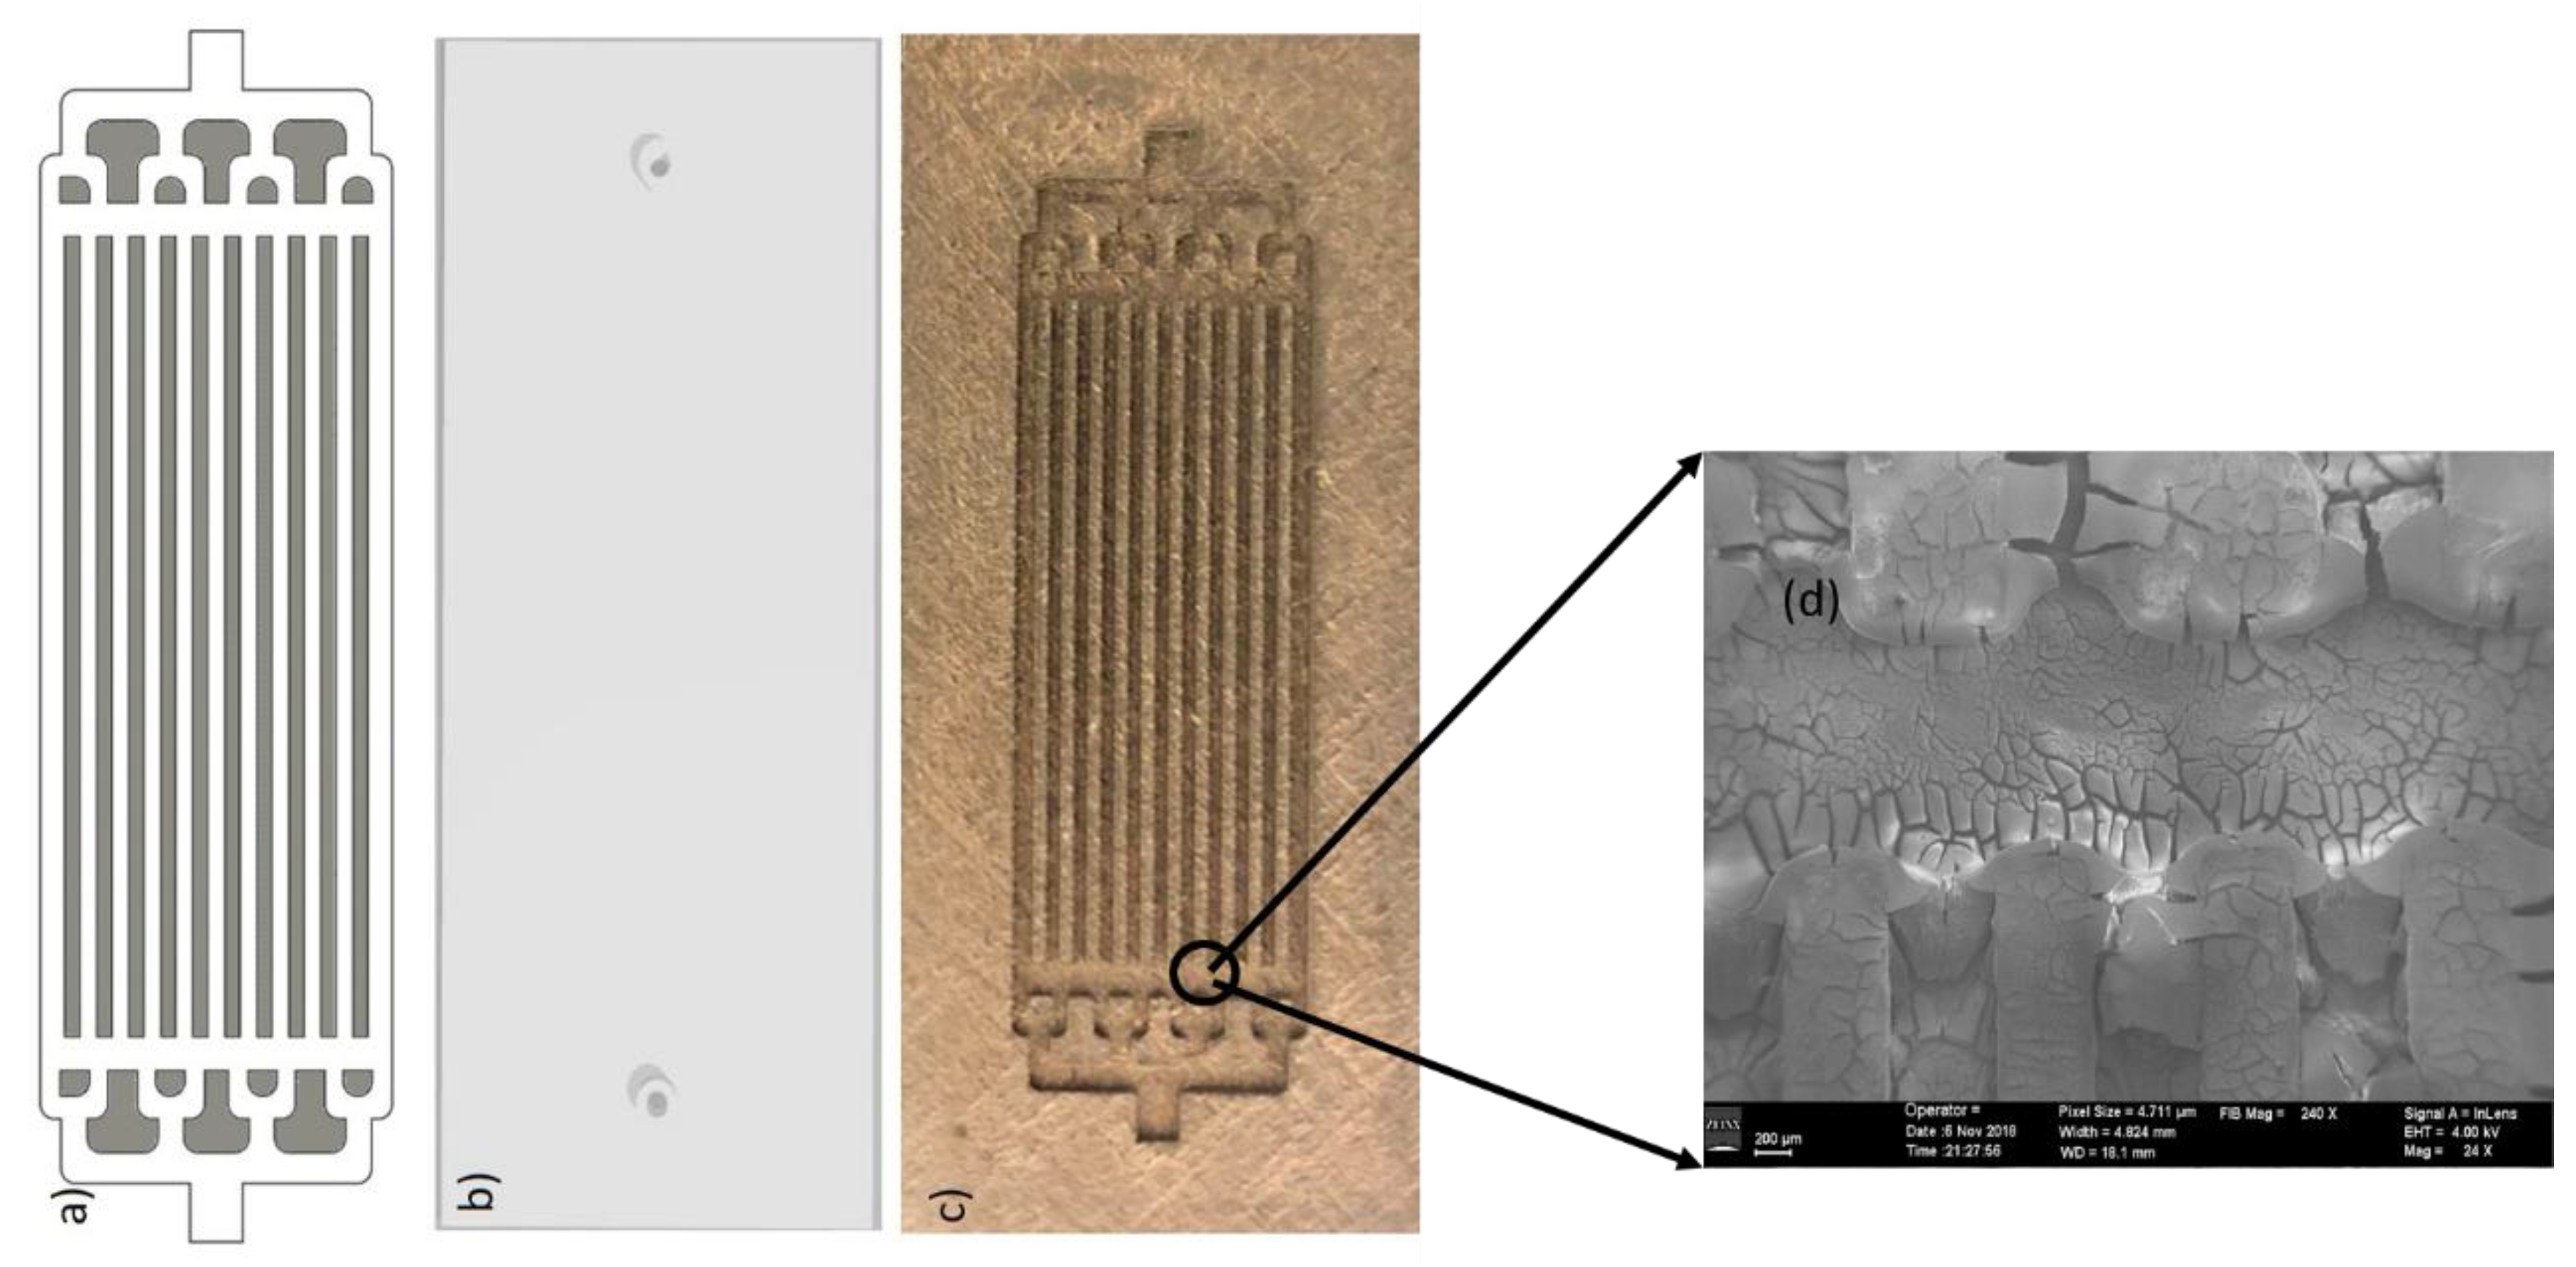
3.2. Fabrication of Microreactor

The microchannel microreactor and the respective cover channel were fabricated using 3D printing technology. Typically, the microreactor and its cover channel are designed using AutoCAD software which is schematically shown in Figure 13. The design is based on the split and recombination principle which has 11 microchannels of 500 μm × 500 μm × 2.4 cm as reaction zone in between them. This stainless-steel 3D printed microreactor is assembled in a custom-built heating block with an inlet and outlet system which facilitates the flow of syngas through the channels.

3.3. Catalyst Synthesis and Loading

Three types of Co-Ru based nanocatalysts supported by different mesoporous silica supports i.e., MCM-41, SBA-15 and KIT-6 supports are used in this study. A constant metal loading of 10%Co and ~5% Ru in weight was maintained in all preparations and this metal loading was also determined using the amount of the precursor. Three catalysts using different mesoporous support—10%Co5%Ru-MCM-41, 10%Co5%Ru-SBA-15 and 10%Co5%Ru-KIT-6—were synthesized using the one-pot hydrothermal procedure ( as shown below) [48]. The catalysts were labeled as CoRu-MCM-41, CoRu-SBA-15, and CoRu-KIT-6 in this manuscript.
For the synthesis of CoRu-MCM-41, TMOS, CTAB, DI-water, and ethanol were used in a molar ratio of 1:0.13:130:20 as described elsewhere [48]. In short, CTAB was dissolved in DI-water at 30 °C to produce a clear solution. The metal precursors were dissolved in ethanol in a separate beaker. The precursor, TMOS, which is a limiting agent for this synthesis, was added dropwise to the mixture of the two solutions prepared previously. Ammonium hydroxide was added dropwise to precipitate metal hydroxides in the solution, till the final pH was ~10. The precipitate was stirred for 3 h, followed by 18 h of aging at 65 °C. The precipitate was then washed with DI water till the filtrate reached a pH of 7, finally washed with ethanol and filtered. The filtered material is air-dried for a day and then oven-dried at 110 °C for 24 h. The dried catalyst is calcined at 550 °C for 16 h with a ramp rate of 2 °C/min to remove the CTAB template.
For the synthesis of CoRu-SBA-15: TEOS, CTAB, water, ethanol, pluronic acid, and hydrochloric acid were mixed in molar ratios of 1:0.081:41:7.5:0.0168:5.981. In a typical synthesis procedure, P123 was dissolved in 2M HCl at 35 °C till a clear solution was obtained. Another solution was prepared by dissolving CTAB in DI water at 35 °C until a homogenous mixture was produced. These two solutions were mixed and stirred for 35 min. Ethanol containing metal precursors were added dropwise into the solution and stirred for 30 min. Afterwards, TEOS which was limiting reagent in this procedure was also added dropwise and stirred for 20 h at 35 °C. The aqueous solution was aged for 48 h at 98 °C followed by air drying for 24 h. The material was then oven-dried at 110 °C for 24 h. Finally, the dried material is then calcined in stepwise fashion with heating rate of 1 °C/min at 350 °C, 450 °C, and 550 °C for 8 h each, respectively to remove CTAB and pluronic acid.
In the case of CoRu-KIT-6, TEOS, P123, HCl, DI water, and butanol were mixed in a molar ratio of 1:0.017:1.83:195:1.31 [102]. For a typical procedure, P123 was added to HCl at 35 °C till a clear solution was obtained. A separate solution was prepared with butanol containing metal precursors and poured to the previous solution and stirred until a homogeneous solution was obtained. To this mixture, TEOS, which was the limiting reagent, was added dropwise and stirred at 500 rpm for 24 h. The final solution was aged for 24 h at 100 °C, followed by air drying for 24 h under the fume hood. The material is oven-dried at 110 °C for 24 h and then calcined at 550 °C for 4 h, to remove P123, the structure directing agent, SDA, with heating and cooling rates of 1 °C/min.
The catalyst is loaded into the microchannels of the microreactor using a PVA suspension containing the catalyst, DI water, binder PVA (polyvinyl alcohol 98%–99% hydrolyzed MW: 31000) and acetic acid of weight ratio 1:5:0.25:0.05. This suspension with well-dispersed catalyst was dip-coated and dried in air and then calcined in presence of air at 400 °C for 2 h with heating and cooling rates of 5 °C/min. Figure 13d shows the SEM image of the catalyst coated microreactor prior to the in-situ reduction.

3.4. Catalyst Characterization

Specific surface area, pore size, pore volume and TPR studies of the catalyst were carried out using Micromeritics, 3-Flex instrument. The Brunner–Emmett–Teller (BET) method was used to calculate the surface area of the catalyst where an equation was obtained from adsorption isotherm in the relative pressure range of 0.07–0.03. The surface area was calculated from adsorption isotherm in the relative pressure range of P/P0 = 0.07–0.3 using the Brunner–Emmett–Teller (BET) equation. The total volume per gram of catalyst was determined from the amount of N2 adsorbed at P/P0 = 1. The N2 desorption from the catalyst surface provides information about the pore size distribution using BJH (Barret–Joyner–Halenda) plots [103]. The H2 temperature programmed reduction (TPR) analysis was also done with the same instrument which has a TCD detector to monitor the reduction signals of the catalyst. Around 50 mg of the catalyst was loaded into the quartz sample tube in which a stream of 10% H2/Ar at flowrate 110 mL/min was passed through and the temperature is increased to 1000 °C with 10 °C/min ramp rate. The small and wide-angle powder x-ray diffraction (XRD) were recorded using D8 Discover X-ray and Rigaku SmartLab X-ray diffractometers, respectively, with Cu K-alpha radiation (wavelength = 0.15418 nm) radiation generated at 40 mA and 40 kV. The step size and time per step used in these measurements are 0.05° and 3 secs/step, respectively. The crystal sizes of the metal oxides were determined using the Scherrer equation. In the Scherrer equation below, τ stands for the crystal size, λ is the wavelength of the Cu Kα radiation, β is the full width half maximum and θ is the Bragg diffraction angle.
τ = 0.9 λ β * Cos θ
The morphology and the size of the catalysts were analyzed using transmission electron (TEM Carl Zeiss Libra 120) at 120 KeV and scanning electron microscopy (Zeiss Auriga FIB/FESEM). The sample for TEM was prepared by dispersing a small quantity of catalyst in 3 mL of ethanol followed by vortex dispersion and sonication for a few minutes. Then the suspension was drop coated on a carbon-coated copper grid of 300 µm mesh size, followed by drying in an oven at 100 °C for 12 h.
The elemental composition and oxidation states of the metals were analyzed using Energy Dispersive X-ray spectrometry (Zeiss Auriga FIB/FESEM obtained from Carl Zeiss, Oberkochen, Germany) and oxidation states by X-ray photoelectron spectroscopy (XPS-Escalab Xi+-Thermo Scientific obtained from Thermo Scientific, West Sussex, UK), respectively.

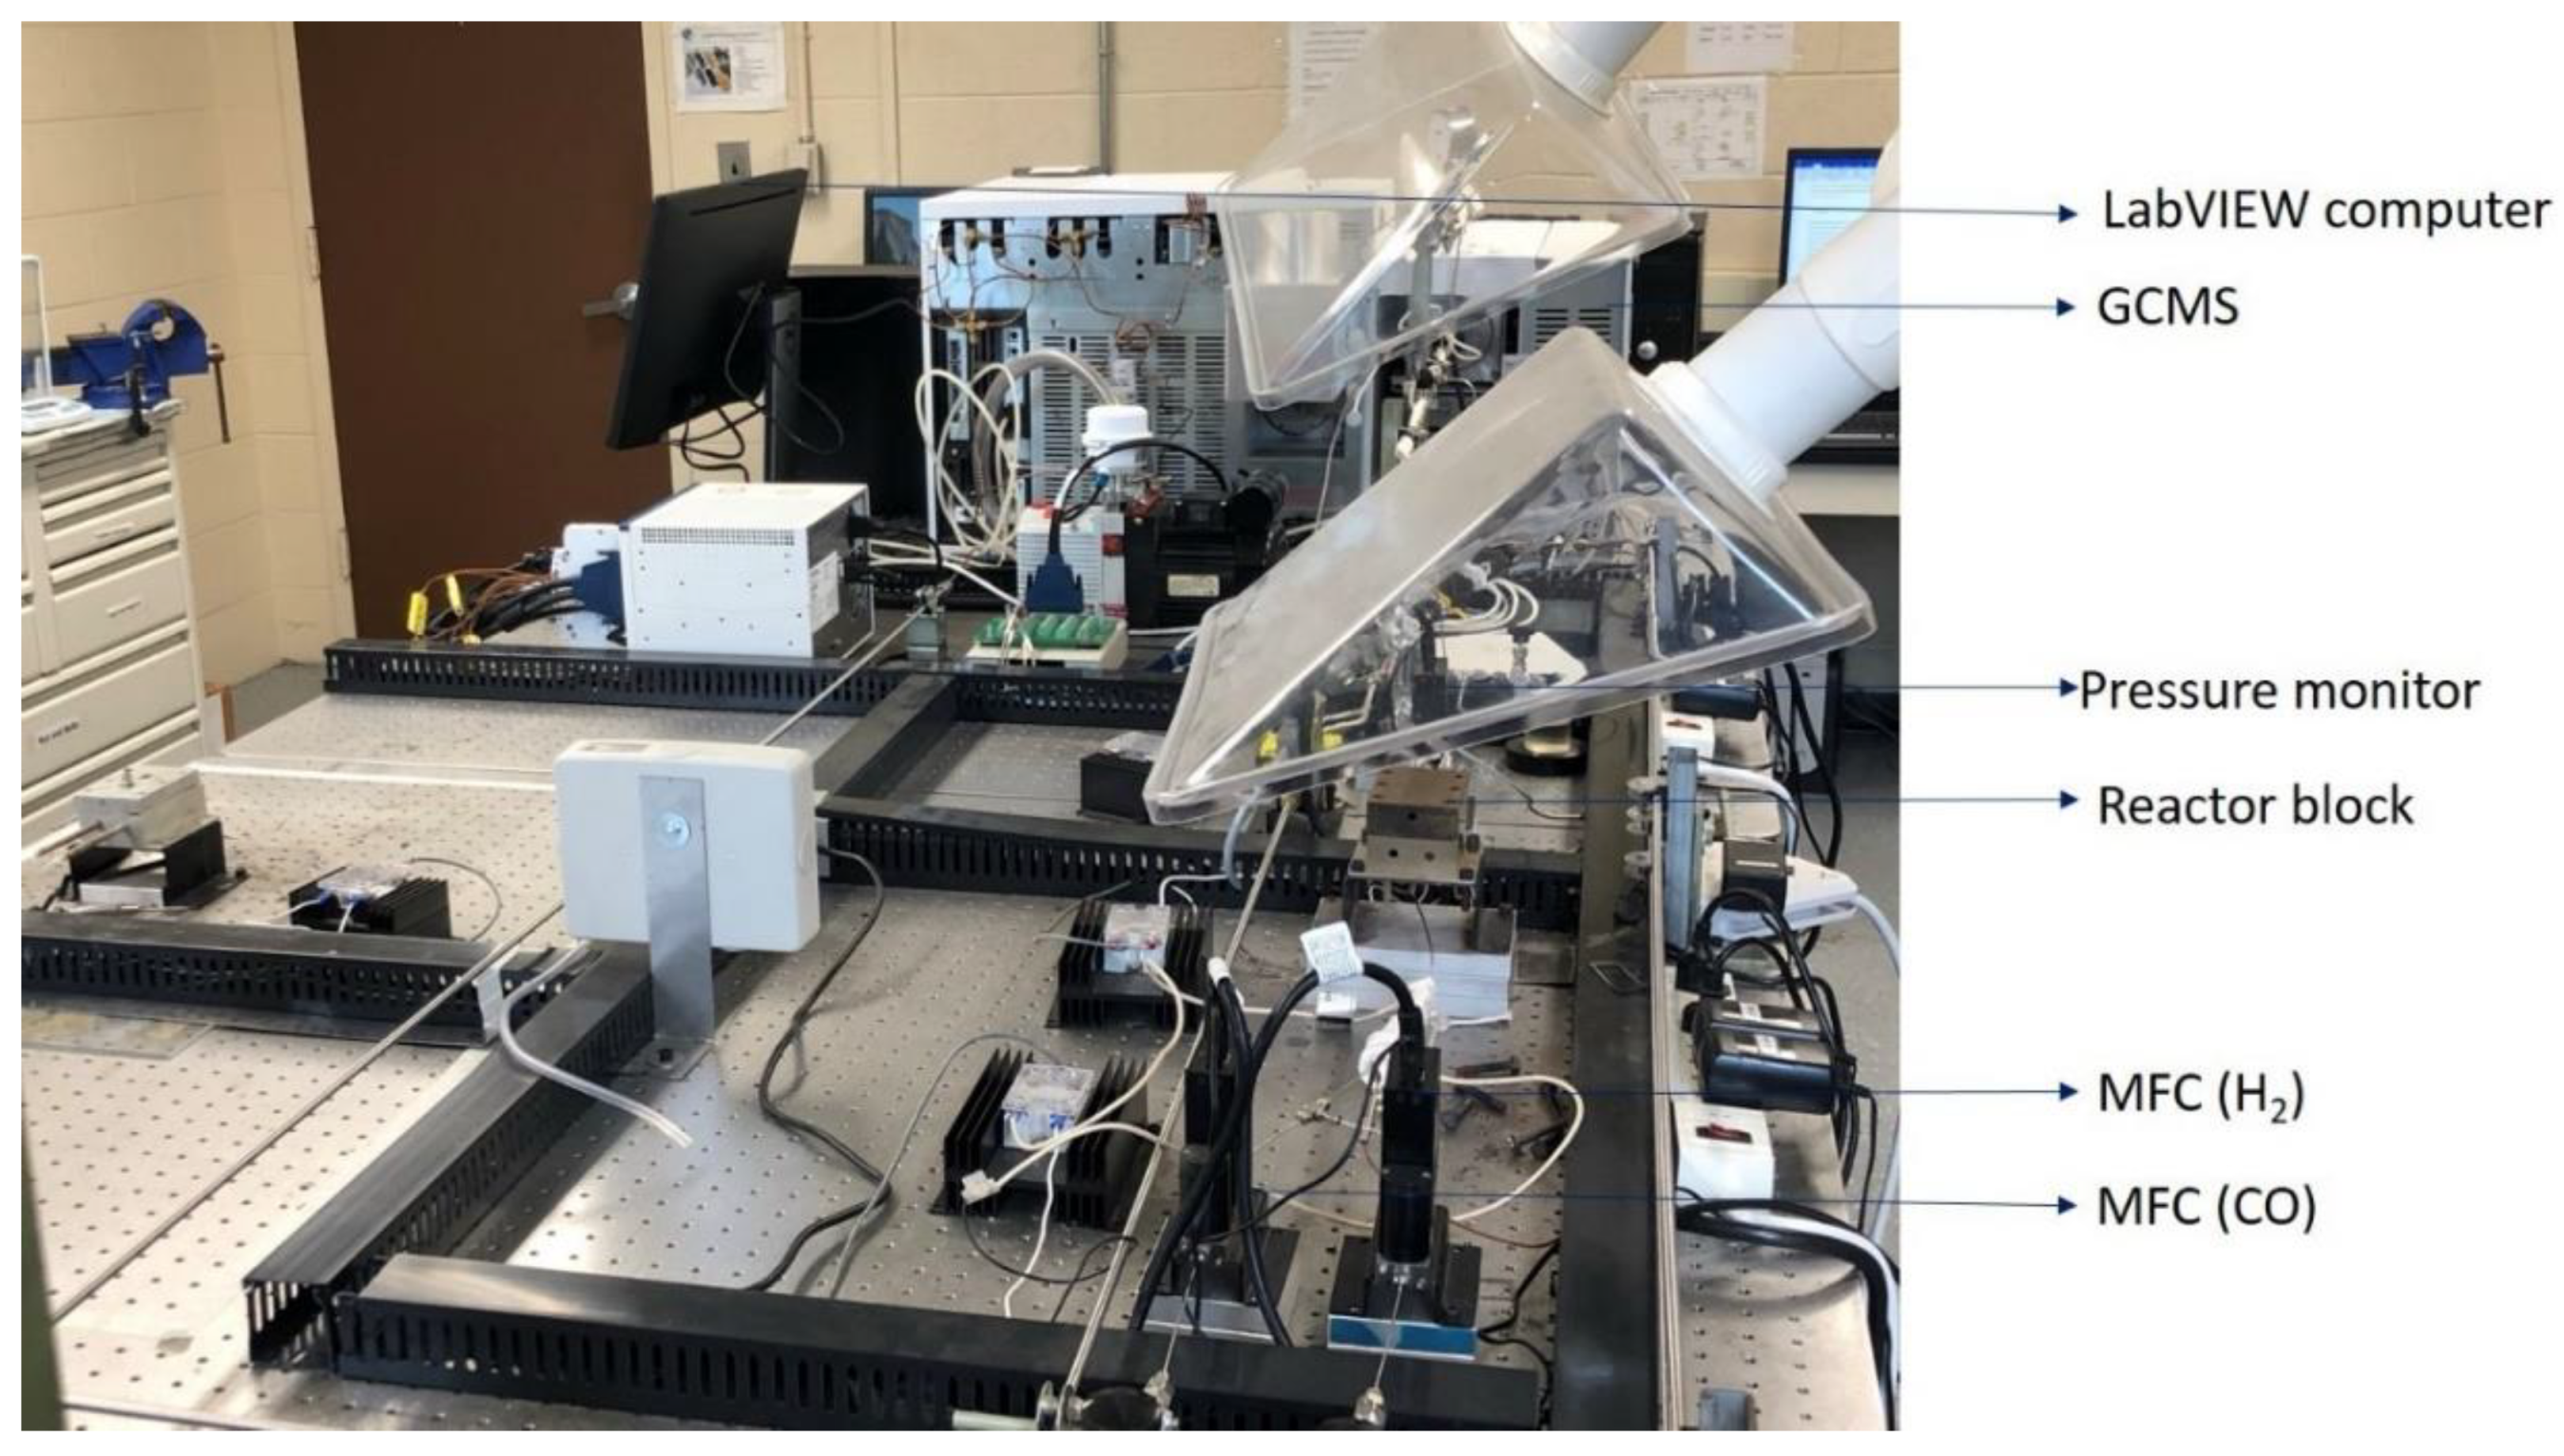
3.5. Fischer–Tropsch Synthesis in Microreactor and Kinetic Data Collection

An in-house LabVIEW automated experimental setup was built to carry out the FT experiments for precise control over the operating conditions. The experimental setup is shown in Figure 14. The flowrates of the syngas mixture which is a mixture of hydrogen and carbon monoxide were controlled by precalibrated mass flow controllers obtained from cole parmer with flow rates ranging from 0–1 sccm. Nitrogen was used as a carrier gas into the system and was controlled by Aalborg mass flow controller with a maximum flow rate of 10 sccm. The upstream and downstream pressures were continuously monitored by pressure gauges obtained from Cole–Parmer and the data are fed to Aalborg solenoid valve from which the reaction pressure is controlled and kept constant throughout the reaction. All these controllers are operated by LabVIEW 2018 program. The product stream is directly fed to the GC-MS (Agilent Technologies 7890B GC and 5977 MSD). Prior to the start of the kinetic experiments, the microreactors were reduced ex-situ in Carbolite Gero tubular furnace with 10% H2Ar. To compensate the losses while transferring the microreactor to the heating block the microreactor containing the catalyst was reduced again in-situ for 6 h at 350 °C before the start of FT reaction. The kinetic studies were performed by varying the weight hourly space velocity (WHSV = Wcat/FCO,in, where WCat = weight of the catalyst and FCO,in = molar flow rate of CO in feed) in the range of ~25.2–3.15 kgcat.h/kmol. The reactions were performed with syngas having a feed molar ratio (H2/CO) of 2:1 at 210 °C, 240 °C, and 270 °C while the reaction pressure was maintained at 1 atm. Based on our previous FT studies using this setup and preliminary runs, all reactions reached a steady state after an hour at each setpoint of WHSV. Deactivation studies were also performed for all three catalysts at 240 °C using syngas feed molar ration of 2:1. CO conversion was calculated based on following equation:
X C O % = F C O , i n F C O , o u t F C O , i n × 100

4. Conclusions

Three different types of mesoporous silica supported Co-Ru based catalysts were synthesized using the one-pot hydrothermal method and performance for FT was evaluated. These catalysts resulted in high surface area with hexagonal ordered mesoporous structure as supported by BET, low angle XRD and TEM studies. The interaction between the metal and different types of support has a significant effect on the kinetic and stability studies of FT synthesis. Six mechanistic models were developed based on the Langmuir–Hinshelwood and Eley-Radiel mechanisms. The best fitted model for all catalysts was obtained on the basis of non-linear regression by comparing with the objective function which is equation-7 in this paper. The proposed model FT-3 was best fitted with the kinetic data for CoRu-MCM-41 catalyst. Whereas, FT-2 and FT-6 were well fitted with the kinetic data for CoRu-SBA-15 and CoRu-KIT-6, respectively. CoRu-KIT-6 was found to be more active than other catalysts with a low activation energy of 12.59 kJ/mol, whereas for CoRu-SBA-15 and CoRu-MCM-41 the activation energies are 13.39 and 32.21 kJ/mol, respectively. An average error of 5.65%, 1.76%, and 3.70% was obtained for catalysts CoRu-MCM-41, CoRu-SBA-15, CoRu-KIT-6, respectively considering the best fitted model explained above for FT synthesis. The predicted data provided by kinetic models were satisfactory with the experimental data. These results highlight the potential of the mechanistic FT models as well as reaction mechanisms to further improve the performance of FT synthesis. In addition, this information can help to design more active and selective catalysts for the optimized FT process. Furthermore, all catalysts exhibited significant resistance to the deactivation rate following the order CoRu-KIT-6> CoRu-MCM-41>CoRu-SBA-15. This study suggests that even if the support is of same type, the structure of the support plays a vital role in catalyst performance for FT synthesis.

Supplementary Materials

The following are available online at https://www.mdpi.com/2073-4344/9/10/872/s1, Figure S1: title, Table S1: title.

Author Contributions

Methodology, analysis and experimental investigation by N.M. and S.B.; project administration and supervision by S.A., and D.K.; all the authors contributed to the discussion of the experimental results as well as writing and editing of the manuscript.

Funding

This project received funding from NSF CREST (#260326) and UNC-ROI (#110092). This work is performed at North Carolina A&T State University and Joint School of Nanoscience and Nanoengineering, a member of the Southeastern Nanotechnology Infrastructure Corridor (SENIC) and National Nanotechnology Coordinated Infrastructure (NNCI), which is supported by the National Science Foundation (Grant ECCS-1542174).

Acknowledgments

The authors gratefully acknowledge Dr.Kyle Nowlin and Mr. Klinton Davis for TEM support, and Dr. Xin Li for XRD support.

Conflicts of Interest

The authors declare no conflict of interest

Appendix A

Derivation of Kinetic model:
FT-3 kinetic model
Dual-site adsorption of CO and H2, the surface reaction is rate controlling step (RCS)
C O + * k 1 k 1 C O *       K 1 = k 1 k 1 ( Adsorption   1 )
H 2 + * k 2 k 2 H 2 *       K 2 = k 2 k 2 ( Adsorption   2 )
C O * + H 2 * k C + D + 2 * ( Surface   reaction )   ( RCS )
From step 1 (Adsorption 1 (rapid reaction)),
The rate of formation of CO* is,
r C O * = k 1 p C O C * k 1 C C O *
From step 2 (Adsorption 2 (rapid reaction [89])),
The rate of formation of H2* is,
r H 2 * = k 2 p H 2 C * k 2 C H 2 *
From step 3 (Surface reaction 3),
r C O = k C C O * C H 2 *
According to pseudo steady-state hypothesis (PSSH), the rate of formation of the intermediate is zero.
So,
r C O * = 0
r H 2 * = 0
So, putting the value of r C O * from Equation (A4) in Equation (A7), we have,
k 1 p C O C * k 1 C C O * = 0 k 1 p C O C * = k 1 C C O * C C O * = k 1 p C O C * k 1 C C O * = K 1 p C O C *
So, putting the value of r H 2 * from Equation (A5) in Equation (A8), we have,
k 2 p H 2 C * k 2 C H 2 * = 0 k 2 p H 2 C * = k 2 C H 2 * C H 2 * = k 2 p H 2 C * k 2 C H 2 * = K 2 p H 2 C *
Taking the values of C C O * and C H 2 * from Equations(A9) and (A10) and putting in Equation (A6, we have,
r C O = k K 1 K 2 p C O p H 2 C * 2
Making the catalyst active site balance.
Considering, the total site is,
C T = 1 ( N o . o f v a c a n t s i t e s ) + ( N o . o f o c c u p i e d s i t e s ) = 1 ( C * ) + ( C C O * + C H 2 * ) = 1 ( C * ) + ( K 1 p C O C * + K 2 p H 2 C * ) = 1 C * ( 1 + K 1 p C O + K 2 p H 2 ) = 1 C * = 1 ( 1 + K 1 p C O + K 2 p H 2 )
Putting the value of C * from Equation (A12) in Equation (A11), we get,
r C O = k K 1 K 2 p C O p H 2 ( 1 + K 1 p C O + K 2 p H 2 ) 2 ( FT 3 )
[Taking values of C C O * and C H 2 * from Equations (A9) and (A10)]

References

  1. Fischer, F.; Tropsch, H. The synthesis of petroleum at atmospheric pressures from gasification products of coal. Brennstoff-Chemie 1926, 7, 97–104. [Google Scholar]
  2. Steynberg, A.P. Chapter 1—Introduction to Fischer-Tropsch Technology. In Studies in Surface Science and Catalysis; Steynberg, A., Dry, M., Eds.; Elsevier: Amsterdam, The Netherlands, 2004; Volume 152, pp. 1–63. [Google Scholar]
  3. Davis, B.H. Overview of reactors for liquid phase Fischer—Tropsch synthesis. Catal. Today 2002, 71, 249–300. [Google Scholar] [CrossRef]
  4. Wood, D.A.; Nwaoha, C.; Towler, B.F. Gas-to-liquids (GTL): A review of an industry offering several routes for monetizing natural gas. J. Nat. Gas Sci. Eng. 2012, 9, 196–208. [Google Scholar] [CrossRef]
  5. Pohar, A. Process Intensification through Microreactor Application. Chem. Biochem. Eng. Q. 2009, 23, 537–544. [Google Scholar]
  6. Lerou, J.J.; Tonkovich, A.L.; Silva, L.; Perry, S.; McDaniel, J. Microchannel reactor architecture enables greener processes. Chem. Eng. Sci. 2010, 65, 380–385. [Google Scholar] [CrossRef]
  7. Hessel, V.; Löb, P.; Holger, L. Industrial and Real-Life Applications of Micro-Reactor Process Engineering for Fine and Functional Chemistry; Elsevier: Amsterdam, The Netherlands, 2006; Volume 159, pp. 35–46. [Google Scholar]
  8. Ouyang, X.; Besser, R.S. Development of a microreactor-based parallel catalyst analysis system for synthesis gas conversion. Catal. Today 2003, 84, 33–41. [Google Scholar] [CrossRef]
  9. Gavriilidis, A.; Angeli, P.; Cao, E.; Yeong, K.K.; Wan, Y.S.S. Technology and Applications of Microengineered Reactors. Chem. Eng. Res. Design 2002, 80, 3–30. [Google Scholar] [CrossRef]
  10. Myrstad, R.; Eri, S.; Pfeifer, P.; Rytter, E.; Holmen, A. Fischer-Tropsch synthesis in a microstructured reactor. Catal. Today 2009, 147, S301–S304. [Google Scholar] [CrossRef]
  11. LeViness, S.; Deshmukh, S.R.; Richard, L.A.; Robota, H.J. Velocys Fischer—Tropsch synthesis technology—New advances on state-of-the-art. Top. Catal. 2014, 57, 518–525. [Google Scholar] [CrossRef]
  12. Mazanec, T.; Perry, S.; Tonkovich, L.; Wang, Y. Microchannel gas-to-liquids conversion-thinking big by thinking small. In Studies in Surface Science and Catalysis; Elsevier: Amsterdam, The Netherlands, 2004; Volume 147, pp. 169–174. [Google Scholar]
  13. Deshmukh, S.R.; Tonkovich, A.L.Y.; Jarosch, K.T.; Schrader, L.; Fitzgerald, S.P.; Kilanowski, D.R.; Lerou, J.J.; Mazanec, T.J. Scale-up of microchannel reactors for Fischer—Tropsch synthesis. Ind. Eng. Chem. Res. 2010, 49, 10883–10888. [Google Scholar] [CrossRef]
  14. Almeida, L.C.; Sanz, O.; D’olhaberriague, J.; Yunes, S.; Montes, M. Microchannel reactor for Fischer—Tropsch synthesis: Adaptation of a commercial unit for testing microchannel blocks. Fuel 2013, 110, 171–177. [Google Scholar] [CrossRef]
  15. Schulz, H. Short history and present trends of Fischer—Tropsch synthesis. Appl. Catal. A Gen. 1999, 186, 3–12. [Google Scholar] [CrossRef]
  16. Borg, Ø.; Eri, S.; Blekkan, E.A.; Storsæter, S.; Wigum, H.; Rytter, E.; Holmen, A. Fischer—Tropsch synthesis over γ-alumina-supported cobalt catalysts: Effect of support variables. J. Catal. 2007, 248, 89–100. [Google Scholar] [CrossRef]
  17. Chu, W.; Chernavskii, P.A.; Gengembre, L.; Pankina, G.A.; Fongarland, P.; Khodakov, A.Y. Cobalt species in promoted cobalt alumina-supported Fischer—Tropsch catalysts. J. Catal. 2007, 252, 215–230. [Google Scholar] [CrossRef]
  18. Hilmen, A.; Schanke, D.; Hanssen, K.; Holmen, A. Study of the effect of water on alumina supported cobalt Fischer—Tropsch catalysts. Appl. Catal. A Gen. 1999, 186, 169–188. [Google Scholar] [CrossRef]
  19. Storsæter, S.; Tøtdal, B.; Walmsley, J.C.; Tanem, B.S.; Holmen, A. Characterization of alumina-, silica-, and titania-supported cobalt Fischer—Tropsch catalysts. J. Catal. 2005, 236, 139–152. [Google Scholar] [CrossRef]
  20. Hilmen, A.; Schanke, D.; Holmen, A. TPR study of the mechanism of rhenium promotion of alumina-supported cobalt Fischer-Tropsch catalysts. Catal. Lett. 1996, 38, 143–147. [Google Scholar] [CrossRef]
  21. Morales, F.; De Groot, F.M.; Gijzeman, O.L.; Mens, A.; Stephan, O.; Weckhuysen, B.M. Mn promotion effects in Co/TiO2 Fischer—Tropsch catalysts as investigated by XPS and STEM-EELS. J. Catal. 2005, 230, 301–308. [Google Scholar] [CrossRef]
  22. Iglesia, E.; Soled, S.L.; Fiato, R.A. Fischer-Tropsch synthesis on cobalt and ruthenium. Metal dispersion and support effects on reaction rate and selectivity. J. Catal. 1992, 137, 212–224. [Google Scholar] [CrossRef]
  23. Li, J.; Coville, N.J. The effect of boron on the catalyst reducibility and activity of Co/TiO2 Fischer—Tropsch catalysts. Appl. Catal. A Gen. 1999, 181, 201–208. [Google Scholar] [CrossRef]
  24. Feltes, T.E.; Espinosa-Alonso, L.; De Smit, E.; D’Souza, L.; Meyer, R.J.; Weckhuysen, B.M.; Regalbuto, J.R. Selective adsorption of manganese onto cobalt for optimized Mn/Co/TiO2 Fischer—Tropsch catalysts. J. Catal. 2010, 270, 95–102. [Google Scholar] [CrossRef]
  25. Li, J.; Jacobs, G.; Zhang, Y.; Das, T.; Davis, B.H. Fischer—Tropsch synthesis: Effect of small amounts of boron, ruthenium and rhenium on Co/TiO2 catalysts. Appl. Catal. A Gen. 2002, 223, 195–203. [Google Scholar] [CrossRef]
  26. Arai, H.; Mitsuishi, K.; Seiyama, T. TiO2-supported fe–co, co–ni, and ni–fe alloy catalysts for fischer-tropsch synthesis. Chem. Lett. 1984, 13, 1291–1294. [Google Scholar] [CrossRef]
  27. Duvenhage, D.; Coville, N. Fe: Co/TiO2 bimetallic catalysts for the Fischer—Tropsch reaction: Part 2. The effect of calcination and reduction temperature. Appl. Catal. A Gen. 2002, 233, 63–75. [Google Scholar] [CrossRef]
  28. Ying, X.; Zhang, L.; Xu, H.; Ren, Y.-L.; Luo, Q.; Zhu, H.-W.; Qu, H.; Xuan, J. Efficient Fischer—Tropsch microreactor with innovative aluminizing pretreatment on stainless steel substrate for Co/Al2O3 catalyst coating. Fuel Process. Technol. 2016, 143, 51–59. [Google Scholar] [CrossRef]
  29. Ernst, B.; Libs, S.; Chaumette, P.; Kiennemann, A. Preparation and characterization of Fischer—Tropsch active Co/SiO2 catalysts. Appl. Catal. A Gen. 1999, 186, 145–168. [Google Scholar] [CrossRef]
  30. Li, J.; Jacobs, G.; Das, T.; Zhang, Y.; Davis, B. Fischer—Tropsch synthesis: Effect of water on the catalytic properties of a Co/SiO2 catalyst. Appl. Catal. A Gen. 2002, 236, 67–76. [Google Scholar] [CrossRef]
  31. Barbier, A.; Tuel, A.; Arcon, I.; Kodre, A.; Martin, G.A. Characterization and catalytic behavior of Co/SiO2 catalysts: Influence of dispersion in the Fischer—Tropsch reaction. J. Catal. 2001, 200, 106–116. [Google Scholar] [CrossRef]
  32. Yang, Y.; Xiang, H.-W.; Tian, L.; Wang, H.; Zhang, C.-H.; Tao, Z.-C.; Xu, Y.-Y.; Zhong, B.; Li, Y.-W. Structure and Fischer—Tropsch performance of iron—Manganese catalyst incorporated with SiO2. Appl. Catal. A Gen. 2005, 284, 105–122. [Google Scholar] [CrossRef]
  33. Moradi, G.; Basir, M.; Taeb, A.; Kiennemann, A. Promotion of Co/SiO2 Fischer—Tropsch catalysts with zirconium. Catal. Commun. 2003, 4, 27–32. [Google Scholar] [CrossRef]
  34. Chen, W.; Fan, Z.; Pan, X.; Bao, X. Effect of confinement in carbon nanotubes on the activity of Fischer—Tropsch iron catalyst. J. Am. Chem. Soc. 2008, 130, 9414–9419. [Google Scholar] [CrossRef] [PubMed]
  35. Bahome, M.C.; Jewell, L.L.; Hildebrandt, D.; Glasser, D.; Coville, N.J. Fischer—Tropsch synthesis over iron catalysts supported on carbon nanotubes. Appl. Catal. A Gen. 2005, 287, 60–67. [Google Scholar] [CrossRef]
  36. Abbaslou, R.M.M.; Tavassoli, A.; Soltan, J.; Dalai, A.K. Iron catalysts supported on carbon nanotubes for Fischer—Tropsch synthesis: Effect of catalytic site position. Appl. Catal. A Gen. 2009, 367, 47–52. [Google Scholar] [CrossRef]
  37. Nagineni, V.S.; Zhao, S.; Potluri, A.; Liang, Y.; Siriwardane, U.; Seetala, N.V.; Fang, J.; Palmer, J.; Kuila, D. Microreactors for Syngas Conversion to Higher Alkanes:  Characterization of Sol−Gel-Encapsulated Nanoscale Fe−Co Catalysts in the Microchannels. Ind. Eng. Chem. Res. 2005, 44, 5602–5607. [Google Scholar] [CrossRef]
  38. Mehta, S.; Deshmane, V.; Zhao, S.; Kuila, D. Comparative Studies of Silica-Encapsulated Iron, Cobalt, and Ruthenium Nanocatalysts for Fischer—Tropsch Synthesis in Silicon-Microchannel Microreactors. Ind. Eng. Chem. Res. 2014, 53, 16245–16253. [Google Scholar] [CrossRef]
  39. Zhao, S.; Nagineni, V.S.; Seetala, N.V.; Kuila, D. Microreactors for Syngas Conversion to Higher Alkanes:  Effect of Ruthenium on Silica-Supported Iron−Cobalt Nanocatalysts. Ind. Eng. Chem. Res. 2008, 47, 1684–1688. [Google Scholar] [CrossRef]
  40. Abrokwah, R.Y.; Rahman, M.M.; Deshmane, V.G.; Kuila, D. Effect of titania support on Fischer-Tropsch synthesis using cobalt, iron, and ruthenium catalysts in silicon-microchannel microreactor. Mol. Catal. 2019, 478, 110566. [Google Scholar] [CrossRef]
  41. Gutmann, B.; Koeckinger, M.; Glotz, G.; Ciaglia, T.; Slama, E.; Zadravec, M.; Pfanner, S.; Gruber-Woelfler, H.; Maier, M.; Kappe, C.O. Design and 3D Printing of a Stainless Steel Reactor for Continuous Difluoromethylations Using Fluoroform. React. Chem. Eng. 2017, 2. [Google Scholar] [CrossRef]
  42. Monaghan, T.; Harding, M.J.; Harris, R.A.; Friel, R.J.; Christie, S.D. Customisable 3D printed microfluidics for integrated analysis and optimisation. Lab Chip 2016, 16, 3362–3373. [Google Scholar] [CrossRef] [Green Version]
  43. Scotti, G.; Matilainen, V.; Kanninen, P.; Piili, H.; Salminen, A.; Kallio, T.; Franssila, S. Laser additive manufacturing of stainless steel micro fuel cells. J. Power Sources 2014, 272, 356–361. [Google Scholar] [CrossRef]
  44. Scotti, G.; Kanninen, P.; Matilainen, V.-P.; Salminen, A.; Kallio, T. Stainless steel micro fuel cells with enclosed channels by laser additive manufacturing. Energy 2016, 106, 475–481. [Google Scholar] [CrossRef]
  45. Capel, A.J.; Edmondson, S.; Christie, S.D.; Goodridge, R.D.; Bibb, R.J.; Thurstans, M. Design and additive manufacture for flow chemistry. Lab Chip 2013, 13, 4583–4590. [Google Scholar] [CrossRef] [PubMed] [Green Version]
  46. Amin, R.; Knowlton, S.; Hart, A.; Yenilmez, B.; Ghaderinezhad, F.; Katebifar, S.; Messina, M.; Khademhosseini, A.; Tasoglu, S. 3D-printed microfluidic devices. Biofabrication 2016, 8, 022001. [Google Scholar] [CrossRef] [PubMed]
  47. Reintjens, R.; Ager, D.J.; De Vries, A.H. Flow chemistry, how to bring it to industrial scale? Chim. Oggi 2015, 33, 21–24. [Google Scholar]
  48. Abrokwah, R.Y.; Deshmane, V.G.; Kuila, D. Comparative performance of M-MCM-41 (M: Cu, Co, Ni, Pd, Zn and Sn) catalysts for steam reforming of methanol. J. Mol. Catal. A Chem. 2016, 425, 10–20. [Google Scholar] [CrossRef] [Green Version]
  49. Deshmane, V.G.; Abrokwah, R.Y.; Kuila, D. Synthesis of stable Cu-MCM-41 nanocatalysts for H2 production with high selectivity via steam reforming of methanol. Int. J. Hydrogen Energy 2015, 40, 10439–10452. [Google Scholar] [CrossRef]
  50. Abrokwah, R.Y.; Deshmane, V.G.; Owen, S.L.; Kuila, D. Cu-Ni Nanocatalysts in Mesoporous MCM-41 and TiO2 to Produce Hydrogen for Fuel Cells via Steam Reforming Reactions. Adv. Mater. Res. 2015, 1096, 161–168. [Google Scholar] [CrossRef]
  51. Tatineni, B.; Basova, Y.; Rahman, A.; Islam, S.; Rahman, M.; Islam, A.; Perkins, J.; King, J.; Taylor, J.; Kumar, D.; et al. Development of Mesoporous Silica Encapsulated Pd-Ni Nanocatalyst for Hydrogen Production. In Production and Purification of Ultraclean Transportation Fuels; American Chemical Society: Washington, DC, USA, 2011; Volume 1088, pp. 177–190. [Google Scholar]
  52. Taghizadeh, M.; Akhoundzadeh, H.; Rezayan, A.; Sadeghian, M. Excellent catalytic performance of 3D-mesoporous KIT-6 supported Cu and Ce nanoparticles in methanol steam reforming. Int. J. Hydrogen Energy 2018, 43, 10926–10937. [Google Scholar] [CrossRef]
  53. Lanzafame, P.; Perathoner, S.; Centi, G.; Frusteri, F. Synthesis and characterization of Co-containing SBA-15 catalysts. J. Porous Mater. 2007, 14, 305–313. [Google Scholar] [CrossRef]
  54. Sing, K.S. Reporting physisorption data for gas/solid systems with special reference to the determination of surface area and porosity (Recommendations 1984). Pure Appl. Chem. 1985, 57, 603–619. [Google Scholar] [CrossRef]
  55. Biz, S.; Occelli, M.L. Synthesis and characterization of mesostructured materials. Catal. Rev. 1998, 40, 329–407. [Google Scholar] [CrossRef]
  56. Zhao, D.; Feng, J.; Huo, Q.; Melosh, N.; Fredrickson, G.H.; Chmelka, B.F.; Stucky, G.D. Triblock copolymer syntheses of mesoporous silica with periodic 50 to 300 angstrom pores. Science 1998, 279, 548–552. [Google Scholar] [CrossRef] [PubMed]
  57. Karthikeyan, G.; Pandurangan, A. Post synthesis alumination of KIT-6 materials with Ia3d symmetry and their catalytic efficiency towards multicomponent synthesis of 1H-pyrazolo[1,2-]phthalazine-5,10-dione carbonitriles and carboxylates. J. Mol. Catal. A Chem. 2012, 361, 58–67. [Google Scholar] [CrossRef]
  58. Schwertmann, U.; Cambier, P.; Murad, E. Properties of Goethites of Varying Crystallinity. Clays Clay Miner. 1985, 33, 369–378. [Google Scholar] [CrossRef]
  59. Li, G.; Zhang, C.; Wang, Z.; Huang, H.; Peng, H.; Li, X. Fabrication of mesoporous Co3O4 oxides by acid treatment and their catalytic performances for toluene oxidation. Appl. Catal. A Gen. 2018, 550, 67–76. [Google Scholar] [CrossRef]
  60. Liu, X.; He, J.; Yang, L.; Wang, Y.; Zhang, S.; Wang, W.; Wang, J. Liquid-phase oxidation of cyclohexane to cyclohexanone over cobalt-doped SBA-3. Catal. Commun. 2010, 11, 710–714. [Google Scholar] [CrossRef]
  61. Li, Z.; Miao, Z.; Wang, X.; Zhao, J.; Zhou, J.; Si, W.; Zhuo, S. One-pot synthesis of ZrMo-KIT-6 solid acid catalyst for solvent-free conversion of glycerol to solketal. Fuel 2018, 233, 377–387. [Google Scholar] [CrossRef]
  62. Hess, C.; Tzolova-Müller, G.; Herbert, R. The Influence of Water on the Dispersion of Vanadia Supported on Silica SBA-15:  A Combined XPS and Raman Study. J. Phys. Chem. C 2007, 111, 9471–9479. [Google Scholar] [CrossRef]
  63. Bhoware, S.S.; Singh, A.P. Characterization and catalytic activity of cobalt containing MCM-41 prepared by direct hydrothermal, grafting and immobilization methods. J. Mol. Catal. A Chem. 2007, 266, 118–130. [Google Scholar] [CrossRef]
  64. Yao, Q.; Lu, Z.-H.; Yang, K.; Chen, X.; Zhu, M. Ruthenium nanoparticles confined in SBA-15 as highly efficient catalyst for hydrolytic dehydrogenation of ammonia borane and hydrazine borane. Sci. Rep. 2015, 5, 15186. [Google Scholar] [CrossRef]
  65. Panpranot, J.; Goodwin, J.G., Jr.; Sayari, A. Synthesis and characteristics of MCM-41 supported CoRu catalysts. Catal. Today 2002, 77, 269–284. [Google Scholar] [CrossRef]
  66. Martínez, A.; López, C.; Márquez, F.; Díaz, I. Fischer-Tropsch synthesis of hydrocarbons over mesoporous Co/SBA-15 catalysts: The influence of metal loading, cobalt precursor, and promoters. J. Catal. 2003, 220, 486–499. [Google Scholar] [CrossRef]
  67. Lim, S.; Ciuparu, D.; Yang, Y.; Du, G.; Pfefferle, L.D.; Haller, G.L. Improved synthesis of highly ordered Co-MCM-41. Microporous Mesoporous Mater. 2007, 101, 200–206. [Google Scholar] [CrossRef]
  68. Jiang, T.; Shen, W.; Zhao, Q.; Li, M.; Chu, J.; Yin, H. Characterization of CoMCM-41 mesoporous molecular sieves obtained by the microwave irradiation method. J. Solid State Chem. 2008, 181, 2298–2305. [Google Scholar] [CrossRef]
  69. Haddad, G.J.; Goodwin, J.G., Jr. The impact of aqueous impregnation on the properties of prereduced vs. precalcined Co/SiO2. J. Catal. 1995, 157, 25–34. [Google Scholar] [CrossRef]
  70. Cai, Q.; Li, J. Catalytic properties of the Ru promoted Co/SBA-15 catalysts for Fischer—Tropsch synthesis. Catal. Commun. 2008, 9, 2003–2006. [Google Scholar] [CrossRef]
  71. Van Der Laan, G.P.; Beenackers, A. Kinetics and selectivity of the Fischer—Tropsch synthesis: A literature review. Catal. Rev. 1999, 41, 255–318. [Google Scholar] [CrossRef]
  72. Yates, I.C.; Satterfield, C.N. Intrinsic kinetics of the Fischer-Tropsch synthesis on a cobalt cνatalyst. Energy Fuels 1991, 5, 168–173. [Google Scholar] [CrossRef]
  73. Iglesia, E.; Reyes, S.C.; Soled, S.L. Reaction-transport selectivity models and the design of Fischer-Tropsch catalysts. Chem. Ind. N. Y. Marcel Dekker 1993, 51, 199–257. [Google Scholar]
  74. Zennaro, R.; Tagliabue, M.; Bartholomew, C.H. Kinetics of Fischer—Tropsch synthesis on titania-supported cobalt. Catal. Today 2000, 58, 309–319. [Google Scholar] [CrossRef]
  75. Das, T.K.; Conner, W.A.; Li, J.; Jacobs, G.; Dry, M.E.; Davis, B.H. Fischer−Tropsch synthesis: Kinetics and effect of water for a Co/SiO2 catalyst. Energy Fuels 2005, 19, 1430–1439. [Google Scholar] [CrossRef]
  76. Almeida, L.; Sanz, O.; Merino, D.; Arzamendi, G.; Gandía, L.; Montes, M. Kinetic analysis and microstructured reactors modeling for the Fischer—Tropsch synthesis over a Co–Re/Al2O3 catalyst. Catal. Today 2013, 215, 103–111. [Google Scholar] [CrossRef]
  77. Yang, C.-H.; Massoth, F.; Oblad, A. Kinetics of CO+ H2 reaction over Co–Cu–Al2O3 catalyst. Hydrocarbon synthesis from carbon monoxide and hydrogen. J. Am. Chem. Soc. 1979, 178, 35–46. [Google Scholar]
  78. Pannell, R.B.; Kibby, C.L.; Kobylinski, T.P. A Steady-State Study of Fischer-Tropsch Product Distributions Over Cobalt, Iron and Ruthenium. In Studies in Surface Science and Catalysis; Seivama, T., Tanabe, K., Eds.; Elsevier: Amsterdam, The Netherlands, 1981; Volume 7, pp. 447–459. [Google Scholar]
  79. Outi, A.; Rautavuoma, I.; Van der Baan, H.S. Kinetics and mechanism of the fischer tropsch hydrocarbon synthesis on a cobalt on alumina catalyst. Appl. Catal. 1981, 1, 247–272. [Google Scholar] [CrossRef]
  80. Sun, Y.; Jia, Z.; Yang, G.; Zhang, L.; Sun, Z. Fischer-Tropsch synthesis using iron based catalyst in a microchannel reactor: Performance evaluation and kinetic modeling. Int. J. Hydrogen Energy 2017, 42, 29222–29235. [Google Scholar] [CrossRef]
  81. Mirzaei, A.A.; Kiai, R.M.; Atashi, H.; Arsalanfar, M.; Shahriari, S. Kinetic study of CO hydrogenation over co-precipitated iron–nickel catalyst. J. Ind. Eng. Chem. 2012, 18, 1242–1251. [Google Scholar] [CrossRef]
  82. Sarup, B.; Wojciechowski, B.W. Studies of the fischer-tropsch synthesis on a cobalt catalyst II. Kinetics of carbon monoxide conversion to methane and to higher hydrocarbons. Can. J. Chem. Eng. 1989, 67, 62–74. [Google Scholar] [CrossRef]
  83. Bepari, S.; Pradhan, N.C.; Dalai, A.K. Selective production of hydrogen by steam reforming of glycerol over Ni/Fly ash catalyst. Catal. Today 2017, 291, 36–46. [Google Scholar] [CrossRef]
  84. Fogler, H.S. Elements of Chemical Reaction Engineering, 3rd ed.; Prentice Hall PTR: Upper Saddle River, NJ, USA, 1999. [Google Scholar]
  85. Van Santen, R.A.; Ciobîcâ, I.M.; Van Steen, E.; Ghouri, M.M. Mechanistic Issues in Fischer-Tropsch Catalysis. In Advances in Catalysis; Academic Press: Cambridge, MA, USA, 2011; Volume 54, pp. 127–187. [Google Scholar]
  86. Van Santen, R.A.; Ghouri, M.M.; Shetty, S.; Hensen, E.M.H. Structure sensitivity of the Fischer-Tropsch reaction; Molecular kinetics simulations. Catal. Sci. Technol. 2011, 1, 891–911. [Google Scholar] [CrossRef]
  87. Markvoort, A.J.; Van Santen, R.A.; Hilbers, P.A.J.; Hensen, E.J.M. Kinetics of the Fischer-Tropsch reaction. Angew. Chem.-Int. Ed. 2012, 51, 9015–9019. [Google Scholar] [CrossRef]
  88. Mansouri, M.; Atashi, H.; Mirzaei, A.A.; Jangi, R. Kinetics of the Fischer-Tropsch synthesis on silica-supported cobalt-cerium catalyst. Int. J. Ind. Chem. 2013, 4, 1. [Google Scholar] [CrossRef] [Green Version]
  89. Pant, K.K.; Upadhyayula, S. Detailed kinetics of Fischer Tropsch synthesis over Fe-Co bimetallic catalyst considering chain length dependent olefin desorption. Fuel 2019, 236, 1263–1272. [Google Scholar] [CrossRef]
  90. Mosayebi, A.; Abedini, R. Detailed kinetic study of Fischer—Tropsch synthesis for gasoline production over CoNi/HZSM-5 nano-structure catalyst. Int. J. Hydrogen Energy 2017, 42, 27013–27023. [Google Scholar] [CrossRef]
  91. Abbasi, M.; Mirzaei, A.A.; Atashi, H. The mechanism and kinetics study of Fischer‒Tropsch reaction over iron-nickel-cerium nano-structure catalyst. Int. J. Hydrogen Energy 2019, 44, 24667–24679. [Google Scholar] [CrossRef]
  92. Sun, Y.; Wei, J.; Zhang, J.P.; Yang, G. Optimization using response surface methodology and kinetic study of Fischer—Tropsch synthesis using SiO2 supported bimetallic Co–Ni catalyst. J. Nat. Gas Sci. Eng. 2016, 28, 173–183. [Google Scholar] [CrossRef]
  93. Sun, Y.; Yang, G.; Zhang, L.; Sun, Z. Fischer-Tropsch synthesis in a microchannel reactor using mesoporous silica supported bimetallic Co-Ni catalyst: Process optimization and kinetic modeling. Chem. Eng. Proc. Process Intensif. 2017, 119, 44–61. [Google Scholar] [CrossRef]
  94. Moazami, N.; Wyszynski, M.L.; Rahbar, K.; Tsolakis, A.; Mahmoudi, H. A comprehensive study of kinetics mechanism of Fischer-Tropsch synthesis over cobalt-based catalyst. Chem. Eng. Sci. 2017, 171, 32–60. [Google Scholar] [CrossRef] [Green Version]
  95. Moazami, N.; Wyszynski, M.L.; Mahmoudi, H.; Tsolakis, A.; Zou, Z.; Panahifar, P.; Rahbar, K. Modelling of a fixed bed reactor for Fischer—Tropsch synthesis of simulated N2-rich syngas over Co/SiO2: Hydrocarbon production. Fuel 2015, 154, 140–151. [Google Scholar] [CrossRef]
  96. Marchese, M.; Heikkinen, N.; Giglio, E.; Lanzini, A.; Lehtonen, J.; Reinikainen, M. Kinetic Study Based on the Carbide Mechanism of a Co-Pt/γ-Al2O3 Fischer—Tropsch Catalyst Tested in a Laboratory-Scale Tubular Reactor. Catalysts 2019, 9, 717. [Google Scholar] [CrossRef]
  97. Bhatelia, T.; Li, C.e.; Sun, Y.; Hazewinkel, P.; Burke, N.; Sage, V. Chain length dependent olefin re-adsorption model for Fischer—Tropsch synthesis over Co-Al2O3 catalyst. Fuel Process. Technol. 2014, 125, 277–289. [Google Scholar] [CrossRef]
  98. Todic, B.; Bhatelia, T.; Froment, G.F.; Ma, W.; Jacobs, G.; Davis, B.H.; Bukur, D.B. Kinetic Model of Fischer—Tropsch Synthesis in a Slurry Reactor on Co–Re/Al2O3 Catalyst. Ind. Eng. Chem. Res. 2013, 52, 669–679. [Google Scholar] [CrossRef]
  99. Jahangiri, H.; Bennett, J.; Mahjoubi, P.; Wilson, K.; Gu, S. A review of advanced catalyst development for Fischer—Tropsch synthesis of hydrocarbons from biomass derived syn-gas. Catal. Sci. Technol. 2014, 4, 2210–2229. [Google Scholar] [CrossRef]
  100. Iglesia, E. Design, synthesis, and use of cobalt-based Fischer-Tropsch synthesis catalysts. Appl. Catal. A Gen. 1997, 161, 59–78. [Google Scholar] [CrossRef]
  101. Iglesia, E.; Soled, S.L.; Fiato, R.A.; Via, G.H. Bimetallic Synergy in Cobalt Ruthenium Fischer-Tropsch Synthesis Catalysts. J. Catal. 1993, 143, 345–368. [Google Scholar] [CrossRef]
  102. Kleitz, F.; Choi, S.H.; Ryoo, R. Cubic Ia 3 d large mesoporous silica: Synthesis and replication to platinum nanowires, carbon nanorods and carbon nanotubes. Chem. Commun. 2003, 17, 2136–2137. [Google Scholar] [CrossRef]
  103. Barrett, E.P.; Joyner, L.G.; Halenda, P.P. The Determination of Pore Volume and Area Distributions in Porous Substances. I. Computations from Nitrogen Isotherms. J. Am. Chem. Soc. 1951, 73, 373–380. [Google Scholar] [CrossRef]
Figure 1. (a) N2 adsorption–desorption isotherms of CoRu-S (S = MCM-41, SBA-15, KIT-6) and (b) pore size distribution of the catalyst.
Catalysts 09 00872 g001
Figure 2. High magnification TEM images of CoRu-S Catalysts (S = (a) MCM-41, (b) SBA-15, (c) KIT-6.
Catalysts 09 00872 g002
Figure 3. Low angle XRD of three bimetallic mesoporous catalysts: (a) CoRu-MCM41; (b) CoRu-SBA15; (c) CoRu-KIT6.
Catalysts 09 00872 g003
Figure 4. Wide angle XRD patterns of three bimetallic catalysts: (a) CoRu-MCM41; (b) CoRu-SBA15; (c) CoRu-KIT6.
Catalysts 09 00872 g004
Figure 5. XPS spectra of metals incorporated MCM-41, KIT-6, and SBA-15: (a) Co 2p spectra and (b) Ru 3d spectra.
Catalysts 09 00872 g005
Figure 6. H2-TPR(temperature programmed reduction) profiles of CoRu-S (S = MCM-41, KIT-6 and SBA-15) Catalysts.
Catalysts 09 00872 g006
Figure 7. Effect of space velocity on CO conversion: (a) CoRu-MCM-41; (b) CoRu-SBA-15; (c) CoRu-KIT-6.
Catalysts 09 00872 g007
Figure 8. Arrhenius plot-based on Langmuir–Hinselwood (LH) model for FT synthesis over CoRu-MCM-41 catalyst.
Catalysts 09 00872 g008
Figure 9. Arrhenius plot-based on LH model for FT synthesis over CoRu-SBA-15 catalyst.
Catalysts 09 00872 g009
Figure 10. Arrhenius plot-based on LH model for FT synthesis over CoRu-KIT-6 catalyst.
Catalysts 09 00872 g010
Figure 11. Experimental rate vs predicted rate for all temperature of three different catalysts: (a) CoRu-MCM-41; (b) CoRu-SBA-15; (c) CoRu-KIT-6.
Catalysts 09 00872 g011aCatalysts 09 00872 g011b
Figure 12. Deactivation studies of the catalysts at T = 240 °C, P = 1 atm and H2:CO = 2:1.
Catalysts 09 00872 g012
Figure 13. (a) and (b): AutoCAD design of the microreactor and cover channel (c) 3D printed reactor, (d) SEM image of the microchannels coated with catalyst prior to FT studies.
Catalysts 09 00872 g013
Figure 14. Experimental set-up for FT synthesis in a 3-D printed stainless steel microreactor.
Catalysts 09 00872 g014
Table 1. Brunner–Emmett–Teller (BET) surface area, pore size, pore volume and EDX metal loadings of synthesized catalysts.
Mesoporous Silica Supported Catalyst with Intended Metal LoadingsSurface Area a (m2/g)Pore Volume b (cm3/g)Pore Size c (nm)Metal Loadings Obtained from SEM-EDX (wt %)
10% Co5%Ru-MCM-4110250.773.29%Co3.9%Ru-MCM-41
10% Co5%Ru-SBA-156910.734.28.4%Co4.5%Ru-KIT-6
10%Co5%Ru-KIT-66900.925.311.1%Co5.6%Ru-SBA-15
a = Variation range ±2%, b = Variation range ±3%, c = Variation range ±5%.
Table 2. Elementary reaction steps for Fischer–Tropsch synthesis.
ModelNoElementary Reaction
FT-11 C O + * k 1 k 1 C O *      K 1 = k 1 k 1
2 C O * + H 2 k C + D + *
FT-21 H 2 + * k 1 k 1 H 2 *       K 1 = k 1 k 1   
2 H 2 * + C O k C + D + *
FT-31 C O + * k 1 k 1 C O *       K 1 = k 1 k 1
2 H 2 + * k 2 k 2 H 2 *       K 2 = k 2 k 2
3 C O * + H 2 * k C + D + 2 *
FT-41 C O + * k 1 k 1 C O *       K 1 = k 1 k 1
2 C O * + H 2 k 2 k 2 C O H 2 *        K 2 = k 2 k 2
3 C O H 2 * k C + D + *
FT-51 H 2 + * k 1 k 1 H 2 *       K 1 = k 1 k 1   
2 H 2 * + C O k 2 k 2 C O H 2 *         K 2 = k 2 k 2            
3 C O H 2 * k C + D + *
FT-61 C O + * k 1 k 1 C O *       K 1 = k 1 k 1
2 H 2 + * k 2 k 2 H 2 *       K 2 = k 2 k 2
3 C O * + H 2 *    k 3 k 3 C O H 2 * + *        K 3 = k 3 k 3
4 C O H 2 * k C + D + *
Table 3. Proposed kinetic equations for Fischer–Tropsch synthesis.
ModelRate Controlling Step (RCS)Kinetic Equation
FT-1(2) r C O = k K 1 p C O p H 2 ( 1 + K 1 p C O )
FT-2(2) r C O = k K 1 p C O p H 2 ( 1 + K 1 p H 2 )
FT-3(3) r C O = k K 1 K 2 p C O p H 2 ( 1 + K 1 p C O + K 2 p H 2 ) 2
FT-4(3) r C O = k K 1 K 2 p C O p H 2 ( 1 + K 1 K 2 p C O p H 2 + K 1 p C O )
FT-5(3) r C O = k K 1 K 2 p C O p H 2 ( 1 + K 1 K 2 p C O p H 2 + K 1 p H 2 )
FT-6(4) r C O = k K 1 K 2 K 3 p C O p H 2 ( 1 + K 1 K 2 K 3 p C O p H 2 + K 1 p C O + K 2 p H 2 )
Table 4. Kinetic experimental data for all the catalysts.
TemperatureW/F (Kgcat.h/kmol)CoRu-MCM-41CoRu-SBA-15CoRu-KIT-6
Reaction Rate (Kmol/Kg.h)Conversion (%)Reaction Rate (Kmol/Kg.h)Conversion (%)Reaction Rate (Kmol/Kg.h)Conversion (%)
210 °C25.20.03589.530.03588.350.03384.12
12.60.07088.430.06886.080.06583.03
8.390.10084.290.184.290.09882.41
6.300.13081.970.1381.970.1381.97
5.040.15678.640.16281.520.15879.34
4.200.17774.450.18879.110.18678.15
3.600.18165.460.20874.740.2175.45
3.150.19661.980.23172.790.22470.43
240 °C25.20.03693.090.03794.430.03487.39
12.60.07190.090.07190.360.06785.27
8.390.10588.840.0185.180.10184.79
6.300.12780.140.01382.070.12679.63
5.040.15377.340.15779.240.15477.48
4.200.16067.230.18276.320.17674.02
3.600.17663.420.20975.250.20172.35
3.150.18759.020.21868.760.22470.44
270 °C25.20.03794.950.03895.980.03692.40
12.60.07088.390.07291.550.06987.39
8.390.10083.960.10789.900.10185.01
6.300.11572.700.13585.220.13081.80
5.040.13367.480.16281.420.15377.08
4.200.15866.530.18276.320.17774.18
3.600.17563.200.20674.190.271.93
3.150.19461.340.22269.900.22270.00
Table 5. Kinetic parameters obtained from proposed mechanisms for CoRu-MCM-41
ModelTemperature
210 °CR2240 °CR2270 °CR2
FT-1k = 0.872 ± 0.0037
K1 = 21.19 ± 1.79
0.88k = 0.23 ± 0.027
K1 = 16.49 ± 7.66
0.98k = 0.38 ± 0.118
K1 = 3.92 ± 2.46
0.98
FT-2k = 0.87 ± 0.0037
K1 = 21.19 ± 1.79
0.88k = 0.74 ± 0.0014
K1 = 21.19 ± 0.84
0.72k = 0.69 ± 0.0067
K1 = 6.05 ± 0.34
0.93
FT-3k = 1.32 ± 0.000029
K1 = 5.04 ± 0.000194
K2 = 2.877 ± 0.000468
0.97k = 2.21 ± 0.017
K1 = 4.02 ± 0.103
K2 = 0.51 ± 0.0064
0.96k = 3.22 ± 0.068
K1 = 1.41 ± 0.05
K2 = 0.5 ± 0.019
0.97
FT-4k = 0.443 ± 1.69
K1 = 1.88 ± 19.53
K2 = 2.49 ± 34.08
0.98k = 0.85 ± 0.015
K1 = 11.09 ± 0.686
K2 = 0.365 ± 0.0077
0.98k = 2.01 ± 0.037
K1 = 3.13 ± 0.11
K2 = 0.228 ± 0.0045
0.98
FT-5k = 0.536 ± 0.000355
K1 = 21.19 ± 0.403
K2 = 2.42 ± 0.0023
0.97k = 0.48 ± 0.000205
K1 = 21.19 ± 0.265
K2 = 2.33 ± 0.0015
0.90k = 0.41 ± 0.009
K1 = 0.33 ± 0.014
K2 = 11.09 ± 0.396
0.97
FT-6k = 0.704 ± 0.0022
K1 = 0.931 ± 0.0039
K2 = 31.29 ± 3.21
K3 = 1.77 ± 0.0074
0.96k = 0.67 ± 0.0012
K1 = 0.897 ± 0.0021
K2 = 31.29 ± 1.83
K3 = 1.69 ± 0.0041
0.87k = 0.243 ± 0.00018
K1 = 3.14 ± 0.0052
K2 = 31.29 ± 0.76
K3 = 1.67 ± 0.0027
0.83
Table 6. Kinetic parameters obtained from proposed mechanisms for CoRu-SBA-15.
ModelTemperature
210 °CR2240 °CR2270 °CR2
FT-1k = 3.02 ± 0.092
K1 = 0.46 ± 0.015
0.94k = 2.01 ± 0.059
K1 = 0.655 ± 0.021
0.94k = 2.01 ± 0.026
K1 = 0.727 ± 0.01
0.98
FT-2k = 9.08 ± 0.266
K1 = 0.166 ± 0.005
0.94k = 11.09 ± 0.281
K1 = 0.118 ± 0.0033
0.95k = 13.12 ± 0.005
K1 = 0.109 ± 0.000046
0.99
FT-3k = 11.09 ± 0.698
K1 = 2.23 ± 0.145
K2 = 20.62 ± 1.49
0.82k = 2.01 ± 0.043
K1 = 10.79 ± 0.285
K2 = 17.51 ± 0.536
0.79k = 11.09 ± 0.337
K1 = 2.01 ± 0.063
K2 = 18.10 ± 0.645
0.95
FT-4k = 11.09 ± 0.379
K1 = 0.161 ± 0.0057
K2 = 0.761 ± 0.026
0.94k = 2.01 ± 0.0026
K1 = 0.283 ± 0.00042
K2 = 2.31 ± 0.0032
0.93k = 2.01 ± 0.037
K1 = 3.13 ± 0.11
K2 = 0.228 ± 0.0045
0.98
FT-5k = 2.01 ± 0.026
K1 = 0.189 ± 0.0031
K2 = 4.41 ± 0.062
0.92k = 2.01 ± 0.0237
K1 = 0.193 ± 0.0029
K2 = 3.92 ± 0.050
0.94k = 2.01 ± 0.032
K1 = 0.205 ± 0.0036
K2 = 3.62 ± 0.063
0.98
FT-6k = 2.01 ± 0.037
K1 = 0.988 ± 0.021
K2 = 0.894 ± 0.031
K3 = 1.57 ± 0.032
0.90k = 6.05 ± 0.253
K1 = 0.273 ± 0.012
K2 = 0.266 ± 0.014
K3 = 3.56 ± 0.153
0.94k = 2.01 ± 0.018
K1 = 0.937 ± 0.0094
K2 = 2.18 ± 0.057
K3 = 1.09 ± 0.011
0.97
Table 7. Kinetic parameters obtained from all the proposed mechanisms for CoRu-KIT-6.
ModelTemperature
210 °CR2240 °CR2270 °CR2
FT-1k = 2.18 ± 8.89
K1 = 0.73 ± 3.28
0.97k = 0.79 ± 0.543
K1 = 2.13 ± 1.91
0.98k = 1.38 ± 1.42
K1 = 1.19 ± 1.44
0.99
FT-2k = 1.42 ± 0.00044
K1 = 11.09±0.038
0.95k = 1.29±0.022
K1 = 11.09±2.09
0.98k = 2.02±3.30
K1 = 1.94±8.71
0.98
FT-3k = 11.09±0.316
K1 = 0.892±0.031
K2 = 0.279±0.013
0.96k = 10.09±0.166
K1 = 0.882±0.018
K2 = 0.279±0.0073
0.98k = 11.09±0.088
K1 = 1.94±0.016
K2 = 15.64±0.15
0.97
FT-4k = 2.01±0.052
K1 = 0.122±0.0038
K2 = 7.27±0.203
0.97k = 2.01±0.088
K1 = 1.195±0.067
K2 = 0.694±0.033
0.98k = 2.01±0.072
K1 = 0.355±0.015
K2 = 2.29±0.089
0.99
FT-5k = 2.01±0.051
K1 = 0.121±0.0038
K2 = 7.27±0.203
0.97k = 1.46±0.00069
K1 = 10.08±0.055
K2 = 0.91±0.00049
0.92k = 2.01±0.028
K1 = 0.842±0.022
K2 = 1.62±0.024
0.99
FT-6k = 1.71±0.02
K1 = 1.39±0.02
K2 = 0.828±0.018
K3 = 1.61±0.021
0.95k = 2.01±0.039
K1 = 1.11±0.027
K2 = 0.454±0.013
K3 = 2.21±0.048
0.98k = 2.41±0.040
K1 = 0.91±0.017
K2 = 0.315±0.0071
K3 = 3.12±0.056
0.99

