Article

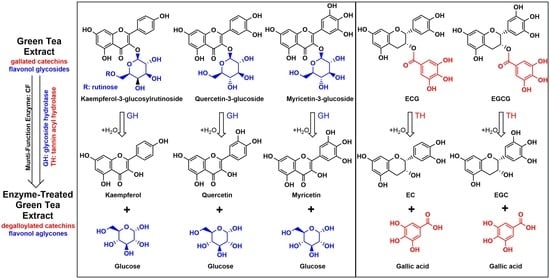
Simultaneous Optimal Production of Flavonol Aglycones and Degalloylated Catechins from Green Tea Using a Multi-Function Food-Grade Enzyme

1
Basic Research and Innovation Institute, Amorepacific R&D Center, Yongin 17074, Korea
2
Research and Development Division, Bision Corp., Seoul 05854, Korea
3
Safety and Regulatory Research Institute, Amorepacific Corporation R&D Center, Yongin 17074, Korea
4
Department of Food Science and Biotechnology, Kyung Hee University, Yongin 17104, Korea
5
Graduate School of Biotechnology, Kyung Hee University, Yongin 17104, Korea
*
Author to whom correspondence should be addressed.
Catalysts 2019, 9(10), 861; https://doi.org/10.3390/catal9100861
Submission received: 14 September 2019 / Revised: 4 October 2019 / Accepted: 13 October 2019 / Published: 16 October 2019
(This article belongs to the Special Issue Biocatalytic Process Optimization)

Abstract

:
(1) Background: Green tea (GT) contains well-known phytochemical compounds; namely, it is rich in flavan-3-ols (catechins) and flavonols comprising all glycoside forms. These compounds in GT might show better biological activities after a feasible enzymatic process, and the process on an industrial scale should consider enzyme specificity and cost-effectiveness. (2) Methods: In this study, we evaluated the most effective method for the enzymatic conversion of flavonoids from GT extract. One enzyme derived from Aspergillus niger (molecular weight 80–90 kDa) was ultimately selected, showing two distinct but simultaneous activities: intense glycoside hydrolase activity via deglycosylation and weak tannin acyl hydrolase activity via degalloylation. (3) Results: The optimum conditions for producing flavonol aglycones were pH 4.0 and 50 °C. Myricetin glycosides were cleaved 3.7–7.0 times faster than kaempferol glycosides. Flavonol aglycones were produced effectively by both enzymatic and hydrochloride treatment in a time-course reaction. Enzymatic treatment retained 80% (w/w) catechins, whereas 70% (w/w) of catechins disappeared by hydrochloride treatment. (4) Conclusions: This enzymatic process offers an effective method of conditionally producing flavonol aglycones and de-galloylated catechins from conversion of food-grade enzyme.

Graphical Abstract

1. Introduction

Green tea (GT) is well-known to be enriched in catechins with flavonols/flavones as the second-most dominant flavonoids; these include myricetin, quercetin, apigenin, and kaempferol [1]. GT generally contains approximately 15% catechins and 0.4% flavonols on a dry weight basis [2]. Many studies have demonstrated that catechins are major sources of the vast diversity of GT bioactivities [3,4]. However, in human nutrition, GT flavonols are generally considered to be less crucial for the utility and functionality of GT. The content and compositions of flavonol and flavone glycosides vary according to GT cultivar [5,6]. Similarly, glycosylated flavonols and flavones have different sugar bonds and compositions according to the plants [7]. Flavonol glycosides consist of various sugar units with –O- or –C-conjugation on flavonol molecules. The glycosidic structure of flavonols affects their biological and physiological properties, such as digestive stability and bioaccessibility [8,9,10]. For example, quercetin glycosides could be hydrolyzed to aglycone in the intestine [8], and quercetin 3-glucoside and quercetin 4-glucoside can be completely digested in humans [9]. However, flavonol glycosides with more complex structures undergo less hydrolysis in digestive conditions [10]. To date, the majority of research on the functionalities of flavonols has focused on the aglycone forms. Xiao et al. [11] proposed that flavonol aglycones have a higher affinity for proteins due to their hydrophobic characteristics, allowing for easy absorption by cells. Moreover, flavone aglycones exhibited more potent anti-inflammatory effects than their corresponding glycosides [12]. Flavonols, including myricetin, quercetin, and kaempferol, are known to possess numerous beneficial activities, such as antioxidative, anticancer, and antihyperlipidemic effects [13,14,15]. Furthermore, flavonol supplementation was proven to potentially reduce the risk of cardiometabolic disease in a clinical trial [16].
Plumb et al. [17] presented that the antioxidant activities of GT flavonol glycosides were lower than those of their corresponding aglycones. For example, quercetin rhamnoside, a GT flavonol glycoside, was found to have an affinity to bovine serum albumin 5600-fold lower than its corresponding aglycone, quercetin [11]. Owing to such limitations in the utilization of flavonols in human nutrition, a feasible enzymatic process was developed to break down plant-based flavonoid glycosides to their aglycones [18]. For example, the antioxidant capacity of soybean flour was enhanced by the enzymatic hydrolysis of phenolic glucoside in solid-state fungi fermentation [19]. In particular, tannase (EC 3.1.1.20; tannin acyl hydrolase) shows good ability in the bioconversion of green tea extract (GTE), resulting in gallic acid (GA) and degalloylated catechins [20,21].
Increasing the content of GA through the conversion of GTE by tannase has been shown to improve the radical scavenging activities of GTE [22]. Moreover, conversion of (⎯)-epigallocatechin gallate (EGCG) by tannase attenuated its toxicity without affecting the antiproliferative effects [21]. Another study demonstrated that tannase-treated catechins influenced the expression of genes involved in the sodium-glucose transport proteins [23]. For their effective absorption and utilization in the human body, some flavonol glycosides must be converted to their aglycone forms by digestive enzymes. Only 2% of the dietary flavonols that are digested and absorbed in the duodenum ultimately reach the plasma in intact form [24]. Flavonol glycosides are hydrolyzed by mammalian glucosidase in the small intestine before being absorbed in aglycone forms [25]. Some of the flavonol glycosides that are not hydrolyzed in the small intestine then move to the large intestine, where they undergo further metabolic reactions through bioconversions mediated by intestinal microorganisms [26]. Approximately 65% of human adults are estimated to have downregulated production of intestinal lactase (lactase phlorizin hydrolase; LPH) [27]. Lactase catalyzes the hydrolysis of β-glucosides, including phlorizin and flavonoid glucosides [28]. Furthermore, it was previously reported that flavonol-enriched fractions of GTE enhanced the bioavailability of the catechin epimers of GTE by downregulating the expression of the catechol-O-methyltransferase gene [29]. To date, research on the bioconversion of flavonol glycosides in GT to verify whether flavonol glycosides or aglycones are more beneficial to human nutrition and health is scarce.
Other than tannase-based research, there are limited studies on the bioconversion of GT flavonoids by food-grade enzymes that show high specificity to flavonol glycosides. Since the enzymes for hydrolyzing glycosides are very diverse and specific to the type of glycosidic bond, multiple enzymes generally need to be used to accomplish complex food treatments. We hypothesized that a few multi-activity enzymes could be used to improve the efficiency of conversion for obtaining functional compounds with nutritional benefits.
To test this possibility, we screened multi-functional food-grade enzymes among eight kinds of enzymes from a broth of fungi. We then selected an enzyme and further evaluated its kinetic characteristics and compared the effectiveness of enzymatic treatment for producing flavonol aglycones from flavonol glycosides in GTE to provide an optimized method.

2. Results

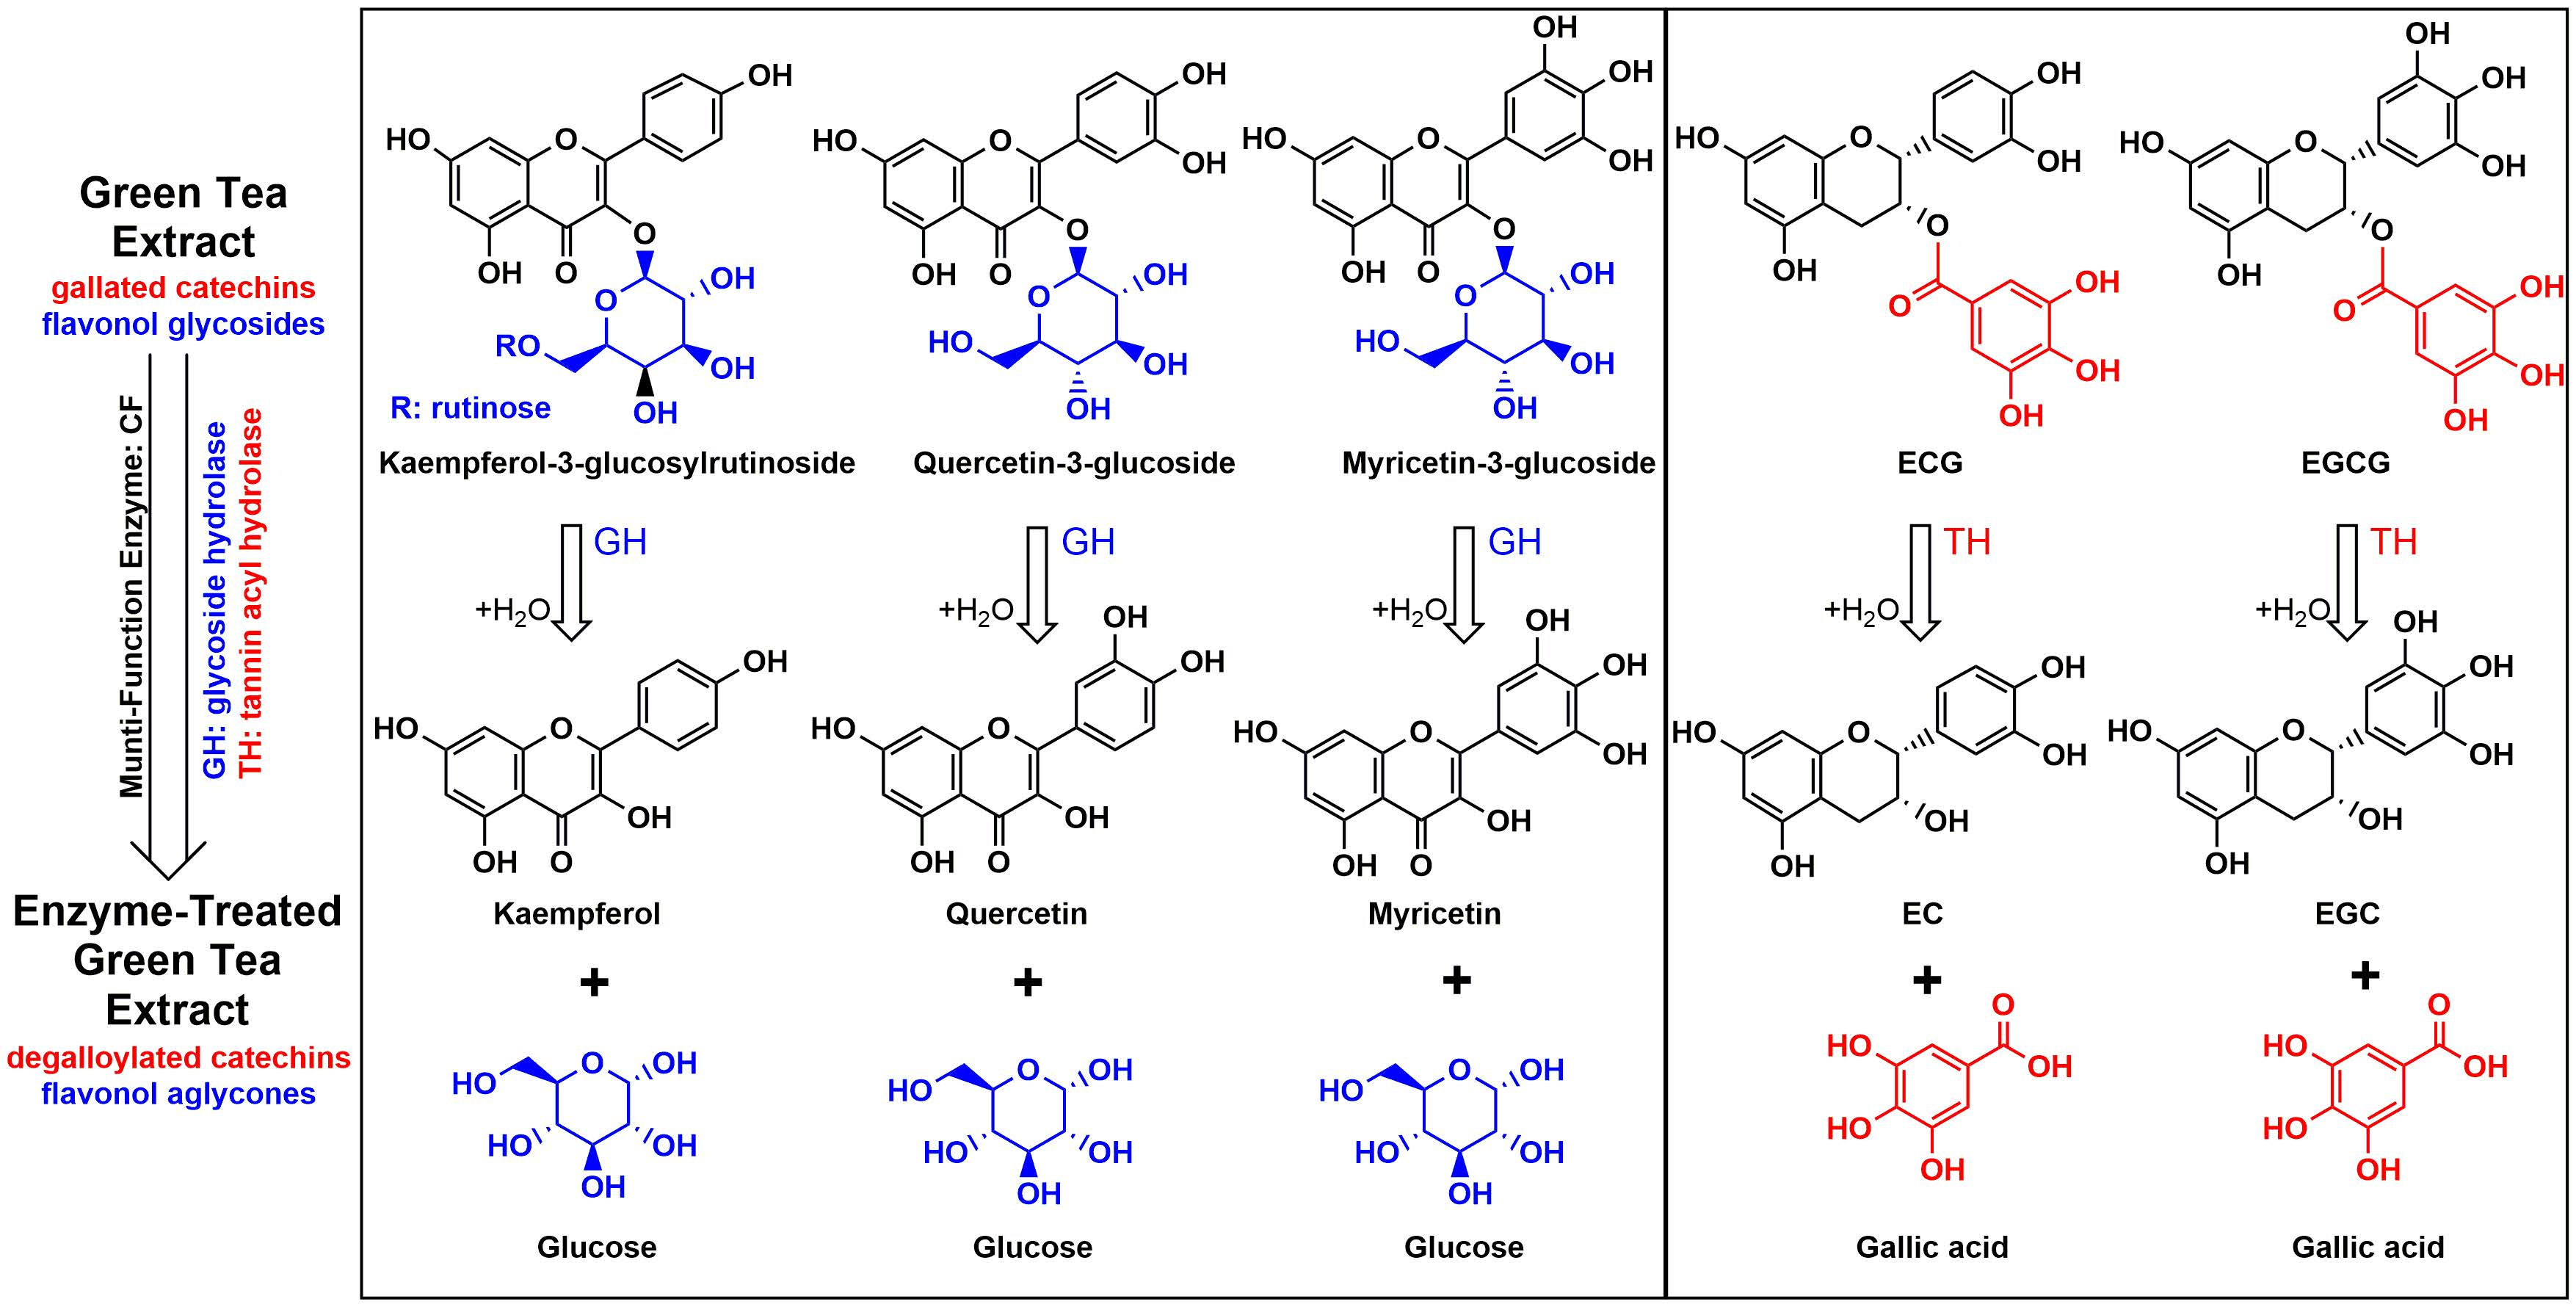
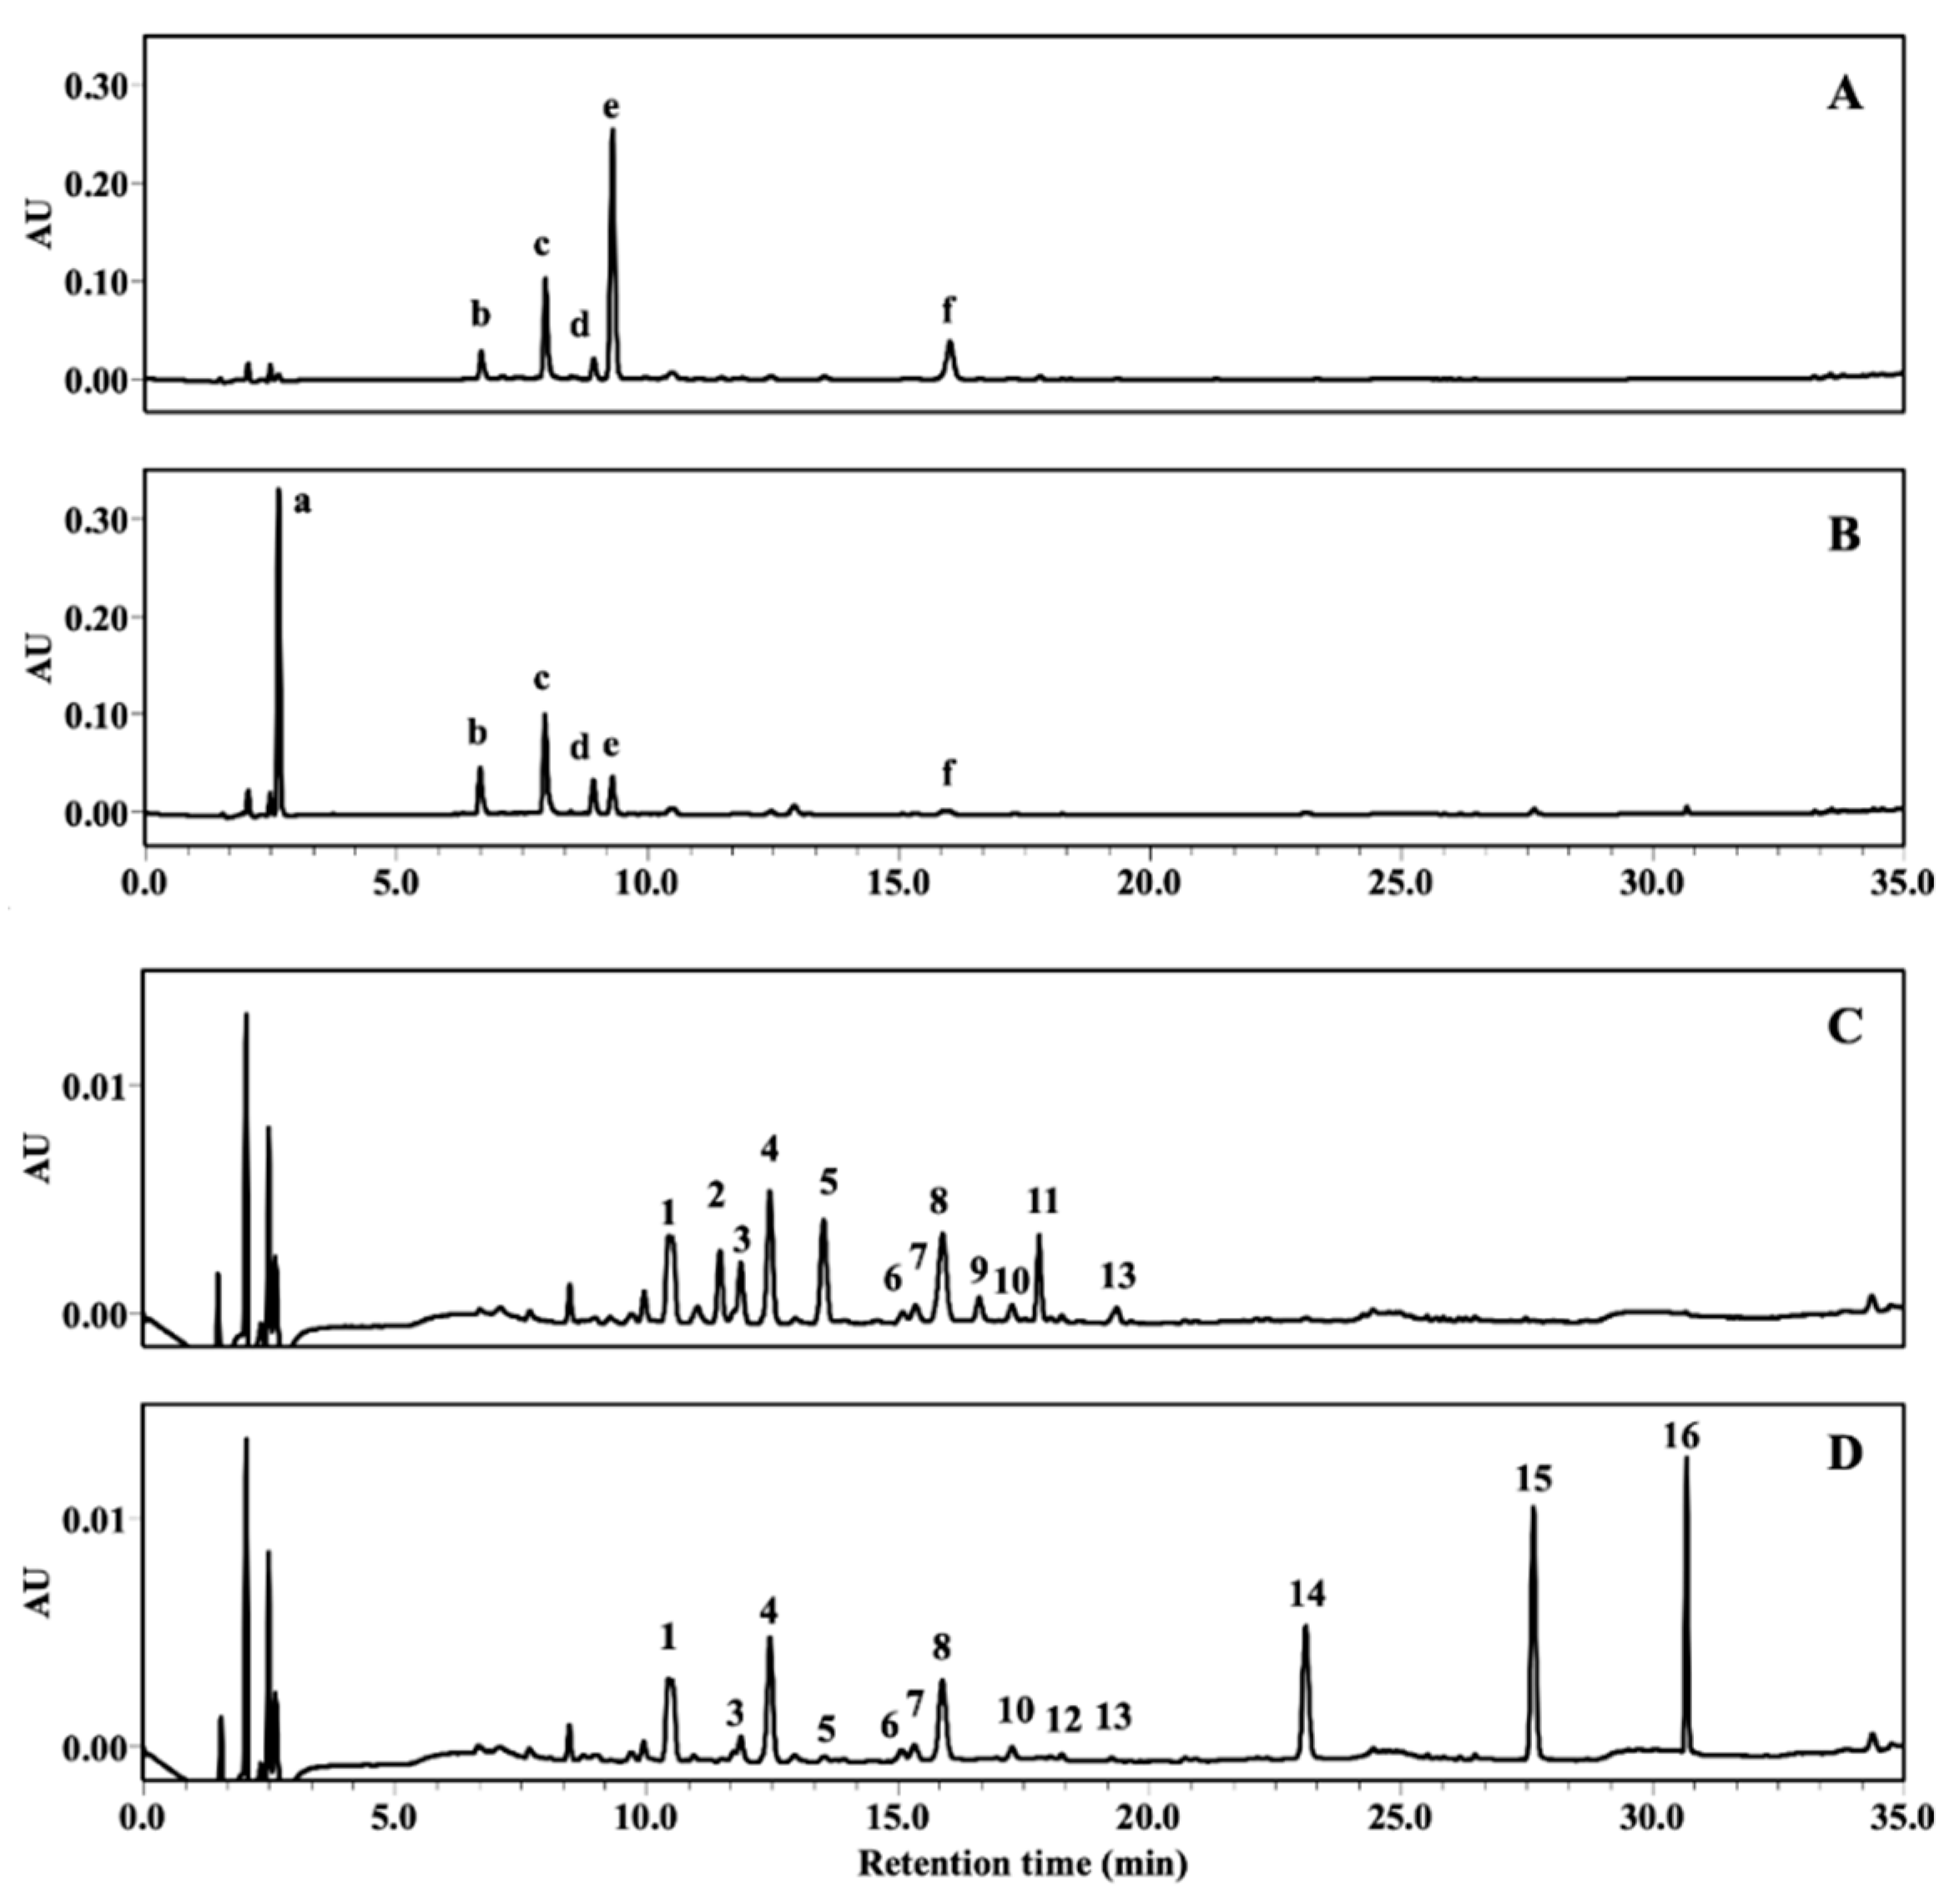
2.1. Composition Changes of GTE by Various Food–Grade Enzymes

The tested commercial food-grade enzymes exhibited various multi-functional activities (Table 1). Although all of the enzymes were derived from the broth of Aspergillus spp., the significant activities differed depending on the culture conditions. Nine types of glycosidase activities of the enzymes used in this study were determined (Table 1). The enzyme Peclyve ARA-NS (NS) showed the highest activity for arabinase (175 units/mL), Plantase-CF (CF) showed the highest activity for α-arabinofuranosidase (3406 units/g), Sumizyme-AC (AC) activity was highest for α-arabinopyranosidase (567 units/g) and β-mannosidase (130 units/g), Glucosidase-BT (BT) showed the greatest β-glucosidase (280 units/mL) activity, and Cellulase-KN (KN) had the highest α-rhamnosidase activity (245 units/g) (Table 1). Among the enzymes with multi-functional characteristics, only CF and Tannase KTFHR (TN) produced GA from GTE; these enzymes also produced decreased amounts of the gallated catechins (⎯)-epicatechin gallate (ECG) and EGCG (Figure 1B, Figure 2A, and Figure S1 in Supplementary Materials). GA is an indicator of tannin acyl hydrolase activity, which promotes the degalloylation of gallated catechins. Thus, except for CF and TN, none of the other enzymes cleaved the galloyl moiety of gallated catechins. The tannin acyl hydrolase activity of CF was lower than that of TN. However, among the eight enzymes, CF showed the best results for producing flavonol aglycone (Figure 1D, Figure 2B, and Table S1).
All enzymes exhibited glycoside hydrolase (GH; EC 3.2.1) activity. Although BT had the highest β-glucosidase activity, it could not produce any aglycones from the flavonol glycosides of GTE (Figure 2B and Table S2). CF and TN showed the most potent and second most potent activity of glycoside hydrolase to the flavonols of GTE, respectively. The other enzymes (i.e., AC, AN, BT, KN, and NS) showed weak glycoside hydrolase activity (Table S2) and did not produce aglycones of kaempferol glycosides.
Multivariate analysis indicated that only α-arabinofuranosidase activity had a significant main effect on the output of flavonol aglycones (Table S3). Activities of arabinofuranosidase and xylosidase were positively correlated (>0.9; Table S3) to the glycoside hydrolase activity on the cleavage of flavonol glycosides. Thus, reactions were performed with GTE solution by standard enzymes of arabinofuranosidase (40 °C, 50 mM of citrate phosphate buffer, and pH 4.0) and xylosidase (35 °C, 50 mM of Tris-HCl, and pH 7.5). However, no flavonol aglycone-producing activity was observed for the two standard enzymes. This result indirectly implies that these two activities do not co-exist in the same protein molecule and that the microorganism shows correlated expression of glycoside hydrolase protein with arabinofuranosidase.

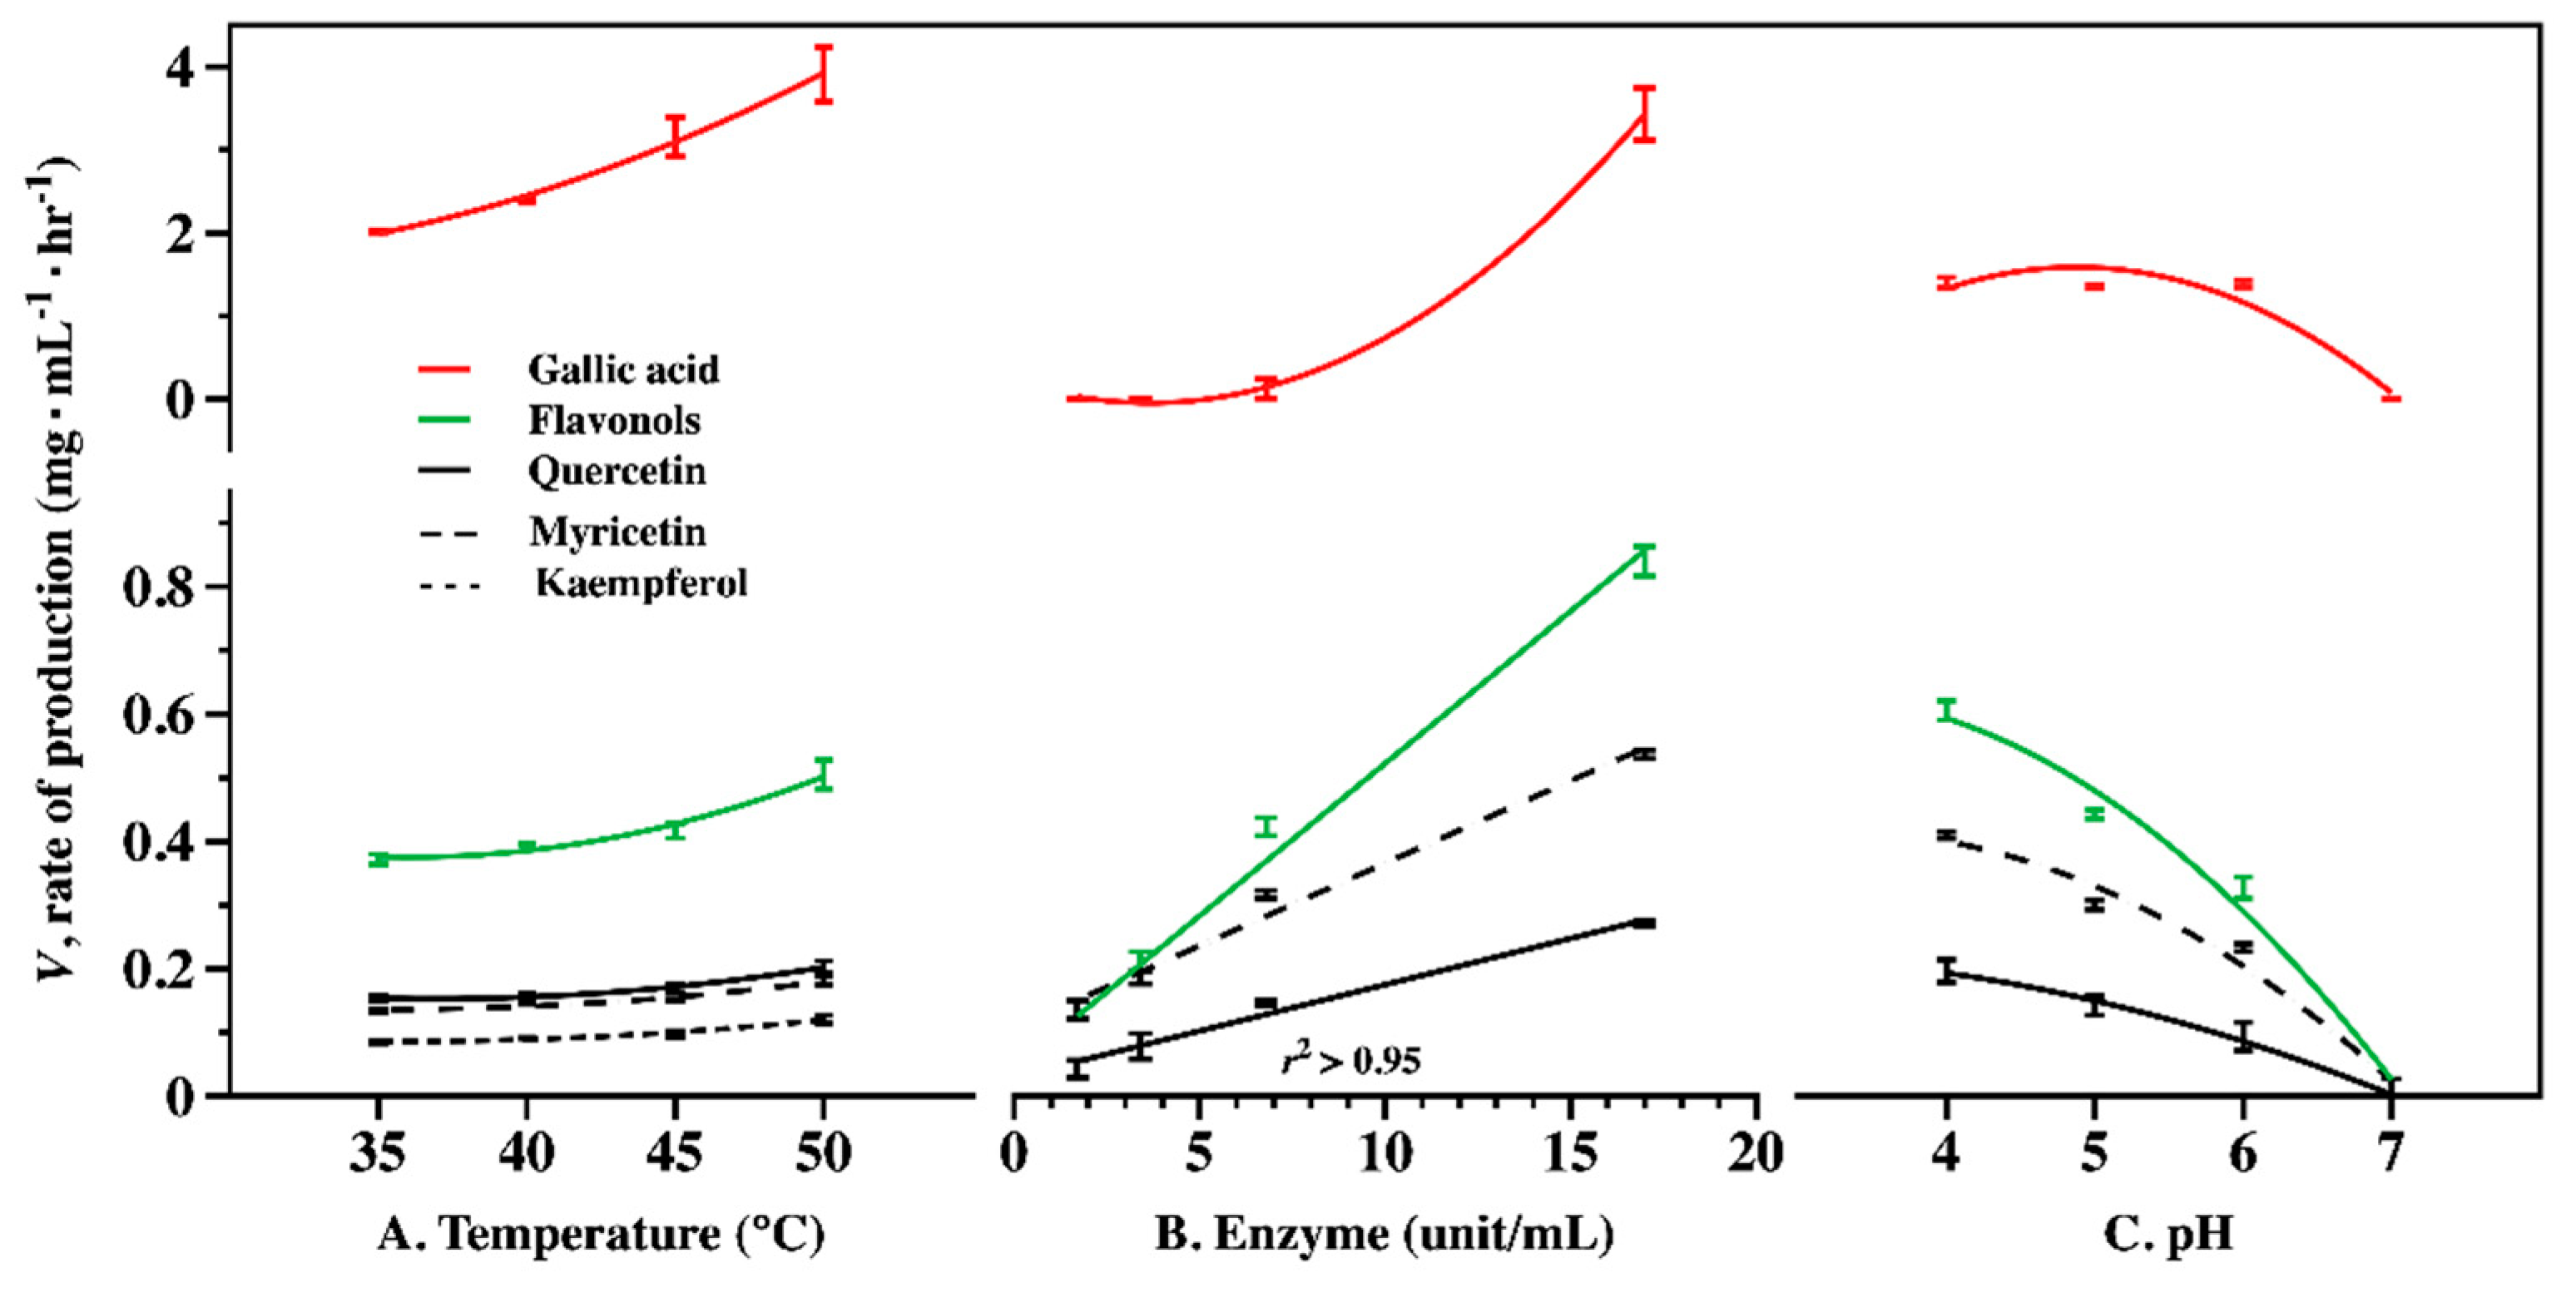
2.2. Optimum Condition of Enzyme CF for Producing Flavonol Aglycones and GA

Based on the above screen, enzyme CF showed the best reaction result among the eight enzymes evaluated. The optimum condition for the simultaneous production of flavonol aglycones and GA by the enzyme CF was determined to be 50 °C and pH 4.0 (Figure 3). The increment in flavonol and GA production with increasing temperature could be expressed by a first-order and second-order relationship, respectively. The amount of flavonol aglycones and GA almost doubled at 50 °C compared to that determined at the lower temperature condition (35 °C) (Figure 3A). The linear range of α-arabinofuranosidase activity in CF was determined at 2–15 units/mL of the enzyme (Figure 3B). The sensitivity to variations in pH was more drastic than that to temperature, and no significant reactions to gallated catechins and flavonols were obtained at pH 7.0 (Figure 3C).

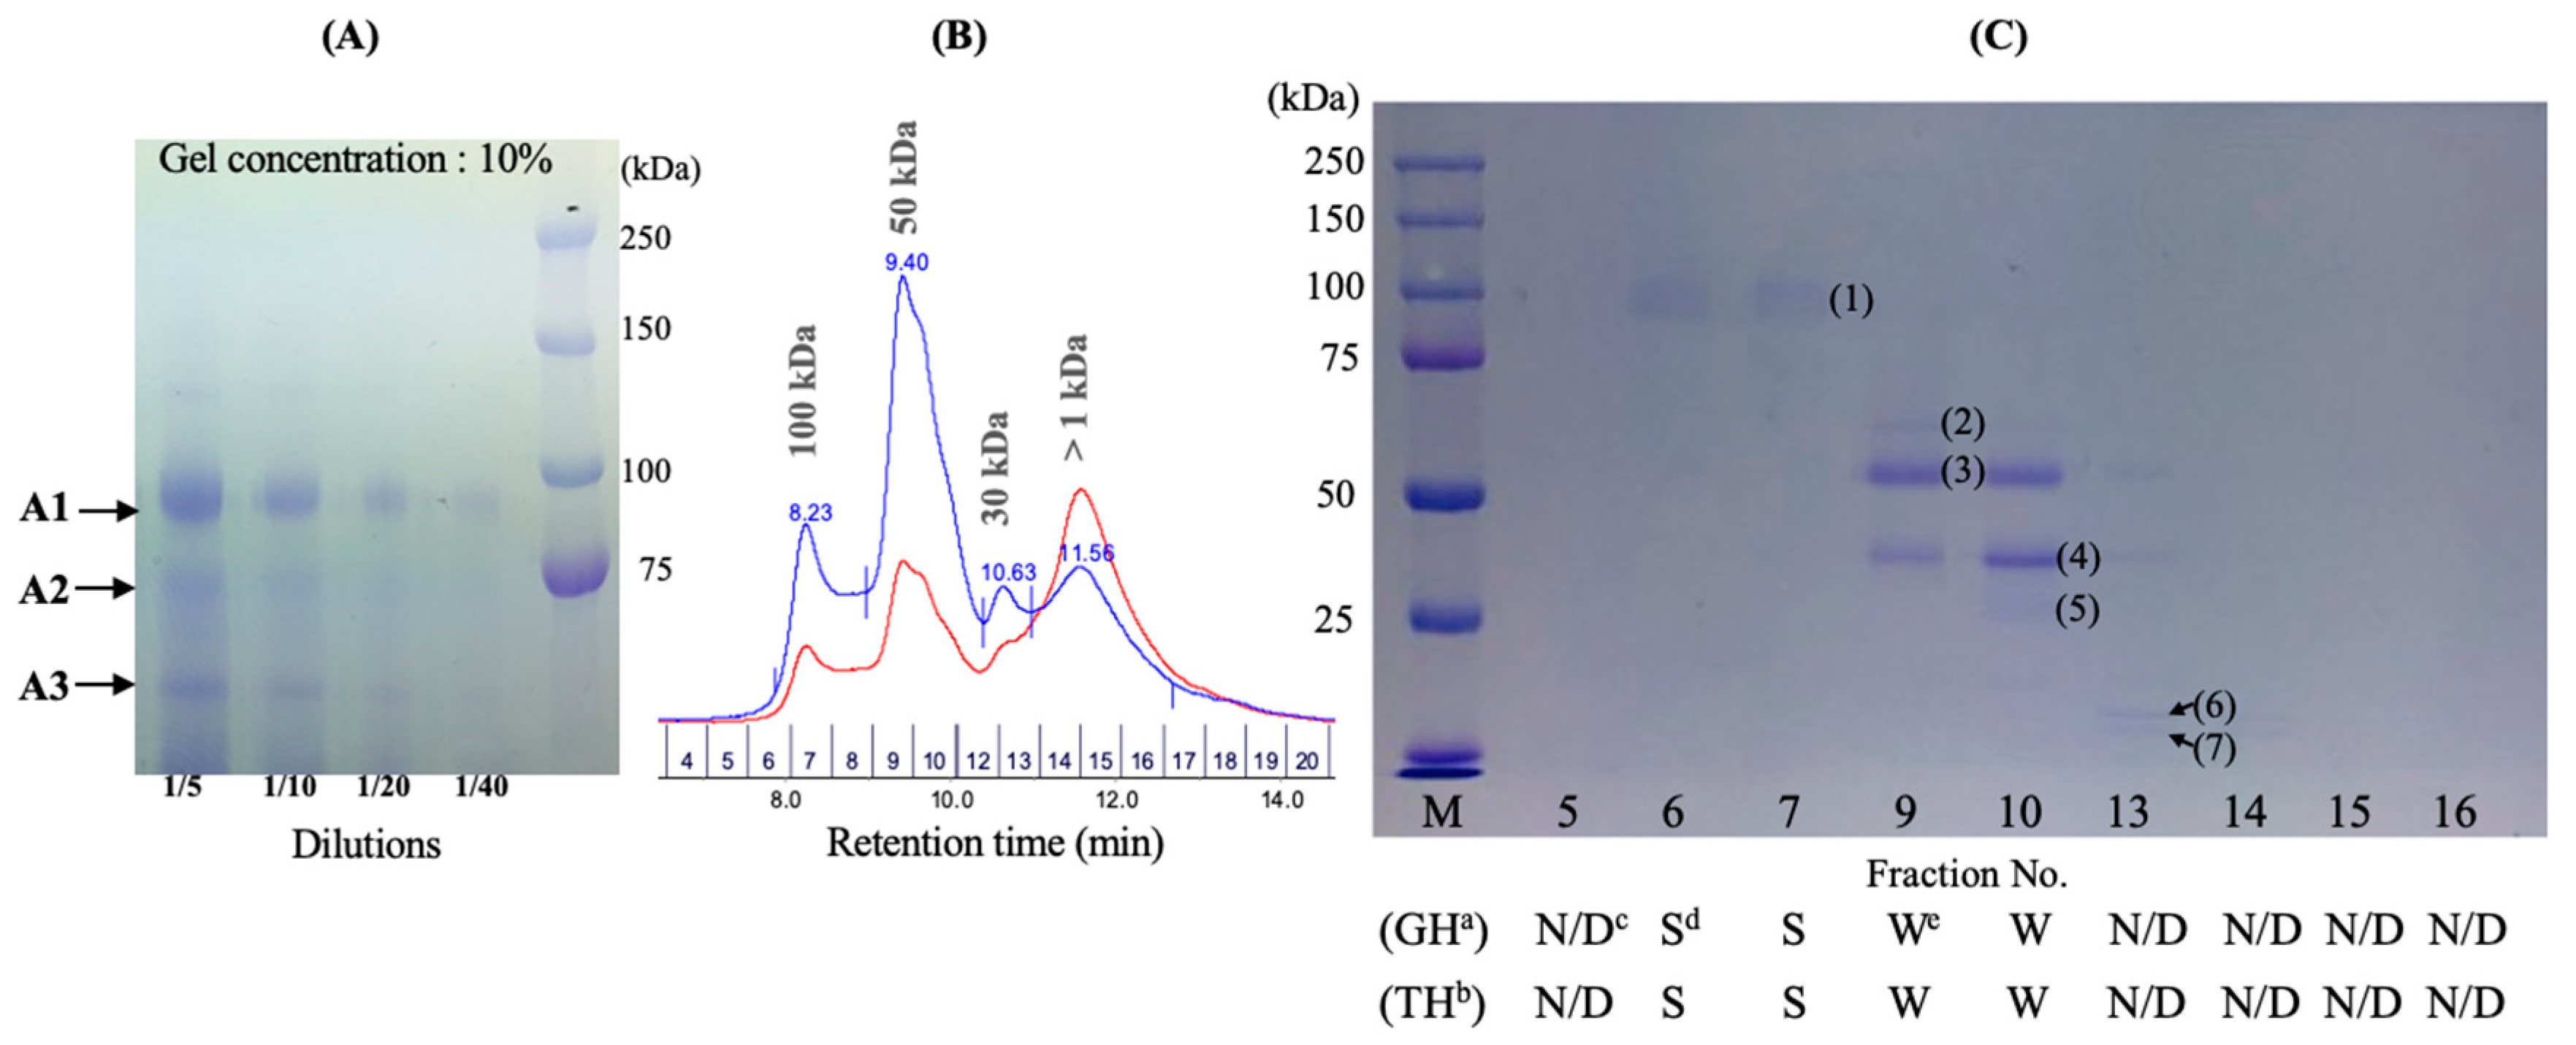
2.3. Investigation of Enzyme Activities by Fractionation

CF appears to harbor at least seven kinds of proteins, including A1 of approximately 80–100 kDa, A2 of 60–70 kDa, and A3 of 20–50 kDa (Figure 4A) are the major proteins. Fraction chromatography showed the approximate molecular weight of the CF. Four distinctive peaks were apparent, matching the sodium dodecyl sulfate–polyacrylamide gel electrophoresis (SDS-PAGE) result (Figure 4A). The size distribution of CF from the fast protein liquid chromatography (FPLC) was in the range of 1–100 kDa according to the size-exclusion column based on the manufacturer’s reference. The fractions No. 6 and No. 7 had strong simultaneous glycoside hydrolase and tannin acyl hydrolase activities, which sharply decreased in fraction Nos. 8–12, and these two activities were not detected in fraction Nos. 13–20 (Figure 4C). The first major peak of size-exclusion chromatography (SEC; Figure 4B), corresponding to fraction No. 6 and No. 7, revealed a protein of approximately 100 kDa and the second major peak of SEC, corresponding to fraction No. 9 and No. 10, revealed a protein of multiple sizes (approximately 30 and 50 kDa). The third major peak of SEC (tR = 11.56, corresponding to fraction Nos. 14–16 of Figure 4C) was determined to be a protein or peptides smaller than 1 kDa (Figure 4B). The enzyme fraction (A1 band of Figure 4A or fraction No. 6 and No. 7 of Figure 4C) of CF was considered to have multi-functional activities in a single protein.

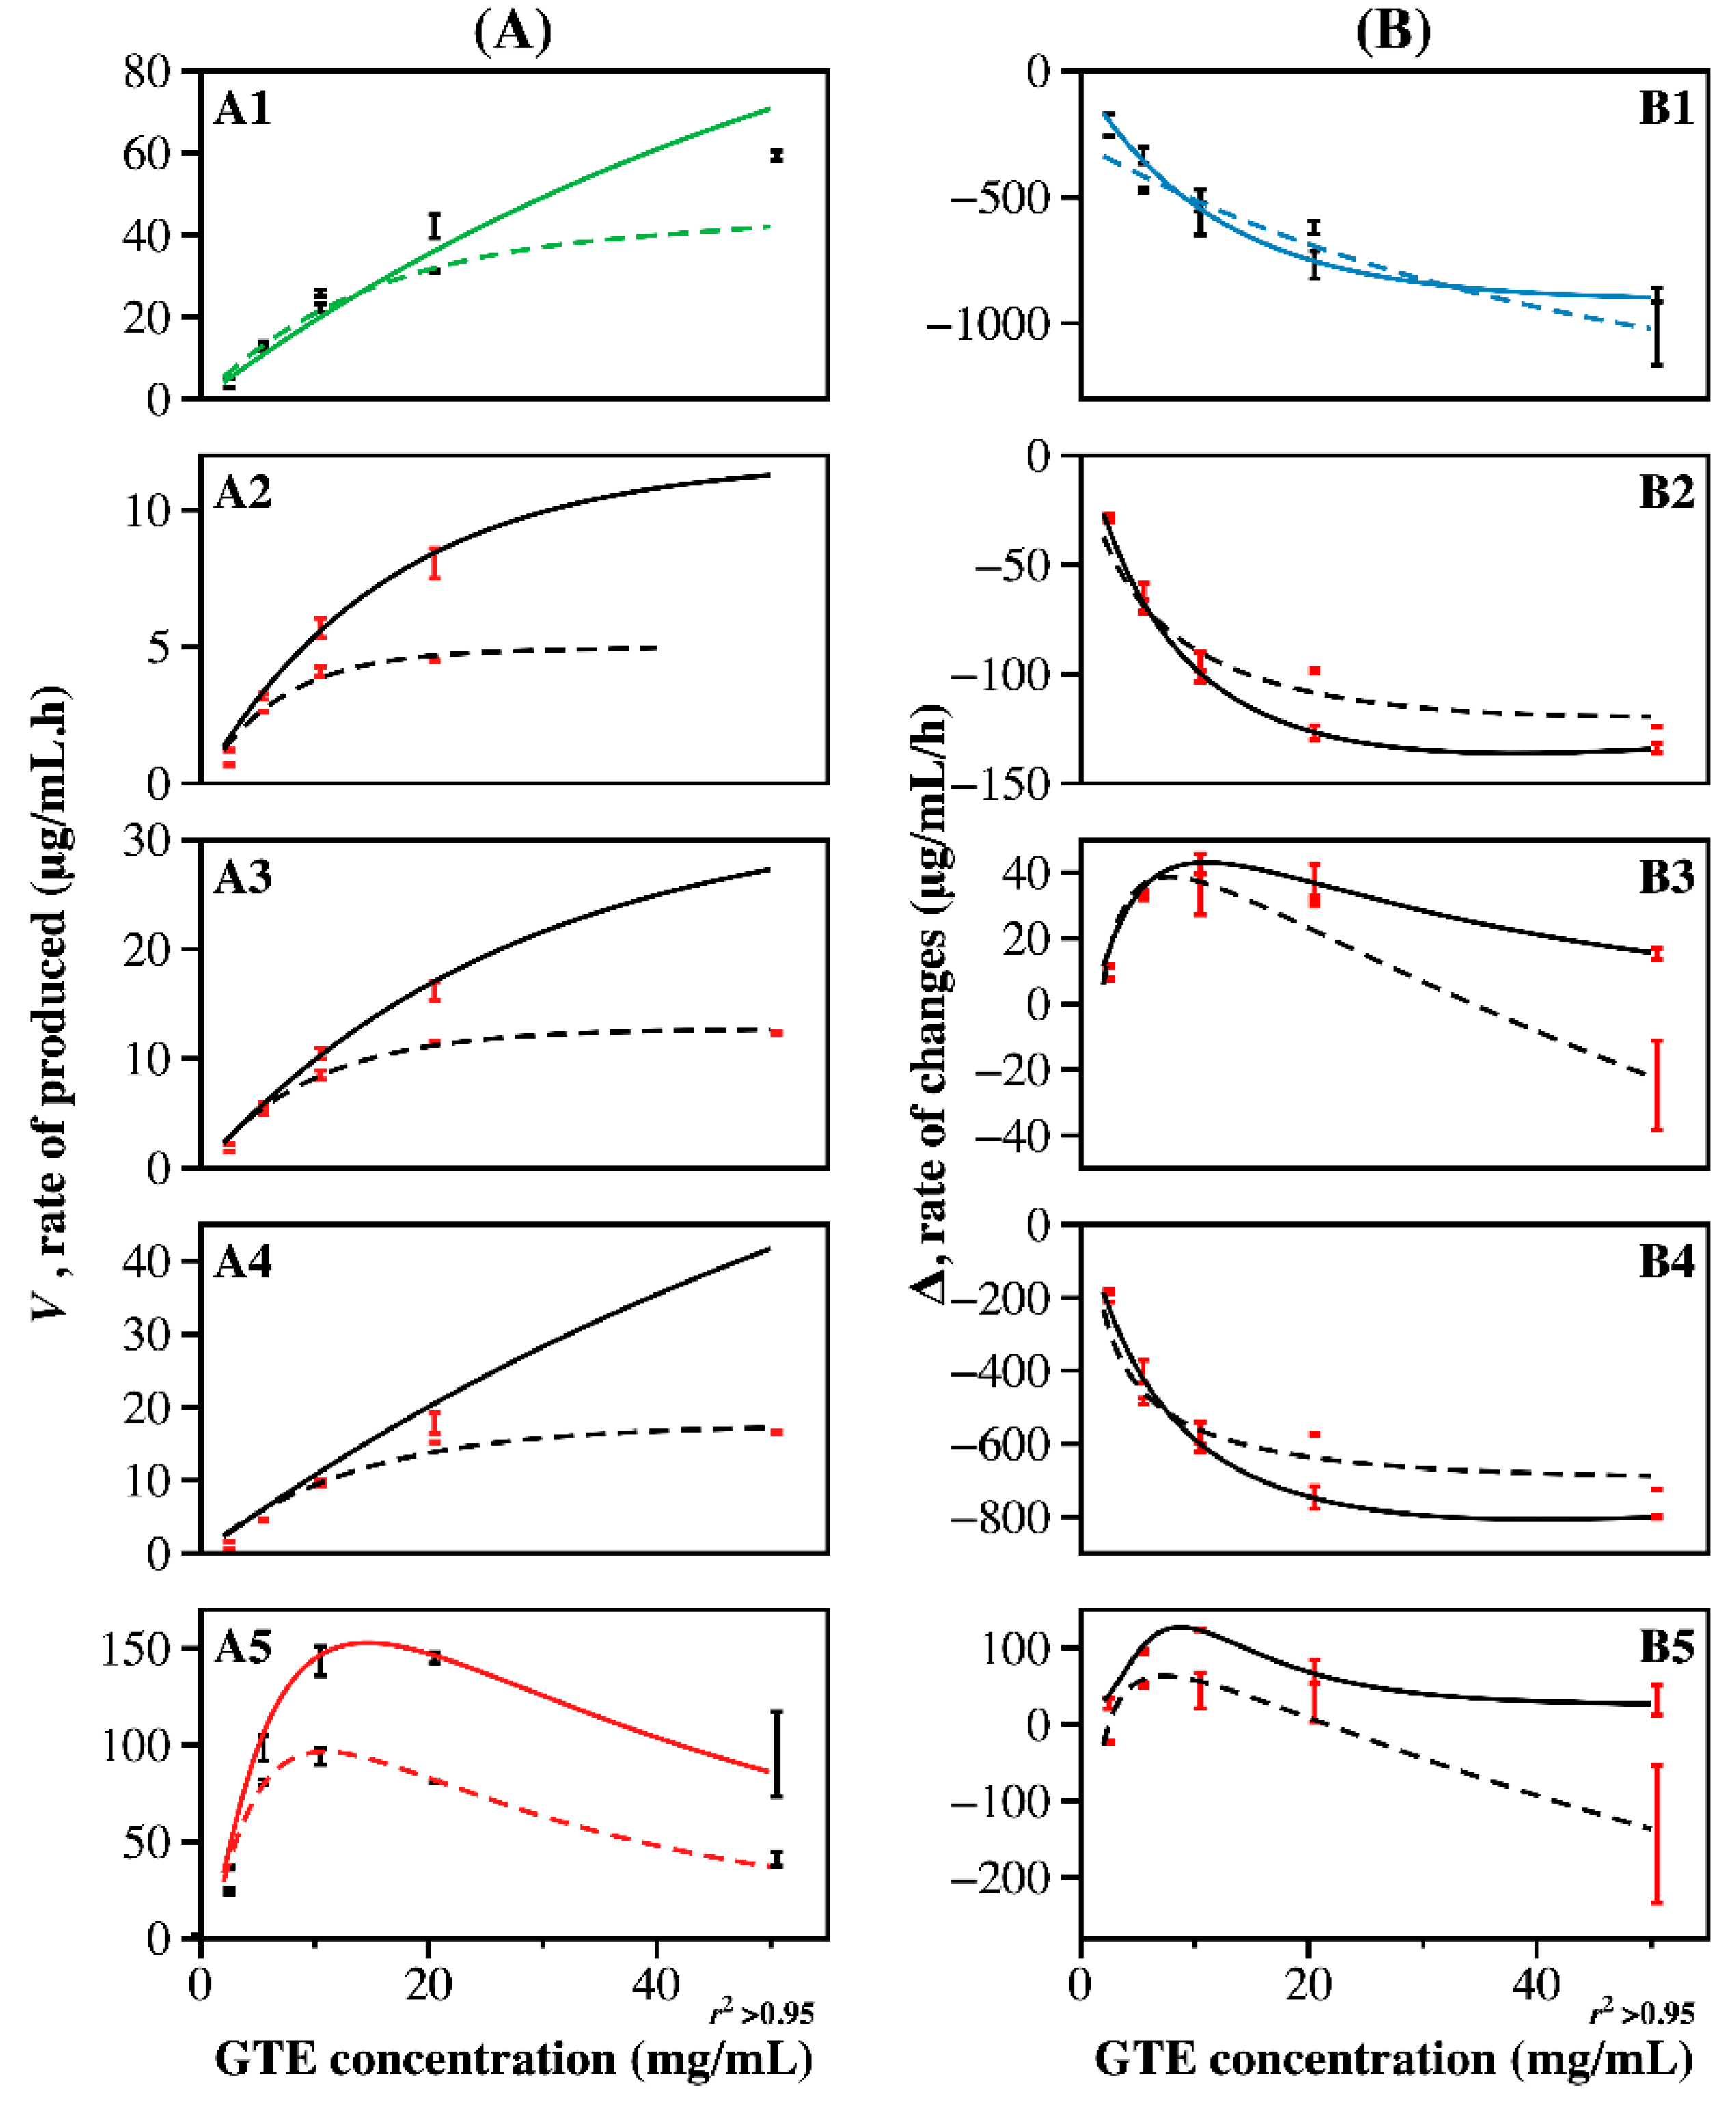
2.4. Kinetic Analysis of Enzyme CF for Producing Flavonol Aglycones

The tannin acyl hydrolase activity showed substrate inhibition profiles with a high concentration (> 20 mg/mL) of GTE (Figure 5A5), based on GA production. The amounts of ECG and EGCG in GTE decreased along an exponential decay pattern, with an increase in GTE concentration (Figure 5B2,B4, respectively); (⎯)-epicatechin (EC) and (⎯)-epigallocatechin (EGC) were produced or accumulated as a result of the cleavage of GA from EGCG and ECG (Figure 5B3,B5, respectively). Notably, the GH activity of CF to GTE conformed with a typical Michaelis-Menten plot of enzyme reaction.
Kinetic values were calculated from linear regression (Lineweaver–Burk (LB) and Hanes–Woof (HW) plots) and non-linear regression. LB and HW plots revealed that the proper range of substrate concentrations for calculating the kinetic values was 5–100 mg/mL and 2–180 mg/mL, respectively, with an acceptable fit (r2 > 0.95 and r2 > 0.97, respectively) for each flavonol aglycone. However, the fitting result of the LB plot (data not shown) was not as suitable as that of the HW plot. Furthermore, over-estimated kinetic values of HW were observed, in which the kinetic value of myricetin was considerably high. Therefore, we compared the kinetic values of non-linear regression. Total flavonol aglycones were produced at a 3.7-fold faster rate at 50 °C than at 35 °C (Table 2 and Figure S2). There were noticeable differences in the maximum velocity (Vm) for the production of myricetin glycosides compared to the two other flavonol aglycones from quercetin and kaempferol glycosides. Myricetin was produced with a Vm of 83 µg·mL−1∙h−1, while quercetin and kaempferol were produced with Vm values of 33 and 12 µg·mL−1∙h−1 at 50 °C, respectively. GA was produced with a Vm of 153 µg·mL−1∙h−1 at 50 °C and that of 95 µg·mL−1∙h−1 at 35 °C.
Myricetin was released five-fold faster with an increase in temperature from 35 °C to 50 °C, while quercetin and kaempferol were produced 2.6- and 2.6-fold faster at the higher temperature, respectively (Table 2). These results show that myricetin glycosides are more prone to breaking down to aglycone compared with quercetin and kaempferol glycosides, which may indicate a relatively simpler structure of myricetin glycosides so that they are more readily hydrolyzed by the enzyme. The Km values for producing myricetin, quercetin, and kaempferol were 46, 20, and 11 mg/mL at 50 °C, respectively. The higher value of Km was correlated to the Vm of corresponding flavonol aglycone. Similar to the differences of Vm values, the Km value of myricetin, quercetin, and kaempferol were 5.6-, 3.2-, and 2.7-fold higher at 50 °C than that of 35 °C, respectively. The Km values for GA production were lower than those for flavonol aglycone production, which indicated substantially faster hydrolysis activity at low GTE concentrations.

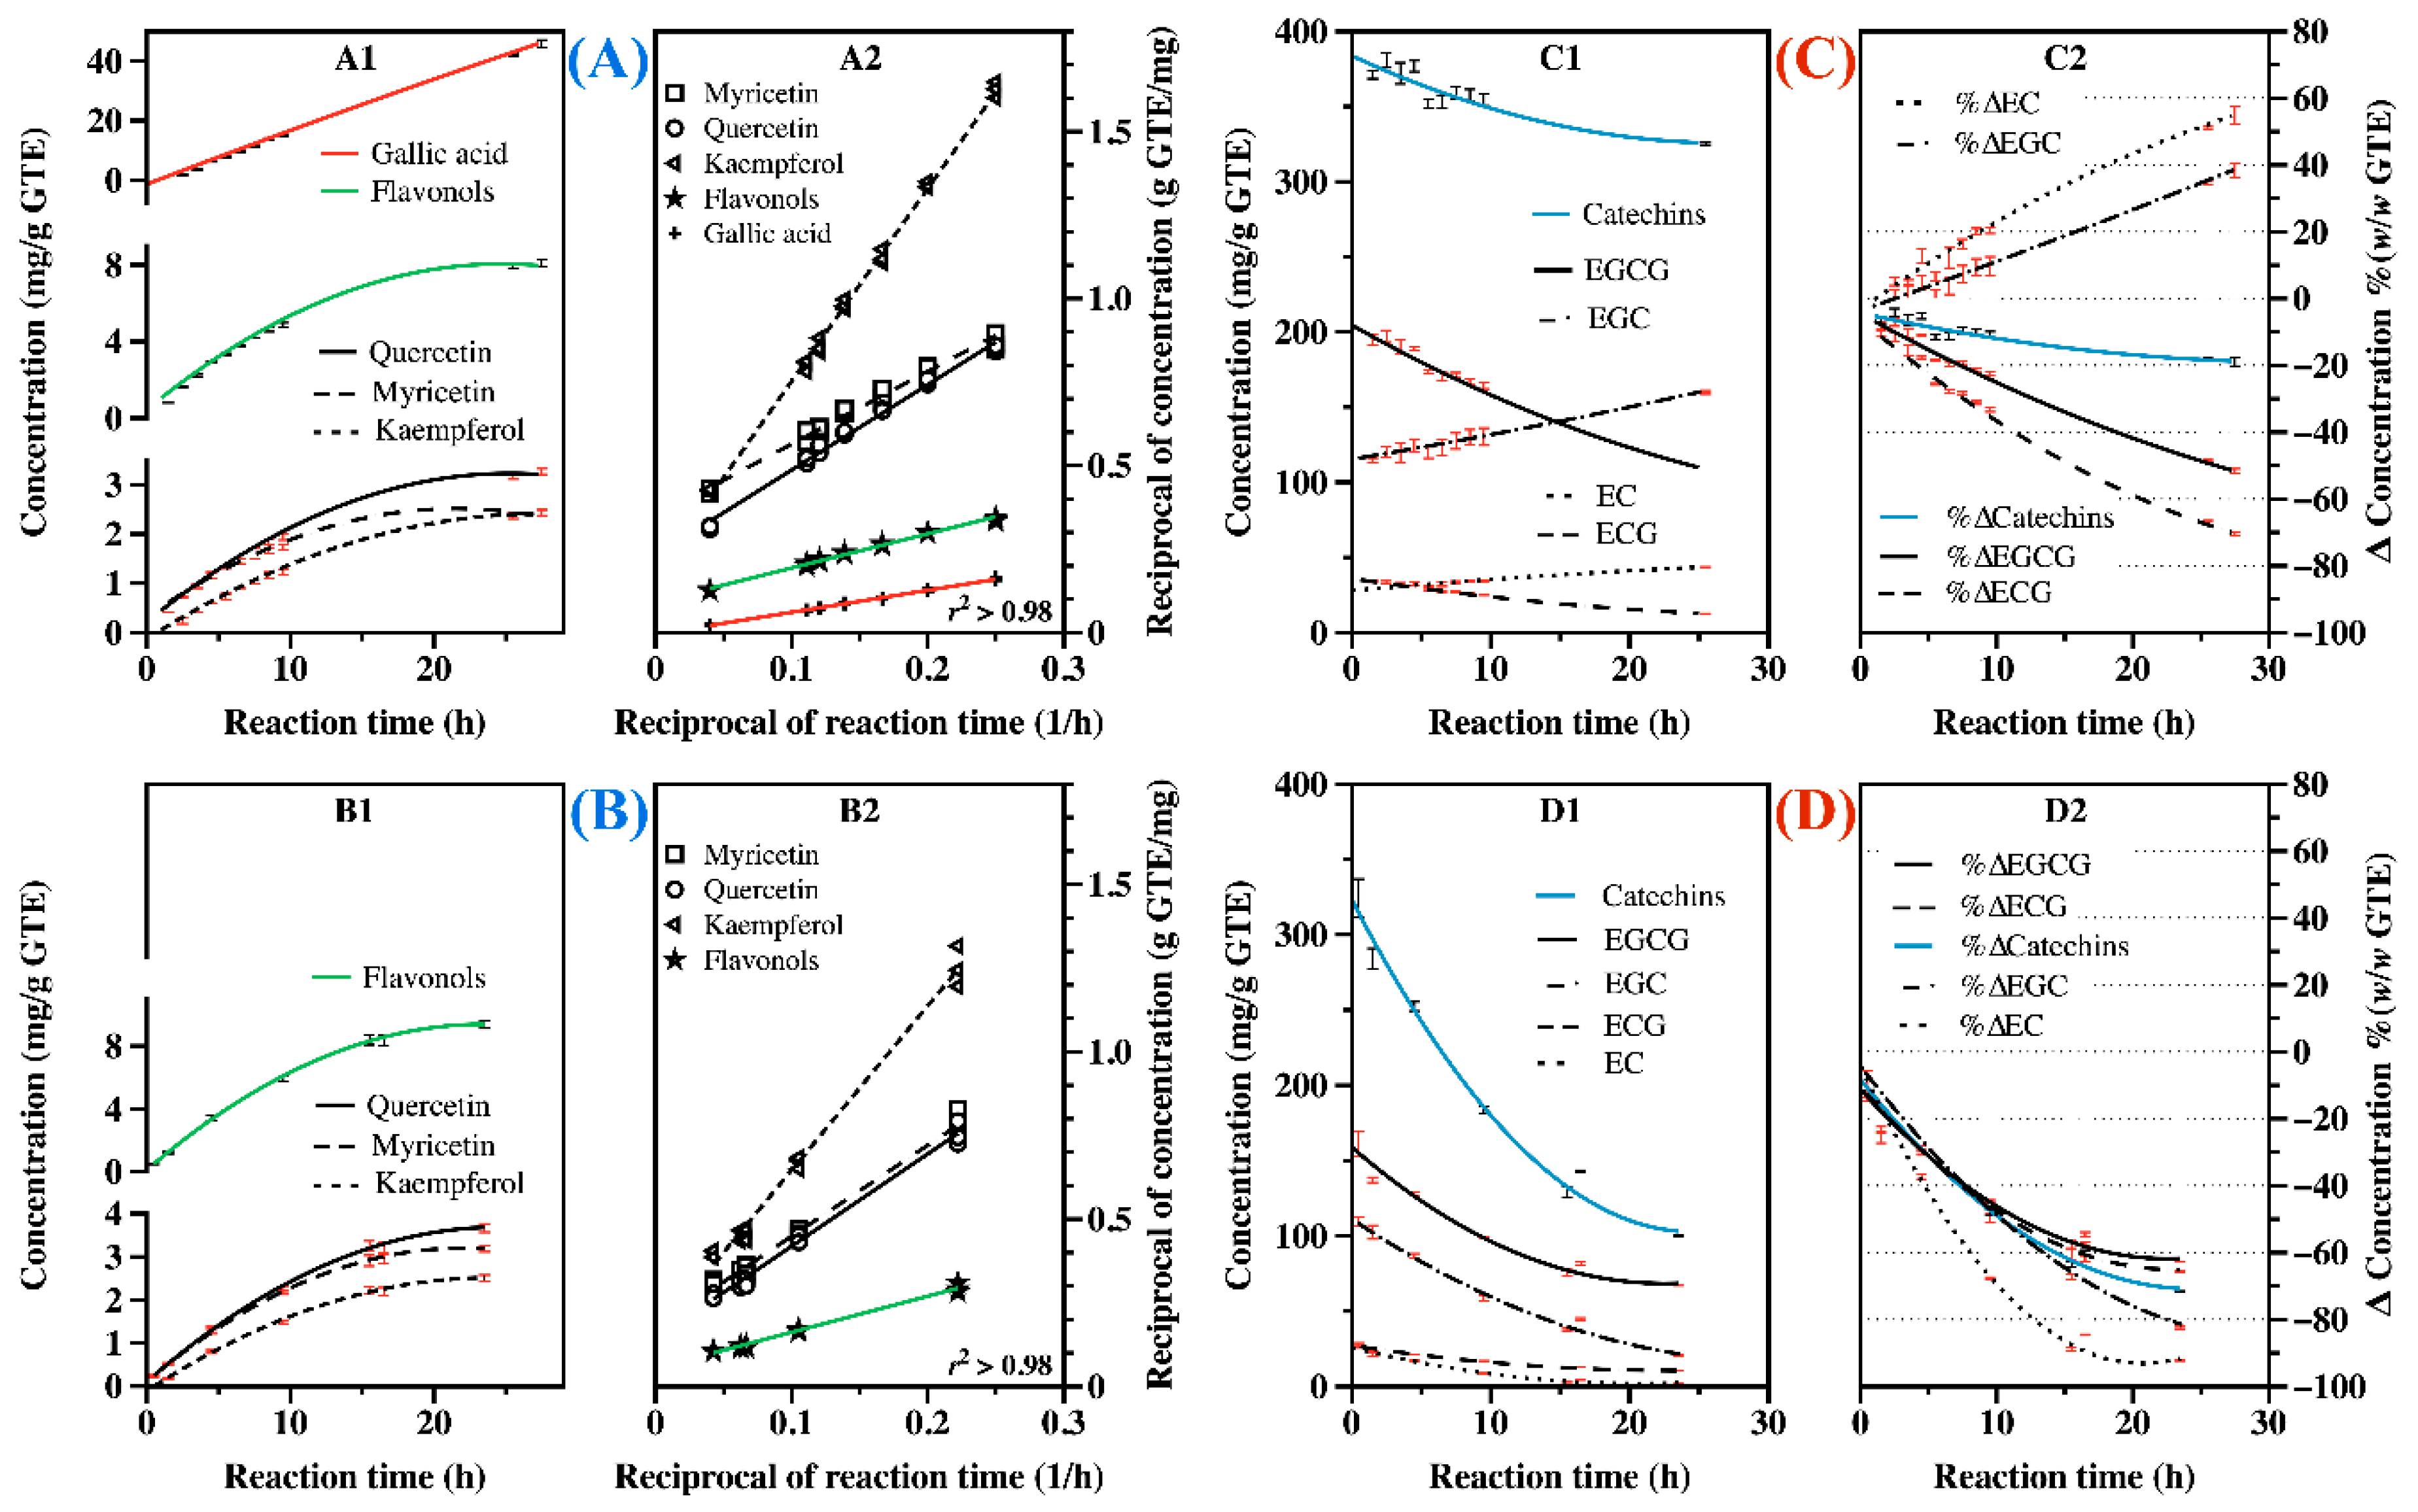
2.5. Hydrolysis of GTE in Enzymatic and Acid Hydrolysis Conditions

To demonstrate the effectiveness of the enzymatic hydrolysis of the flavonol glycosides and gallated catechins of GTE with enzyme CF, the enzymatic and acid hydrolysis reactions were compared regarding to the GH and tannin acyl hydrolase activities, respectively, in a time-course experiment. GA and flavonol aglycones were simultaneously produced with the enzymatic treatment of GTE, following a first-order reaction and second-order saturation plot, respectively (Figure 6A1). However, acid hydrolysis of GTE did not result in any GA production, whereas the production of flavonol aglycones followed a second-order saturation plot as observed with enzymatic treatment (Figure 6B1). The estimated maximum amounts of flavonol aglycones over time were 11.0 mg/g GTE and 18.9 mg/g GTE by enzymatic and acid hydrolysis, respectively. Furthermore, the half-time of producing the maximum flavonol aglycone concentration was estimated to be 11.2 h and 20.7 h by enzymatic and acid hydrolysis based on a double reciprocal plot as shown in Figure 6A1,B1, respectively. Enzymatic and acid hydrolysis of the flavonol glycosides of GTE resulted in a similar slope in the double-reciprocal plots (Figure 6A2,B2). These results suggest that the rates of producing flavonols with the enzyme are at least comparable, and probably considerably more effective, than those of acid hydrolysis. However, the degalloylation effect on the gallated catechins was quite different between the two treatments. EGC and EC accumulated, while EGCG and ECG decreased over time with the enzyme treatment, resulting in only a 20% loss of total initial catechins (Figure 6C1,C2). By contrast, the acid treatment caused overall losses of the total catechins, with a fairly large amount of loss for each catechin (>70% of the initial values). Taken together, these results demonstrate that acid hydrolysis is a simple way to obtain flavonol aglycones from GTE; however, it has drawbacks in maintaining the stability of catechins.
These findings provide useful information for manipulating GTE when a food-grade enzyme is utilized for the benefit of multi-functionalities. To obtain flavonol aglycones or obtain the hydrolysis benefits from GTE, a higher GTE concentration could deliver more flavonol aglycones with less overall catechin losses during the enzyme reaction (Figure 5 and Figure 6). Furthermore, this inhibition condition (high GTE concentration) could offer efficient molar or weight usage of the enzyme in the reaction, which minimizes the tannin acyl hydrolase activity to gallated catechins.

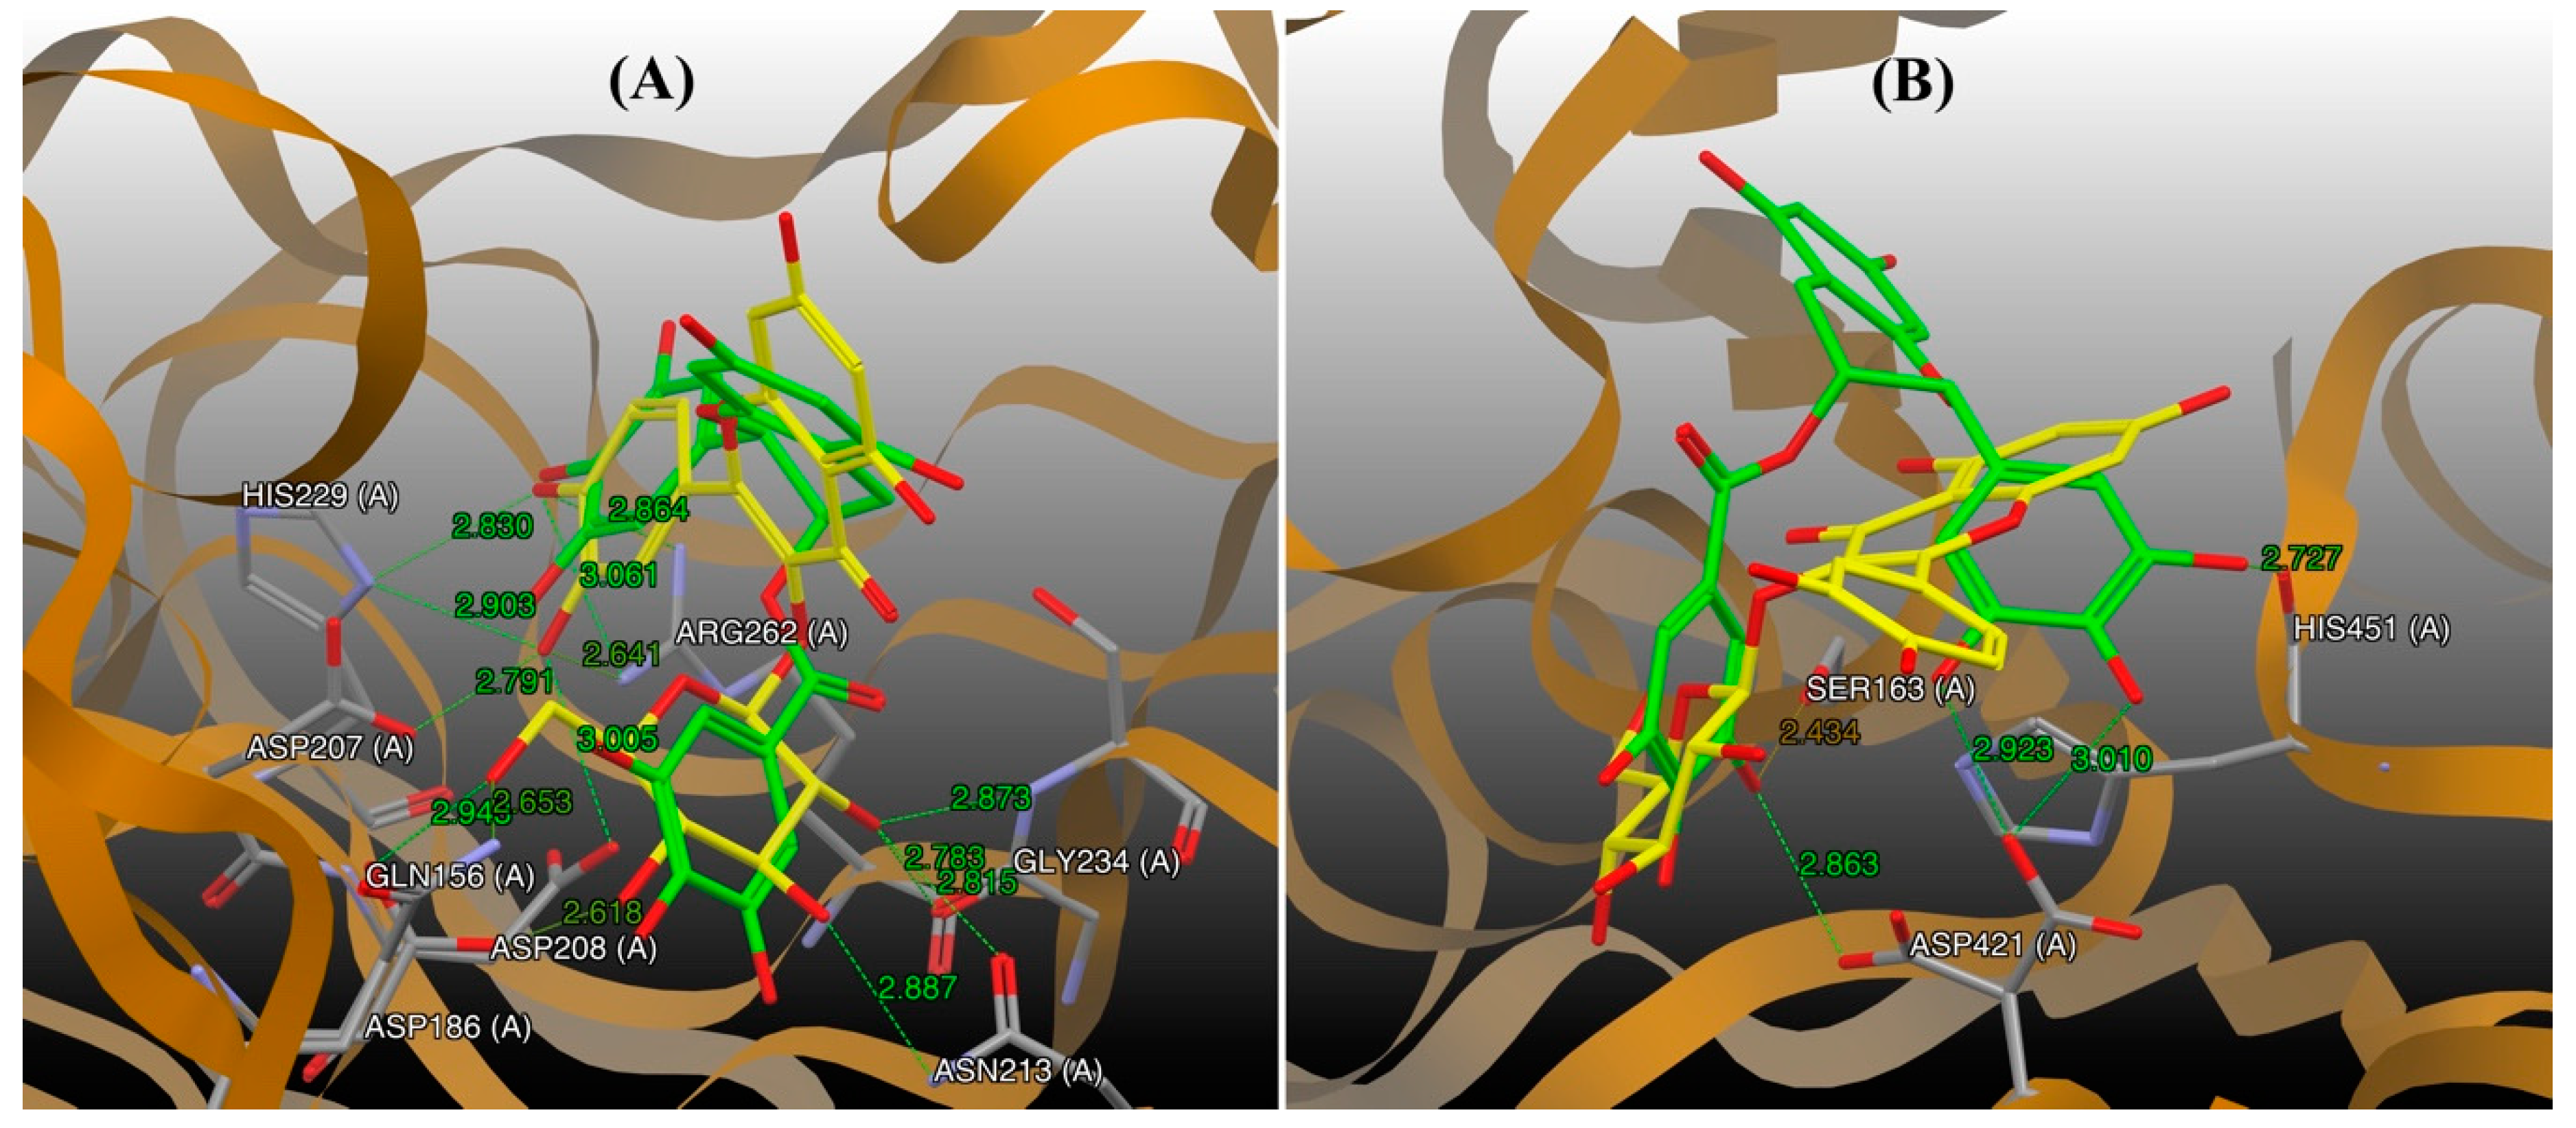
2.6. Rationale of the Enzymatic Reactions from Molecular Docking Simulation

The simultaneous hydrolysis of flavonol glycoside and gallated catechins (ECG and EGCG) was observed in the reaction of the enzyme CF and tannase, respectively. To demonstrate the rationale and possibilities of these phenomena, polygalacturonase, a class of the GH family derived from A. niger, and tannase derived from L. plantarum, were chosen to evaluate the ligand–protein interaction. Three representative residues (Asp186, Asp207, and Asp208) of the active site in polygalacturonase interacted with isoquercitrin as reported by van Pouderoyen et al. [31] (Figure 7A). Similar to isoquercitrin, EGCG fits into this active site via proper conformation, which provides a clue for the breakage of GA from EGCG by the action of the enzyme. One more simulation was conducted in the same way with tannase, which has six residues in the active sites of Ser163, Lys343, Glu357, Asp419, Asp421, and His451. As shown in Figure 7B, the GA moiety of EGCG interacts with Ser163 and Asp421, as reported by Ren et al. [32] In the case of isoquercitrin with tannase, a similar conformation of isoquercitrin in the active site is obtained, which indirectly indicates the possibility of hydrolysis of the glucose moiety of isoquercitrin. These docking simulations (refer to Table S4 for the result of the docking run) may provide insights into the simultaneous catalytic actions of the two enzymes used in our study, although the exact enzyme structures of enzyme CF and tannase from A. niger were not obtained.

3. Discussion

Glycoside hydrolases (GHs; EC 3.2.1) are a group of enzymes that hydrolyze the glycosidic bonds between carbohydrates or between a carbohydrate and a non-carbohydrate [33]. The GH family consists of 13 members (GH1–13), which can be used to obtain flavonol aglycones from the flavonol glycosides of GTE, and to obtain flavonol aglycones from the flavonol glycosides of GTE, such as α-amylase, cellulase, α-glucosidase, β-glucosidase, β-galactosidase, β-mannosidase, β-xylosidase, α-arabinofuranosidase, phlorizin hydrolase, exo-β-1,4-glucanase, glucan 1,4-β-glucosidase, glucan endo-1,6-β-glucosidase, cellulose β-1,4-cellobiosidase, and α-arabinopyranosidase. Hur et al. [18] summarized the multi-functional enzymes of lactic acid bacteria, fungi, and yeasts; they found that fungi are the richest sources of enzyme cocktails for treating food constituents, including amylase, cellulase, esterase, fucoidanase, glucoamylase, β-glycosidase, invertase, lipase, mannanase, pectinases, phytase, protease, tannase, β-xylosidase, and xylanase. Consequently, in our research, we evaluated food-grade enzyme cocktails derived from A. niger in order to find which were most effective at producing flavonol aglycones from GTE. We found that the enzyme CF is able to hydrolyze the flavonol glycosides to aglycones more effectively than the other seven GHs. Various methods for the use of GTE have been explored, including purification of EGCG, biotransformation of catechins to degallated catechins, encapsulation of catechins, and stabilization of catechins by adopting carriers [34]. Enzymatic treatments are generally used to obtain specific modifications of food materials, such as clarification of juice, saccharification of starch, removal of unwanted substances, and enhancement of flavor [35]. Accordingly, tannase, which cleaves the ester bonds in tannins and catalyzes the hydrolysis of the ester linkages between galloyl group-containing compounds such as ECG and EGCG, is the enzyme used most commonly to change the potential of GTE [36]. Lu and Chen [37] elucidated that tannase-treated GT contained 29 mg/g of GA (from 13% to 39%), 40 mg/g of EGC (from 30% to 54%), and 5 mg/g of EC (from 1.5% to 16%) after the hydrolysis reaction. In the present study, the content of GA, EC, and EGC in CF-treated GTE increased from 0 to 78.1 mg/g, 29 to 52 mg/g, and 130 to 224 mg/g, respectively (data not shown).
Furthermore, the enzyme CF displayed characteristics desirable in industrial application of enzymes for food processing, such as optimal reaction conditions in the mesothermal range (40–50 °C) and in moderately acidic conditions (pH 4) (Figure 3). These characteristics are advantageous, as they allow for the use of more cost-effective and environmentally friendly industrial processes.
The two different activities of enzyme CF may be due to a similarly-sized protein producing a single protein band or peak (Figure 4). Comparable results were identified by Matsumoto et al. [38], who found that a multi-functional GH showed α-arabinofuranosidase, β-glucosidase, and β-xylosidase activities with a single protein band determined by SDS-PAGE analysis. However, in our study, the protein band of fraction No. 6 and No. 7 in Figure 4C was relatively broad; thereby, further study is needed to reveal the exact molecular weight or size of proteins that could alternatively be responsible for these different activities.
Some tannases show a substrate inhibition characteristic while others do not; this variation has been largely attributed differences in the sources from which the tannases are derived [39]. Interestingly, enzyme CF showed substrate inhibition kinetics for GA production along with normal Michaelis-Menten kinetics for flavonol aglycones production. This contrasting result may be useful for the industrial processing of GTE, as flavonol aglycone may be obtained with less GA production in settings with high GTE concentration (Figure 5).
Acid hydrolysis is non-specific and cheaper process in raw food material processing. However, the reaction solution must be neutralized with a base, resulting in the production of large quantities of salt byproducts and have high salt removal costs. Consequently, enzymatic treatment is a more preferable option for the production of high-value food supplements. We found that CF treatment can obtain an amount of flavonol aglycones comparable to that obtained via acid hydrolysis. However, GA was not produced in the HCl treatment, while the CF treatment of GTE produced approximately 4% (w/w) of GA (Figure 6). Moreover, during acid hydrolysis, the non-specific and strong hydrolytic action of HCl resulted in the disappearance of approximately 70% (w/w) of the catechins that had been generated (Figure 6). Therefore, for applications in which minimal loss of catechins is desirable, such as the production of GTE food supplements, enzymatic processing with CF is a preferable to acid hydrolysis for the production of flavonol aglycones from GTE. As increased GA content improves the radical scavenging effects of GTE [22], and beneficial dietary flavonols are best absorbed as aglycones [24], our research on the enzyme CF for producing flavonol aglycones from GT might potentially deliver useful information in processing application and beneficial advantage in human health.
A study of the crystal structure of an enzyme is relatively difficult to obtain and requires the enzyme to be isolated and highly purified. Consequently, we focused on food-grade enzymes that were good candidates for potential use on an industrial scale. As illustrated in Figure 7, similar enzymes derived from the same microorganism often have similar active site residues, although some subunits differ. We believe that such an approach provides useful insight into the catalytic action of the enzyme CF. The docking results indicate that the glucose moiety of isoquercitrin and the GA moiety of EGCG are correctly positioned in the active site of enzyme CF (Figure 7A). The hydrolytic action may occur in a similar way as the moieties of the two compounds interacting with the representative residues of active site.

4. Materials and Methods

4.1. Chemicals and Enzymes

Quercetin, kaempferol, and dimethyl sulfoxide (DMSO) were purchased from Sigma-Aldrich Co., LLC (St. Louis, MO, USA). Formic acid, acetonitrile, and methanol were purchased from Fisher Scientific (Waltham, MA, USA). Water for high-performance liquid chromatography (HPLC) was purchased from Burdick & Jackson (Muskegon, MI, USA). Myricetin was purchased from Extrasynthese (Genay, France). EC, EGC, EGCG, and ECG were purchased from Wako Pure Chemicals Industries, Ltd. (Osaka, Japan). Nitrophenol, 4-nitrophenyl-α-arabinofuranoside, 4-nitrophenyl-α-arabinopyranoside, 2-nitrophenyl-β-D-galactopyranoside, 4-nitrophenyl-β-D-xylopyranoside, 4-nitrophenyl-β-D-mannopyranoside, α-arabinofuranosidase, α-arabinopyranosidase, β-galactosidase, β-xylosidase, and β-mannosidase were purchased from Megazyme (Bray, Ireland). All commercial enzymes were supplied from Bision Corp. (Seoul, Korea). All other chemicals used were of analytical grade or higher.

4.2. Preparation of GTE

GTE was prepared according to the method described by Rha et al. [30]. Briefly, GT (Osulloc Farm Corp., Seogwipo, Republic of Korea) was harvested from May–June, 2017, and then processed into a loose tea. To obtain GTE, the dried GT was soaked in a 10-fold weight of 70% (v/v) aqueous ethanol for 3 h at 60 °C with stirring; the solvent in the extract was then removed under vacuum condition before being pulverized by spray dryer (Seogang Engineering, Cheonan, Korea). The powered GTE was used in all subsequent experiments as the substrate for the test enzymes.

4.3. Assay of Multi-Functional Activities of Food-Grade Enzymes

The enzyme activities were measured according to the corresponding universal method as described in Appendix A.

4.4. Screening of Food-Grade Enzymes for Producing Flavonol Aglycones from GTE

To find the most suitable enzyme for food-grade commercial-scale purposes, we screened the activities of eight cellulolytic enzymes. The reaction conditions are described in Table 1. The reaction was performed in a 1-mL microtube in a thermomixer (500 rpm; Eppendorf AG, Hamburg, Germany) for 2 h with a sufficient amount of enzyme (100 mg/mL) and substrate (100 mg/mL of GTE). After the reaction, 500 µL of 10% (v/v) DMSO in absolute methanol was added to halt the enzyme activity and to fully recover the flavonol aglycones produced therein. The mixture was sonicated for 20 min and properly diluted (1.0 mg/mL) for quantitative analysis. The screening criterion was the total amount of flavonols, including myricetin, quercetin, and kaempferol, produced. The statistical correlation between the amount of flavonol created and individual activity of the multi-functional enzyme was analyzed by JMP 12 for Windows 7 or higher (SAS Institute Inc., Cary, NC, USA).

4.5. Investigation of Optimal Enzymatic Conditions for Producing Flavonol Aglycones and GA from GTE

Enzyme CF was reacted with the GTE solution (100 mg/mL in 50 mM of citrate phosphate buffer; pH 5.0) and 3 units/mL of the enzyme at 35, 40, 45, and 50 °C for 4 h. A linear range of enzyme units was tested with 100 mg/mL of GTE in 50 mM of citrate phosphate buffer (pH 5.0) for 2 h. The optimal pH for the enzyme reaction was investigated using 100 mg/mL of GTE, 10 units/mL of the enzyme (based on the activity of α-arabinofuranosidase) at 50 °C for 2 h by varying the pH in the range of 4.0–7.0 with 50 mM of citrate phosphate buffer.

4.6. Size Distribution, Separation, and Determination of the Core Activities of CF

SDS-PAGE was performed with 10% (w/w) agarose gel to determine the size distribution of CF with reference to a size marker (25–250 kDa). The separation was performed using SEC with an Agilent Bio SEC-5 (300 Å, 5 µm, 7.8 × 300 mm; Santa Clara, CA, USA) column to determine which fraction of CF showed GH (deglycosylation) activity or tannin acyl hydrolase (degalloylation) activity on GT flavonols. The CF solution (10 mg/mL) was prepared with 50 mM of citrate phosphate buffer (pH 5.0), and then, 25 µL of the solution was injected into the column. The elution buffer was 50 mM citrate phosphate (pH 5.0), and the flow rate was 1.0 mL/min. The fractions were collected every 0.5 mL after injection by fast protein liquid chromatography (ÄKTA purifier 10; GE Healthcare, Stockholm, Sweden). Each fraction was mixed with 0.5 mL of the GTE solution (2.0 mg/mL) in 50 mM of citrate phosphate buffer (pH 5.0) and then reacted for 24 h at 45 °C in a thermoshaker (Eppendorf AG). The reaction results were analyzed by HPLC as described below. To confirm the molecular weight and size distribution of the fraction obtained by SEC, the fractions were loaded on a 10% (w/w) SDS-PAGE gel.

4.7. Kinetic Analysis of CF for Producing Flavonol Aglycones

The stock substrate solution (200 mg GTE/mL) was prepared with 50 mM of citrate phosphate buffer (pH 4.0), and the enzymatic reactions were performed with 2–180 mg of GTE/mL buffer and 10 units/mL for 2 h in a thermoshaker (Eppendorf AG). The test temperatures were 35 °C and 50 °C. The same volume of 10% (v/v) DMSO in aqueous methanol was mixed in the reacted solution, followed by sonication for 20 min. After that, the mixture was filtered through a 0.45-µm GH Polypro syringe filter (Pall Corp, Port Washington, NY, USA) before HPLC analysis.

4.8. Time-Course of Enzyme CF and Hydrochloride Hydrolysis of GTE for Producing Flavonol Aglycones

To perform hydrochloride hydrolysis, 250 µL of GTE solution (200 mg/mL) was mixed with 250 µL of 6 N hydrochloride, and the reaction was maintained at 30 °C. To neutralize the acidic solution, 250 µL of 6 M sodium hydroxide was mixed in at the end of the reaction and then properly diluted with 10% (v/v) DMSO in absolute methanol. The temperature (35 °C) of enzymatic treatment was chosen to minimize GA production with 100 mg/mL of GTE and 100 mg/mL of the enzyme in 50 mM of citrate phosphate buffer at pH 4.0. The results were collected from 0 to 30 h during the reaction and quantified by HPLC.

4.9. HPLC Analysis of Catechins and Flavonols

For analysis of catechins, GA, caffeine, and flavonols, the reaction mixtures were diluted with 10% (v/v) DMSO in absolute methanol, sonicated for 20 min, and then filtered through a 0.45-μm GH Polypro syringe filter (Pall Corp.). The analytes were then analyzed by an Alliance HPLC system (Waters, Milford, MA, USA) with a Poroshell 120 SB octadecyl silica column (120 Å, 2.7 μm, 4.6 × 150 mm; Agilent). The column temperature was 30°C, and the injection volume was 5 μL. Peaks were monitored at 275 nm for catechins, GA, and caffeine, and at 365 nm for flavonols. Gradient elution was performed with 0.1% (v/v) formic acid in water (solvent A) and 0.1% (v/v) formic acid in acetonitrile (solvent B). All solvents were filtered and degassed. The flow rate was 0.8 mL/min. The linear gradient of the binary mobile phases was as follows: 92% A/8% B at 0 min, 92% A/8% B at 2 min, 88% A/12% B at 3 min, 84% A/16% B at 4 min, 84% A/16% B at 15 min, 80% A/20% B at 18 min, 76% A/24% B at 21 min, 70% A/30% B at 22 min, 70% A/30% B at 26 min, 50% A/50% B at 28 min, 50% A/50% B at 30 min, 20% A/80% B at 32 min, 20% A/80% B at 33 min, 92% A/8% B at 34 min, and 92% A/8% B at 35 min.

4.10. Molecular Docking Simulations

Molecular dynamics was conducted according to the method described by Jones et al. [40] with modifications. GOLD v5.7.2 (Genetic Optimisation for Ligand Docking; the Cambridge Crystallographic Data Centre, Cambridge, UK) for Windows 10 was used for modeling the enzymes and ligand interactions. The coordinates of GH (polygalacturonase from A. niger; Protein Data Bank (PDB) code: 1NHC) and tannase (tannin acyl hydrolase from Lactobacillus plantarum; PDB code: 4J0C) were obtained from the PDB, and the tertiary data for isoquercitrin and EGCG were obtained from the PubChem website (NIH, Bethesda, MD, USA). The PDB files were manipulated by eliminating the water and ligand records using the program GOLD. The coordinates (x × y × z) of the grid were 25 × 38 × –15 and 20 × 95 × 72 for GH and tannase, respectively. The protein residues located in the active site were considered in a space less than 10 Å wide. The ChemPLP fitness function of GOLD was applied to obtain a suitable conformation of ligand-protein binding. The genetic algorithm was employed with the slow searching option. One conformation that provided the highest scoring was chosen among 10 estimations, and then, a graphical calculation was performed for hydrogen bonds between protein residues and ligand. The docking results are listed Table S4.

4.11. Statistical Analysis

Data are expressed as the means ± standard error of the mean of three replicates. One-way analysis of variance was carried out and assessed at a significance level of α = 0.05 using JMP 12 to evaluate the significance of differences among the means.

5. Conclusions

In this study, we screened a single food-grade enzyme cocktail to assess its use for increasing the benefits of flavonols during digestion of GTE. Among various food-grade enzymes originating from fungal culture, the enzyme CF with multi-functional activity showed specificity for effectively cleaving various glycosidic linkages such as 3-O-glucosides, 3-O-galactosides, and 3-O-glucosylrutinosides. Moreover, CF showed potent activity on gallated catechins, resulting in GA and degalloylated catechin. The optimum conditions for these two major activities were similar, but tannase activity was inhibited by high substrate (GTE) concentrations. These results may provide useful guidance for controlling the compositions of catechins and flavonol glycosides in GT by enzymatic treatment. We suggest that, compared to acid treatment, this enzymatic treatment for producing flavonol aglycones from GTE is safer, more effective, more convenient, and more environmentally–friendly, and also provides value-added GTE for food fortification or as dietary supplements. Ultimately, this study suggests that a GH enzyme should be selected to best utilize the flavonols in GTE more efficiently and effectively. Such processing could allow; the production of GTE in which beneficial flavonol aglycones can be digested and absorbed regardless of whether or not the individual consuming the product can produce LPH. Further studies for elucidating the specific health-promoting effects of GT flavonols are warranted.

Supplementary Materials

The following are available online at https://www.mdpi.com/2073-4344/9/10/861/s1, Figure S1: Chemical structures of catechins and flavonols in GTE, Tables S1 and S2: Changes of catechins and flavonols by hydrolysis of cellulolytic enzymes (numerical values), Table S3: Correlation result for producing flavonol aglycones by multivariate analysis, Figure S2: Kinetics of enzyme CF, Table S4: Parameters and result of docking run.

Author Contributions

Conceptualization, C.-S.R.; methodology, C.-S.R., S.-W.K., and K.H.B.; software, C.-S.R.; validation, C.-S.R. and S.-W.K.; formal analysis, C.-S.R., S.-W.K., and K.H.B.; investigation, C.-S.R. and S.-W.K.; resources, C.-S.R., S.-W.K., and K.H.B.; data curation, C.-S.R. and D.-O.K.; writing—original draft preparation, C.-S.R.; writing—review and editing, C.-S.R. and D.-O.K.; visualization, C.-S.R.; supervision, C.-S.R. and D.-O.K.; project administration, Y.D.H.

Funding

This research received no external funding.

Acknowledgments

We are grateful to Professor Cheon-Seok Park (Kyung Hee University, Yongin, Republic of Korea) for supporting the SDS-PAGE analysis and molecular docking simulation.

Conflicts of Interest

The authors declare no conflict of interest.

Appendix A. Assay of Multi-Functional Activities of Commercial Enzymes

The enzyme activities were measured according to the corresponding universal method as described below. Substrate blanks were prepared by adding buffer instead of the enzyme solution.
The assay of arabinase activity was determined using Arabinazyme Tablets (T-ARZ200; Megazyme International, Bray, Ireland) [41]. The assay of α-rhamnosidase activity followed the method described by Gallego et al. [42] In brief, the mixture contained 250 μL of substrate (3 mM 4-nitrophenyl-α-rhamnopyranoside in 50 mM succinate buffer, pH 5.5) and 250 μL of the enzyme solution, which was incubated at 50 °C. The reaction was stopped by adding 1 mL of stop reagent (2 M Na2CO3) after 10 min of incubation, and then the absorbance was measured at 400 nm. One unit of α-rhamnosidase is considered the amount of enzyme required to liberate 1 μmol of nitrophenol per minute at 50 °C.
The assay of β-glucosidase activity was conducted according to a modification of the method reported by Kim and Park [43] In brief, the mixture contained 400 μL of substrate (125 mM 4-nitrophenyl-β-D-glucoside in 20 mM sodium acetate buffer, pH 4.5) and 100 μL of enzyme solution, and incubated at 40 °C. The reaction was stopped by adding 5 mL of stop solution (50 mM Na2CO3) after 10 min of incubation, and the absorbance was read at 412 nm. One unit of β-glucosidase is the amount of enzyme that catalyzes the hydrolysis of 1.0 μmol of nitrophenol per minute.
The assay of α-arabinofuranosidase activity followed the method described by McCleary et al. [44]. In brief, the mixture contained 400 μL of substrate (2.5 mM 4-nitrophenyl-α-arabinofuranoside in 50 mM citrate-phosphate buffer, pH 4.0) and 60 μL of enzyme solution, which was incubated at 40 °C. The reaction was stopped by the addition of 460 μL of stop reagent (0.2 M Na2CO3) after 10 min of incubation, and the absorbance was measured at 410 nm. One α-arabinofuranosidase unit is the amount of enzyme that liberates 1 μmol of nitrophenol per minute at 40 °C.
The assay of α-arabinopyranosidase activity was applied modifying the method for α-arabinofuranosidase activity described above. The mixture contained 200 μL of substrate (2.0 mM 4-nitrophenyl-α-arabinopyranoside in 20 mM sodium acetate buffer, pH 4.5) and 200 μL of enzyme solution, which was incubated at 50 °C. The reaction was stopped by adding 400 μL of stop reagent (0.2 M Na2CO3) after 10 min of incubation and the absorbance was measured at 400 nm. One unit of α-arabinopyranosidase is the amount of enzyme that liberates 1 μmol of nitrophenol per minute at 50 °C.
The β-galactosidase activity was assessed according to a modified method described by the Food Chemicals Codex [45]. A mixture containing 800 μL of substrate (12.5 mM 2-nitrophenyl- β-D-galactopyranoside in 20 mM of sodium acetate buffer, pH 4.5) and 200 μL of enzyme solution was incubated at 50 °C. The reaction was stopped by adding 1 mL of stop reagent [10% (w/v) Na2CO3] after 10 min of incubation, followed by the addition of 8 mL of water, and then, the absorbance was measured at 420 nm. One unit of β-galactosidase is the amount of enzyme that liberates 1 μmol of nitrophenol per minute at 50 °C.
The β-xylosidase activity was evaluated by modifying the method used for α-arabinofuranosidase activity describe above. The mixture contained 400 μL of the substrate (2.5 mM 4-nitrophenyl-β-D-xylopyranoside in 20 mM sodium acetate buffer, pH 4.5) and 400 μL of enzyme solution, which was incubated at 50 °C. The reaction was stopped by adding 800 μL of stop reagent (0.2 M Na2CO3) after 10 min of incubation and the absorbance was read at 400 nm. One unit of β-xylosidase is the amount of enzyme that liberates 1 μmol of nitrophenol per minute at 50 °C.
The assay of β-mannosidase activity was modified from that used for α-arabinofuranosidase activity. The mixture contained 400 μL of substrate (2.5 mM 4-nitrophenyl-β-D-mannopyranoside in 20 mM sodium acetate buffer, pH 4.5) and 400 μL of enzyme solution, which was incubated at 50 °C. The reaction was stopped by adding 800 μL of stop reagent (0.2 M Na2CO3) after 10 min of incubation, and then the absorbance was read at 400 nm. One unit of β-mannosidase is the amount of enzyme that liberates 1 μmol of nitrophenol per minute at 50 °C.
The tannase activity was evaluated according to the method described by Iibuchi et al. [46]. The mixture contained 2 mL of substrate [0.35% (w/v) tannic acid in 50 mM citrate buffer, pH 5.5] and 0.5 mL of enzyme solution, which was incubated at 37 °C. After 10 min of incubation, 20 μL of the reaction mixture and 2 mL of 80% (v/v) ethanol solution were mixed, and the absorbance was measured at 310 nm. The activity was calculated according to the difference in absorbance to the blank without enzyme solution. One unit of tannase activity is the amount which was hydrolyzed 1 μmol of ester in 1 min at 37 °C.

References

  1. Monobe, M.; Nomura, S.; Ema, K.; Matsunaga, A.; Nesumi, A.; Yoshida, K.; Maeda-Yamamoto, M.; Horie, H. Quercetin glycosides-rich tea cultivars (Camellia sinensis L.) in Japan. Food Sci. Technol. Res. 2015, 21, 333–340. [Google Scholar] [CrossRef]
  2. Peterson, J.; Dwyer, J.; Bhagwat, S.; Haytowitz, D.; Holden, J.; Eldridge, A.L.; Beecher, G.; Aladesanmi, J. Major flavonoids in dry tea. J. Food Compos. Anal. 2005, 18, 487–501. [Google Scholar] [CrossRef]
  3. Khan, N.; Mukhtar, H. Tea polyphenols for health promotion. Life Sci. Adv. Exp. Clin. Endocrinol. 2007, 81, 519–533. [Google Scholar] [CrossRef] [Green Version]
  4. Cabrera, C.; Artacho, R.; Gimenez, R. Beneficial effects of green tea—A review. J. Am. Coll. Nutr. 2006, 25, 79–99. [Google Scholar] [CrossRef] [PubMed]
  5. Wu, C.; Xu, H.; Heritier, J.; Andlauer, W. Determination of catechins and flavonol glycosides in Chinese tea varieties. Food Chem. 2012, 132, 144–149. [Google Scholar] [CrossRef] [PubMed]
  6. Jiang, H.; Engelhardt, U.H.; Thräne, C.; Maiwald, B.; Stark, J. Determination of flavonol glycosides in green tea, oolong tea and black tea by UHPLC compared to HPLC. Food Chem. 2015, 183, 30–35. [Google Scholar] [CrossRef]
  7. Iwashina, T. The structure and distribution of the flavonoids in plants. J. Plant Res. 2000, 113, 287–299. [Google Scholar] [CrossRef]
  8. Walle, T.; Otake, Y.; Walle, U.K.; Wilson, F.A. Quercetin glucosides are completely hydrolyzed in ileostomy patients before absorption. J. Nutr. 2000, 130, 2658–2661. [Google Scholar] [CrossRef]
  9. Olthof, M.R.; Hollman, P.C.; Vree, T.B.; Katan, M.B. Bioavailabilities of quercetin-3-glucoside and quercetin-4′-glucoside do not differ in humans. J. Nutr. 2000, 130, 1200–1203. [Google Scholar] [CrossRef]
  10. Hollman, P.C.H.; Bijsman, M.N.C.P.; van Gameren, Y.; Cnossen, E.P.J.; de Vries, J.H.M.; Katan, M.B. The sugar moiety is a major determinant of the absorption of dietary flavonoid glycosides in man. Free Radic. Res. 1999, 31, 569–573. [Google Scholar] [CrossRef]
  11. Xiao, J.; Cao, H.; Wang, Y.; Zhao, J.; Wei, X. Glycosylation of dietary flavonoids decreases the affinities for plasma protein. J. Agric. Food. Chem. 2009, 57, 6642–6648. [Google Scholar] [CrossRef] [PubMed]
  12. Hostetler, G.; Riedl, K.; Cardenas, H.; Diosa-Toro, M.; Arango, D.; Schwartz, S.; Doseff, A.I. Flavone deglycosylation increases their anti-inflammatory activity and absorption. Mol. Nutr. Food Res. 2012, 56, 558–569. [Google Scholar] [CrossRef] [PubMed]
  13. Semwal, D.K.; Semwal, R.B.; Combrinck, S.; Viljoen, A. Myricetin: A dietary molecule with diverse biological activities. Nutrients 2016, 8, 90. [Google Scholar] [CrossRef] [PubMed]
  14. Lea, M.A. Flavonol regulation in tumor cells. J. Cell. Biochem. 2015, 116, 1190–1194. [Google Scholar] [CrossRef] [PubMed]
  15. Nomura, S.; Monobe, M.; Ema, K.; Matsunaga, A.; Maeda-Yamamoto, M.; Horie, H. Effects of flavonol-rich green tea cultivar (Camellia sinensis L.) on plasma oxidized LDL levels in hypercholesterolemic mice. Biosci. Biotechnol. Biochem. 2016, 80, 360–362. [Google Scholar] [CrossRef]
  16. Menezes, R.; Rodriguez-Mateos, A.; Kaltsatou, A.; Gonzalez-Sarrias, A.; Greyling, A.; Giannaki, C.; Andres-Lacueva, C.; Milenkovic, D.; Gibney, E.R.; Dumont, J.; et al. Impact of flavonols on cardiometabolic biomarkers: A meta-analysis of randomized controlled human trials to explore the role of inter-individual variability. Nutrients 2017, 9, 117. [Google Scholar] [CrossRef]
  17. Plumb, G.W.; Price, K.R.; Williamson, G. Antioxidant properties of flavonol glycosides from tea. Redox Rep. 1999, 4, 13–16. [Google Scholar] [CrossRef]
  18. Hur, S.J.; Lee, S.Y.; Kim, Y.C.; Choi, I.; Kim, G.B. Effect of fermentation on the antioxidant activity in plant-based foods. Food Chem. 2014, 160, 346–356. [Google Scholar] [CrossRef]
  19. Georgetti, S.R.; Vicentini, F.T.; Yokoyama, C.Y.; Borin, M.F.; Spadaro, A.C.; Fonseca, M.J. Enhanced in vitro and in vivo antioxidant activity and mobilization of free phenolic compounds of soybean flour fermented with different β-glucosidase-producing fungi. J. Appl. Microbiol. 2009, 106, 459–466. [Google Scholar] [CrossRef]
  20. Ni, H.; Chen, F.; Jiang, Z.D.; Cai, M.Y.; Yang, Y.F.; Xiao, A.F.; Cai, H.N. Biotransformation of tea catechins using Aspergillus niger tannase prepared by solid state fermentation on tea byproduct. LWT Food Sci. Technol. 2015, 60, 1206–1213. [Google Scholar] [CrossRef]
  21. Macedo, J.A.; Ferreira, L.R.; Camara, L.E.; Santos, J.C.; Gambero, A.; Macedo, G.A.; Ribeiro, M.L. Chemopreventive potential of the tannase-mediated biotransformation of green tea. Food Chem. 2012, 133, 358–365. [Google Scholar] [CrossRef] [PubMed] [Green Version]
  22. Baik, J.H.; Shin, K.S.; Park, Y.; Yu, K.W.; Suh, H.J.; Choi, H.S. Biotransformation of catechin and extraction of active polysaccharide from green tea leaves via simultaneous treatment with tannase and pectinase. J. Sci. Food Agric. 2015, 95, 2337–2344. [Google Scholar] [CrossRef] [PubMed]
  23. Farrell, T.L.; Ellam, S.L.; Forrelli, T.; Williamson, G. Attenuation of glucose transport across Caco-2 cell monolayers by a polyphenol-rich herbal extract: Interactions with SGLT1 and GLUT2 transporters. BioFactors 2013, 39, 448–456. [Google Scholar] [CrossRef] [PubMed]
  24. Clifford, M.N. Diet-derived phenols in plasma and tissues and their implications for health. Planta Med. 2004, 70, 1103–1114. [Google Scholar] [CrossRef] [PubMed]
  25. Walle, T. Absorption and metabolism of flavonoids. Free Radic. Biol. Med. 2004, 36, 829–837. [Google Scholar] [CrossRef] [PubMed]
  26. Van Duynhoven, J.; Vaughan, E.E.; Jacobs, D.M.; Kemperman, R.A.; van Velzen, E.J.J.; Gross, G.; Roger, L.C.; Possemiers, S.; Smilde, A.K.; Dore, J.; et al. Metabolic fate of polyphenols in the human superorganism. Proc. Natl. Acad. Sci. USA 2010, 108, 4531–4538. [Google Scholar] [CrossRef] [PubMed] [Green Version]
  27. Itan, Y.; Jones, B.L.; Ingram, C.J.; Swallow, D.M.; Thomas, M.G. A worldwide correlation of lactase persistence phenotype and genotypes. BMC Evol. Biol. 2010, 10, 36. [Google Scholar] [CrossRef]
  28. Nemeth, K.; Plumb, G.W.; Berrin, J.G.; Juge, N.; Jacob, R.; Naim, H.Y.; Williamson, G.; Swallow, D.M.; Kroon, P.A. Deglycosylation by small intestinal epithelial cell β-glucosidases is a critical step in the absorption and metabolism of dietary flavonoid glycosides in humans. Eur. J. Nutr. 2003, 42, 29–42. [Google Scholar] [CrossRef]
  29. Choi, E.H.; Rha, C.S.; Balusamy, S.R.; Kim, D.O.; Shim, S.M. Impact of bioconversion of gallated catechins and flavonol glycosides on bioaccessibility and intestinal cellular uptake of catechins. J. Agric. Food. Chem. 2019, 67, 2331–2339. [Google Scholar] [CrossRef]
  30. Rha, C.-S.; Jeong, H.W.; Park, S.; Lee, S.; Jung, Y.S.; Kim, D.-O. Antioxidative, anti-inflammatory, and anticancer effects of purified flavonol glycosides and aglycones in green tea. Antioxidants 2019, 8, 278. [Google Scholar] [CrossRef]
  31. van Pouderoyen, G.; Snijder, H.J.; Benen, J.A.E.; Dijkstra, B.W. Structural insights into the processivity of endopolygalacturonase I from Aspergillus niger. FEBS Lett. 2003, 554, 462–466. [Google Scholar] [CrossRef]
  32. Ren, B.; Wu, M.; Wang, Q.; Peng, X.; Wen, H.; McKinstry, W.J.; Chen, Q. Crystal structure of tannase from Lactobacillus plantarum. J. Mol. Biol. 2013, 425, 2737–2751. [Google Scholar] [CrossRef] [PubMed]
  33. AFMB. Glycoside Hydrolase Family Classification. Available online: http://www.cazy.org/Glycoside-Hydrolases.html (accessed on 25 November 2018).
  34. Dube, A.; Ng, K.; Nicolazzo, J.A.; Larson, I. Effective use of reducing agents and nanoparticle encapsulation in stabilizing catechins in alkaline solution. Food Chem. 2010, 122, 662–667. [Google Scholar] [CrossRef]
  35. Kirk, O.; Borchert, T.V.; Fuglsang, C.C. Industrial enzyme applications. Curr. Opin. Biotechnol. 2002, 13, 345–351. [Google Scholar] [CrossRef]
  36. Yao, J.; Fan, X.J.; Lu, Y.; Liu, Y.H. Isolation and characterization of a novel tannase from a metagenomic library. J. Agric. Food. Chem. 2011, 59, 3812–3818. [Google Scholar] [CrossRef]
  37. Lu, M.-J.; Chen, C. Enzymatic modification by tannase increases the antioxidant activity of green tea. Food Res. Int. 2008, 41, 130–137. [Google Scholar] [CrossRef]
  38. Matsumoto, T.; Shimada, S.; Hata, Y.; Tanaka, T.; Kondo, A. Multi-functional glycoside hydrolase: Blon_0625 from Bifidobacterium longum subsp. infantis ATCC 15697. Enzym. Microb. Technol. 2015, 68, 10–14. [Google Scholar] [CrossRef]
  39. Baik, J.H.; Suh, H.J.; Cho, S.Y.; Park, Y.; Choi, H.S. Differential activities of fungi-derived tannases on biotransformation and substrate inhibition in green tea extract. J. Biosci. Bioeng. 2014, 118, 546–553. [Google Scholar] [CrossRef]
  40. Jones, G.; Willett, P.; Glen, R.C.; Leach, A.R.; Taylor, R. Development and validation of a genetic algorithm for flexible docking. J. Mol. Biol. 1997, 267, 727–748. [Google Scholar] [CrossRef] [Green Version]
  41. Flipphi, M.J.; Visser, J.; van der Veen, P.; de Graaff, L.H. Arabinase gene expression in Aspergillus niger: Indications for coordinated regulation. Microbiology 1994, 140, 2673–2682. [Google Scholar] [CrossRef]
  42. Gallego, M.V.; Piñaga, F.; Ramón, D.; Vallés, S. Purification and characterization of an α-L-rhamnosidase from Aspergillus terreus of interest in winemaking. J. Food Sci. 2001, 66, 204–209. [Google Scholar] [CrossRef]
  43. Kim, B.H.; Park, S.K. Enhancement of volatile aromatic compounds in black raspberry wines via enzymatic treatment. J. Inst. Brew. 2017, 123, 277–283. [Google Scholar] [CrossRef] [Green Version]
  44. McCleary, B.V.; McKie, V.A.; Draga, A.; Rooney, E.; Mangan, D.; Larkin, J. Hydrolysis of wheat flour arabinoxylan, acid-debranched wheat flour arabinoxylan and arabino-xylo-oligosaccharides by β-xylanase, α-L-arabinofuranosidase and β-xylosidase. Carbohydr. Res. 2015, 407, 79–96. [Google Scholar] [CrossRef] [PubMed]
  45. Codex, F.C. Food Chemicals Codex, 10th ed.; Available online: http://www.foodchmicalscodex.org (accessed on 11 March 2019).
  46. Iibuchi, S.; Minoda, Y.; Yamada, K. Studies on tannin acyl hydrolase of microorganisms: Part II. A new method determining the enzyme activity using the change of ultra violet absorption. Agric. Biol. Chem. 1967, 31, 513–518. [Google Scholar] [CrossRef]
Figure 1. High-performance liquid chromatography traces of green tea extract (GTE) and enzyme-treated GTE. (A) Catechin chromatogram of GTE at 275 nm, (B) catechin chromatogram of enzyme-treated GTE at 275 nm, (C) flavonol chromatogram of GTE at 365 nm, and (D) flavonol chromatogram of enzyme-treated GTE at 365 nm. Peaks were identified by mass analysis: a, gallic acid (GA); b, (⎯)-epigallocatechin (EGC); c, caffeine; d, (⎯)-epicatechin (EC); e, (⎯)-epigallocatechin gallate (EGCG); f, (⎯)-epicatechin gallate (ECG). The numbers 1–13, 14, 15, and 16 indicate flavonol glycosides, myricetin, quercetin, and kaempferol, respectively. Refer to the exact mass and structural information of numbered peaks in previous research [30].
Catalysts 09 00861 g001
Figure 2. Changes of (A) catechins and (B) flavonols by the hydrolysis of cellulolytic enzymes.Data shown are the mean ± standard error of the mean (SEM) (mg/g GTE). Different letters on the bars indicate significant differences according to Tukey-Kramer’s honestly significant difference test (p < 0.05). * means not detected. Flavonols represent the sum of myricetin, quercetin, and kaempferol. Catechins in Y-axis of (A) represent the sum of EC, ECG, EGC, and EGCG. 1-AT, control ambient temperature; 2–50, control 50 °C; refer to the abbreviations of enzymes in Table 1. The numeric data are presented in Tables S1 and S2.
Catalysts 09 00861 g002
Figure 3. Effects of (A) temperature, (B) enzyme amount, and (C) pH on production of flavonol aglycones and gallic acid from green tea extract in enzyme CF reaction.
Catalysts 09 00861 g003
Figure 4. Sodium dodecyl sulfate–polyacrylamide gel electrophoresis (SDS-PAGE) analysis and determination of activities by the fraction of enzyme. (A) Size distribution of enzyme CF by SDS-PAGE. (B) Size exclusion chromatography of enzyme CF. Blue and red chromatograms were detected at 280 nm and 245 nm, respectively. The numbers on the x-axis of chromatography indicate the fraction of the separation by 0.5 mL, (C) Size distribution of the fraction which was obtained by SDS-PAGE. The numbers within the parentheses in (C) indicate distinguished protein bands. The fraction No. of (C) corresponds to the number on the x-axis of (B). Fraction No. 11 was omitted owing to the elution method of the fast protein liquid chromatography (FPLC) system. Abbreviations mean; a GH, glycoside hydrolase; b TH, tannin acyl-hydrolase; c N/D, not detected; d S, strong activity; e W, weak activity. The activities were classified by the occurrence of flavonol aglycones or GA on the chromatography.
Catalysts 09 00861 g004
Figure 5. Effects of substrate concentration for producing flavonol aglycones and gallic acid (GA) in enzymatic reactions. (A1) sum of flavonols, (A2) kaempferol, (A3) quercetin, (A4) myricetin, (A5) GA, (B1) sum of catechins, (B2) ECG, (B3) EC, (B4) EGCG, (B5) EGC. Lines indicate: dotted line, 35 °C; solid line, 50 °C. All graphs were applied fitted regression curves (r2 > 0.95) from an equation of JMP12 (SAS Institute Inc., Cary, NC, USA).
Catalysts 09 00861 g005
Figure 6. Reaction trends of CF enzyme-based (A,C) and hydrochloride-based (B,D) hydrolysis of GTE. The components of GTE were measured (n = 3) by time-course reactions. A2 and B2 were fitted by a first-order regression, while the others were fitted by a second-order regression from an equation of SigmaPlot 10 (Systat Software, Inc., San Jose, CA, USA).
Catalysts 09 00861 g006
Figure 7. Molecular docking simulation in the active site of (A) glycoside hydrolase and (B) tannase with the superimposed isoquercitrin (yellow) or EGCG (green). The colors of atoms represent their interaction with ligands as follows: gray, carbon; red, oxygen; and blue, nitrogen. Hydrogen atoms of protein residues and ligands are omitted for improving a graphical comprehension. The green dotted lines represent the hydrogen bonding. Other protein residues are depicted in ribbon, while catalytic residues are illustrated as capped sticks.
Catalysts 09 00861 g007
Table 1. Characteristics of enzymes and test conditions of screening for hydrolyzing flavonol glycosides in green tea extract.
Name of Enzyme a
(abbreviation)
Cellulyve-AN
(AN)
Cellulase-KN
(KN)
Glucosidase-BT
(BT)
Plantase-CF
(CF)
Plantase-UF
(UF)
Peclyve ARA-NS
(NS)
Sumizyme-AC
(AC)
Tannase-KTFHR
(TN)
EC number3.2.1.43.2.1.43.2.1.213.2.1.153.2.1.6.; 3.2.1.993.2.1.993.2.1.43.1.1.20
Class of glycosidase bCCBPG; AACT
Activity (U c)arabinase20.2N/D d6255175N/DN/D
α-arabinofuranosidase36124N/D3406105847369N/Ae
α-arabinopyranosidase31336N/D26023551567N/A
β-glucosidase32628028401236N/A
β-galactosidase0172109143N/A
β-mannosidase40235811130N/A
α-rhamnosidase4245N/D3164N/A
tannin acyl hydrolaseN/D3.90.714.8N/DN/D3.4520.4
β-xylosidase121440743155N/A
Test pH (optimum f)5.0 (3.0–5.0)5.0 (3.0–5.0)5.0 (3.0–6.0)5.0 (3.0–5.5)5.0 (4.0–6.5)5.0 (4.0–6.5)5.0 (3.5–5.0)5.0 (3.0–6.0)
Test temp. (°C; optimum f)50 (30–50)50 (40–50)50 (35–65)50 (50–60)50 (40–60)50 (40–60)60 (40–65)40(40)
Applied amount (% v/v) of enzyme1010101010101010
a The name of the enzyme is followed by the trade name of the manufacturer; all enzymes were collected from the culture broth of Aspergillus niger, except for tannase (A oryzae). Multi-functional activity comparison was performed among enzymes with the ability of cellulolytic hydrolysis of carbohydrates. b Nomenclature Committee of the International Union of Biochemistry and Molecular Biology, and the abbreviations indicate; C, cellulase; B, β-glucosidase; P, polygalacturonase; G, endo-1,3(4)-β-glucanase; A, arabinan endo-1,5-α-arabinanase; T, tannase. c U: unit/mL or unit/g (single-point test). d N/D: not detected. e N/A: not available (no test). f Citrate phosphate buffer (50 mM) was used. The applied GTE concentration was set at 10% (w/v) in the reaction.
Table 2. Kinetic parameters of the enzyme CF.
Regression aGallic acidMyricetinQuercetinKaempferolSum of flavonols
Temperature (°C)Temperature (°C)Temperature (°C)Temperature (°C)Temperature (°C)
355050/35 b355050/35355050/35355050/35355050/35
Vm (μg∙mL1∙h1)
HWN.A.c169.5 d N.A.21.9 279.6 12.8 14.4 42.7 3.0 5.7 13.7 2.4 34.9 195.7 5.6
NLe95.1 153.3 1.6 17.0 82.9 4.9 12.5 32.8 2.6 4.6 11.8 2.6 35.5 131.6 3.7
Km (mg∙mL1)
HWN.A.2.9 N.A.14.3 286.3 20.0 7.4 31.9 4.3 5.1 15.0 2.9 6.3 68.2 10.8
NL2.8 3.8 1.3 8.3 46.3 5.6 6.4 20.2 3.2 4.2 11.4 2.7 7.4 87.5 11.8
a The regression method is the Hanes–Woof plot (HW) (first-order regression of HW; [S] 5–100 mg/mL) and non-linear regression (NL; [S] 2–200 mg/mL). b 50/35 means the velocity enhancement (fold change) from 35 °C to 50 °C. c N.A. means not available due to the negative value of the intercept. d The values in the Table were calculated from the regressions plotted from three replicates. e NL of GA and other substrates was conducted with biexponential 4P and exponential 3P, respectively, using JMP 12.

