Article

Fermentative Conversion of Two-Step Pre-Treated Lignocellulosic Biomass to Hydrogen

1
Department of Process Engineering and Chemical Technology, Faculty of Chemistry, Gdańsk University of Technology, Narutowicza 11/12 street, 80-233 Gdańsk, Poland
2
Department of Molecular Biotechnology and Microbiology, Faculty of Chemistry, Gdańsk University of Technology, Narutowicza 11/12 street, 80-233 Gdańsk, Poland
3
Department of Environmental Toxicology, Faculty of Health Sciences with Subfaculty of Nursing and Institute of Maritime and Tropical Medicine, Medical University of Gdańsk, Dębowa 23a street, 80-204 Gdańsk, Poland
*
Author to whom correspondence should be addressed.
Catalysts 2019, 9(10), 858; https://doi.org/10.3390/catal9100858
Submission received: 20 September 2019 / Revised: 7 October 2019 / Accepted: 10 October 2019 / Published: 15 October 2019
(This article belongs to the Special Issue Catalysis in Lignocellulosic Biomass Conversion)

Abstract

:
Fermentative hydrogen production via dark fermentation with the application of lignocellulosic biomass requires a multistep pre-treatment procedure, due to the complexed structure of the raw material. Hence, the comparison of the hydrogen productivity potential of different lignocellulosic materials (LCMs) in relation to the lignocellulosic biomass composition is often considered as an interesting field of research. In this study, several types of biomass, representing woods, cereals and grass were processed by means of mechanical pre-treatment and alkaline and enzymatic hydrolysis. Hydrolysates were used in fermentative hydrogen production via dark fermentation process with Enterobacter aerogenes (model organism). The differences in the hydrogen productivity regarding different materials hydrolysates were analyzed using chemometric methods with respect to a wide dataset collected throughout this study. Hydrogen formation, as expected, was positively correlated with glucose concentration and total reducing sugars amount (YTRS) in enzymatic hydrolysates of LCMs, and negatively correlated with concentrations of enzymatic inhibitors i.e., HMF, furfural and total phenolic compounds in alkaline-hydrolysates LCMs, respectively. Interestingly, high hydrogen productivity was positively correlated with lignin content in raw LCMs and smaller mass loss of LCM after pre-treatment step. Besides results of chemometric analysis, the presented data analysis seems to confirm that the structure and chemical composition of lignin and hemicellulose present in the lignocellulosic material is more important to design the process of its bioconversion than the proportion between the cellulose, hemicellulose and lignin content in this material. For analyzed LCMs we found remarkable higher potential of hydrogen production via bioconversion process of woods i.e., beech (24.01 mL H2/g biomass), energetic poplar (23.41 mL H2/g biomass) or energetic willow (25.44 mL H2/g biomass) than for cereals i.e., triticale (17.82 mL H2/g biomass) and corn (14.37 mL H2/g biomass) or for meadow grass (7.22 mL H2/g biomass).

1. Introduction

The depletion of fossil fuel resources and the accompanying extraction and processing of environmental degradation force the search for alternative technologies for energy production from biomass resources [1]. Hence, conversion of the biomass of plant origin is gaining importance. One of the alternative energy carriers, which can be produced from non-food raw materials, is hydrogen. The gas with a high hydrogen content obtained from biomass could be used as a raw material for the production of jet, gasoline and diesel fuels [2,3,4]. The currently leading technologies of hydrogen production using conventional methods are energy-consuming, require high temperatures and pollute the environment [5] due to the emission of large amounts of carbon oxides, sulfur oxides and nitrogen oxides into the atmosphere [6]. An alternative is to obtain hydrogen from biomass using biotechnological methods that use the natural possibilities of microorganisms that produce hydrogen as one of the products of metabolic transformation. In dark fermentation, the carbohydrate substrates are transformed without light by the bacteria in anaerobic respiration, the ratio between energy obtained and consumed is equal to 1.9 [7]. The raw materials for dark fermentation may be simple sugars but also cellulose or starch hydrolyzed into simple sugars [6,8]. It would be particularly desirable to use this process for the production of second generation hydrogen from starch and cellulose-rich waste from the agriculture, food, wood and paper industries [9,10].
In the case of bioconversion of cellulose-rich wastes, fermentation technologies are multistep processes in which the fermentation step is preceded by enzymatic hydrolysis step aimed at degrading the organic structure of polymeric compounds present in raw biomass used as feed, to simple molecules (monosaccharides, fatty acids and amino acids) that are metabolized by the microorganisms involved in fermentation. Enzymatic hydrolysis has a huge impact on the course of fermentation and its final yield [11,12,13,14]. It is also the most expensive step, which limits the cost of the entire technology [15,16]. The rate of enzymatic hydrolysis of lignocellulosic waste is limited by many factors, such as the degree of polymerization of the raw material, moisture content, hemicellulose and lignin content [17], or the porosity of the raw material [18,19]. Therefore, the breakdown of the compact lignocellulose structure during pre-treatment stage facilitates the enzymatic hydrolysis of polysaccharides [20,21,22]. It should also ensure the reduction of the degree of cellulose crystallization and the increase of the surface contact area of cellulose present in the raw lignocellulosic material with enzymes by removing lignin and non-polymeric compounds from the reaction environment [23,24]. Hence, understanding the changes occurring during the initial processing of lignocellulosic materials (differing in the content of cellulose, hemicellulose and lignin and the structure of lignocellulose matrix) is crucial for understanding the relationship between the yield of delignification of lignocellulose in the pre-treatment step, the efficiency of the cellulose and hemi-cellulose enzymatic hydrolysis step and the hydrogen production yield in the process of dark anaerobic fermentation of glucose, cellobiose and other monosaccharides being the products of the enzymatic hydrolysis step [25,26]. In our opinion, in this matter, a new valuable data may be achieved during the study of bioconversion process of selected raw lignocellulosic materials (LCMs) characterized by different chemical composition of lignins and hemicelluloses with one of the previously developed methods [27,28,29] of hydrogen production from lignocellulosic materials and further analysis of obtained results via chemometric methods.
In a previous article, the authors presented a method of hydrogen production from energetic poplar preceded by monoethanoloamine (abr. MEA) pre-treatment and enzymatic hydrolysis [30] and concluded that there is a need to compare the results obtained when this procedure is applied on diversified lignocellulosic materials. In this article, first of all, we tested the suitability of the developed method of alkaline pre-treatment and enzymatic hydrolysis of energetic poplar (EP) for the processing of five other lignocellulosic materials, i.e., beech (B), energetic willow (EW), triticale paleas (TP), meadow grass (MG) and corn cobs (CC), respectively. Lignin, cellulose and hemicellulose contents after and before the pre-treatment step were measured and compared. Secondly, for analyzed biomass types, the suitability of the developed method was tested for the removal of selected inhibitors (produced during pre-treatment) of cellulolytic enzymes before the enzymatic hydrolysis step. In addition, guided by the need to reduce process costs, we have modified the enzymatic hydrolysis step, previously investigated in [30] without affecting the efficiency of this process, which was justified by the obtained values of total reducing sugar concentrations [30] for EP. Finally, which was of particular interest to us, we compared the applicability of the obtained enzymatic hydrolysates of the tested lignocellulosic materials for the growth of Enterobacter aerogenes and we compared the efficiency of hydrogen production during their dark fermentation. Chemometric methods were applied in order to define the correlations between measured parameters and support the conclusions drawn at all steps of the process.

2. Results

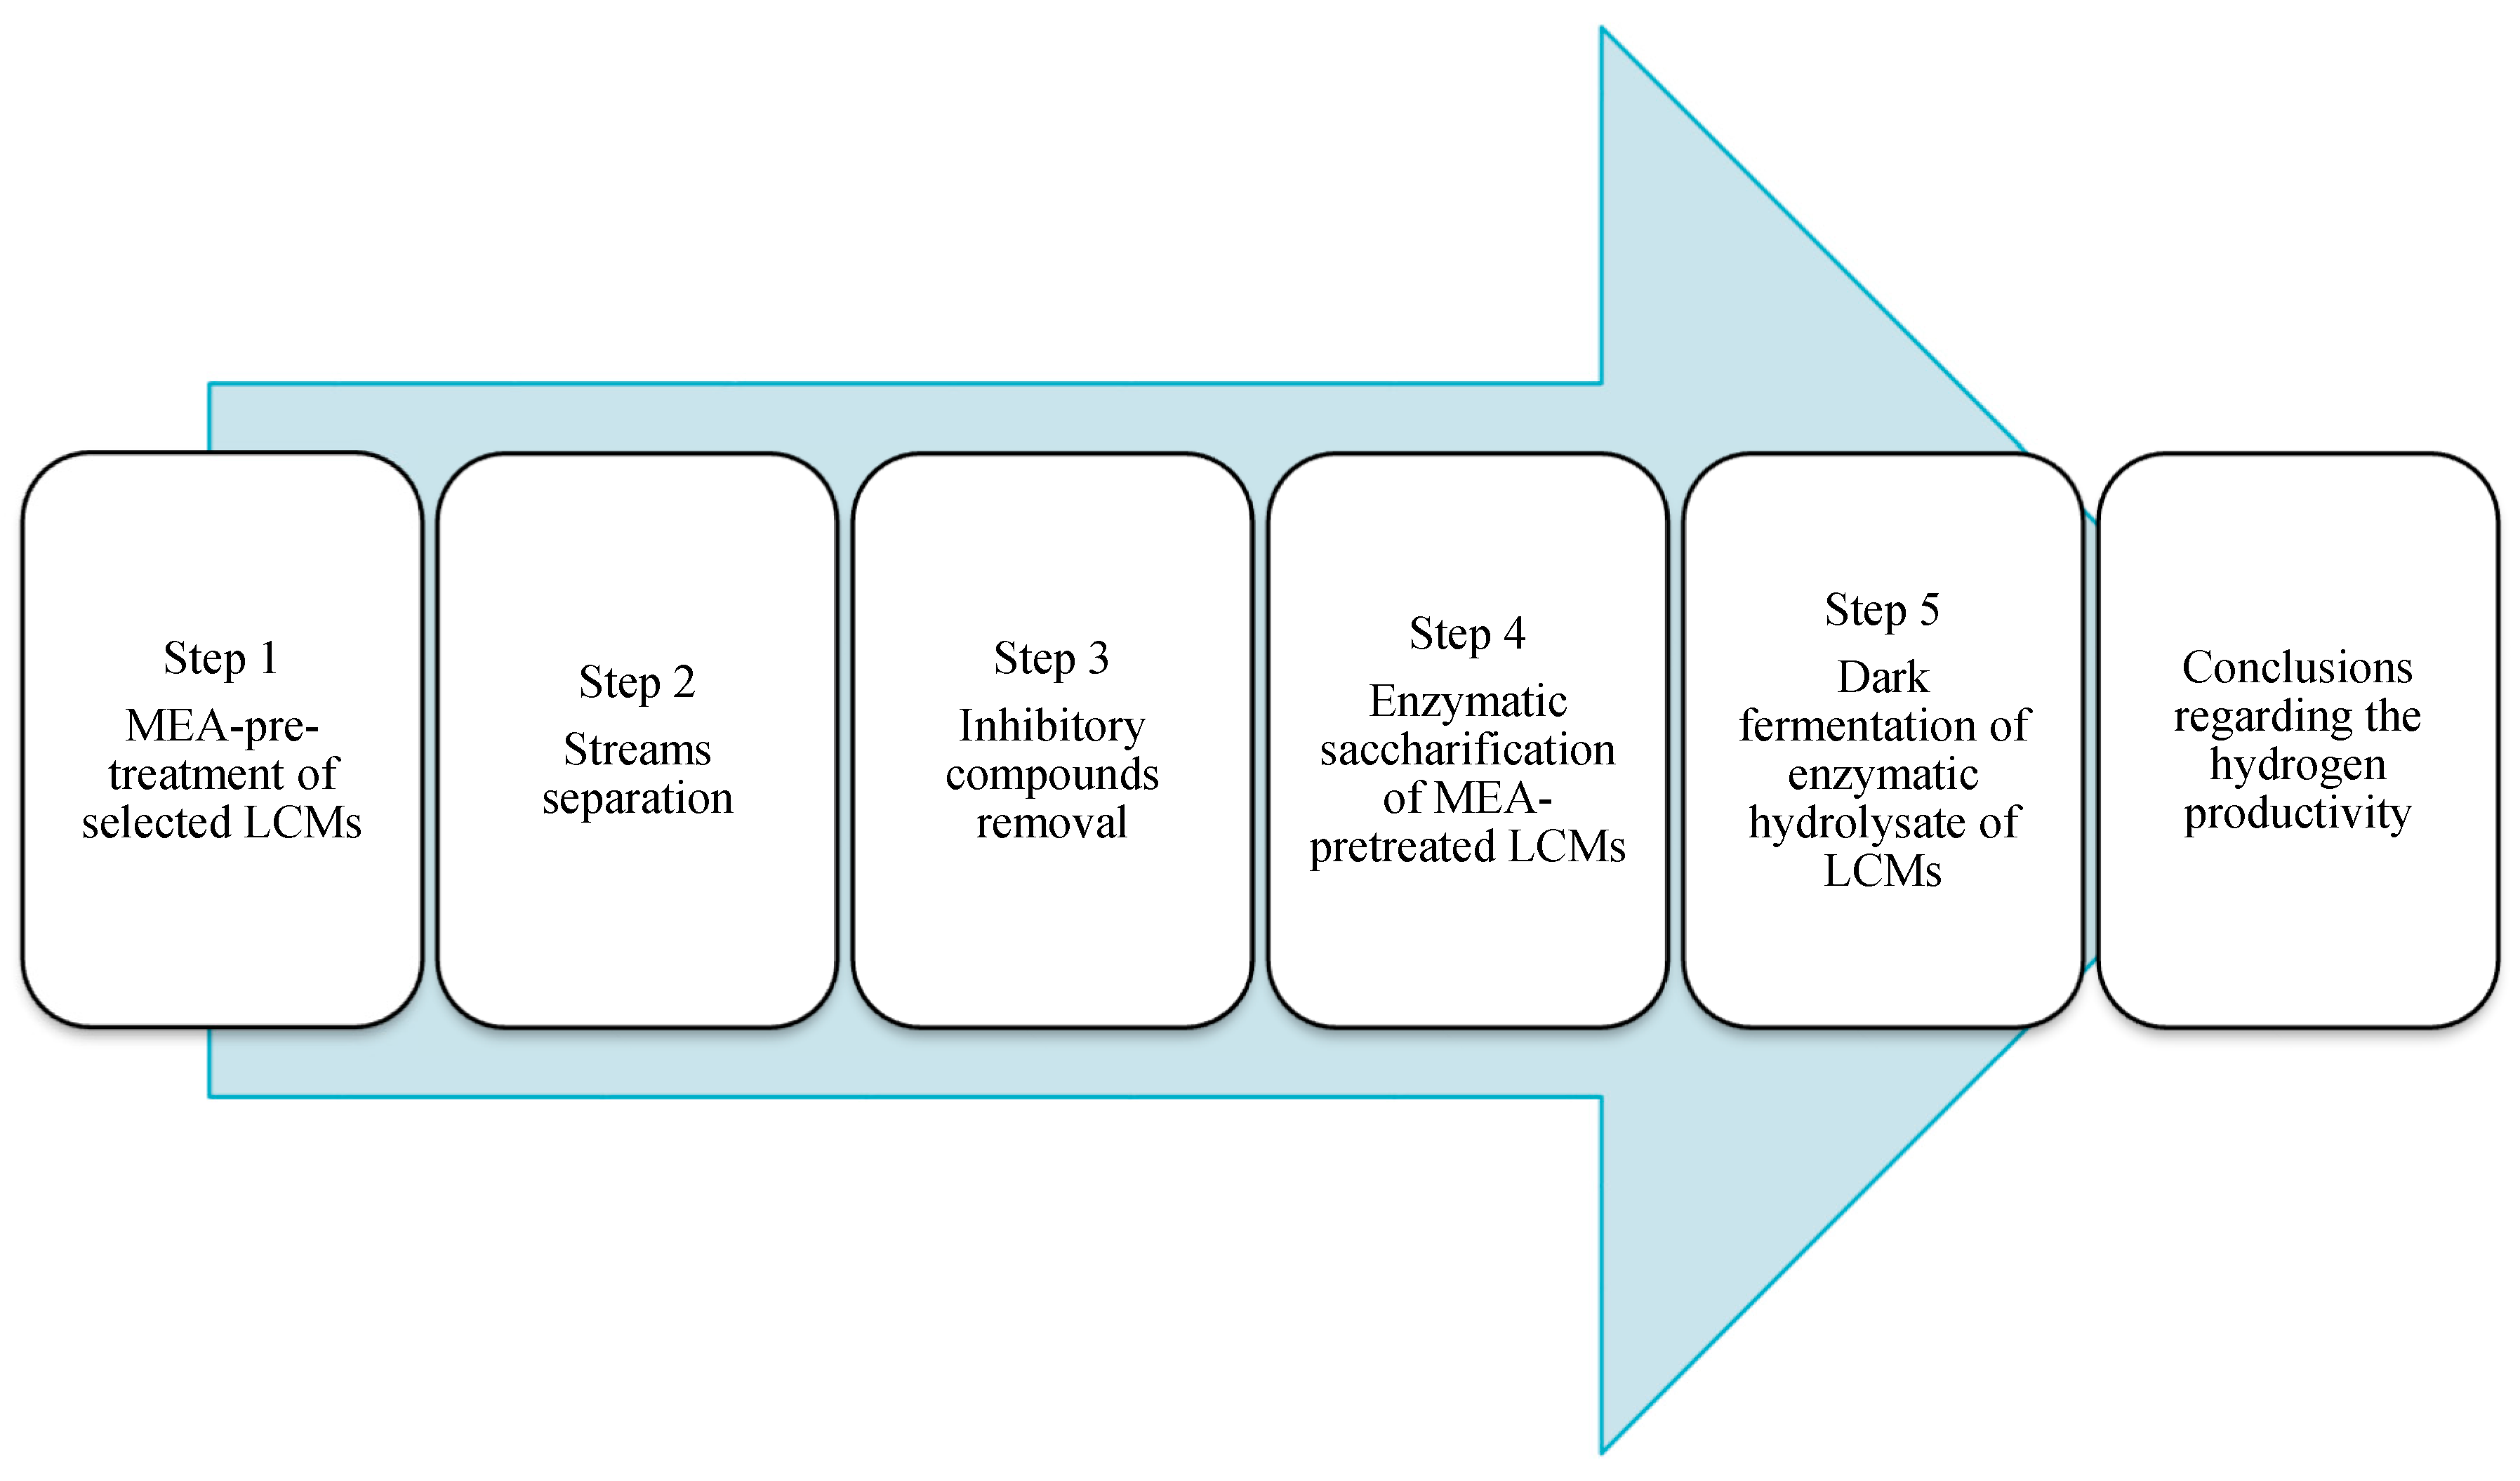
2.1. Design of Experiment

LCMs of different origin are diversified from the perspective of structural building components, i.e., lignin, hemicellulose and cellulose [31,32,33]. This is because comparison of the hydrogen productivity potential of different lignocellulosic materials in relation to the lignocellulosic biomass composition and the nature of the method used for their bioconversion is an interesting and valuable field of research. Therefore, the principle criterion used during the selection of the LCMs for this study was the content of cellulose, hemicellulose and lignin in biomass. On the base of the results published in our previous studies [34,35], we chose such LCMs as beech wood (B), energetic poplar wood (EP), energetic willow wood (EW), meadow grass (MG), corn cobs (CC) and triticale (TP). The content of cellulose is relatively higher in lignocellulosic material of EW than in other investigated LCMs. On the other hand, the content of cellulose in woods (EP and B) and in cereals (CC and TP) is comparable, but relatively higher than in the meadow grass (MG; see Table 1). However, it should be noted, that EW has also the highest content of lignin and all analyzed woods have higher content of lignin than investigated cereals and grass [35]. Moreover, no clear trend regarding hemicellulose content in the analyzed LCMs can be observed [30]. The content of hemicellulose is the lowest in EW, the highest in TP, and comparable in other analyzed LCMs [36,37]. Limit of detection (abr. LOD) is given in the tables footer.
Subsequently, selected LCMs were bioconverted to hydrogen using the method developed in our previous studies [10,30]. This method includes the following steps: alkaline hydrolysis of lignocellulosic material (step 1), streams separation (step 2), removing of cellulolytic enzymes inhibitors from residual biomass after pre-treatment (step 3), enzymatic hydrolysis of residual biomass (step 4) and dark fermentation of enzymatic hydrolysates of LCMs (step 5) used as a feed during the culture of Enterobacter aerogenes.
Several differences in the structure and organization degree of the biomass components are reported in the literature [38,39,40,41,42,43]. Therefore samples of all analyzed LCMs before and after the alkaline-pre-treatment step were also analyzed with scanning electron microscopy (SEM), in order to investigate and compare noticeable differences in the surface structure of LCMs.
In the case of Enterobacter aerogenes, glucose is a preferable carbon source for growth (carbon catabolite repression) [44]. Hence, in its presence the other carbohydrates present in enzymatic hydrolysates of LCMs should not be consumed as efficiently as glucose in dark fermentation. Although glucose may be a part of hemicellulose structure in lignocellulosic materials, its main source during the enzymatic hydrolysis step of LCMs is cellulose [30,45]. Therefore, it is assumed that high content of cellulose in LCMs and glucose in enzymatic hydrolysates of lignocellulosic materials used as a feed in dark fermentation should be positively correlated with yield of hydrogen production in this process. Hemicellulose can be also hydrolyzed enzymatically and besides the glucose it can be a source of other fermentable monosaccharides [46,47] i.e., xylose, arabinose and galactose consumed during dark fermentation of E. aerogenes. However, due to the carbon catabolite repression, their presence in enzymatic hydrolysates of LCMs should not significantly affect the rate of growth of the bacterial culture and the yield of hydrogen production during the dark fermentation. On the other hand, it is crucial to note that hemicellulose and lignin present in the material are the sources of inhibitors of the cellulolytic enzymes that arise at the alkaline pre-treatment step [48]. Therefore, it is important to effectively remove the resulting inhibitors from the remaining biomass after the pre-treatment. Their presence at the LCMs enzymatic hydrolysis step would have a negative effect on the amount of glucose released from cellulose, and other carbohydrates released from hemicellulose.
Concluding, in the light of above presented data and assumptions, in these studies we focused on the analysis of: (i) the content of lignin, cellulose and hemicellulose in analyzed LCMs before and after the pre-treatment (step 1, 2), (ii) the presence of inhibitors of cellulolytic enzymes in LCMs hydrolysates after pre-treatment and in the residual biomass of LCMs (step 3, 4) after solid residue washing and (iii) the growth rate and yield of hydrogen production for model organism E. aerogenes (step 5) and their correlations with concentration of glucose and others fermentable sugars in LCMs enzymatic hydrolysates. Finally, the collected data allowed us to assess the suitability of the method used with different LCMs and pointed the possible directions of its further development. Due to the collection of large data sets during research on LCMs characterized by the different structures of lignocellulosic matrixes and the different contents and compositions of lignins and hemicelluloses, authors applied chemometric methods to draw global conclusions regarding the usefulness of performed process and possible directions for its further development.
The overall scheme of the design of the experiment (DOE) is presented in Figure 1.

2.2. Effect of MEA Pre-Treatment on the Biomass Content and Structure

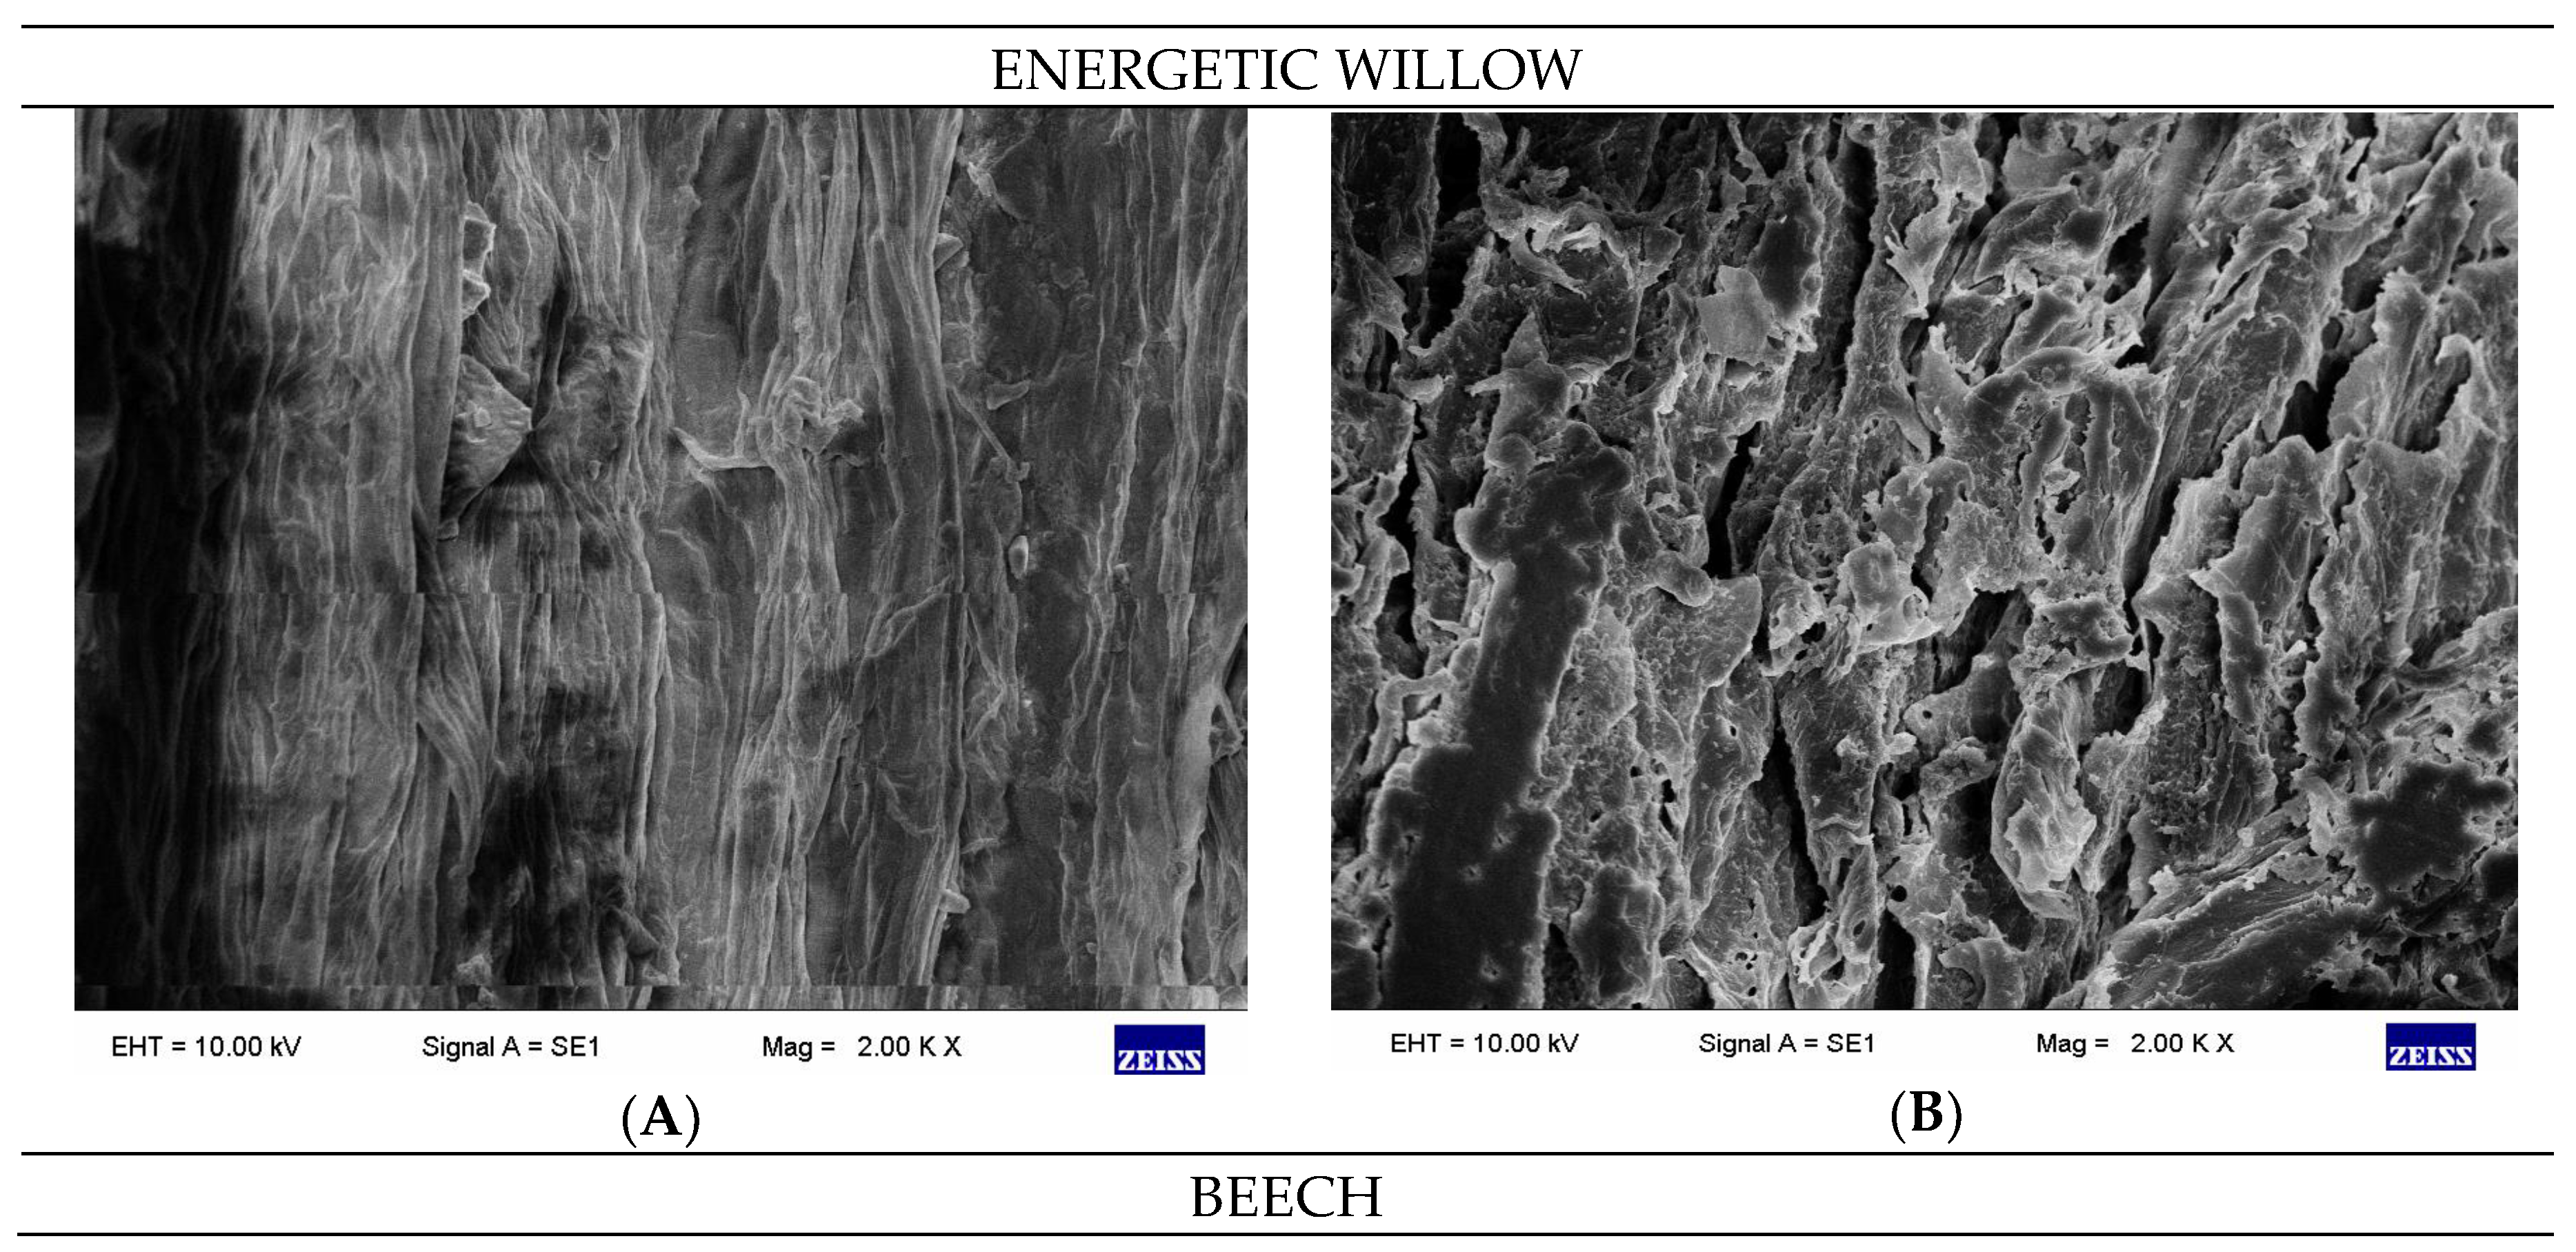
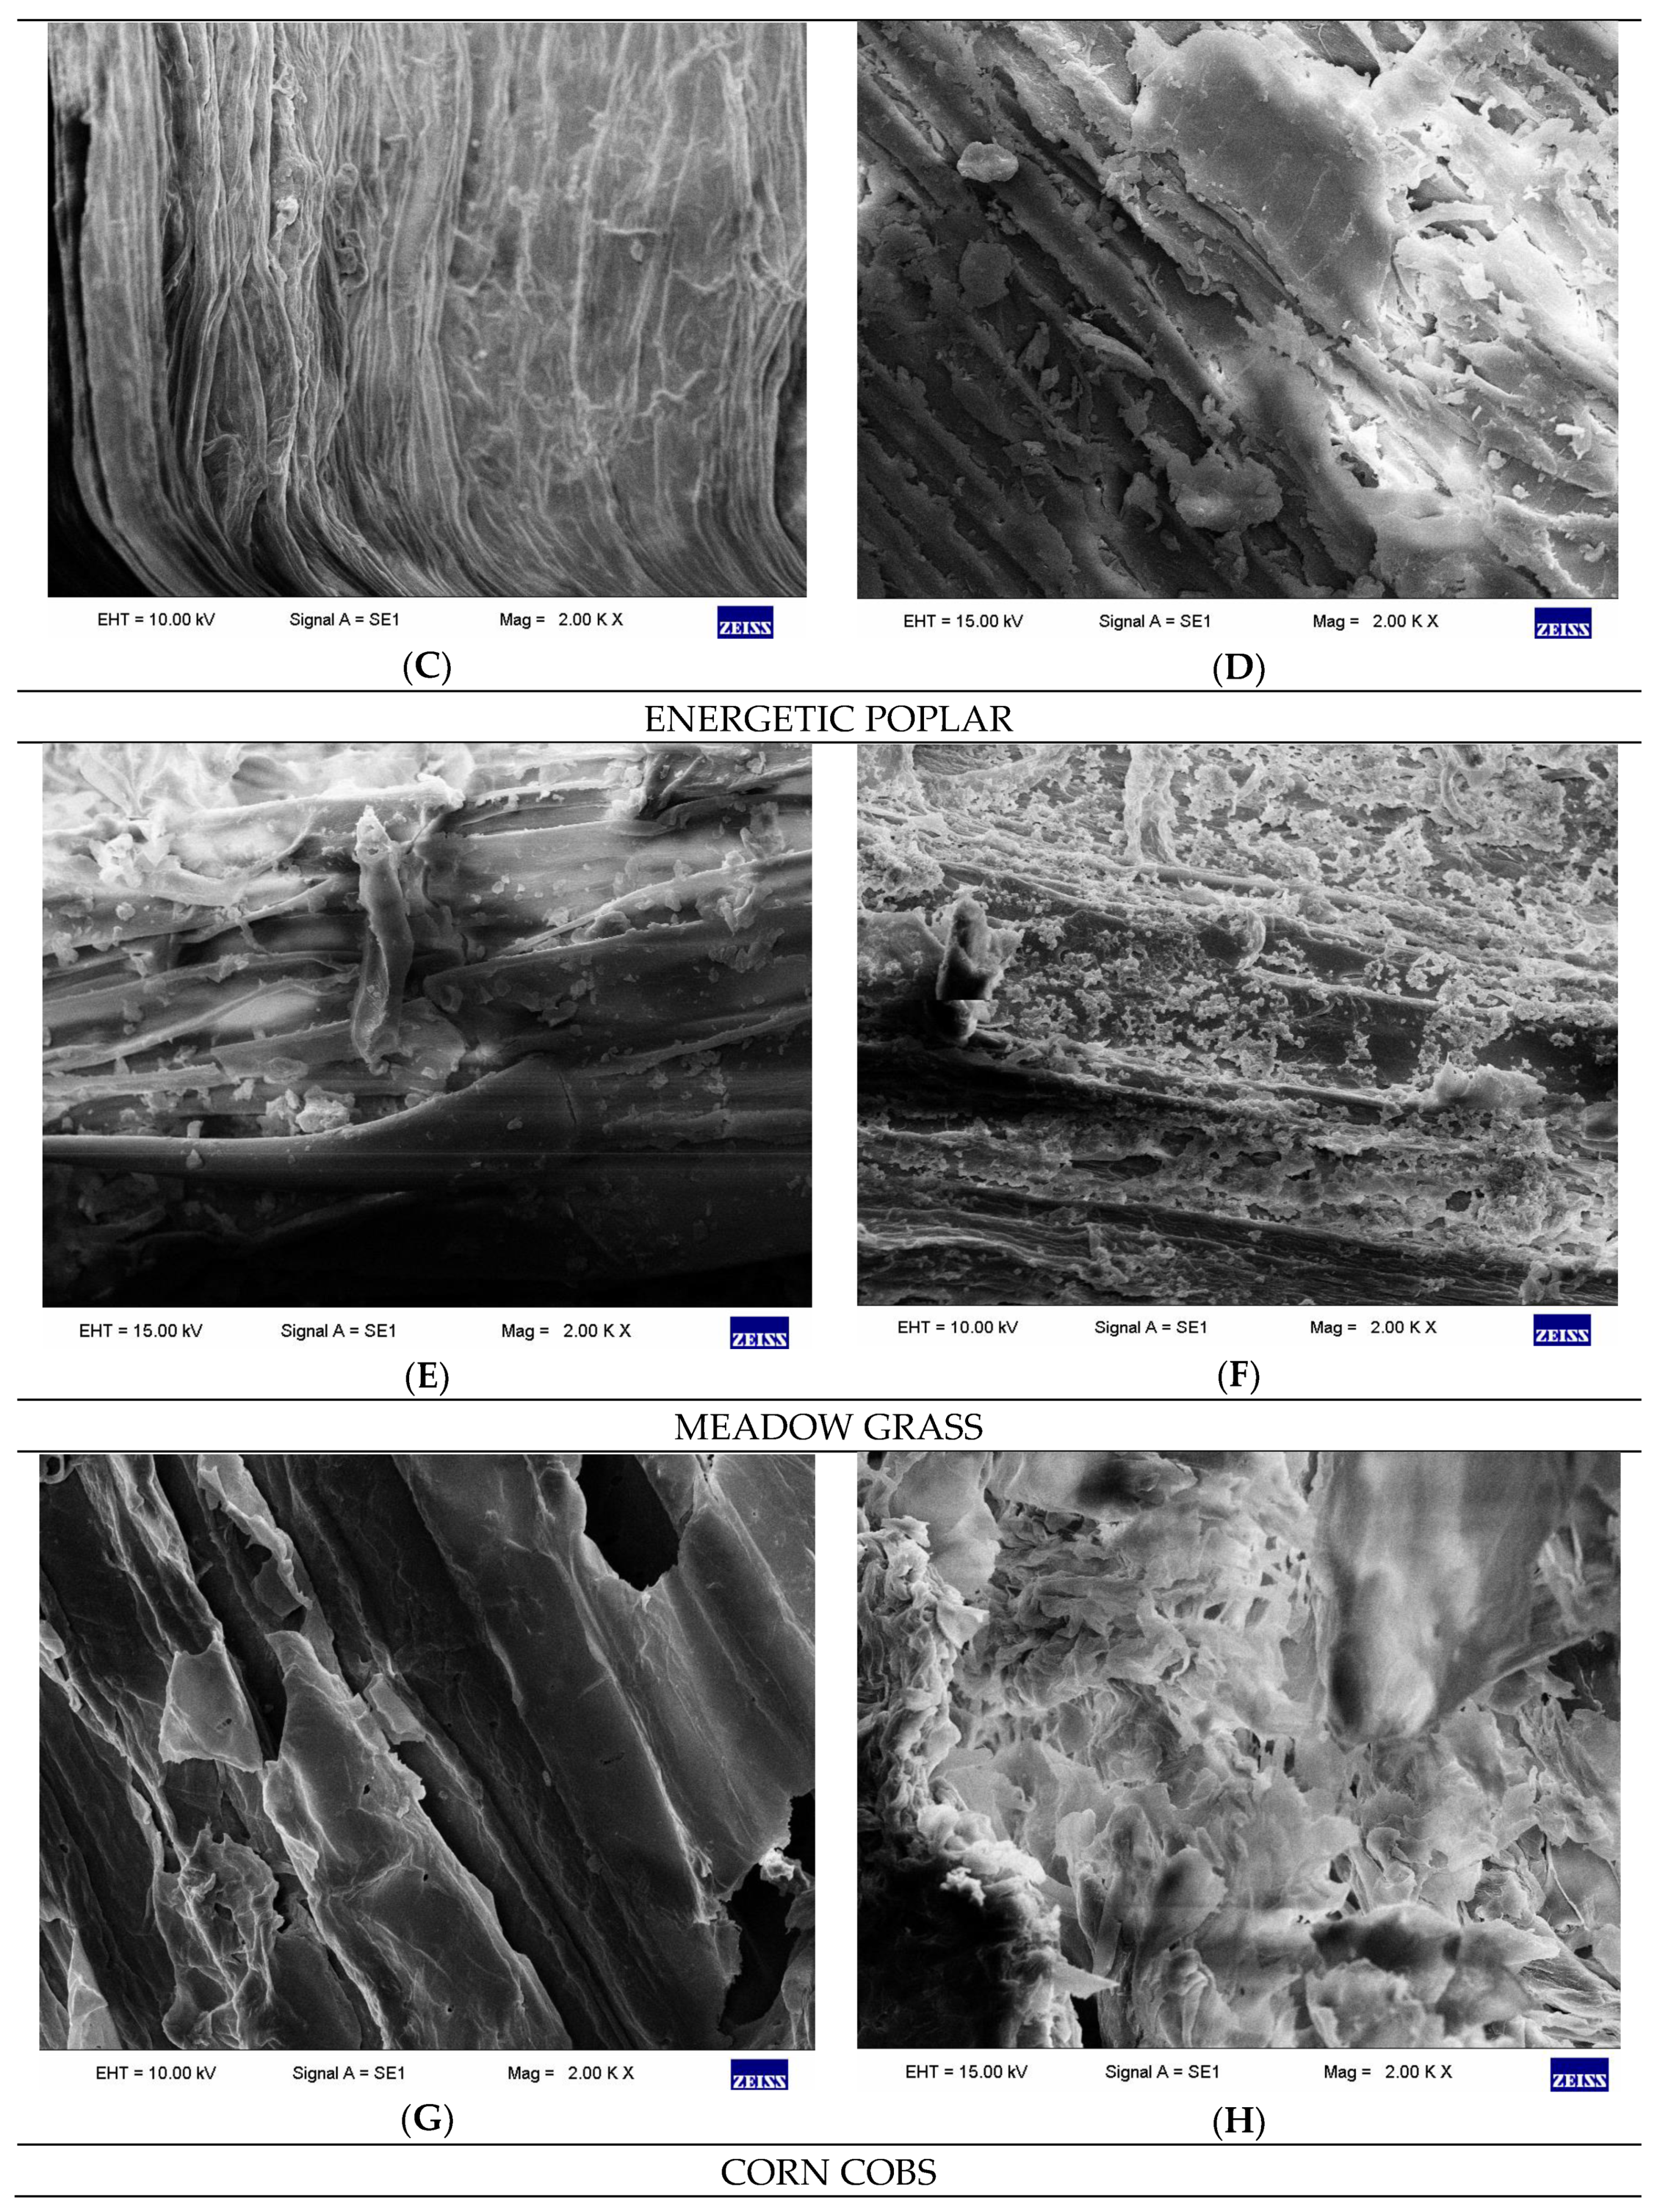
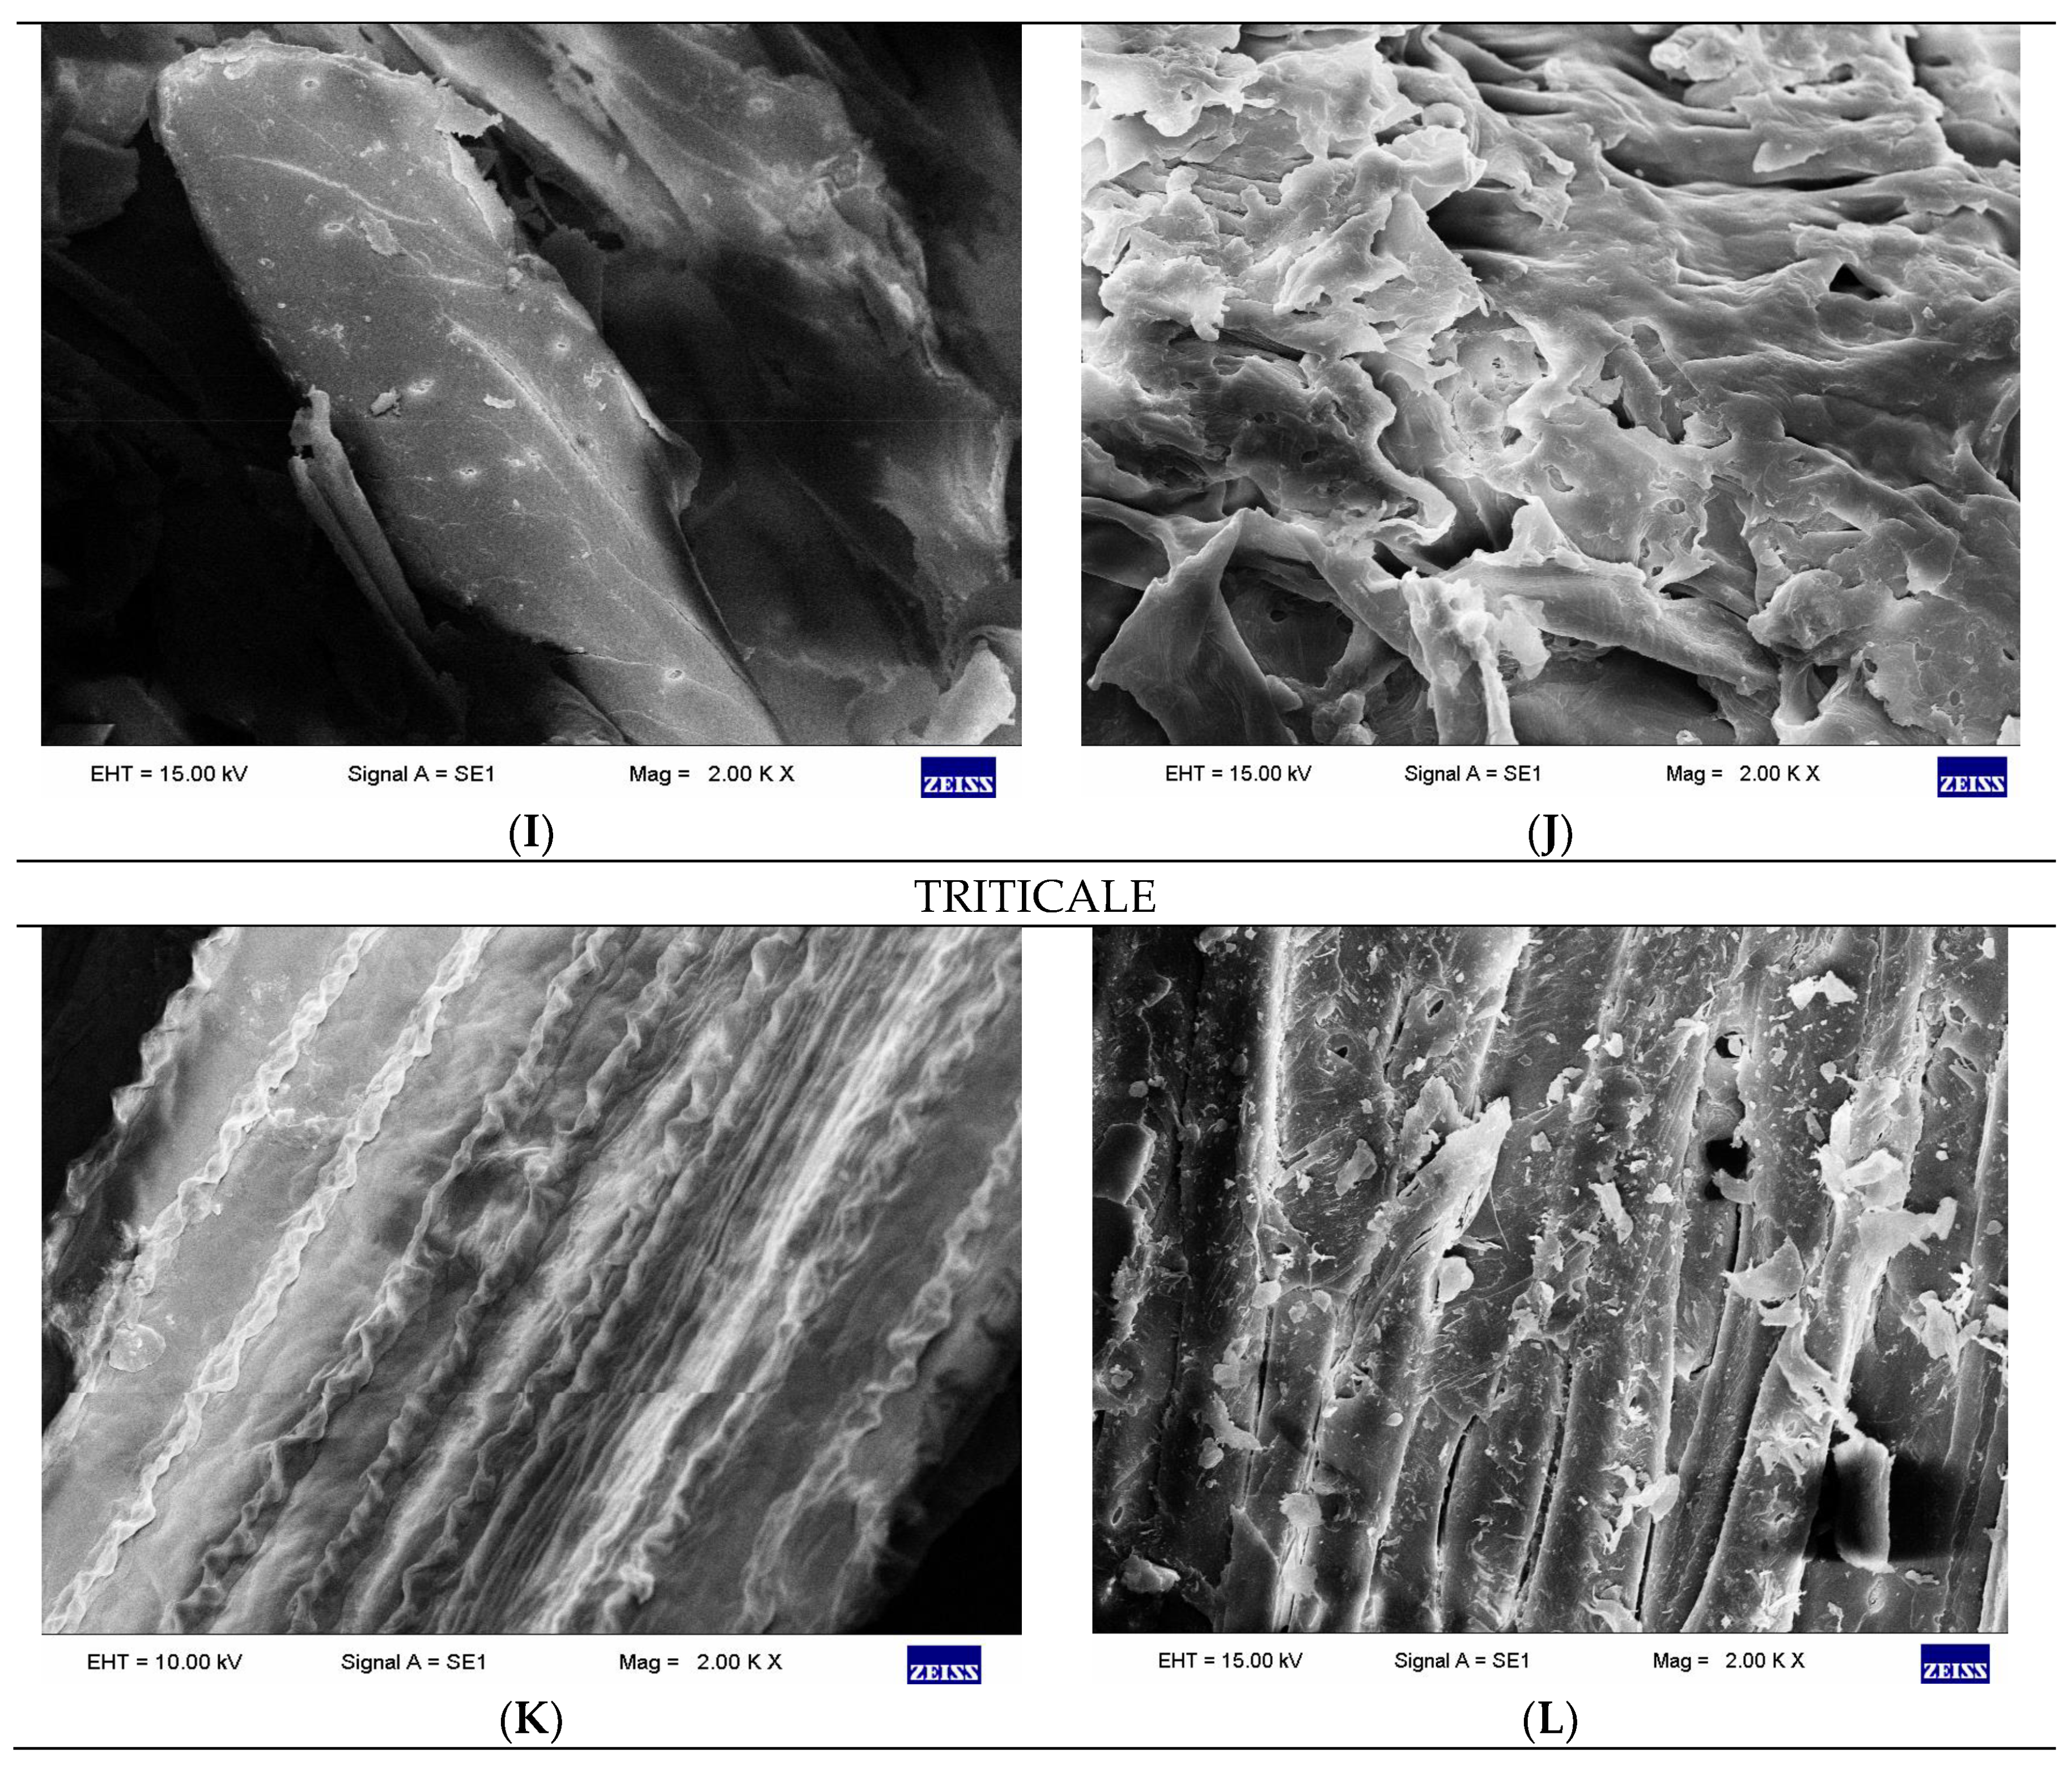
2.2.1. Structural Changes in Biomass During MEA Pre-Treatment

It may be assumed, that the properties and availability of cellulose for enzymes is an individual feature depending on the structure and way of linking of the particular elements of lignocellulose in each analyzed biomass. Certain structural differences of LCMs surfaces before and after the alkaline pre-treatment can be observed on the basis of SEM pictures [38,40,43,49], Figure 2.
Even an approximate analysis of SEM images relating to each of the investigated lignocellulosic material surface structure before and after the alkaline treatment with MEA allows observing changes in LCMs, which can be a result of the applied pre-treatment. In each of the presented cases and for each of the materials used, numerous cracks on the surface occur, which is probably related to the delignification of each biomass. Supposable, the structures in which the lignin was located peripherally were more scarified (Figure 2). Obtained results corresponded with those presented in [38], where the authors have shown droplets on the biomass surface and the changes of the biomass structure due to the isolation and migration of lignin.
Interestingly, there were significant differences in the composition and structure of lignin among plants. Up to now lignin has been classified into three groups: gymnosperm (softwood), angiosperm (hardwood) and grass lignin [38,50]. However, depending on the criterion, Towers and Gibbs suggested [51] that lignin should be categorized into two groups: guaiacyl lignin and guaiacylesyringyl lignin due to its overall chemical constitutions. Scanning electron microscopy is not able to provide the detailed feature of the materials under examination. However it may be a good tool to observe the lignin distribution within the biomass and the overall changes occurring in the structure during the pre-treatment. As can be conducted on the basis of Figure 2, straw type lignin, i.e., removal of lignin present in CC, TP and MG causes higher scarification of the surface in comparison with EP, B or EW during pre-treatment. This conclusion matches the conclusions presented in [52], where the authors concluded, that the physicochemical properties of straw lignin are known to be different from those of softwoods or hardwoods, due to its higher solubility in alkaline solutions. The type of the source from that lignin is obtained and the method of extraction has a strong bearing on its properties [52].

2.2.2. Changes in Content of Six Different Lignocellulosic Biomasses After MEA Pre-Treatment

In order to determine the effect of the pre-treatment with MEA on diversified biomass residues, their composition i.e., lignin, cellulose and hemicellulose content, were determined in raw materials and materials after alkaline pre-treatment applying NREL methods (see Section 3.1, please). Although the composition of the raw materials was previously determined during our previous research [35], we decided to define it again. First of all, we used a new portion of lignocellulosic materials for this research. Secondly, we took them from containers in which they were stored for a period of ca. 12 months from their preparation from environmental samples of trees, cereals and grass (Materials and Methods). After analysis we found that there were no differences in composition of new portions of analyzed LCMs compared to those published in [35] greater than the scope of the measurement error (Table 1). We concluded that the conditions of LCMs storage had no negative impact on their composition. Moreover, the method used for preparing of LCMs materials (milling and mincing) for storage allowed us to correctly randomize and ensure homogeneity of the stored biomass samples.
In Table 1 the content of cellulose, hemicellulose and lignin in all analyzed LCMs determined before and after alkaline pre-treatment with MEA is presented. Although, the cellulose was not hydrolyzed under mild conditions of alkaline MEA-pre-treatment in LCMs of analyzed woods (EW, B and EP), we found a slight decrease in cellulose content for analyzed LCMs of cereals (CC and TP) and grass (MG) after the pre-treatment step (Table 1). Moreover, in all analyzed LCMs we found that hemicellulose and lignin were hydrolyzed. Hemicellulose removal after pre-treatment in LCMs characterized by comparable content of hemicellulose (B, EP, MG and CC) was also comparable. Moreover, the lowest and highest removal of hemicellulose was obtained for materials with the lowest (EW) and the highest content (TP) of hemicellulose, respectively. However, it is worth to note, that the main goal of this step was an effective removal of lignin from LCMs and the partial removal of hemicellulose is a “side effect” of the alkaline pre-treatment, which leads to a loss of glucose and other fermentable sugars present in hemicellulose molecules. Interestingly, although the pre-treatment method was optimized for lignin removal from wood (EP) [35], the highest degree of lignin removal was achieved for LCMs of cereals i.e., CC and TP (Table 1), materials characterized by remarkable lower lignin content than analyzed woods, which corresponds to literature data [52]. However, for meadow grass, which contains more lignin than CC but not more than TP, lignin removal was almost the same (~80%) as for woods. Moreover, it is worth to note that for MG the removal of cellulose was also the highest (1.4%). On the other hand, it seems that the removal of lignin from woods (EP, EW and B) under conditions of MEA-pre-treatment optimized for EP [35] is limited. After this step, the lignin (5–6%) present in these LCMs may have a negative impact on the contact of cellulolytic enzymes with cellulose and hemicellulose. In conclusion, the presented data seem to confirm that the structure and chemical composition of lignin and hemicellulose present in the lignocellulosic material is more important to design the process of its bioconversion than the proportion between the cellulose, hemicellulose and lignin content in this material.
Differences in the structure of materials discussed in the chapter regarding structural changes in biomass during MEA-pretreatment (Section 3.2) correspond with the observations regarding the changes occurring in the biomass content. It can be stated that not only the proportion between lignin, hemicellulose and cellulose determine the delignification efficiency, but also differences in the solubility of lignin in alkaline solutions, due to diversified structure, have a strong influence on the solid state residue content.
In the light of data presented in Table 1, it seemed that EW (highest content of cellulose) and CC or TP (high cellulose content and the lowest content of lignin) after pre-treatment seemed to be the best LCMs for bioconversion to hydrogen via dark fermentation. However, there is another parameter that seemed even more important for bioconversion process. The MEA-pre-treatment led to partial hydrolysis of LCMs. Hence, after this step two fractions were obtained: solid and liquid, which had to be separated before the next step of bioconversion process (liquid fraction contains inhibitors of cellulolytic enzymes). In this case, for hydrogen production, only solid fraction was valuable. In theory, the smaller the loss of mass of lignocellulosic material after the pre-treatment step, the greater its potential for use in the hydrogen production process. That is why we also analyzed the weight loss of lignocellulosic materials after pre-treatment (Table 2).
After analyzing the data presented in Table 2, CC and TP ceased to appear as attractive lignocellulosic materials for use in the hydrogen production process by means of biomass bioconversion. At this step, EW characterized by the highest content of cellulose and the lowest loss of mass after the pre-treatment step, seemed to be the best candidate for this process. Moreover, the data analysis presented in Table 1 and Table 2 showed that the conditions of pre-treatment optimized for EP [30] allowed to obtain the same delignification rate and comparable loss of hemicellulose content and mass loss of biomass for all analyzed woods, i.e., EP, EW and B.
It probably results from the fact that these lignocellulolytic materials, so-called “soft woods”, contained hemicellulose and lignin with a similar structure and chemical composition.

2.2.3. Inhibitory Compounds Formation During Alkaline Hydrolysis

In our previous work [53] we omitted two important analyses. Firstly, we did not check the presence of cellulolytic enzymes inhibitors, which were formed during alkaline pre-treatment, in obtained hydrolysates of EP. Secondly, we did not check if the method of washing of residual biomass after pre-treatment step allowed for a successful removal of these inhibitors from residual EP biomass subjected to enzymatic hydrolysis. Due to the above, the authors decided to carry out the mentioned analyzes and drew appropriate conclusions in this paper.
The presence of levulinic acid, HMF, furfural and total phenolic compounds (abr. TPC, the presence of the TPC is correlated with the presence of phenolic compounds in conversion to vanillin), recognized inhibitors of cellulolytic enzymes and fermentation [54,55,56] was confirmed in alkaline hydrolysates of Moringa oleifera biomass, kitchen waste and rice straw [57,58,59]. During alkaline hydrolysis, TPC are products of lignin hydrolysis [60,61,62]; while HMF and Furfural are formed as a result of undesirable chemical transformation of xylose released from partially degraded hemicellulose [63]. In this study, the analysis of MEA hydrolysates composition also confirmed the presence of HMF, furfural and phenolic compounds in all analyzed hydrolysates (Table 3).
Moreover, after the pre-treatment, significantly higher concentrations of all tested inhibitors were found in CC, TP and MG hydrolysates than in woods hydrolysates: EP, EW and B. Interestingly, the high concentration of HMF in CC, TP and MG hydrolysates indicates the possible use of these materials and the presented pre-treatment method for biorefining process. Currently, HMF may be converted to numerous compounds [64], gas fuels or fuel additives, building blocks for the production of polymeric materials. To date, biorefinery based synthesis of HMF may be advantageous as it improves the use of biomass raw materials [65,66,67]. In addition, due to the significant weight loss of these LCMs after pre-treatment (Table 2), the need to effectively remove HMF and other inhibitors (Table 3), these lignocellulosic materials did not seem to be as attractive for use in the production of hydrogen through dark fermentation as we assumed at the beginning of the study. However, in our opinion, the analysis of the data presented in Table 2 and Table 3 allowed drawing the opposite conclusions for B, EW and EP LCMs.
Due to the presence of the enzymatic inhibitors in alkaline hydrolysates for all tested LCMs, it was necessary to check their presence in residual biomass after their removal. The results presented in Table 3 show the lack of inhibitors in analyzed enzymatic hydrolysates. It means that the method used to separate alkaline hydrolysates from lignocellulosic residues, developed during our previous study [30], allowed the effective removal of these inhibitors from these residues before their enzymatic hydrolysis.

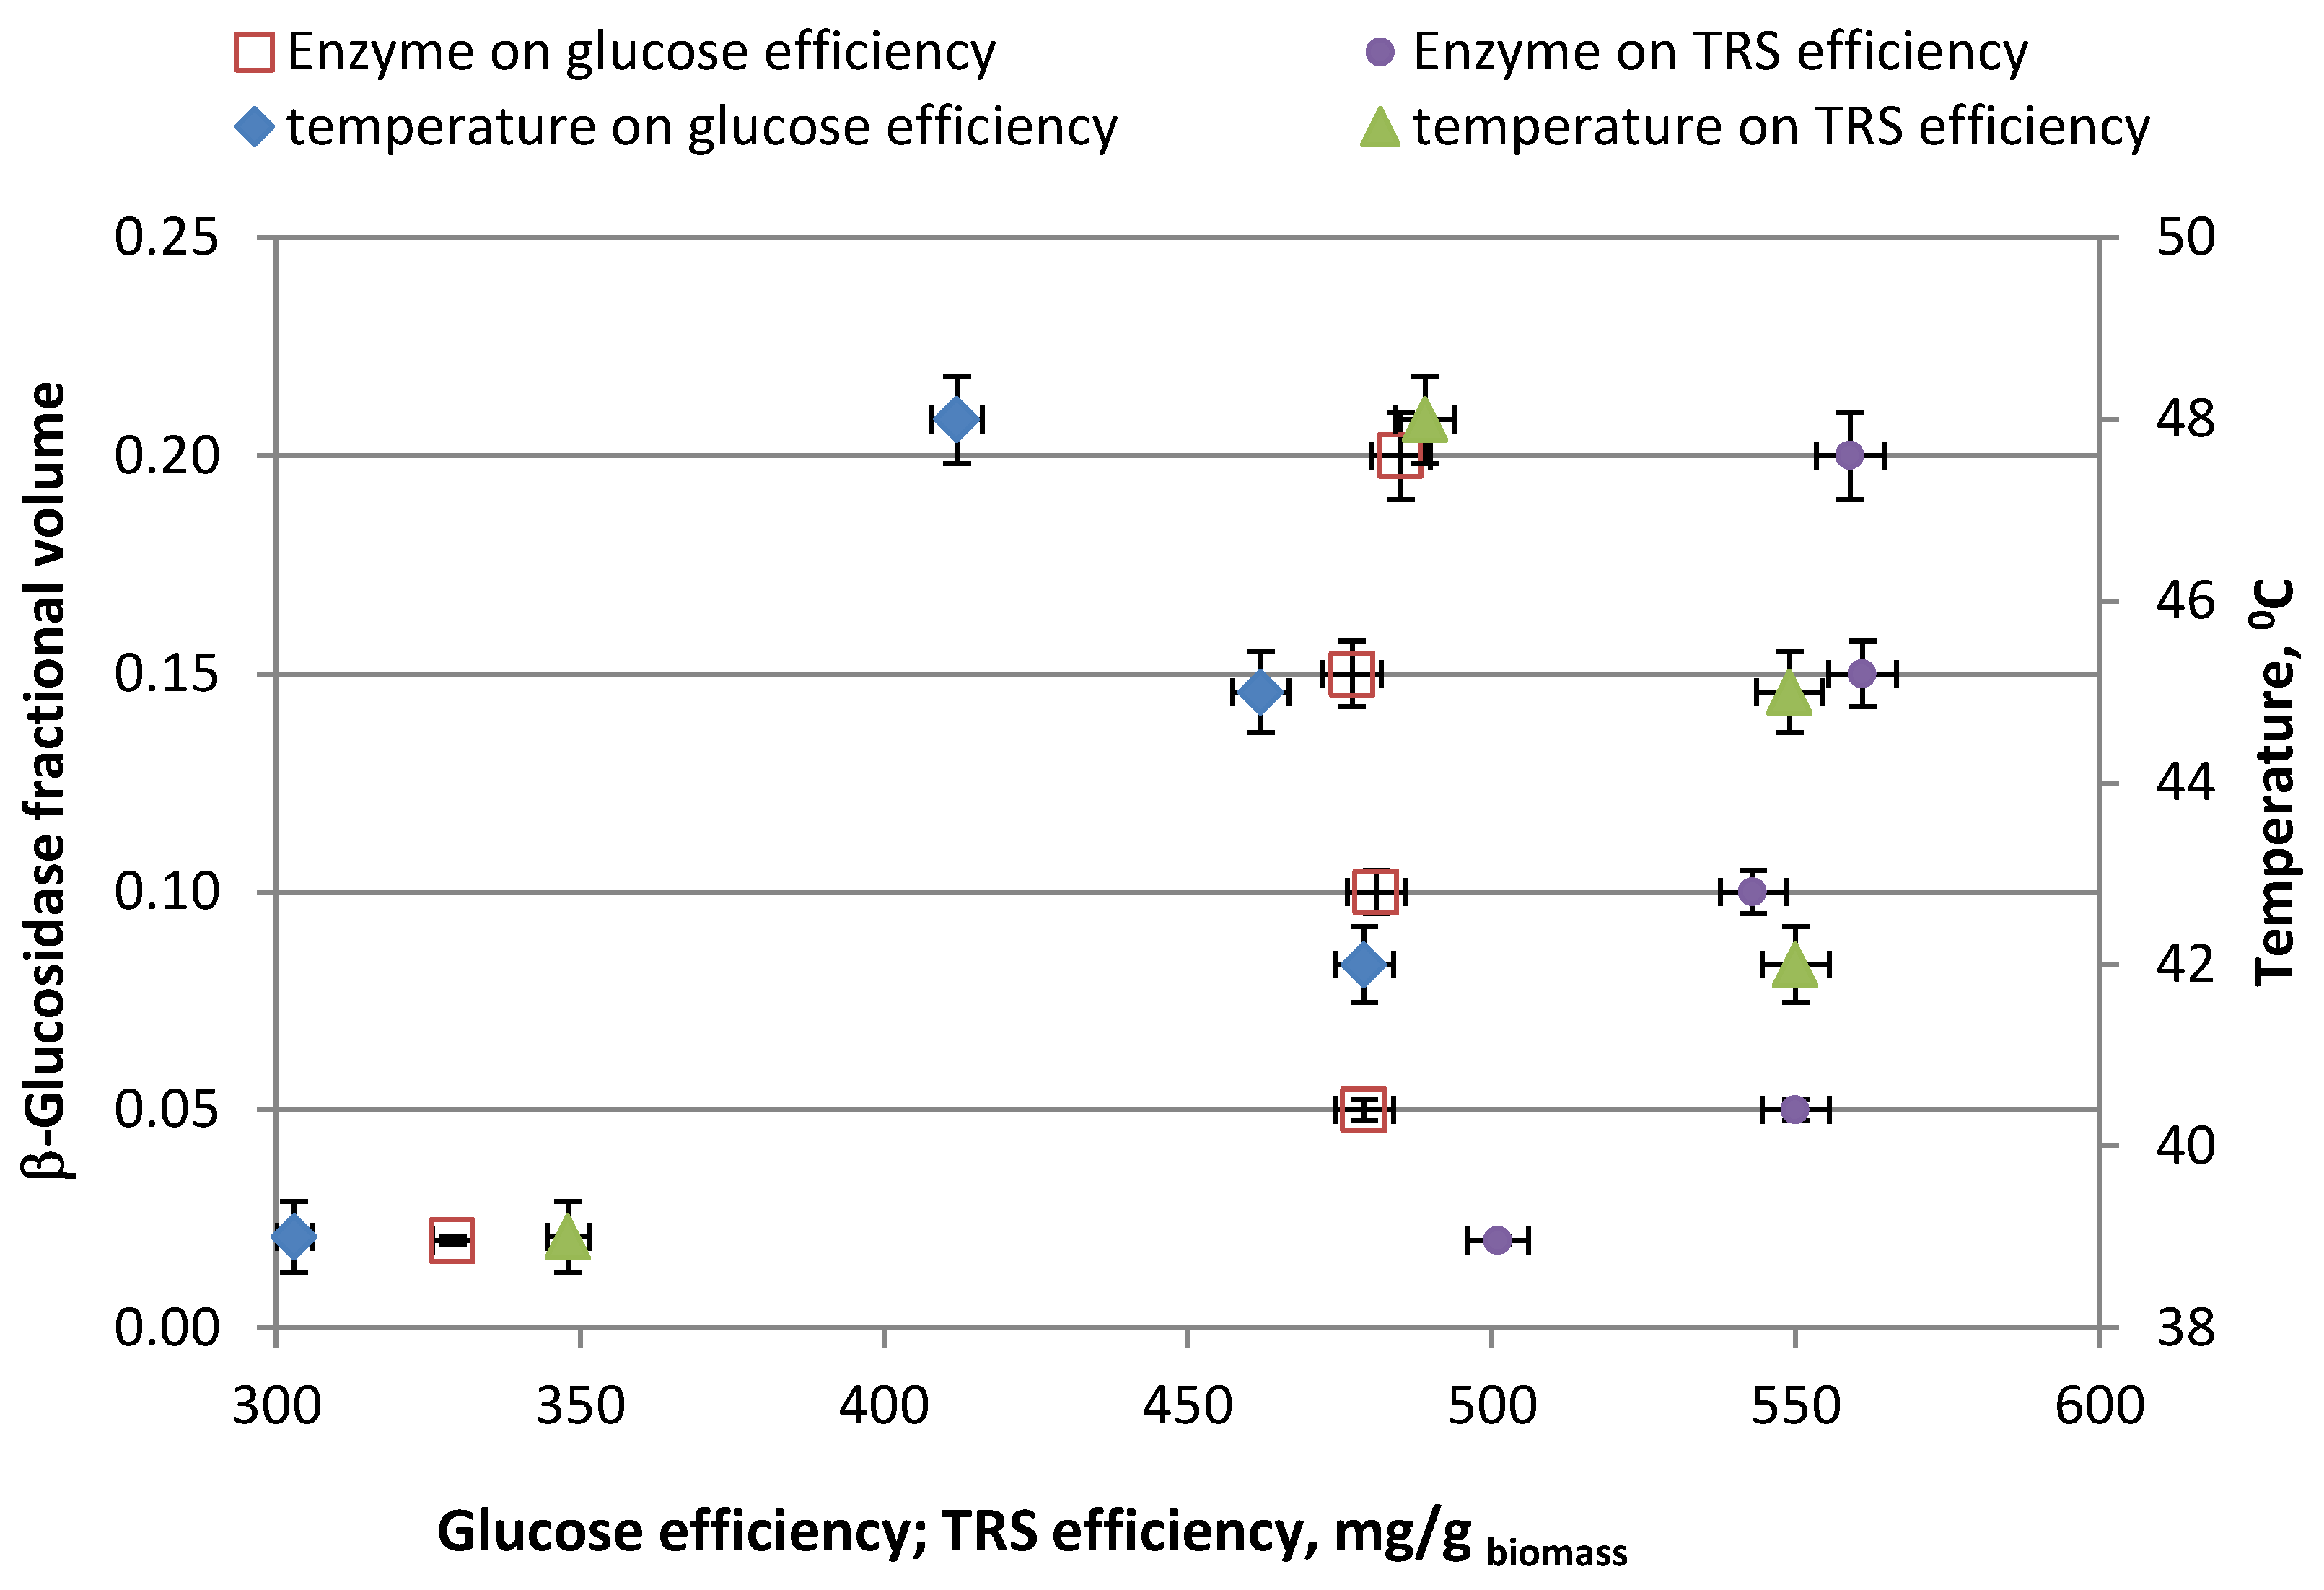
2.2.4. Enzymatic Hydrolysis Method Development

In our previous study, MEA-pre-treated EP solid residues were enzymatically hydrolyzed to determine YTRS (the amount of total reducing sugar) and glucose yields, the parameters important for analysis effectiveness of E. aerogenes growth cultures and hydrogen productivity, respectively. However, in contrast to the previous model study [30,49,68] we decided to optimize the composition of enzymatic cocktail used during this step. As noted in the introduction, the cost of enzymes used during the enzymatic hydrolysis step significantly affects the total cost of the entire bioconversion process [30,69]. Since the cellobiase (β-glucosidase from Aspergillus niger, Sigma-Aldrich, Darmstadt, Germany) is four times more expensive (in conversion on enzyme activity) than cellulolytic enzymes cocktail from Aspergillus niger (viscozyme L, Sigma-Aldrich), the authors decided to determine the smallest required amount thereof to create a mixture of enzymes to allow the effective hydrolysis of energetic poplar, comparable to that achieved in our previous work (comparable total reducing sugar (TRS) yields) [30]. For this purpose, the enzymatic cocktail, which fulfilled the presented criteria, was chosen on the basis of a comparison of the total glucose yield for five different proportions of the enzyme cocktail at four different temperatures, after 24 h enzymatic hydrolysis of EP (Figure 3).
It occurred that the highest value considering glucose (and TRS) efficiency was obtained in 42 °C when the proportion of viscozyme to β-glucosidase from Aspergillus niger was equal to 0.95:0.05. Since no more glucose was released when the β-glucosidase from Aspergillus niger content was increased above 0.05, and the cost of this enzyme was higher, than for viscozyme, the authors proceeded to test the temperature influence using the defined mixture. These results correspond with the results obtained in our previous work [30]. It occurred that obtained results represent the highest glucose efficiency for temperatures from 42 to 45 °C. Since heat energy cost affects the overall cost of hydrogen generation, a temperature equal to 42 °C was chosen for further experiments. The results obtained for the saccharification of alkaline hydrolysates show that the model obtained for EP was applicable for lignocellulosic materials of other origin. It seems, however, that by means of further enzymatic hydrolysis tests, it should be confirmed whether the elongation of enzymatic saccharification time has a beneficial effect on the obtained YTRS values. On the basis of the analysis of the data contained in Table 1 and Table 2 and the mass of LCMs residues after the enzymatic hydrolysis step it can be concluded that, especially in relation to woods in the source sample, there was an unhydrolyzed amount of cellulose. Noticeable content (ca. 20%) of unhydrolyzed biomass contained between the diatomaceous earth particles was observed after enzymatic hydrolysis and might still be substrate for cellulolytic enzymes. However attempts to separate these particles failed and therefore an approach for the enzymatic hydrolysis method development needs to be conducted. In the light of presented disadvantage of recently developed method we are planning to use the magnetic core immobilization to improve the enzyme recovery after saccharification. This approach is known, however not widely applied for cellulolytic enzymes [70].

2.2.5. Enzymatic Hydrolysis of Pre-Treated Lignocellulosic Materials

Application of viscozyme L and β-glucosidase from Aspergillus niger (0.95:0.05) in the enzymatic hydrolysis step (DOE, step 4) allowed us to obtain the mix of sugars, which are products of the decomposition of cellulose and hemicellulose of analyzed LCMs (Table 4).
Despite the differences in the lignin content in the investigated LCMs after the pre-treatment step (Table 1), the applied enzymatic hydrolysis process parameters allowed us to hydrolyze about 80% of the total weight of all LCMs tested. Since the differences in the content of lignin remaining after the alkaline pre-treatment step in analyzed LCMs did not seem to have a significant effect on the LCMs biomass enzymatic hydrolysis, one should consider optimizing other process conditions. The duration or the number of enzyme units seemed to be of great importance. On the other hand, the economically optimized composition of the enzymes was characterized by a low content of β-glucosidase (at the level of 240 U/g of hydrolyzed biomass). Despite the relatively small proportion of this enzyme, the results shown in Table 4 indicate that this amount of enzyme appeared to be sufficient to efficiently hydrolyze cellobiose to glucose. This is important because the cellobiose resulting from the hydrolysis of cellulose by endocellulases and exocellulases may inhibit their further action, which affects the efficiency of the entire process of hydrolysis of cellulose to glucose [18].
Moreover, the results presented in Table 4 show that cellulolytic enzymes hydrolyzed not only cellulose, but also hemicellulose. This is evidenced by the presence of xylose, arabinose, mannose and galactose in the enzymatic hydrolysates. Moreover, in the case of LCMs hydrolysis, i.e., EP, MG, CC and TP, which contained similar amounts of hemicellulose, and significantly higher amounts of cellulose compared to MG, a difference in the content of xylose and galactose can be seen. In the enzymatic hydrolysate of MG the content of both mentioned sugars was higher than in the hydrolysates of EP, CC and TP. However, despite the similar cellulose and hemicellulose content in solid state residues after the alkaline pre-treatment (Table 1) in EP, CC and TP, there were noticeable differences in the amount of glucose present in the hydrolysates of the mentioned materials (Table 5). It could be explained by the fact, that beside cellulose, also hemicellulose is the source of glucose in this case. Despite the slightly lower cellulose content in TP than in CC (Table 1), the glucose content in the TP hydrolysate was significantly higher than in the CC hydrolysate (Table 4). In addition, the CC hydrolysate had a significantly higher xylose concentration than in the TP hydrolysate (Table 4). On the other hand, similar hydrolysis results were obtained (content of glucose and xylose, Table 4) for all examined “soft woods”, i.e., EP, EW and B. In conclusion, it appears that these results indicate that the composition of hemicellulose as well as the structure of cellulose and hemicellulose fibers (in the studied trees, this structure is similar but different from the investigates cereals [51]) has a decisive influence on the composition of the total reducing sugar amount and glucose content in enzymatic hydrolysates of analyzed LCMs. However it did not correspond with the efficiency of the hydrolysis process itself, since maintaining the ratio of enzyme units in the mixture to the weight of hydrolyzed LCMs after 24 h of enzymatic hydrolysis, allowed obtaining a comparable degree of hydrolysis for each of the analyzed LCMs (up to ca. 80%). Therefore it could be concluded, that the enzymatic hydrolysis might require further optimization, which the authors intended to perform during future research.

2.3. Dark Fermentation

2.3.1. Process Parameters

Hydrogen production experiments are based on the mesophilic dark fermentation technique carried out periodically in triplicates under anaerobic conditions. Hydrogen production is a process that strongly depends on many factors, including the composition of the fermentation charge, substrate concentration, pH value and temperature [71]. Mentioned process parameters were monitored and controlled at set points during the experiment. Importantly, the total sugar concentration (see Table 4), utilized as a sole carbon source by Enterobacter aerogenes, in the initial fermentation broth was set as 5.5 g/L for each analyzed hydrolysate. For this purpose, appropriate volumes of real enzymatic hydrolysates of analyzed LCMs were introduced in the broths. Hence, the content glucose and other sugars for each analyzed lignocellulosic material corresponding proportionately to data presented in Table 4.

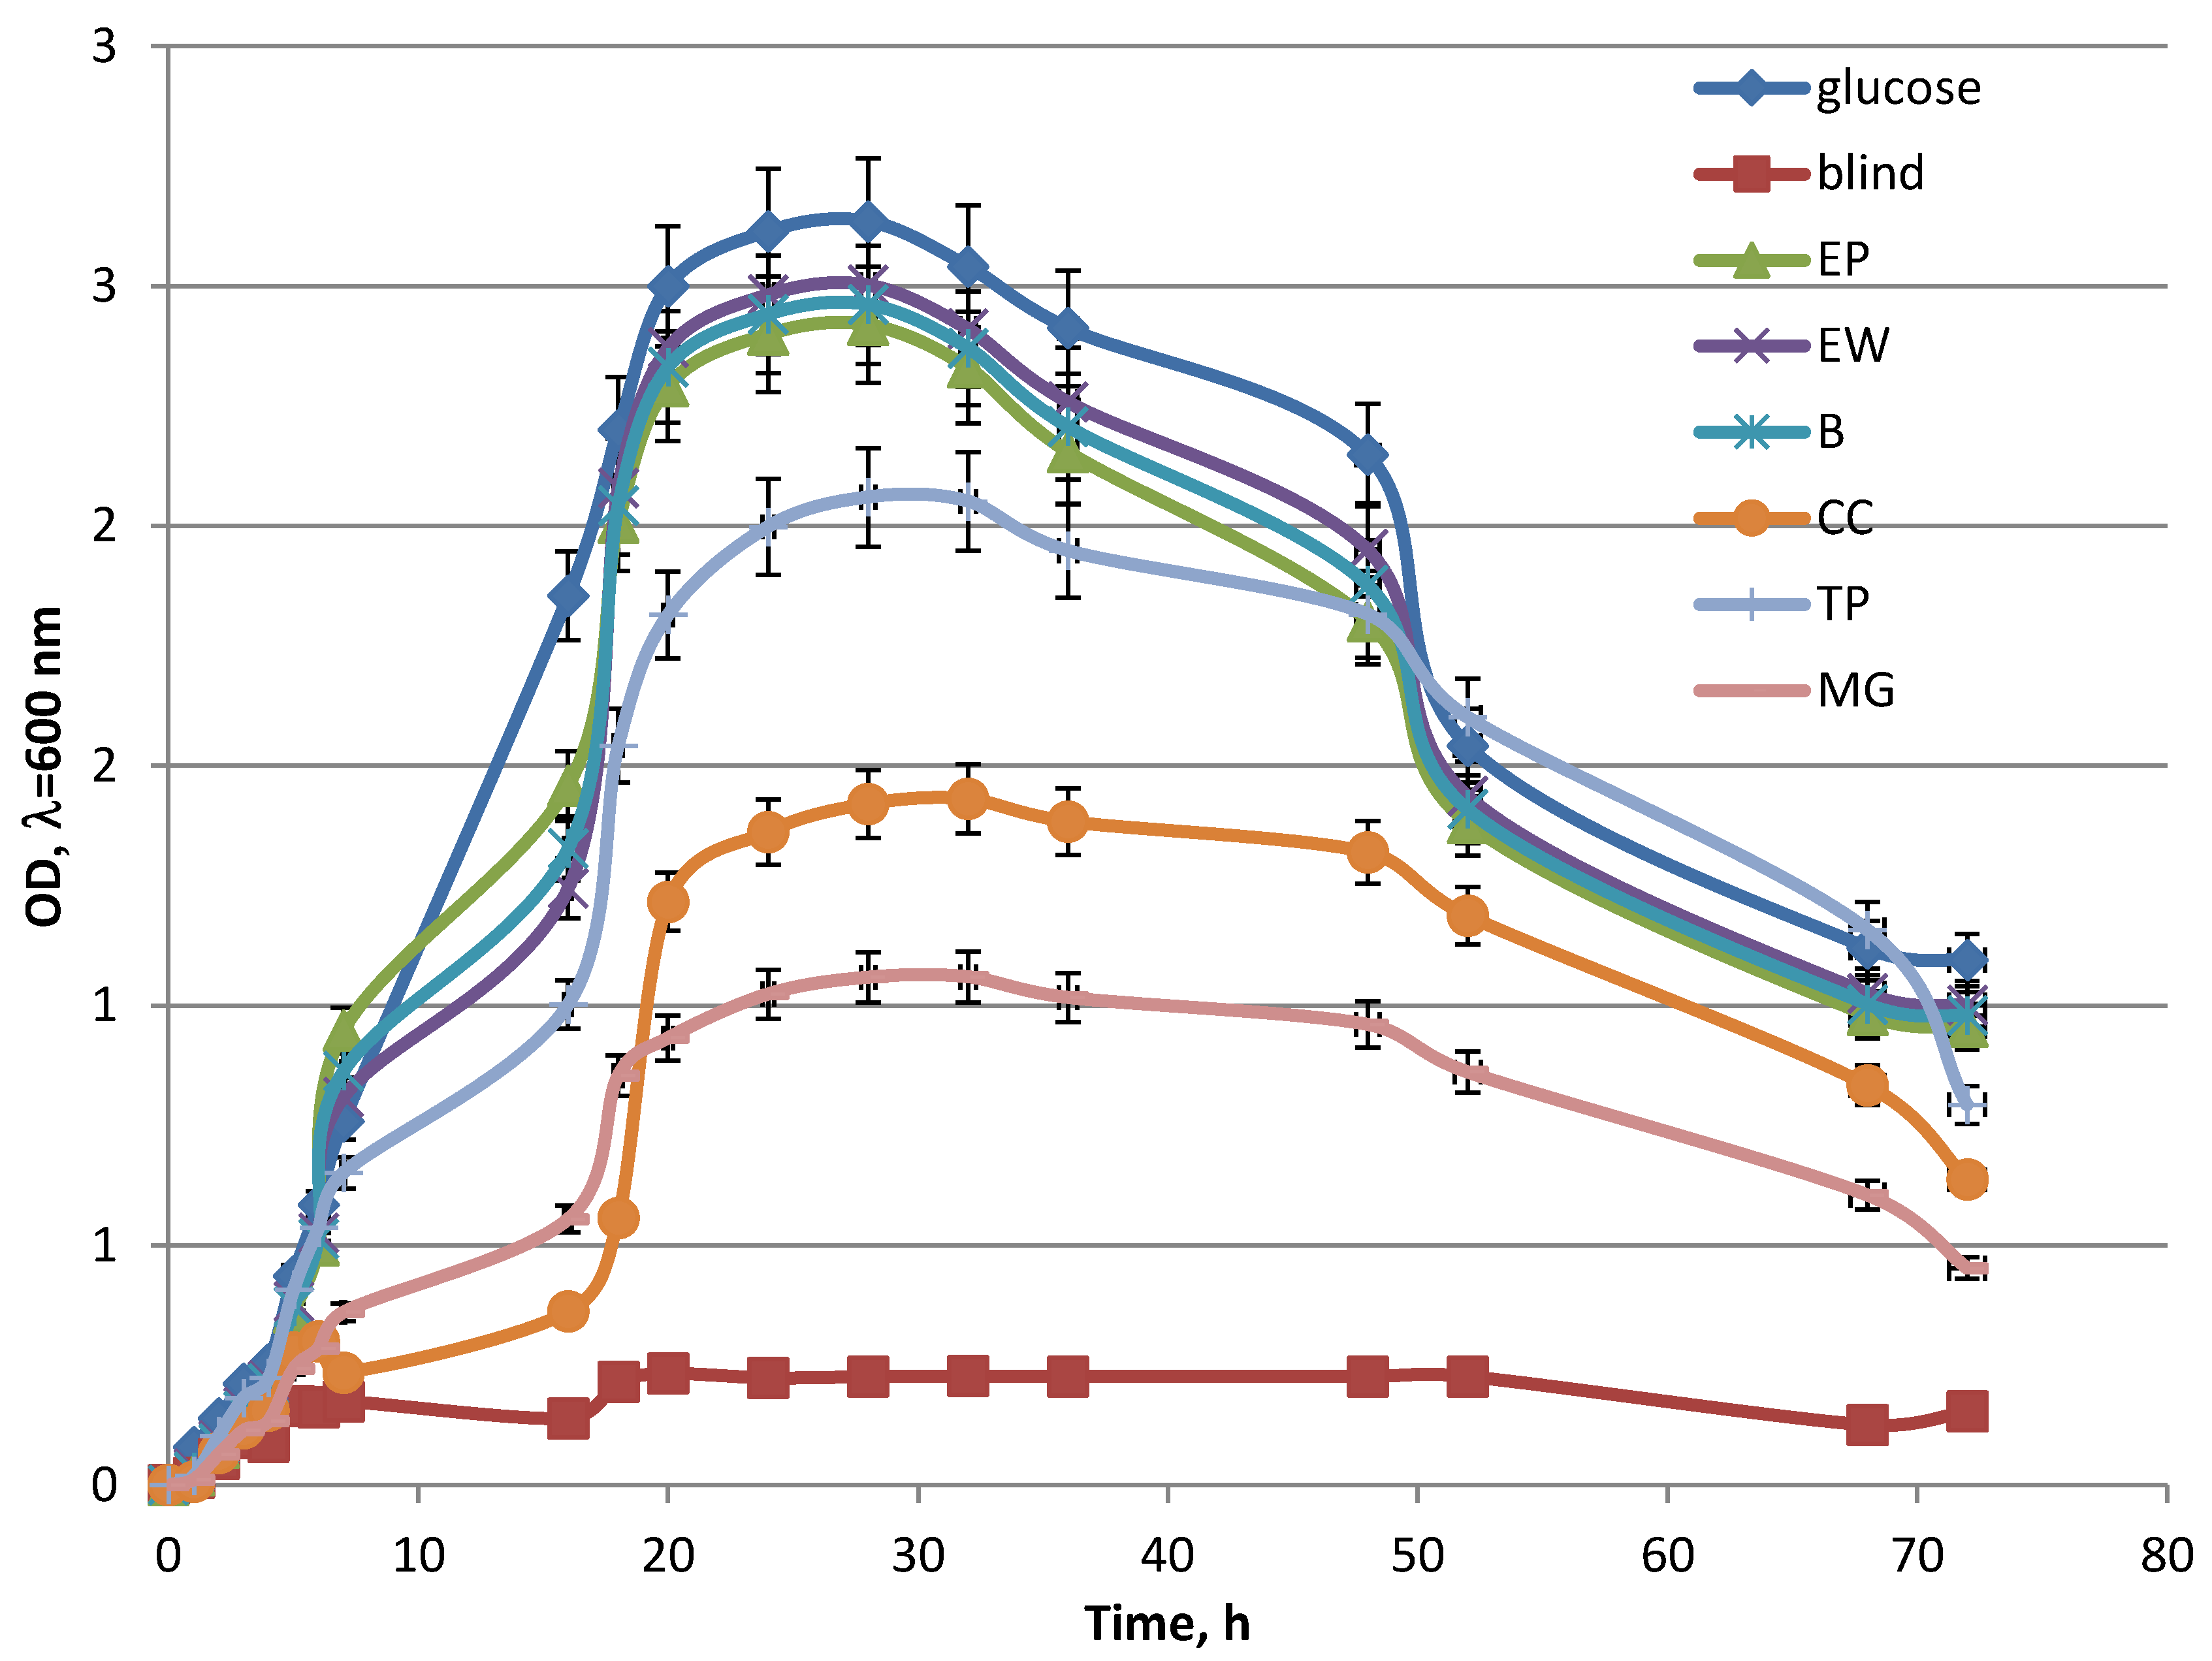
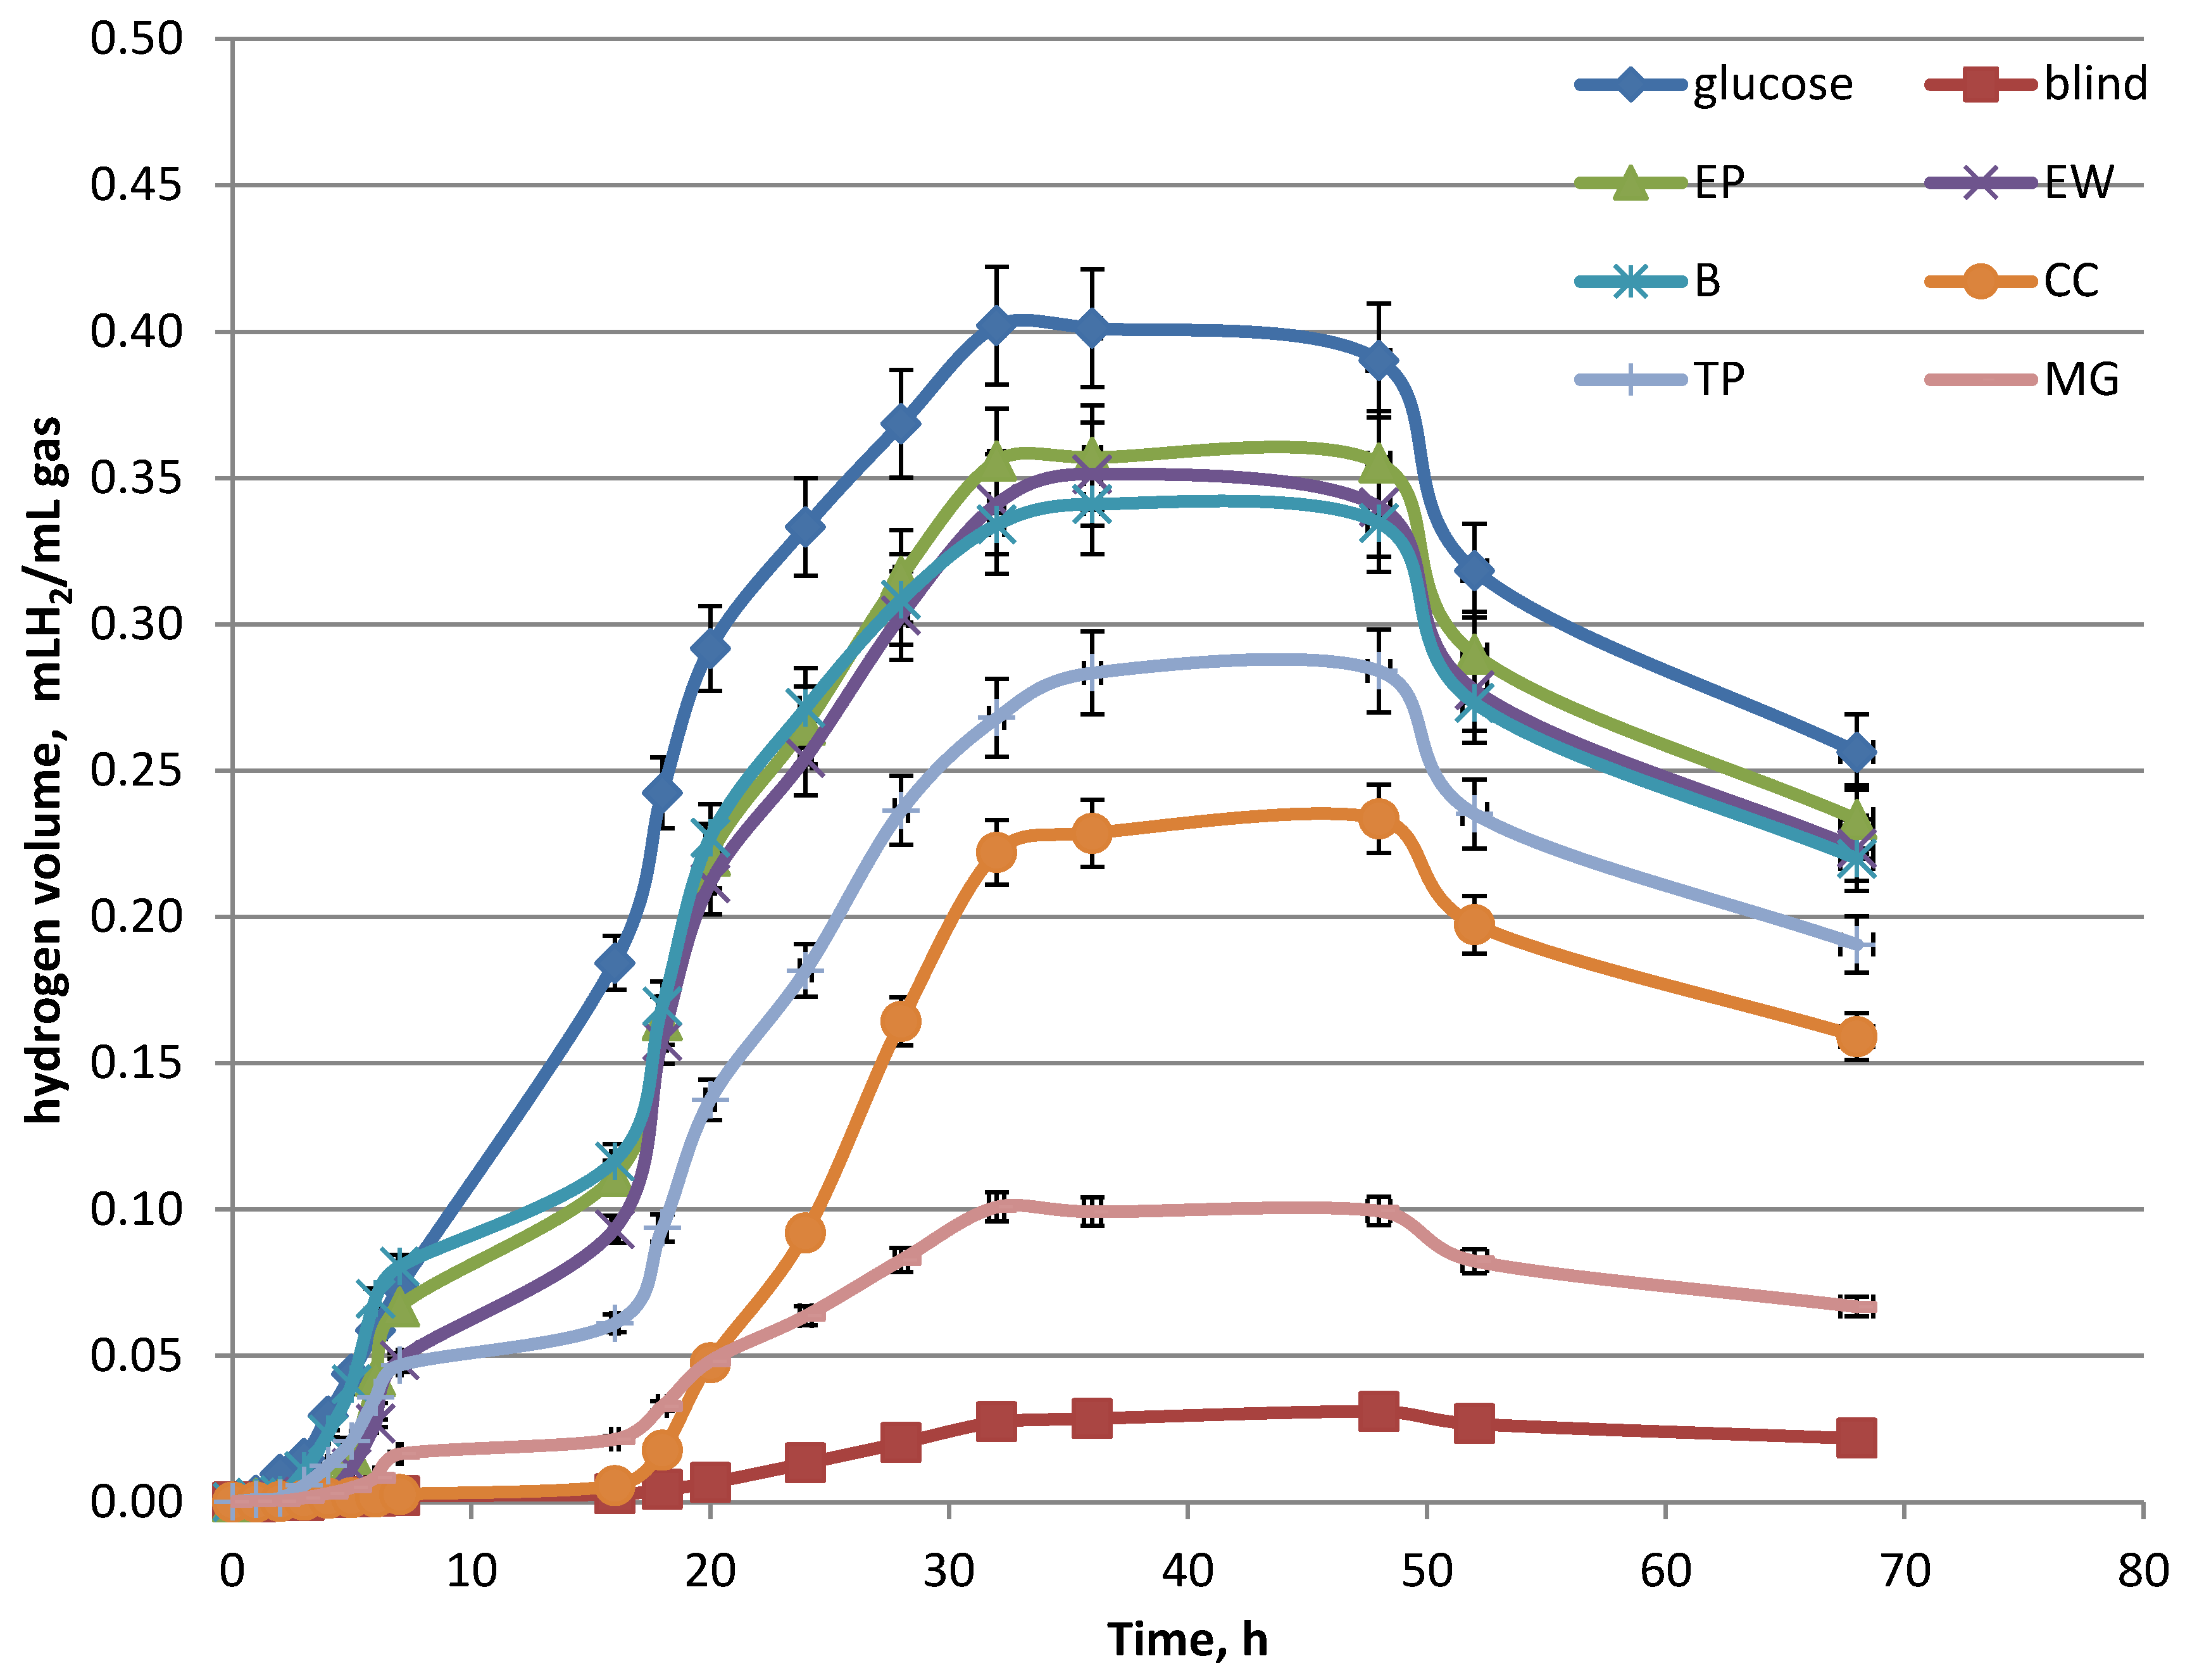
2.3.2. Process Course

The changes in the optical density ODλ=600nm of Enterobacter aerogenes cultures in bioreactors as well as the hydrogen volume increase were investigated and the appropriate results are presented in the Figure 4 and Figure 5, respectively.
Having presented the data analysis, it might be concluded that the hydrogen production was positively correlated with the growth of E. aerogenes cultures (Figure 4 and Figure 5) for each analyzed lignocellulosic material, respectively. On the basis of the course of the curves (Figure 6), some similarities can be observed regarding the positive correlation between the content of glucose in each hydrolysate and the hydrogen productivity. The higher the initial glucose concentration in the nutrient solution (Table 4), the higher the hydrogen production efficiency (Figure 6). The same correlation was observed when we compared the rate of growth E. aerogenes cultures (Figure 5) and the content of glucose in hydrolysates used as a feed. Therefore, we decided to analyze the concentration of glucose and other selected sugars during dark fermentation for each analyzed LCMs (Table 5).
The analysis of data from Table 5 demonstrates that glucose was mainly used as a carbon source during the logarithmic phase of growth. This is consistent with the presence of carbon catabolite repression mechanism for E. aerogenes [72], which means that glucose was the preferred carbon and energy source than others presented in Table 5. Since most of the hydrogen is produced during the logarithmic phase, the concentration of glucose in the biomass hydrolysates becomes one of the key parameters of this process. Hence, the results obtained (Table 4 and Table 5, Figure 6) seemed to confirm the assumptions adopted during the design of the experiment (DOE). The ratio of the obtained hydrogen volumes (mL) to overall concentration of reducing sugars also indicates the correlation of the results obtained with the increase in the glucose content in YTRS (Table 6, line 2). However, in order to assess the cost-effectiveness of the entire biomass bioconversion process to hydrogen, it is also necessary to compare the yield of hydrogen produced from 1 g of the lignocellulosic material used for this purpose. The authors [53] have previously carried a procedure to generate hydrogen with the application of EP, and stated that it is possible to obtain an average amount of hydrogen generated during the dark fermentation carried by Enterobacter aerogenes ATCC 13048 equal to 22.99 mL H2/g EP. However, due to a large influence of process parameters applied on the pre-treatment stage, we concluded, the need to carry experiments for diversified raw material and create the ability to compare the hydrogen efficiency from different biomasses and conduct discussions allowing us to link the composition and structure of these materials with the hydrogen generation performance. This approach allowed us to conclude, that the hydrogen yield was higher for materials that had a smaller mass loss after the alkaline pre-treatment and a greater share of glucose in the YTRS after enzymatic hydrolysis (Table 6, line 1). For comparison, results obtained for glucose (G) as a sole carbon source were presented in the table.
As it is shown in Table 6, in this study the highest hydrogen productivity was achieved for energetic willow, however, the overall hydrogen productivity for all investigated wood derived LCMs was comparable. Hence, the model bioconversion method of wood biomass (energetic poplar) to hydrogen [30] may be extended to bioconversion of other lignocellulosic materials, however the best consistency was obtained for lignocellulosic materials of beech wood and energetic willow. The lowest (almost three times lower in comparison to results obtained for EW, B and EP) hydrogen productivity was achieved for meadow grass. For comparison, in other dark fermentation studies carried out with E. aerogenes as a model organism the maximal hydrogen productivity were higher than those presented in Table 6. Nobre et al. [73] achieved a hydrogen production yield of 47.0 to 60.6 mL H2/g biomass of remaining biomass of microalga Nannochloropsis sp., after oil and pigment extraction processes. Batista et al. [74] achieved 7.7–40.9 mL H2/g biomass of Scenedesmus obliquus. However, in both studies, the hydrogen productivity was a function of the operational conditions of the dark fermentation process and the maximal productivity of hydrogen was achieved after process optimization. Hence, the presented data encouraged future studying operational conditions of the dark fermentation process for EW, B and EP lignocellulosic materials.
On the other hand, the results seemed to confirm that the yield of hydrogen obtained (Table 6) was dependent on the concentration of glucose in the medium (Table 4 and Table 5) and the remaining sugars e.g., xylose was not used as an effective carbon source for hydrogen production (Table 5) during logarithmic phase of growth E. aerogenes. This result could be linked to carbon catabolite repression in E. aerogenes cells. It seems, however, that it is possible to increase the amount of remaining sugars and increase the efficiency of hydrogen production. Jung et al. [44] constructed a genetically modified E. aerogenes strain in which the mechanism of carbon catabolite repression was abolished and the substrate preferences were modified in order to better use the mixture of sugars found in the cassava molasses for the production of 2,3-butanediol by fermentation. An analogous procedure could be used to obtain genetically modified strains of E. aerogenes that in the glucose presence in enzymatic hydrolysates of LCMs efficiently assimilate various monosaccharides, i.e., xylose, and use it for the production of hydrogen. The use of such recombinant E. aerogenes strain in developed bioconversion process could increase hydrogen efficiency production and make it more economically profitable.

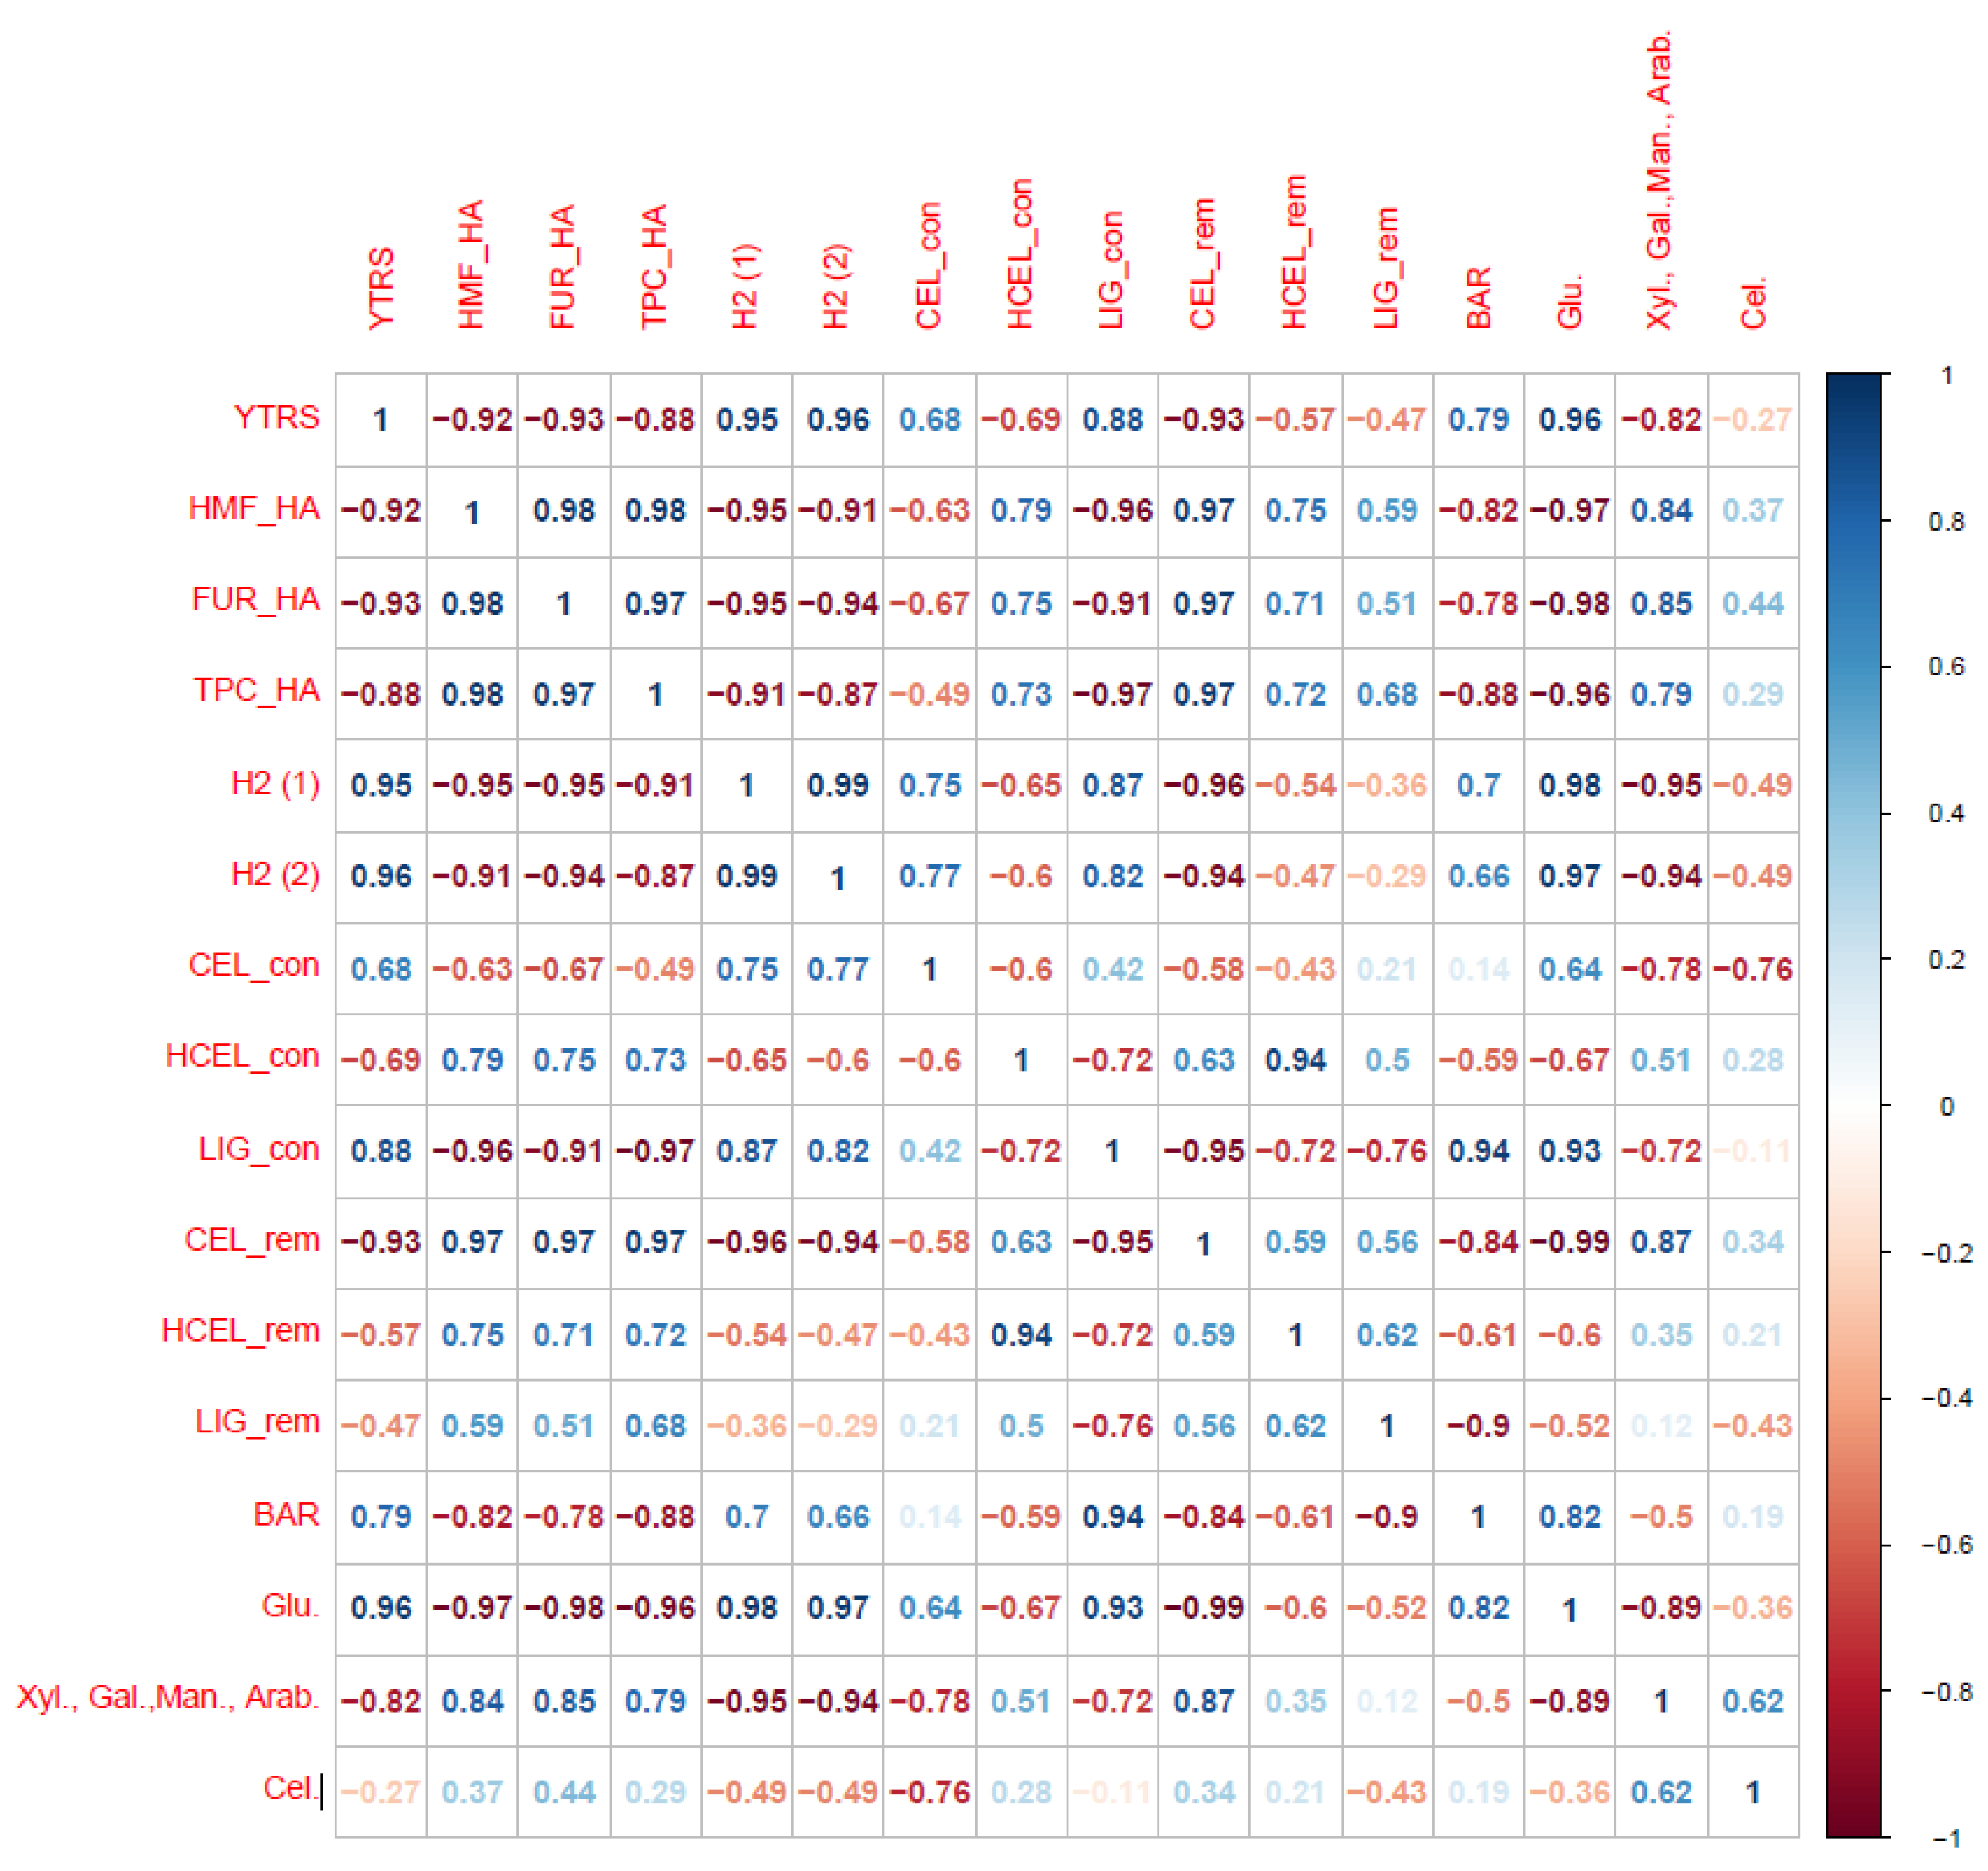
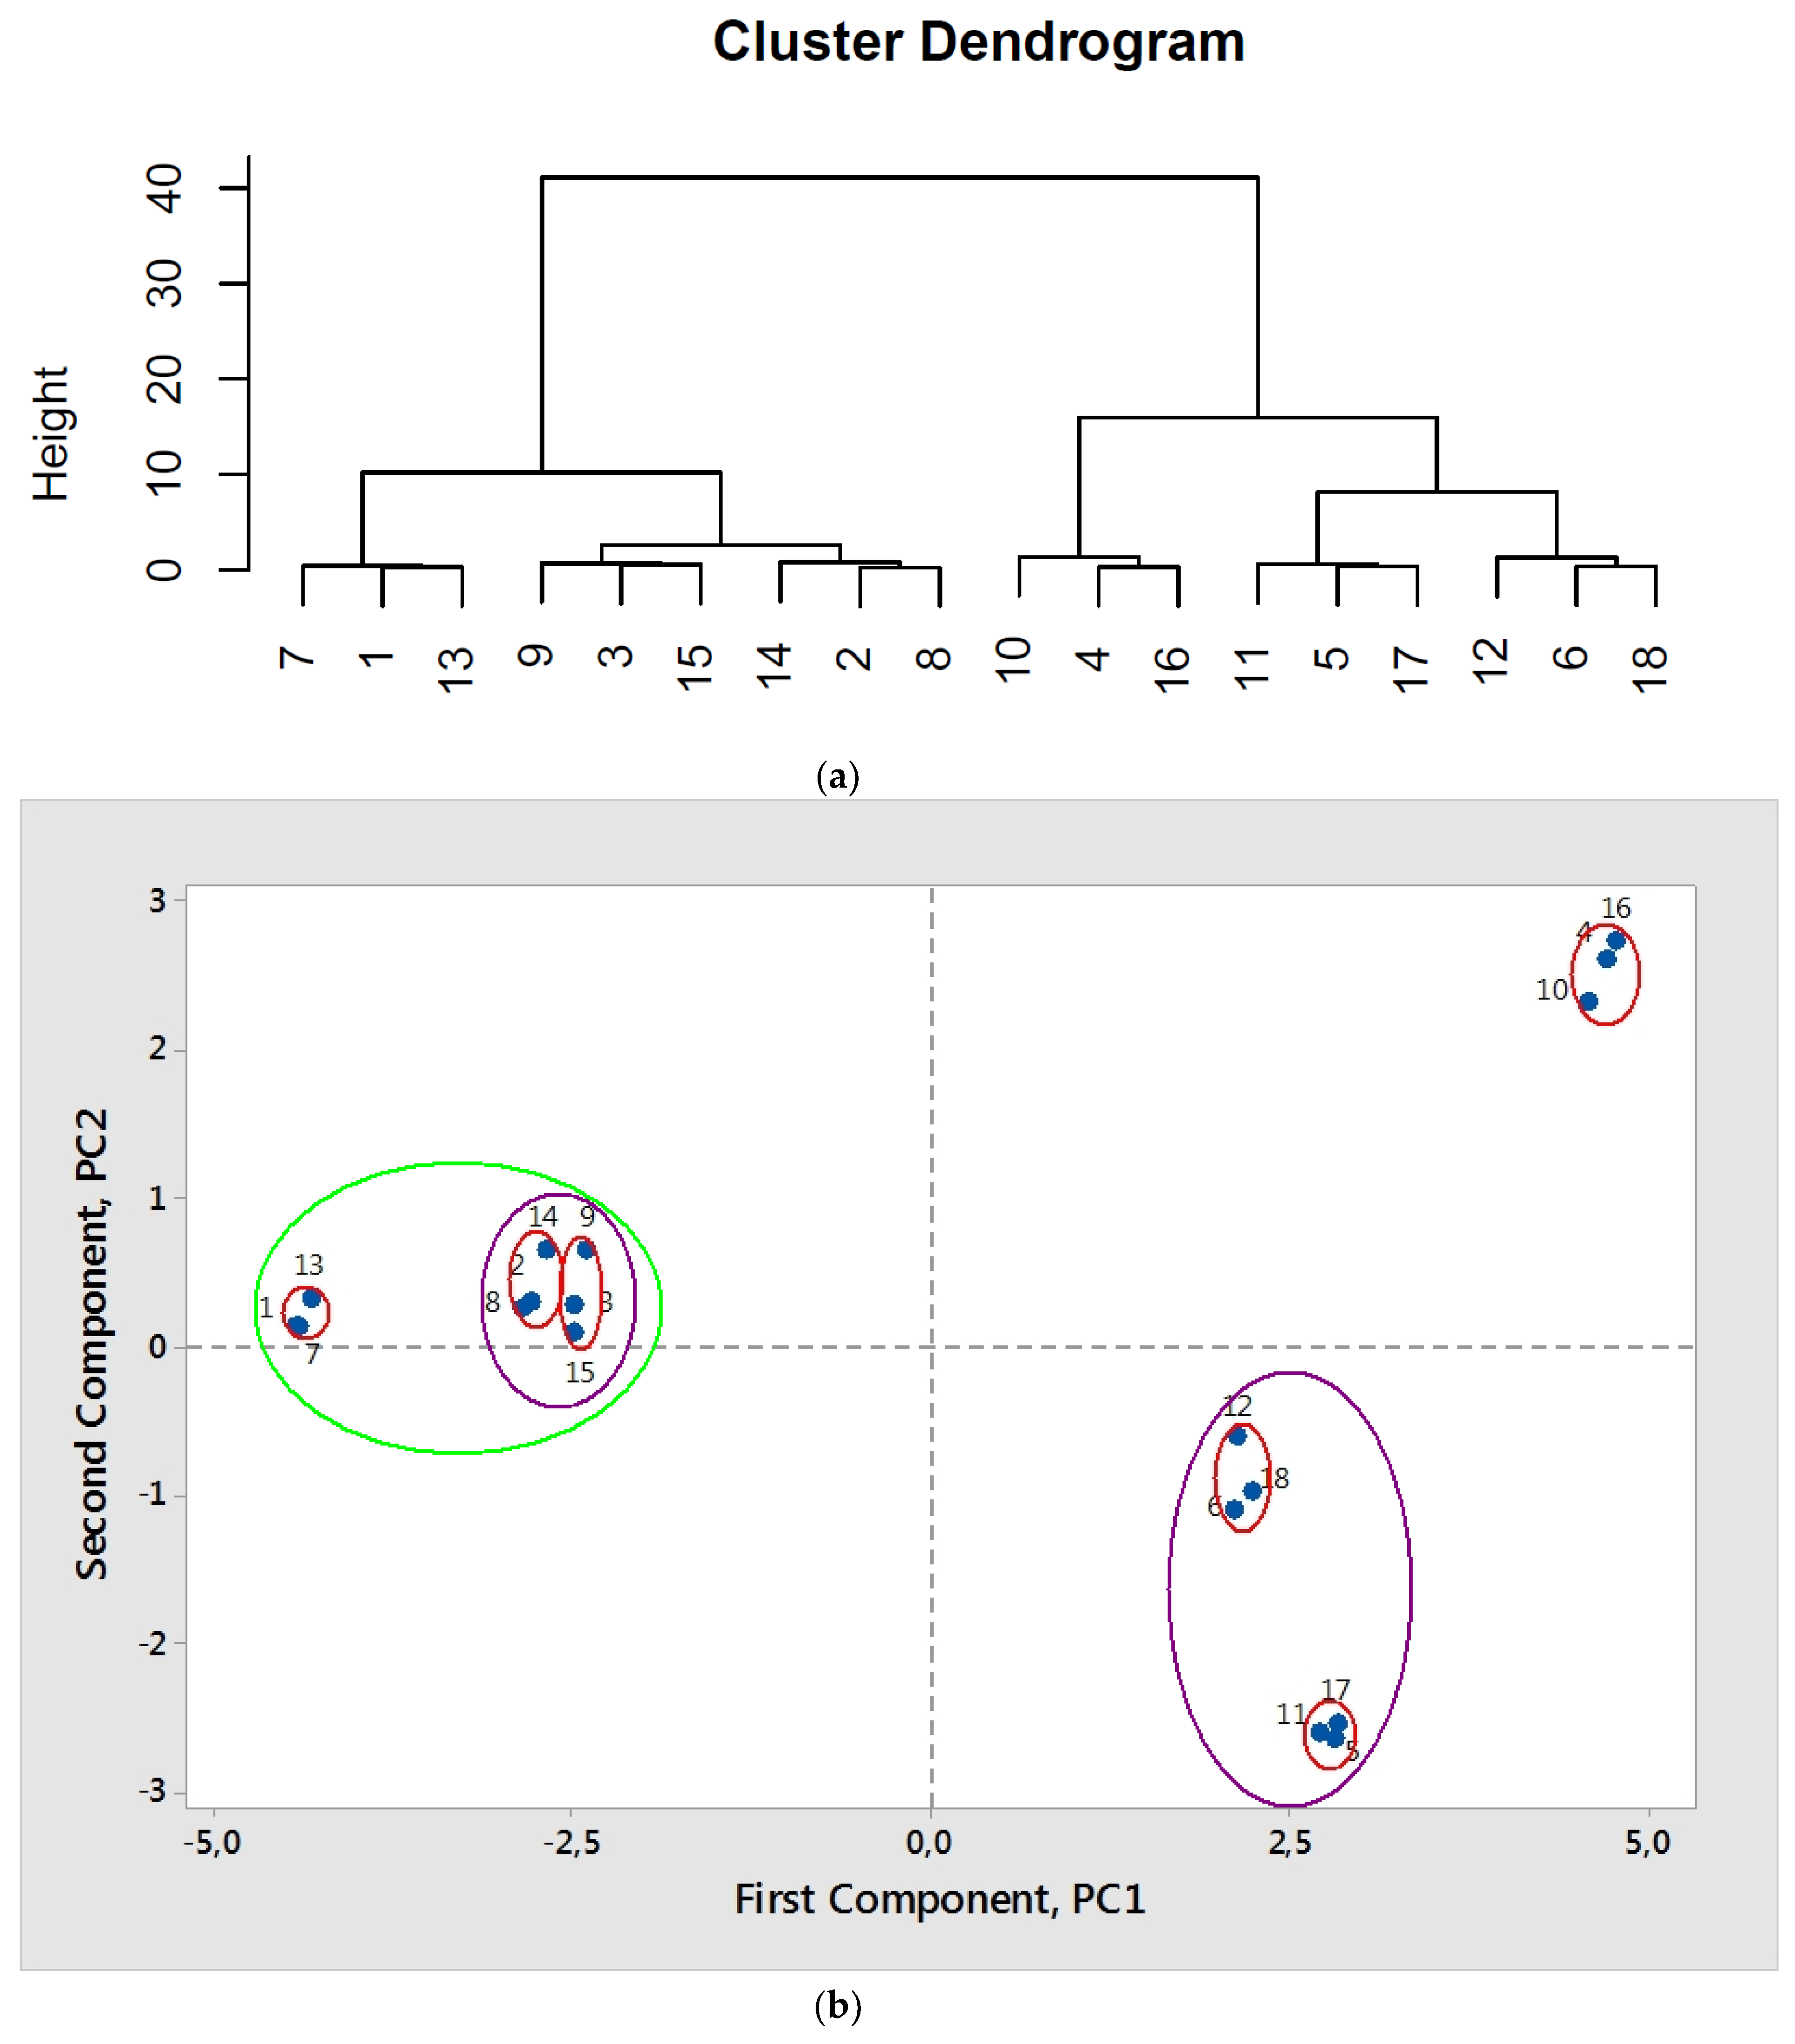
2.3.3. Chemometric Analysis of the Results of Hydrolysis and Fermentation Steps

On the basis of data presented in Table 2 and Table 3, a correlation matrix using [75] was prepared for the compositions of biomass, enzymatic hydrolysates and hydrogen efficiency describing factors (Figure 6). As predicted, it was found that there was a positive correlation between the biomass components and the sugars formed from them. Positive correlation occurred between the content of hemicellulose in biomass and achieved concentrations of xylose, galactose, mannose and arabinose as a result of saccharification. Similarly, the concentration of glucose and its dimer, i.e., cellobiose was positively correlated. Hydrogen formation, as expected, was negatively correlated with sugar concentration in growth medium (Table 6, Figure 5 and Figure 6). This conclusion corresponded with the course of fermentation, as the decrease in hexoses, pentoses and disaccharides concentration was observed at the end of logarithmic phase (Figure 4). The changes occurring in the fermentation broth, concerning sugar consumption are presented in Table 6 and the changes occurring in the fermentation broth, concerning by-products formation are presented in Table 5.
A strong positive correlation was observed for total reducing sugars amount with hydrogen generation yield and glucose concentration, while a negative correlation occurred when inhibitory compounds formation was considered. Formation of inhibitory compounds, i.e., HMF, furfural and TPC were positively correlated with hemicellulose content and consequently with xylose, galactose, mannose and arabinose content. Hence, the presence of high hemicellulose content in LCMs seemed to be disadvantageous for hydrogen productivity in tested model. However, the effective inhibitors removal after alkaline pretreatment from LCMs residual materials before enzymatic hydrolysis step abolished their negative impact on the effectiveness of hydrogen production. Interestingly high hydrogen productivity was positively correlated with lignin content in the raw biomass and high biomass amount recovery. Hence, it could be assumed that high content of lignin was not a major issue, if the delignification process was efficient and inhibitory compounds were removed adequately in pre-treatment steps. Pre-treatment conditions elaborated for EP [30] allowed us to achieve a similar percentage of removal of lignin from other investigated materials derived from wood. When the developed model conditions were applied to other lignocellulosic materials originating from cereals, a high degree of delignification was also achieved, which could be observed on the basis of experimental results (Table 1) and chemometric analysis (Figure 6). However, since research have shown, that it is not possible to completely remove lignin with MEA. It seems very important that the results indicate a positive correlation between hydrogen yield and lignin recovery after pre-treatment. This trend corresponds with results of other alkaline pre-treatments published in the literature [35,76,77,78].
On the basis of the correlation matrix, the principal component analysis (Figure 7b) and cluster dendrogram (Figure 7a) representing the similarity of features was prepared using [79]. Variables are presented as biomass samples, i.e., samples 1 ÷ 18 (Figure 7). The cluster distance measurement was performed on the basis of correlation matrix (Figure 6). It can be stated that the biomasses used for hydrolysis and fermentation could be clearly divided into two (Figure 7a) or three groups (Figure 7b), depending on the assumed similarity level. It was assumed, that the clusters should have a relatively high similarity level and a relatively low distance level. Therefore the authors decided to divide the variables in two major groups (Figure 7a) and carried the discussion according to this point of view. First group represents woods and the second group stood for cereals and grass. Hence, it could also be concluded that previously mentioned differences occurring in the structure, biomass content and recovery, sugar proportions and hydrogen productivity and the course of the process associated with the biomass type might be reflected applying chemometric methods.
Samples 3, 9 and 15 represent EP, and samples 2, 8 and 14 represent B. As it could be conducted analyzing Figure 7a,b these materials were located in a small distance and a high similarity could be observed. Both in the mentioned woods, i.e., EP and B were grouped. Moreover, these two groups were closely related with samples 1, 7 and 13, which stood for EW. Such interpretation on the basis of chemometric analysis corresponded with previously conducted conclusions regarding the hydrolysis and fermentation processes course and results (Table 5 and Table 6 and Figure 5 and Figure 6). All mentioned biomasses, i.e., EW, EP and B samples represented wood materials, thus according to the expectations, the results allowed us to classify listed types of biomass in terms of their bioconversions pathways not only on the basis of structure and chemical content, but also basing on statistical parameters, which may be a criterion for biomass classification. In the case of other materials i.e., samples 5, 11 and 17 standing for CC and 6, 12 and 18 standing for TP statistical similarities also occurred, these materials could be grouped both on the principal analysis graph and in the cluster dendrogram. This confirmed the possibility of biomass classification in terms of statistical parameters, since both CC and TP represented cereals and therefore results correspond with the expectations. Interestingly, the samples represented by 4, 10 and 16 standing for MG constitute an independent group (Figure 7b), showing however a greater resemblance to the cereals than to woods if the cluster dendrogram similarity level was considered.

3. Material and Methods

3.1. Origin, Collection and Preparation of Lignocellulosic Materials

Places of origin and time of harvesting samples of woods (EW, EP and B), cereals (CC and TP) and grass (MG) are presented in Table 7.
Milled and minced with a Meec Tools garden shredder 425 and RETCH Ultra Centrifugal Mill ZM 200 lignocellulosic materials were sieved through a 0.75 mm screen [35]. The material after grinding was dried (105 °C, 4 h) and stored in room temperature in sealed containers. Prior to the alkaline pre-treatment the material was dried in a laboratory dryer at 105 °C for 4 h and then stored in a desiccator with NaOH [80,81].
To determine the parameters of each of lignocellulosic materials tested, total solids, ash and extractives of raw materials were determined according to the National Renewable Energy Laboratory (NREL) analytical procedures. The composition and analysis of sugar [82] and lignin content in the raw materials [83] were determined using the NREL procedure. The content of cellulose and hemicellulose was determined by HPLC with a Rezex Pb2+ column (300 mm × 7.8 mm, 8 μm) and refractometric detection (Knauer). Water with a flow rate of 0.6 mL/min was used as the eluent [82].

3.2. Alkaline Pre-Treatment

In or previous study, statistically significant parameters were selected and consequently applied during optimization of our alkaline pre-treatment method of energetic poplar in accordance with the Box-Behnken design using alkaline catalyst monoethanoloamine (MEA) [30]. Energetic poplar was selected as a model lignocellulosic material, because of the high content of cellulose and lignin in comparison to cereals and grass (CC, T and MG) and high content of hemicellulose in comparison to woods (B and EW), comparable with hemicellulose content in CC and MG (Table 1) [53]. Optimal values for MEA pre-treatment are defined as follows: MEA 21% (v/v), temperature 65 °C and time 16 h, according to [30]. Five grams of each dried LCM and 100 mL of MEA solution was placed in 150 mL flask for alkaline pre-treatment (step 1) and shook vigorously in a shaking water bath for 16 h. Due to the presence of inhibitory compounds in the liquid fraction of alkaline hydrolysates, the solid residues should be separated. The experiments were carried in triplicates.

3.3. Separation of Inhibitory Compounds

After the alkaline pre-treatment, the solid and liquid fractions were separated using centrifugation (5000 RPM, Biofuge 28RS, Heraeus Sepatech, Hanau, Germany). The supernatant was collected for analysis concerning inhibitory by-products formation and the solid state residue was filtered through a Buchner funnel to separate the precipitate from the remaining solution. The precipitate was then washed three times with deionized water (30 mL) and then twice with acetone (30 mL) to ensure the complete removal of lignin and hemicellulose derivatives as a possible source of compounds acting as inhibitors for both enzymatic hydrolysis and dark fermentation. The precipitate was dried for 4 h at 105 °C and placed in a desiccator with a drying substance (NaOH). Each experiment was carried in triplicate.

3.4. Enzymatic Hydrolysis of Solid Residues of LCMs After MEA-Pre-Treatment

In our previous work, solid residue of energetic poplar of the MEA pre-treatment was processed using enzymatic hydrolysis with viscozyme L (Novozymes Corp., Kalundborg, Denmark) supplemented with commercially available β-glucosidase from Aspergillus niger (Sigma-Aldrich, Buchs, Switzerland) immobilized on diatomaceous earth [84] In this study, the same lignocellulolytic enzymes were used with exception for enzymes proportions (Viscozyme L: β-glucosidase from Aspergillus niger; 0.95:0.05 m/m). Reaction flasks were incubated in bath shaker at 42 °C for 24 h. The immobilized bed was regenerated and re-used [30]. After the pretreatment step and the removal of inhibitors, the mass of residual biomass for all LCMs tested was different (Table 2), this factor was taken into account during the addition of cellulolytic enzymes. For each gram of LCMs 1 g of diatomaceous earth with approximately 0.2 mL of enzyme cocktail was applied. The experiments were carried in triplicates.

3.5. Dark Fermentation

Enterobacter aerogenes (Selectrol TCS Biosciences Ltd., Buckingham, UK) was used for hydrogen production in dark fermentation process of enzymatic hydrolysates of B, EW, EP, CC, MG and TP LCMs. The dark fermentation process for each hydrolysate was conducted under conditions described in our previous work [53]. Of enzymatic hydrolysates 900 mL was diluted with water in order to keep a constant level of the reducing sugar content equal to 5.5 g/L for each analyzed LCMs was placed in the bioreactors. All the given samples were performed using real biomass solutions. The authors obtained hydrolysates that were further introduced in the broths. For comparison purposes, glucose based broths were carried as model processes. To compare the results, the concentration of sugars was set at a level of 5.5 g/L in all experiments, however the proportions of monosugars were different for different raw materials (please, refer to Table 5). For this reason final hydrogen productivity was presented with respect to 1 g of biomass. Bioreactors used for this process were inoculated with 100 mL Enterobacter aerogenes in liquid breeding containing buffered peptone water 20 g/L (Biomaxima, Gdańsk, Poland), at OD600 = 2.4 ± 0.1. The experiments were carried in triplicates.

3.6. Analytical Methods for Sugars Determination of Enzymatic Hydrolysates and Fermentation Broth

Total solids, ash and extractives for raw materials were determined according to the National Renewable Energy Laboratory (NREL) analytical procedures [81,82,83,85,86]. The presence and the concentration of reducing monosaccharides (glucose, xylose, arabinose, mannose and galactose) and disaccharides (cellobiose) were determined using HPLC [49]. Sugar fraction was filtered through a cationic as well as anionic ion exchange column followed by vigorous shaking (30 min). Ion exchange procedure was completed by filtration through a syringe filter. Then, the eluent was evaporated in a stream of nitrogen. Sugar fraction was dissolved in 200 μL of water and directed to HPLC analysis (injection volume 50 μL) HPLC analysis of sugars: HPLC-RID; temperature of separation: 60 °C; column: Rezex Pb2+ column (300 mm × 7.8 mm, 8 µm; Phenomenex, Torrance, CA, USA); eluent: water; flow: 0.6 mL/min. The analysis was carried in triplicates.
The residual monosaccharides concentration in culture supernatant samples taken after approximately 0, 2, 6, 20, 50 and 72 h of fermentation was measured using HPLC [34,86].

3.7. Analytical Methods for Inhibitory Compounds Determination in Alkaline and Enzymatic Hydrolysates of LCMs

The concentration of hydroxymethylfurfural, 5-HMF and total phenolic compounds in alkaline and enzymatic hydrolysates of LCMs was determined by QP2010 GC–MS SE gas chromatograph–mass spectrometer (Shimadzu, Kyoto, Japan) equipped with a combi-PAL AOC 5000 autosampler (Shimadzu, Japan) and a 60 m × 0.25 mm × 1.40 μm Rxi-624Sil MS capillary column (Restek, Bellefonte, PA, USA). Lab Solutions software (Shimadzu, Japan) with NIST 14 mass spectra library were used for data management. The temperature program was applied as follows: 50 °C (5 min)—ramped at 10 °C/min to 260 °C (10 min). Injection port temperature was equal to 300 °C. Injection mode: split 10:1. Detector temperature was 300 °C, ion source temperature (Electron ionization, 70  eV) was 220 °C and GC/MS transfer line temperature was 300 °C. The carrier gas was hydrogen (1 mL/min). SCAN mode over the mass-to-charge ratio 34–400 m/z and single ion monitoring for particular m/z values selected individually for each compound were used. Hydrolysate samples (1.5 mL) were centrifuged (Hettich zentrifugen, D-78533 Tuttlingen, 3000 RPM) and filtered through the 0.45 µm hydrophilic filters. Next, 1 mL of samples were transferred to 2 mL vials followed by addition of 20 μL of an internal standard solution (4-chlorophenol in acetone at a concentration of 5 mg/mL), pH of samples was adjusted to 2.5 using formic acid. 300 µL of dichloromethane was added to the samples and the samples were shaken vigorously in the vial for 1 min, followed by centrifugation at 3000 RPM for 5 min. A volume of 250 µL of organic phase was then transferred to 2 mL vials equipped with 300 µL micro inserts. Finally, 1 µL of the organic phase (extract) was analyzed by GC–MS. The analysis was carried in triplicates.

3.8. Determination of Hydrogen Yield Obtained During Dark Fermentation Process

Changes in the hydrogen concentration in the obtained gas during fermentation were measured using gas chromatography, previously described and published parameters were applied [53]. The analysis was carried in triplicates. Gaseous samples were taken from the reactor at the lag, exponential and decline phases of culture growth. The growth of E. aerogenes culture was monitored by measuring of optical density of culture at λ = 600 nm [30,87]. The pH was continuously monitored using Arduino Microcontroller data-logger.

3.9. Scanning Electron Microscopy (SEM)

Samples of milled and minced raw and alkaline pretreated lignocellulosic biomasses were dried (105 °C, 4 h) and gold-covered by sputtering method prior to analysis in sputter coater Quorum Q150TE (Quorum Technologies Ltd., Lewes, UK). Then, SEM images of gold covered biomass samples were performed using SEM Zeiss EVO-40 (Carl Zeiss Microscopy GmbH, Jena, Germany).

4. Conclusions

The applied procedure and the designed method of conducting the bioconversion process enabled drawing a global conclusion regarding the applicability of various types of biomass for bioconversion processes (for gaseous fuels) and the suitability of biomass for biorefinery processes. In the case of the wood biomass type, i.e., EP, EW and B as a result of the applied alkaline pre-treatment, high degrees of delignification were obtained, with a small loss of the solid fraction after delignification and relatively high cellulose content in their lignocellulosic residues. Since, as shown by means of chemometric analysis, high cellulose contents corresponded with the efficiency of enzymatic hydrolysis and at the same time allowed obtaining high glucose concentrations, also the hydrogen productivity was high. As for the second type of applied biomass used, i.e., for CC, TP and MG, a high degree of delignification was also observed; unfortunately a large loss of the biomass was the side effect during delignification. Therefore, the efficiency with respect to cellulose, i.e., the glucose source after the enzymatic hydrolysis, was insignificantly smaller. In the case of the alkaline hydrolysates, for the second group of materials, the content of lignin and its derivatives in the stream was four times higher than in the first group (representing wood).
The authors confirmed that the previously developed procedure for the removal of enzymatic inhibitors [30] allowed us to effectively remove inhibitors of cellulolytic enzymes from the residual biomass of investigated LCMs. The obtained results of enzymatic hydrolysis of the investigated residual LCMs (part of the cellulose and hemicellulose did not undergo hydrolysis) indicate the need to optimize the conditions of this step of the bioconversion. The authors concluded, that not only the presence of lignin but also the composition and structure of hemicellulose and cellulose in the lignocellulosic material subjected to enzymatic hydrolysis seemed to affect the glucose content and the concentration of total reducing sugars in the obtained enzymatic hydrolysates. It should be assumed that the particular features of the morphological structure, not only the composition of the raw material affected the efficiency of total reducing sugars in the enzymatic hydrolysates and hydrogen efficiency after dark fermentation.
Chemometric analysis confirmed that the biomass used for hydrolysis and fermentation could be clearly divided into two groups. The first group represents woods and the second group stands for cereals and grass. It could be concluded that previously mentioned differences occurring in the structure, biomass content and recovery, sugar proportions and hydrogen productivity and the course of the process associated with the biomass type might be a source of the criterions for biomass classification in terms of its suitability in the production of gaseous biofuels or in biorefinery processes (see below, please). As a future direction of research it is necessary to investigate the effect of hemicellulose more closely on the subsequent steps and consider such pre-treatment to completely remove it before the saccharification step.
As an effect of the carried procedure i) it was concluded, that a high content of cellulose was obtained after pre-treatment; ii) delignification and lignin/hemicellulose derivatives removal procedure was developed; iii) it was stated, that cereal and grass type lignocellulosic material are characterized by a lower hydrogen generative potential than wood type LCMs and iv) it was possible to carry presented pre-treatment steps (alkaline hydrolysis of LCMs, then solid LCMs residues and alkaline hydrolysates separation) before biorefining of cereal and grass type hydrolysates of LCMs.
On the basis of the results obtained for various kinds of biomass analyzed in this study, the following decision scheme for the classification of biomass, the direction of flow of streams after specific stages of the pre-treatment could be proposed (Figure 8). The size of the arrows on the block diagram matches the proportions of the streams.
Moreover, we concluded that the research on the genetic modification of Enterobacter aerogenes in order to reduce the effect of carbon catabolite repression with glucose and enable the use of other monosaccharides resulting from hemicellulose hydrolysis should become a one of future direction of research related to the bioconversion of wood-type lignocellulose residues presented in this study. For this purpose, we planned to explore the knowledge about developed strategies of bioengineering of the E. aerogenes strain for biohydrogen production [88].
On the other hand, optimization of the composition of alkaline hydrolysates, delignification efficiency and removal of hemicellulose, which may become a precursor to many chemical substances, should become a direction of biorefining path of our future research on MG, CC and TP biomasses. The effective separation of the indicated streams described in this paper seemed to be a relevant issue. From an economic point of view, it is important to conduct bioconversion and biorefining in a parallel manner in order to fully utilize the potential of a given type of biomass. It is also worth adding that after termination of dark fermentation, the broth containing a number of metabolites, including organic acids, could be methanized and thereby the profit from the presented process should be increased. A future direction of the study should also consider enzyme immobilization with the application of magnetic matrix for better enzyme recovery, as the optimization of enzymatic hydrolysis step is of great importance for the economics of the process. Performance of a scale-up requires an optimization of dark fermentation step, preferably applying a continuous rotary system.

Author Contributions

Conceptualization, K.K. and H.C.; Data curation, K.K. and E.S.; Formal analysis, K.K.; Funding acquisition, M.K.; Investigation, K.K., H.C., P.R. and K.W.; Methodology, K.K., H.C., P.R., E.S., R.Ł. and M.K.; Writing—original draft, K.K., P.R. and E.S.; Writing—review and editing, K.K. and H.C.

Funding

This work was carried out within the framework of the project “Studies of alkaline hydrolysis of lignocellulosic biomass and conversion conditions of hydrolyzed products to biogases”, supported financially by the National Science Center through the grant UMO-2014/13/B/ST8/04258.

Acknowledgments

The authors express their gratitude to J. Mazerski (Gdańsk University of Technology, Poland) for explaining chemometric methods application; to B. Szulczyński (Gdańsk University of Technology, Poland) for his contribution in the pH control system development and to J. Kucińska-Lipka (Gdańsk University of Technology, Poland), for her assistance during sputtering for SEM analysis purposes.

Conflicts of Interest

The authors declare no conflict of interest. The founding sponsors had no role in the design of the study; in the collection, analyses, or interpretation of data; in the writing of the manuscript, and in the decision to publish the results.

References

  1. Białas, W.; Szymanowska, D.; Grajek, W. Fuel ethanol production from granular corn starch using Saccharomyces cerevisiae in a long term repeated SSF process with full stillage recycling. Bioresour. Technol. 2010, 101, 3126–3131. [Google Scholar] [CrossRef] [PubMed]
  2. Graboski, M.S.; McCormick, R.L. Combustion of fat and vegetable oil derives fuels in diesel engines. Prog. Energy Combust. Sci. 1998, 24, 125–164. [Google Scholar]
  3. Randolph, K.; Studer, S.; Liu, H.; Beliaev, A.; Holladay, J. Hydrogen Production Cost from Fermentation; DOE Hydrogen and Fuel Cells Program: Washington, DC, USA, 2017.
  4. Sharma, S.; Ghoshal, S.K. Hydrogen the future transportation fuel: From production to applications. Renew. Sustain. Energy Rev. 2015, 43, 1151–1158. [Google Scholar] [CrossRef]
  5. Nowak, P.; Kucharska, K.; Kaminski, M. Ecological and Health Effects of Lubricant Oils Emitted into the Environment. Int. J. Environ. Res. Public Health 2019, 16, 3002. [Google Scholar] [CrossRef]
  6. Argun, H.; Kargi, F.; Kapdan, I. Microbial culture selection for bio-hydrogen production from waste ground wheat by dark fermentation. Int. J. Hydrogen Energy 2009, 34, 2195–2200. [Google Scholar] [CrossRef]
  7. Manish, S.; Banerjee, R. Comparison of biohydrogen production processes. Int. J. Hydrogen Energy 2008, 33, 279–286. [Google Scholar]
  8. Chi, C.; Chang, H.; Li, Z.; Jameel, H.; Zhang, Z. A method for rapid determination of sugars in lignocellulose prehydrolyzate. BioResources 2013, 8, 172–181. [Google Scholar] [CrossRef]
  9. Azman, N.F.; Abdeshahian, P.; Al-Shorgani, N.K.N.; Hamid, A.A.; Kalil, M.S. Production of hydrogen energy from dilute acid-hydrolyzed palm oil mill effluent in dark fermentation using an empirical model. Int. J. Hydrogen Energy 2016, 41, 16373–16384. [Google Scholar] [CrossRef]
  10. Kucharska, K.; Hołowacz, I.; Konopacka-Łyskawa, D.; Rybarczyk, P.; Kamiński, M. Key issues in modeling and optimization of lignocellulosic biomass fermentative conversion to gaseous biofuels. Renew. Energy 2018, 129, 384–408. [Google Scholar] [CrossRef]
  11. Zhang, Q.; Zhang, P.; Pei, Z.J.; Wang, D. Relationships between cellulosic biomass particle size and enzymatic hydrolysis sugar yield: Analysis of inconsistent reports in the literature. Renew. Energy 2013, 60, 127–136. [Google Scholar] [CrossRef]
  12. Phummala, K.; Imai, T.; Reungsang, A.; Higuchi, T.; Sekine, M.; Yamamoto, K.; Kanno, A. Optimization of Enzymatic Hydrolysis for Pretreated Wood Waste by Response Surface Methodology in Fermentative Hydrogen Production. J. Water Environ. Technol. 2015, 13, 153–166. [Google Scholar] [CrossRef] [Green Version]
  13. Lo, Y.C.; Lu, W.C.; Chen, C.Y.; Chang, J.S. Dark fermentative hydrogen production from enzymatic hydrolysate of xylan and pretreated rice straw by Clostridium butyricum CGS5. Bioresour. Technol. 2010, 101, 5885–5891. [Google Scholar] [CrossRef] [PubMed]
  14. Quéméneur, M.; Bittel, M.; Trably, E.; Dumas, C.; Fourage, L.; Ravot, G.; Steyer, J.P.; Carrère, H. Effect of enzyme addition on fermentative hydrogen production from wheat straw. Int. J. Hydrogen Energy 2012, 37, 10639–10647. [Google Scholar] [CrossRef]
  15. Hendriks, A.; Zeeman, G. Pretreatments to enhance the digestibility of lignocellulosic biomass. Bioresour. Technol. 2009, 100, 10–18. [Google Scholar] [CrossRef]
  16. Sun, Y.; Cheng, J. Hydrolysis of lignocellulosic materials for ethanol production: A review. Bioresour. Technol. 2002, 83, 1–11. [Google Scholar] [CrossRef]
  17. Mussatto, S.I.; Roberto, I.C. Optimal Experimental Condition for Hemicellulosic Hydrolyzate Treatment with Activated Charcoal for Xylitol Production. Biotechnol. Prog. 2004, 20, 134–139. [Google Scholar] [CrossRef]
  18. Bansal, P.; Hall, M.; Realff, M.J.; Lee, J.H.; Bommarius, A.S. Modeling cellulase kinetics on lignocellulosic substrates. Biotechnol. Adv. 2009, 27, 833–848. [Google Scholar] [CrossRef]
  19. Zhang, C.M.; Mao, Z.G.; Wang, X.; Zhang, J.H.; Sun, F.B.; Tang, L.; Zhang, H.J. Effective ethanol production by reutilizing waste distillage anaerobic digestion effluent in an integrated fermentation process coupled with both ethanol and methane fermentations. Bioprocess. Biosyst. Eng. 2010, 33, 1067–1075. [Google Scholar] [CrossRef]
  20. Gu, F.; Yang, L.; Jin, Y.; Han, Q.; Chang, H.; Jameel, H.; Phillips, R. Green liquor pretreatment for improving enzymatic hydrolysis of corn stover. Bioresour. Technol. 2012, 124, 299–305. [Google Scholar] [CrossRef]
  21. Liu, T.; Williams, D.L.; Pattathil, S.; Li, M.; Hahn, M.G.; Hodge, D.B. Coupling alkaline pre-extraction with alkaline-oxidative post-treatment of corn stover to enhance enzymatic hydrolysis and fermentability. Biotechnol. Biofuels 2014, 7, 48. [Google Scholar] [CrossRef]
  22. De Vrije, T.; De Haas, G.; Tan, G.B.; Keijsers, E.R.P.; Claassen, P.A.M. Pretreatment of Miscanthus for hydrogen production by Thermotoga elfii. Int. J. Hydrogen Energy 2002, 27, 1381–1390. [Google Scholar] [CrossRef]
  23. Poggio, D.; Walker, M.; Nimmo, W.; Ma, L.; Pourkashanian, M. Modelling the anaerobic digestion of solid organic waste—Substrate characterisation method for ADM1 using a combined biochemical and kinetic parameter estimation approach. Waste Manag. 2016, 53, 40–54. [Google Scholar] [CrossRef] [PubMed]
  24. Wyman, C.E.; Dale, B.E.; Elander, R.T.; Holtzapple, M.; Ladisch, M.R.; Lee, Y.Y. Coordinated development of leading biomass pretreatment technologies. Bioresour. Technol. 2005, 96, 1959–1966. [Google Scholar] [CrossRef] [PubMed]
  25. Nissilä, M.E.; Lay, C.H.; Puhakka, J.A. Dark fermentative hydrogen production from lignocellulosic hydrolyzates—A review. Biomass Bioenergy 2014, 67, 145–159. [Google Scholar] [CrossRef]
  26. Chookaew, T.; Prasertsan, P.; Ren, Z.J. Two-stage conversion of crude glycerol to energy using dark fermentation linked with microbial fuel cell or microbial electrolysis cell. New Biotechnol. 2014, 31, 179–184. [Google Scholar] [CrossRef]
  27. Kucharska, K.; Rybarczyk, P.; Hołowacz, I.; Łukajtis, R.; Glinka, M.; Kamiński, M. Pretreatment of Lignocellulosic Materials as Substrates for Fermentation Processes. Molecules 2018, 23, 2937. [Google Scholar] [CrossRef]
  28. El-Ahmady, N.; Deraz, S.; Khalil, A. Bioethanol Production from Lignocellulosic Feedstocks Based on Enzymatic Hydrolysis: Current Status and Recent Developments. Biotechnology 2014, 13, 1–21. [Google Scholar] [CrossRef]
  29. Kumar, G.; Bakonyi, P.; Periyasamy, S.; Kim, S.H.; Nemestóthy, N.; Bélafi-Bakó, K. Lignocellulose biohydrogen: Practical challenges and recent progress. Renew. Sustain. Energy Rev. 2015, 44, 728–737. [Google Scholar] [CrossRef]
  30. Kucharska, K.; Łukajtis, R.; Słupek, E.; Cieśliński, H.; Rybarczyk, P.; Kamiński, M. Hydrogen Production from Energy Poplar Preceded by MEA Pre-Treatment and Enzymatic Hydrolysis. Molecules 2018, 23, 3029. [Google Scholar] [CrossRef]
  31. Cao, W.; Sun, C.; Liu, R.; Yin, R.; Wu, X. Comparison of the effects of five pretreatment methods on enhancing the enzymatic digestibility and ethanol production from sweet sorghum bagasse. Bioresour. Technol. 2012, 111, 215–221. [Google Scholar] [CrossRef]
  32. Cao, X.; Peng, X.; Sun, S.; Zhong, L.; Wang, S.; Lu, F.; Sun, R. Impact of regeneration process on the crystalline structure and enzymatic hydrolysis of cellulose obtained from ionic liquid. Carbohydr. Polym. 2014, 111, 400–403. [Google Scholar] [CrossRef] [PubMed]
  33. Kaya, B.; Irmak, S.; Hasanoglu, A.; Erbatur, O. Evaluation of various carbon materials supported Pt catalyts for aqueous-phase reforming of lignocellulosic biomass hydrolysate. Int. J. Hydrogen Energy 2014, 39, 10135–10140. [Google Scholar] [CrossRef]
  34. Łukajtis, R.; Kucharska, K.; Hołowacz, I.; Rybarczyk, P.; Wychodnik, K.; Słupek, E.; Nowak, P.; Kamiński, M. Comparison and Optimization of Saccharification Conditions of Alkaline Pre-Treated Triticale Straw for Acid and Enzymatic Hydrolysis Followed by Ethanol Fermentation. Energies 2018, 11, 639. [Google Scholar] [CrossRef]
  35. Łukajtis, R.; Rybarczyk, P.; Kucharska, K.; Konopacka-Łyskawa, D.; Słupek, E.; Wychodnik, K.; Kamiński, M. Optimization of saccharification conditions of lignocellulosic biomass under alkaline pre-treatment and enzymatic hydrolysis. Energies 2018, 11, 886. [Google Scholar] [CrossRef]
  36. Marcar, N.; Ismail, S.; Hossain, A.; Ahmad, R. Trees, Shrubs and Grasses for Saltlands: An Annotated Bibliography; The Australian Centre for International Agricultural Research: Canberra, Australia, 1999; p. 316.
  37. Cruz, J.M.; Domínguez, J.M.; Domínguez, H.; Parajó, J.C. Solvent extraction of hemicellulosic wood hydrolysates: A procedure useful for obtaining both detoxified fermentation media and polyphenols with antioxidant activity. Food Chem. 1999, 67, 147–153. [Google Scholar] [CrossRef]
  38. Ghaffar, S.H.; Fan, M. Structural analysis for lignin characteristics in biomass straw. Biomass Bioenergy 2013, 57, 264–279. [Google Scholar] [CrossRef]
  39. Sant’Anna, C.; Souza, W. De Microscopy as a tool to follow deconstruction of lignocellulosic biomass. Curr. Microsc. Contrib. Adv. Sci. Technol. 2012, 17, 639–645. [Google Scholar]
  40. Bharathiraja, B.; Sudharsanaa, T.; Bharghavi, A.; Sri Sowmeya, G.; Balaram, G. Insights on lignocellulosic pretreatments for biofuel production- SEM and reduction of lignin analysis. Int. J. ChemTech Res. 2014, 6, 4334–4444. [Google Scholar]
  41. Wi, S.G.; Cho, E.J.; Lee, D.-S.; Lee, S.J.; Lee, Y.J.; Bae, H.-J. Lignocellulose conversion for biofuel: A new pretreatment greatly improves downstream biocatalytic hydrolysis of various lignocellulosic materials. Biotechnol. Biofuels 2015, 8, 228. [Google Scholar] [CrossRef]
  42. Behera, B.K.; Arora, M.; Sharma, D.K. Scanning electron microscopic (SEM) studies on structural architecture of lignocellulosic materials of Calotropis procera during its processing for saccharification. Bioresour. Technol. 1996, 58, 241–245. [Google Scholar] [CrossRef]
  43. Pronyk, C.; Mazza, G.; Tamaki, Y. Production of Carbohydrates, Lignins, and Minor Components from Triticale Straw by Hydrothermal Treatment. J. Agric. Food Chem. 2011, 59, 3788–3796. [Google Scholar] [CrossRef] [PubMed]
  44. Jung, M.Y.; Jung, H.M.; Lee, J.; Oh, M.K. Alleviation of carbon catabolite repression in Enterobacter aerogenes for efficient utilization of sugarcane molasses for 2,3-butanediol production. Biotechnol. Biofuels 2015, 8, 1–12. [Google Scholar] [CrossRef] [PubMed]
  45. Liu, X.; Xu, Q.; Liu, J.; Yin, D.; Su, S.; Ding, H. Hydrolysis of cellulose into reducing sugars in ionic liquids. Fuel 2016, 164, 46–50. [Google Scholar] [CrossRef]
  46. Agbogbo, F.K.; Wenger, K.S. Production of ethanol from corn stover hemicellulose hydrolyzate using Pichia stipitis. J. Ind. Microbiol. Biotechnol. 2007, 34, 723–727. [Google Scholar] [CrossRef] [PubMed]
  47. Rafiqul, I.S.M.; Mimi Sakinah, A.M. Kinetic studies on acid hydrolysis of Meranti wood sawdust for xylose production. Chem. Eng. Sci. 2012, 71, 431–437. [Google Scholar] [CrossRef]
  48. Nichols, N.N.; Sharma, L.N.; Mowery, R.A.; Chambliss, C.K.; van Walsum, G.P.; Dien, B.S.; Iten, L.B. Fungal metabolism of fermentation inhibitors present in corn stover dilute acid hydrolysate. Enzyme Microb. Technol. 2008, 42, 624–630. [Google Scholar] [CrossRef]
  49. Glinka, M.; Łukajtis, R.; Nowak, P.; Kamiński, M. Liquid chromatography techniques, used in technical analysis of hydrolysis processes, of lignocellulosic biomass. Camera Sep. 2017, 9, 92–105. [Google Scholar]
  50. Jin, Z.; Matsumoto, Y.; Tange, T.; Iiyama, K. Structural characteristics of lignin in primitive pteridophytes: Selaginella species. J. Wood Sci. 2007, 53, 412–418. [Google Scholar] [CrossRef]
  51. Towers, G.H.N.; Gibbs, R.D. Lignin chemistry and the taxonomy of higher plants. Nature 1953, 172, 25. [Google Scholar] [CrossRef]
  52. Lora, J.H.; Glasser, W.G. Recent Industrial Applications of Lignin: A Sustainable Alternative to Nonrenewable Materials. J. Polym. Environ. 2002, 10, 39–48. [Google Scholar] [CrossRef]
  53. Kucharska, K.; Słupek, E.; Cieśliński, H.; Kamiński, M. Advantageous conditions of saccharification of lignocellulosic biomass for biofuels generation via fermentation processes. Chem. Pap. 2020, in press. [Google Scholar]
  54. Jönsson, L.J.; Martin, C. Pretreatment of lignocellulose: Formation of inhibitory by-products and strategies for minimizing their effects. Bioresour. Technol. 2016, 199, 103–112. [Google Scholar] [CrossRef] [PubMed] [Green Version]
  55. Akobi, C.; Hafez, H.; Nakhla, G. The impact of furfural concentrations and substrate-to-biomass ratios on biological hydrogen production from synthetic lignocellulosic hydrolysate using mesophilic anaerobic digester sludge Furfural:sugars exerted a greater effect on H 2 inhibition than f. Bioresour. Technol. 2016, 221, 598–606. [Google Scholar] [CrossRef] [PubMed]
  56. Ghimire, A.; Frunzo, L.; Pontoni, L.; d’Antonio, G.; Lens, P.N.L.; Esposito, G.; Pirozzi, F. Dark fermentation of complex waste biomass for biohydrogen production by pretreated thermophilic anaerobic digestate. J. Environ. Manag. 2015, 152, 43–48. [Google Scholar] [CrossRef] [PubMed]
  57. Xie, R.; Tu, M.; Wu, Y.; Adhikari, S. Improvement in HPLC separation of acetic acid and levulinic acid in the profiling of biomass hydrolysate. Bioresour. Technol. 2011, 102, 4938–4942. [Google Scholar] [CrossRef]
  58. Rambo, M.K.D.; Schmidt, F.L.; Ferreira, M.M.C. Analysis of the lignocellulosic components of biomass residues for biorefinery opportunities. Talanta 2015, 144, 696–703. [Google Scholar] [CrossRef]
  59. Hernández, E.; García, A.; López, M.; Puls, J.; Parajó, J.C.; Martín, C. Dilute sulphuric acid pretreatment and enzymatic hydrolysis of Moringa oleifera empty pods. Ind. Crops Prod. 2013, 44, 227–231. [Google Scholar] [CrossRef]
  60. Michalska, K.; Ledakowicz, S. Alkali pre-treatment of Sorghum Moench for biogas production. Chem. Pap. 2013, 67, 1130–1137. [Google Scholar] [CrossRef]
  61. Cheng, N.; Koda, K.; Tamai, Y.; Yamamoto, Y.; Takasuka, T.E.; Uraki, Y. Optimization of simultaneous saccharification and fermentation conditions with amphipathic lignin derivatives for concentrated bioethanol production. Bioresour. Technol. 2017, 232, 126–132. [Google Scholar] [CrossRef]
  62. Bu, Q.; Lei, H.; Ren, S.; Wang, L.; Holladay, J.; Zhang, Q.; Tang, J.; Ruan, R. Phenol and phenolics from lignocellulosic biomass by catalytic microwave pyrolysis. Bioresour. Technol. 2011, 102, 7004–7007. [Google Scholar] [CrossRef]
  63. Ishola, M.M.; Ylitervo, P.; Taherzadeh, M.J. Co-Utilization of glucose and xylose for enhanced lignocellulosic ethanol production with reverse membrane bioreactors. Membranes (Basel) 2015, 5, 844–856. [Google Scholar] [CrossRef] [PubMed]
  64. Monlau, F.; Aemig, Q.; Trably, E.; Hamelin, J.; Steyer, J.P.; Carrere, H. Specific inhibition of biohydrogen-producing Clostridium sp. after dilute-acid pretreatment of sunflower stalks. Int. J. Hydrogen Energy 2013, 38, 12273–12282. [Google Scholar] [CrossRef]
  65. Daoutidis, P.; Kelloway, A.; Marvin, W.A.; Rangarajan, S.; Torres, A.I. Process systems engineering for biorefineries: New research vistas. Curr. Opin. Chem. Eng. 2013, 2, 442–447. [Google Scholar] [CrossRef]
  66. Menegazzo, F.; Ghedini, E.; Signoretto, M. 5-Hydroxymethylfurfural (HMF) Production from Real Biomasses. Molecules 2018, 23, 2201. [Google Scholar] [CrossRef]
  67. Mendonça, A.D.M.; Siqueira, P.M.; Souza, M.M.V.M.; Pereira, N. Optimization of production of 5-hydroxymethylfurfural from glucose in a water: Acetone biphasic system. Braz. J. Chem. Eng. 2015, 32, 501–508. [Google Scholar] [CrossRef]
  68. Słupek, E.; Kucharska, K.; Gębicki, J. Alternative methods for dark fermentation course analysis. SN Appl. Sci. 2019, 1, 469. [Google Scholar] [CrossRef] [Green Version]
  69. Thomas, L.; Joseph, A.; Gottumukkala, L.D. Xylanase and cellulase systems of Clostridium sp.: An insight on molecular approaches for strain improvement. Bioresour. Technol. 2014, 158, 343–350. [Google Scholar] [CrossRef]
  70. Khoshnevisan, K.; Poorakbar, E.; Baharifar, H.; Barkhi, M. Recent Advances of Cellulase Immobilization onto Magnetic Nanoparticles: An Update Review. Magnetochemistry 2019, 5, 36. [Google Scholar] [CrossRef]
  71. De Gioannis, G.; Muntoni, A.; Polettini, A.; Pomi, R. A review of dark fermentative hydrogen production from biodegradable municipal waste fractions. Waste Manag. 2013, 33, 1345–1361. [Google Scholar] [CrossRef]
  72. Deutscher, J. The mechanisms of carbon catabolite repression in bacteria. Curr. Opin. Microbiol. 2008, 11, 87–93. [Google Scholar] [CrossRef]
  73. Nobre, B.P.; Villalobos, F.; Barragán, B.E.; Oliveira, A.C.; Batista, A.P.; Marques, P.A.; Mendes, R.L.; Sovová, H.; Palavra, A.F.; Gouveia, L. A biorefinery from Nannochloropsissp. Microalga—Extraction of oilsand pigments. Production of biohydrogen from the leftover biomass. Biores. Technol. 2013, 135, 128–136. [Google Scholar] [CrossRef] [PubMed]
  74. Batista, A.P.; Gouveia, L.; Marques, P. Fermentative hydrogen production from microalgal biomass by asingle strain of bacterium Enterobacter aerogenes Effect of operational conditions, and fermentation kinetics. Renew. Energy 2018, 119, 203–209. [Google Scholar] [CrossRef]
  75. RStudio Team (2015) RStudio: Integrated Development for R. RStudio, Inc., Boston, MA. Available online: http://www.rstudio.com/.
  76. Beukes, N.; Pletschke, B.I. Effect of alkaline pre-treatment on enzyme synergy for efficient hemicellulose hydrolysis in sugarcane bagasse. Bioresour. Technol. 2011, 102, 5207–5213. [Google Scholar] [CrossRef] [PubMed]
  77. Li, Q.; Gao, Y.; Wang, H.; Li, B.; Liu, C.; Yu, G.; Mu, X. Comparison of different alkali-based pretreatments of corn stover for improving enzymatic saccharification. Bioresour. Technol. 2012, 125, 193–199. [Google Scholar] [CrossRef] [PubMed]
  78. Zhu, Z.; Rezende, C.A.; Simister, R.; McQueen-Mason, S.J.; Macquarrie, D.J.; Polikarpov, I.; Gomez, L.D. Efficient sugar production from sugarcane bagasse by microwave assisted acid and alkali pretreatment. Biomass Bioenergy 2016, 93, 269–278. [Google Scholar] [CrossRef] [Green Version]
  79. Minitab 17; Statistical Software Computer Software; Minitab, LLC: State College, PA, USA, 2010.
  80. Lin, R.; Cheng, J.; Ding, L.; Song, W.; Zhou, J.; Cen, K. Inhibitory effects of furan derivatives and phenolic compounds on dark hydrogen fermentation. Bioresour. Technol. 2015, 196, 250–255. [Google Scholar] [CrossRef] [PubMed]
  81. Fernández de Simón, B.; Cadahía, E.; Conde, E.; García-Vallejo, M.C. Low Molecular Weight Phenolic Compounds in Spanish Oak Woods. J. Agric. Food Chem. 1996, 44, 1507–1511. [Google Scholar] [CrossRef]
  82. Sluiter, A.; Hames, B.; Ruiz, R.; Scarlata, C.; Sluiter, J.; Templeton, D. Determination of Ash in Biomass: Laboratory Analytical Procedure (LAP); NREL: Golden, CO, USA, 2008; p. 18.
  83. Sluiter, A.; Hames, B.; Ruiz, R.; Scarlata, C.; Sluiter, J.; Templeton, D. Determination of Sugars, Byproducts, and Degradation Products in Liquid Fraction Process Samples (LAP); NREL: Golden, CO, USA, 2008; pp. 1–14.
  84. Sluiter, A.; Hames, B.; Ruiz, R.; Scarlata, C.; Sluiter, J.; Templeton, D.; Crocker, D. NREL/TP-510-42618 Analytical Procedure—Determination of Structural Carbohydrates and Lignin in BIOMASS (LAP); NREL: Golden, CO, USA, 2012; p. 17.
  85. Väljamäe, P.; Pettersson, G.; Johansson, G. Mechanism of substrate inhibition in cellulose synergistic degradation. Eur. J. Biochem. 2001, 268, 4520–4526. [Google Scholar] [CrossRef]
  86. Sluiter, A.; Ruiz, R.; Scarlata, C.; Sluiter, J.; Templeton, D. Determination of Extractives in Biomass: Laboratory Analytical Procedure (LAP); Technical Report NREL/TP-510-42619; NREL: Golden, CO, USA, 2008; pp. 1–9, 12.
  87. Singh, A.; Sevda, S.; Abu Reesh, I.M.; Vanbroekhoven, K.; Rathore, D.; Pant, D. Biohydrogen production from lignocellulosic biomass: Technology and sustainability. Energies 2015, 8, 13062–13080. [Google Scholar] [CrossRef]
  88. Zhang, C.; Lv, F.-X.; Xing, X.-H. Bioengineering of the Enterobacter aerogenes strain for biohydrogen production. Bioresour. Technol. 2011, 102, 8344–8349. [Google Scholar] [CrossRef]
Figure 1. Design of the experiment (DOE).
Catalysts 09 00858 g001
Figure 2. SEM images of investigated lignocellulosic materials, (A) Raw energetic willow; (B) MEA pre-treated energetic willow; (C) Raw beech; (D) MEA pre-treated beech; (E) Raw energetic poplar; (F) MEA pre-treated energetic poplar; (G) Raw meadow grass; (H) MEA pre-treated meadow grass; (I) Raw corn cobs; (J) MEA pre-treated corn cobs; (K) Raw triticale; (L) MEA pre-treated triticale.
Catalysts 09 00858 g002aCatalysts 09 00858 g002bCatalysts 09 00858 g002c
Figure 3. Glucose and total reducing sugar (TRS) efficiency depending on enzymatic hydrolysis parameters.
Catalysts 09 00858 g003
Figure 4. Changes in optical density of Enterobacter aerogenes cultures during dark fermentation for different feed materials.
Catalysts 09 00858 g004
Figure 5. Changes in the volumetric concentration of hydrogen for different feed materials during dark fermentation experiments.
Catalysts 09 00858 g005
Figure 6. Correlation matrix for the compositions of biomass, enzymatic hydrolysates and hydrogen efficiency (YTRS—total reducing sugars amount, HMF_HA—HMF concentration in alkaline hydrolysates, FUR_HA—furfural concentration in alkaline hydrolysates, TPC_HA–total phenolic compound concentration in alkaline hydrolysates, H2(1)—hydrogen productivity mL/g biomass, H2(2)–hydrogen productivity mL/YTRS, CEL_con—content of cellulose in biomass, HCEL_con— content of hemicellulose in biomass, LIG_con—content of lignin in biomass, CEL_rem—removal of cellulose after alkaline pre-treatment, HCEL_rem—removal of hemicellulose after alkaline pre-treatment, LIG_rem—removal of lignin after alkaline pre-treatment, BAR—biomass amount recovery, Glu—glucose concentration in enzymatic hydrolysates, Xyl.,Gal.,Man.,Arab.—reducing sugars concentration in enzymatic hydrolysate and Cel—cellobiose concentration in enzymatic hydrolysate).
Catalysts 09 00858 g006
Figure 7. (a) Cluster dendrogram for different biomasses based on criteria for correlation matrix analyzed for data repeated in triplicates. (b) Principal component analysis and defined groups according to parameters presented in Figure 6. First series: 1—EW(1); 2—B(1); 3—EP(1); 4—MG(1); 5—CC(1) and 6—TP(1); second series: 7—EW(2); 8—B(2); 9—EP(2); 10—MG(2); 11—CC(2) and 12—TP(2) and third series: 13—EW(3); 14—B(3); 15—EP(3); 16—MG(3); 17—CC(3) and 18—TP(3).
Catalysts 09 00858 g007
Figure 8. Possible pathways of biomass application in bioconversion and biorefining processes based on the results of the presented study.
Catalysts 09 00858 g008
Table 1. Content of cellulose, hemicellulose and lignin in lignocellulosic biomasses of energetic willow wood (EW), beech wood (B), energetic poplar wood (EP), meadow grass (MG), corn cobs (CC) and triticale paleas (TP) before and after the MEA pre-treatment.
BiomassCellulose Content (%)Hemicellulose Content (%)Lignin Content (%)Ash and Extractives (Ethanol) (%)Cellulose Content after Delignification (%) *Hemicellulose Content after Delignification (%) *Lignin Content after Delignification (%) *Cellulose Removal (%)Hemicellulose Removal (%)Lignin Removal (%)
EW46.5 ± 0.515.6 ± 0.529.4 ± 0.58.5 ± 0.546.5 ± 0.514.3 ± 0.55.9 ± 0.5<LOD8.2 ± 0.579.9 ± 0.5
B38.6 ± 0.519.9 ± 0.528. ± 0.513.2 ± 0.538.6 ± 0.517.6 ± 0.56.2 ± 0.5<LOD11.4 ± 0.579.9 ± 0.5
EP39.5 ± 0.522.2 ± 0.526.3 ± 0.511.7 ± 0.539.5 ± 0.519.5 ± 0.55.2 ± 0.5<LOD12.1 ± 0.580.2 ± 0.5
MG27.1 ± 0.522.6 ± 0.516.8 ± 0.533.5 ± 0.526.7 ± 0.519.8 ± 0.53.3 ± 0.51.4 ± 0.512.4 ± 0.580 ± 0.5.
CC41.0 ± 0.522.6 ± 0.514.2 ± 0.522.2 ± 0.540.6 ± 0.519.8 ± 0.50.4 ± 0.51.1 ± 0.512.8 ± 0.597.5 ± 0.5
TP39.1 ± 0.525.4 ± 0.518.4 ± 0.57.1 ± 0.538.8 ± 0.521.5 ± 0.51.4 ± 0.50.8 ± 0.515.4 ± 0.592.5 ± 0.5
(%)*—content of cellulose, hemicellulose or lignin after pre-treatment step is presented as a content of each polymer in the raw material, respectively; LOD = 0.5%.
Table 2. Biomass amount recovery after the MEA pre-treatment for EW, B, EP, MG, CC and TP.
BiomassEWBEPMGCCTP
Biomass amount recovery after delignification (%)75.45 ± 0.1773.6 ± 0.2674.54 ± 0.3359.09 ± 0.2340.90 ± 0.3155.45 ± 0.54
Table 3. Biomass amount recovery after MEA pre-treatment for EW, B, EP, MG, CC and TP.
Carbon SourceHMF, g/LFurfural, g/LTPC, g/LLevulinic Acid g/L
Alkaline Hydrolysates/Enzymatic Hydrolysates
EW0.02 ± 0.01/<LOD0.01 ± 0.01/<LOD0.07 ± 0.02/<LOD0.01 ± 0.01/<LOD
B0.05 ± 0.02/<LOD0.07 ± 0.02/<LOD0.08 ±0.02/<LOD0.02 ± 0.01/<LOD
EP0.07 ± 0.02/<LOD0.04 ± 0.01/<LOD0.11 ± 0.02/<LOD0.01 ± 0.01/<LOD
MG0.23 ± 0.03/<LOD0.31 ± 0.04/<LOD0.51 ± 0.04/<LOD0.07 ± 0.01/<LOD
CC0.19 ± 0.01/<LOD0.22 ± 0.03/<LOD0.48 ± 0.08/<LOD0.08 ± 0.01/<LOD
TP0.19 ± 0.02/<LOD0.24 ± 0.02/<LOD0.44 ± 0.04/<LOD0.06 ± 0.01/<LOD
LOD: 0.012 mg/L (furfural); 1.120 mg/L (levulinic acid); 0.970 mg/L (HMF) and 0.009 mg/L (TPC).
Table 4. Content of selected carbohydrates in enzymatic hydrolysates of six different pre-treated lignocellulosic biomasses.
Raw MaterialGlucoseXyloseGalactoseMannose and ArabinoseCellobioseYTRS
(mg/gbiomass)
EW479 ± 0.8130 ± 0.0816 ± 0.3814 ± 0.0211 ± 0.09550 ± 1.38
B470 ± 0.8333 ± 0.226 ± 0.127 ± 0.2111 ± 0.11527 ± 1.49
EP472 ± 0.5839 ± 0.4114 ± 0.2211 ± 0.232 ± 0.14538 ± 1.58
MG376 ± 0.6881 ± 0.2448 ± 0.4113 ± 0.4120 ± 0.16482 ± 1.90
CC401 ± 0.7645 ± 0.1825 ± 0.1816 ± 0.325 ± 0.06492 ± 1.50
TP422 ± 0.3336 ± 0.3826 ± 0.1418 ± 0.1614 ± 0.09516 ± 1.10
Table 5. Changes in the sugar concentration during dark fermentation for different broths.
Carbon SourceTime,
h
Disaccharides,
g/L
Glucose,
g/L
Galactose,
g/L
Pentoses,
g/L
YTRS,
g/L
GlucoseInitial0.00 ± 0.055.50 ± 0.050.00 ± 0.050.00 ± 0.055.50 ± 0.2
60.00 ± 0.053.47 ± 0.050.00 ± 0.050.00 ± 0.053.47 ± 0.2
200.00 ± 0.052.01 ± 0.050.00 ± 0.050.00 ± 0.052.01 ± 0.2
320.00 ± 0.051.22 ± 0.050.00 ± 0.050.00 ± 0.051.22 ± 0.2
500.00 ± 0.050.05 ± 0.050.00 ± 0.050.00 ± 0.050.05 ± 0.2
Final0.00 ± 0.050.00 ± 0.050.00 ± 0.050.00 ± 0.050.00 ± 0.2
BlankInitial0.00 ± 0.050.50 ± 0.050.00 ± 0.050.00 ± 0.050.50 ± 0.2
60.00 ± 0.050.32 ± 0.050.00 ± 0.050.00 ± 0.050.32 ± 0.2
200.00 ± 0.050.14 ± 0.050.00 ± 0.050.00 ± 0.050.14 ± 0.2
320.00 ± 0.050.04 ± 0.050.00 ± 0.050.00 ± 0.050.04 ± 0.2
500.00 ± 0.050.02 ± 0.050.00 ± 0.050.00 ± 0.050.02 ± 0.2
Final0.00 ± 0.050.00 ± 0.050.00 ± 0.050.00 ± 0.050.00 ± 0.2
EPInitial0.14 ± 0.054.61 ± 0.050.22 ± 0.050.53 ± 0.055.50 ± 0.2
20.11 ± 0.054.22 ± 0.050.18 ± 0.050.44 ± 0.054.95 ± 0.2
40.04 ± 0.053.01 ± 0.050.17 ± 0.050.31 ± 0.053.89 ± 0.2
240.00 ± 0.050.84 ± 0.050.14 ± 0.050.27 ± 0.051.25 ± 0.2
480.00 ± 0.050.04 ± 0.050.02 ± 0.050.17 ± 0.050.23 ± 0.2
Final0.00 ± 0.050.02 ± 0.050.00 ± 0.050.09 ± 0.050.11 ± 0.2
EWInitial0.09 ± 0.054.51 ± 0.050.34 ± 0.050.56 ± 0.055.50 ± 0.2
20.07 ± 0.054.37 ± 0.050.29 ± 0.050.42 ± 0.055.15 ± 0.2
50.04 ± 0.053.98 ± 0.050.29 ± 0.050.38 ± 0.054.69 ± 0.2
240.04 ± 0.051.98 ± 0.050.18 ± 0.050.27 ± 0.052.47 ± 0.2
480.02 ± 0.051.11 ± 0.050.14 ± 0.050.12 ± 0.051.39 ± 0.2
Final0.00 ± 0.050.01 ± 0.050.02 ± 0.050.05 ± 0.050.08 ± 0.2
BInitial0.08 ± 0.054.44 ± 0.050.41 ± 0.050.57 ± 0.055.50 ± 0.2
20.08 ± 0.054.38 ± 0.050.38 ± 0.050.51 ± 0.055.35 ± 0.2
50.06 ± 0.054.15 ± 0.050.35 ± 0.050.48 ± 0.055.04 ± 0.2
240.04 ± 0.052.24 ± 0.050.33 ± 0.050.37 ± 0.052.98 ± 0.2
480.04 ± 0.050.25 ± 0.050.22 ± 0.050.05 ± 0.050.56 ± 0.2
Final0.03 ± 0.050.00 ± 0.050.00 ± 0.050.02 ± 0.050.05 ± 0.2
CCInitial0.12 ± 0.054.49 ± 0.050.42 ± 0.050.47 ± 0.055.50 ± 0.2
20.01 ± 0.054.33 ± 0.050.37 ± 0.050.38 ± 0.055.09 ± 0.2
50.09 ± 0.054.02 ± 0.050.31 ± 0.050.34 ± 0.054.76 ± 0.2
240.04 ± 0.051.98 ± 0.050.22 ± 0.050.32 ± 0.052.56 ± 0.2
480.04 ± 0.050.42 ± 0.050.14 ± 0.050.22 ± 0.050.82 ± 0.2
Final0.02 ± 0.050.00 ± 0.050.00 ± 0.050.08 ± 0.050.10 ± 0.2
TPInitial0.16 ± 0.054.01 ± 0.050.68 ± 0.050.65 ± 0.055.50 ± 0.2
20.12 ± 0.053.85 ± 0.050.52 ± 0.050.56 ± 0.055.05 ± 0.2
50.12 ± 0.053.16 ± 0.050.48 ± 0.050.49 ± 0.054.25 ± 0.2
240.08 ± 0.051.55 ± 0.050.47 ± 0.050.41 ± 0.052.51 ± 0.2
480.04 ± 0.050.32 ± 0.050.21 ± 0.050.00 ± 0.050.57 ± 0.2
Final0.04 ± 0.050.00 ± 0.050.00 ± 0.050.00 ± 0.050.04 ± 0.2
MGInitial0.07 ± 0.053.98 ± 0.050.60 ± 0.050.85 ± 0.055.50 ± 0.2
20.07 ± 0.053.57 ± 0.050.52 ± 0.050.85 ± 0.055.01 ± 0.2
50.07 ± 0.053.41 ± 0.050.49 ± 0.050.84 ± 0.054.81 ± 0.2
240.07 ± 0.051.53 ± 0.050.40 ± 0.050.81 ± 0.052.81 ± 0.2
480.00 ± 0.050.24 ± 0.050.31 ± 0.050.00 ± 0.050.55 ± 0.2
Final0.00 ± 0.050.00 ± 0.050.00 ± 0.050.00 ± 0.050.00 ± 0.2
Table 6. Hydrogen productivity for different raw materials after 48 h.
Raw Biomass GEWBEPMGCCTP
Overall hydrogen productivitymL/gbiomass-25.44 ± 0.4224.01 ± 0.8723.41 ± 1.557.22 ± 0.8914.37 ± 1.0517.82 ± 1.52
mL/YTRS727.31 ± 3.55283.45 ± 1.87264.27 ± 2.44278.22 ± 1.98140.51 ± 0.89202.39 ± 4.25231.21 ± 3.22
Table 7. Places of origin and time of harvesting samples of wood (EW, EP and B), cereals (CC and TP) and grass (MG).
Biomass TypeEnergetic Willow (EW)Beech (B)Energetic Poplar (EP)Meadow Grass (MG)Corn Cobs (CC)Triticale (TP)
SourceLocal farm Wejherowo
Poland
Local forest Wejherowo
Poland
Local farm Wejherowo
Poland
Local farm Pępowo
Poland
Local farm Kościerzyna
Poland
Local farm Wejherowo
Poland
Geographical coordinates54.635538 N
18.246602 E
54.601425 N
18.175480 E
54.635538 N
18.246602 E
54.370719 N
18.399078 E
54.080518 N
17.928266 E
54.635538 N
18.246602 E
Collection timeSeptember 2016October 2016September 2016August 2016September 2016September 2016

