Article

Electronic Structure and Optical Properties of BiOI as a Photocatalyst Driven by Visible Light

1
Faculty of Materials Science and Engineering, Kunming University of Science and Technology, Kunming 650093, China
2
Yunnan Key Laboratory of Micro/Nano Materials & Technology, School of Materials Science and Engineering, Yunnan University, Kunming 650504, China
*
Author to whom correspondence should be addressed.
Catalysts 2016, 6(9), 133; https://doi.org/10.3390/catal6090133
Submission received: 24 June 2016 / Revised: 21 August 2016 / Accepted: 26 August 2016 / Published: 3 September 2016

Abstract

:
Bismuth oxyiodide (BiOI) is an important photoelectric functional material that has a wide range of applications. In particular, it can be used as a photocatalyst that shows photocatalytic activity under visible-light irradiation. The synthesis procedure and related photocatalytic performance of BiOI have been reported. However, some of its fundamental properties still need to be further investigated. In this article, density functional theory calculations were performed to investigate the crystal structure, electronic properties, and optical properties of BiOI. Furthermore, the relationship between the intrinsic properties and the photocatalytic performance of BiOI was investigated. Based on the calculated results of the band structure, density of states, and projected wave function, the molecular-orbital bonding structure of BiOI is proposed. As a semiconductor photocatalyst, BiOI shows slight optical anisotropy in the visible-light region, indicating that it can efficiently absorb visible light if the morphology of BiOI is controlled. After comparing several computational methods, it was found that the generalized-gradient approximation corrected for on-site Coulomb interactions (GGA + U) is a suitable computational method for large sized BiOI models (e.g., impurity doping, the surface, and the interface) because it can significantly reduce the computational time while maintaining calculation accuracy. Thus, this article not only provides an in-depth understanding of the fundamental properties of BiOI as a potential efficient photocatalyst driven by visible light, but it also suggests a suitable computational method to investigate these properties.

Graphical Abstract

1. Introduction

Semiconductor photocatalysis technology is considered to be a promising solution for energy shortage and environmental protection because it can produce hydrogen by photocatalytic water splitting [1] and decompose organic pollutants [2,3]. However, traditional photocatalysts have a wide band gap and low quantum conversion efficiency. Therefore, it is difficult to effective utilize solar energy. Recently, two approaches have been used to develop highly efficient photocatalysts: modification of traditional photocatalysts (e.g., TiO2 and ZnO) [4,5] and development of novel photocatalysts or photocatalytic systems [6,7,8,9].
BiOX (X = F, Cl, Br, or I) is a representative novel photocatalyst, and it has become a hot research topic because of its particular layered crystal structure, suitable band gap, and high photocatalytic activity under both ultraviolet (UV) and visible-light irradiation [10,11]. Its structure is composed of a layer of (Bi2O2)2+ slabs interleaved by double slabs of halogen ions X, forming stacked –X–Bi–O–O–Bi–X– layers by nonbonding van der Waals interactions through the halogen ions along the c axis. The built-in electric field that forms between the (Bi2O2)2+ and 2X layers can promote separation of photogenerated electrons and holes, and thus enhance the photocatalytic activity [12,13]. Zhang et al. synthesized BiOX microsphere samples by the hydrothermal method [14]. They found that all of the BiOX samples exhibited high photocatalytic activity under both UV and visible-light irradiation. Extensive research has subsequently focused on BiOX and BiOX-assisted photocatalysts, and these photocatalysts exhibit enhanced photocatalytic activity for degradation of dyes [15,16,17,18,19,20,21].
For different halogen components, the electronic properties, such as the band gap and built-in electric field, of BiOXs are different [22]. For example, under UV–visible-light irradiation, degradation of methyl orange (MO) on BiOBr and BiOI is about 25% and 95%, while degradation of MO on BiOCl and TiO2 is about 15% and 10%. Under visible-light irradiation (λ > 420 nm), BiOBr and BiOI can degrade 21% and 80% of MO in 3 h, while degradation of MO on BiOCl and C-doped TiO2 is about 15% and 6% [14]. The higher photocatalytic activity of BiOI is attributed to its suitable band gap. As the atomic number of halogen increases, the band gap of BiOX decreases. The band gap of BiOI is 1.89 eV, which corresponds to a threshold wavelength of 650 nm, and it has efficient photocatalytic performance under visible-light irradiation [23]. For instance, Mi et al. synthesized BiOI nanosheets with exposed {001} facets by a facile hydrothermal route and found that the sample exhibited enhanced photocatalytic activity for degradation of rhodamine-B (RhB), MO, and phenol under visible-light irradiation because of the appropriate diffusion length and internal static electric field of BiOI [24]. In addition, Pan et al. found that BiOI microspheres exhibit excellent catalytic activity for degradation of bisphenol A under visible-light irradiation [25].
However, the narrow band gap of BiOI leads to an increased recombination rate of photogenerated electron-hole pairs. This is disadvantageous for improvement of the quantum efficiency of BiOI. Furthermore, the band edge position of the conduction band (CB), namely, the reducing potential, of BiOI is low (~0.516 eV, vs. Normal Hydrogen Electrode, NHE), indicating that BiOI is not suitable for hydrogen generation by photocatalytic water splitting. Therefore, proper modification is necessary to improve the photocatalytic performance of BiOI, for example, impurity doping [26], heterostructure construction [27,28], BiOI1−xXx (X = Cl or Br) solid solution preparation [29], and nanostructure design [30]. To obtain better modification effects, it is necessary to investigate the electronic structure and optical properties of BiOI, which could provide a basic understanding of the relationship between the microstructure and the photocatalyst performance.
In this study, we optimized the structure of BiOI by different density functional theory (DFT) methods, including generalized-gradient approximation (GGA), GGA corrected for on-site Coulomb interactions (GGA + U), and Heyd-Scuseria-Ernzerhof (HSE06) methods. We calculated the electronic structure and relevant optical properties, including the dielectric function, refractive index, absorption coefficient, and reflectivity. We then determined its photoexcited electronic transition mechanism by exploring the associated relationships between the microstructure characteristics and the macroscopic optical properties. Based on the calculated results, the microscopic mechanism of the excellent photocatalytic activity and stability of BiOI was analyzed. These findings will provide useful information for understanding the fundamental properties of Bi-based photocatalysts.

2. Results and Discussion

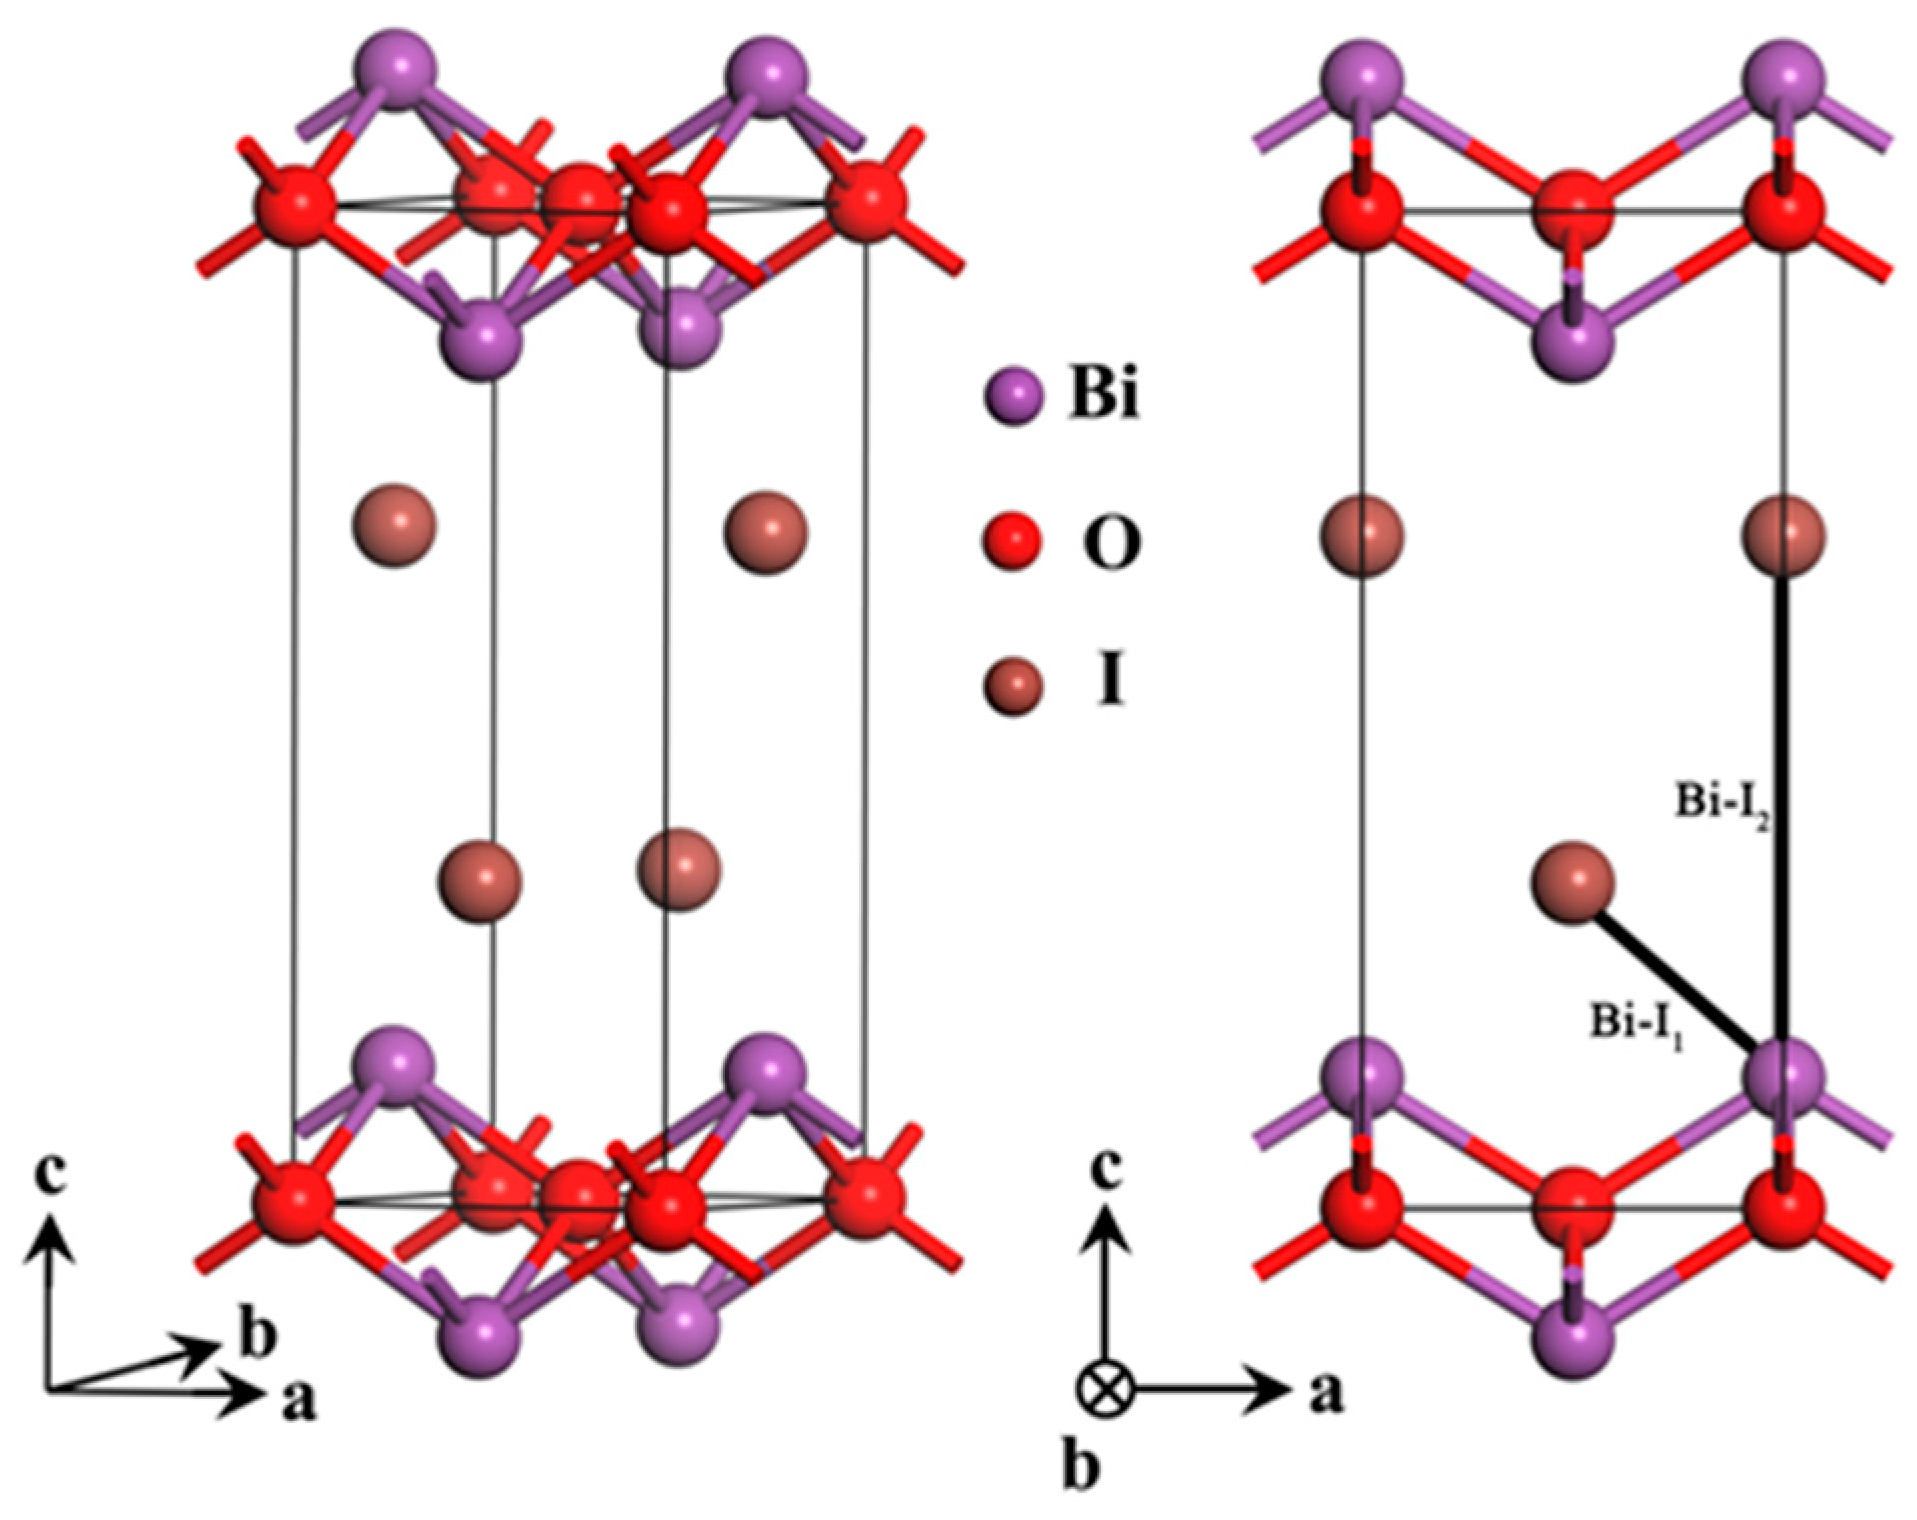
2.1. Optimized Structure

Figure 1 shows the primitive cell of the BiOI structure that is considered in the present work. The crystal structure of BiOI has the tetragonal matlockite PbFCl-type structure with symmetry of P4/nmm (space group) or D 4 h 7 (local symmetry). Each primitive cell is composed of two BiOI molecules. In other words, each primitive cell contains two bismuth atoms, two oxygen atoms, and two iodine atoms. The corresponding crystallographic parameters of the optimized crystal structure by the different methods (GGA, GGA + U, and HSE06) are listed in Table 1, in which the experimental measurements are also provided for comparison [31]. Compared with the experimental results, the cell volumes obtained by the GGA and GGA + U methods are slightly larger because all of the lattice constants are slightly larger. These calculated results suggest that the GGA and GGA + U methods reproduce the crystal structure of BiOI well. In the case of the HSE06 method, compared with the experimental crystal structure, the lattice constant along the a/b axis is slightly larger, while the lattice constant along the c axis is ~1.28 Å smaller, resulting in a significantly smaller cell volume. At present, the HSE06 method cannot use the DFT-D correction in CASTEP, which may cause this inaccurate result. As shown in Table 1, compared with the experimental values, for the GGA and GGA + U methods, the Bi–O and Bi–I1 bond lengths are slightly shorter, while the Bi–I2 bond lengths are slightly longer. Unfortunately, for the HSE06 method, all of the bond lengths are significantly shorter than the experimental values. The calculated results for the fractional coordinates suggest the trend of the lattice constants. In general, the GGA and GGA + U methods reproduce the crystal structure of BiOI well, while the HSE06 method is not suitable for this crystal structure. By investigating the underlying reasons, we found that the HSE06 method takes into account the electronic interaction by the hybrid functional form, resulting in addition of an extra interaction between layers of BiOI that is larger than the intrinsic van der Waals interaction, resulting in a clear decrease in the lattice parameter along the c axis. According to the calculated results, we found that the GGA + U method is a suitable computational method to simulate the crystal structure of BiOI, as well as the electronic structure and optical properties. In other words, the GGA + U method has a good balance between the accuracy of the calculated results and the available computational resources.
The most important feature of BiOI is the open layered intergrowth crystal structure, which induces local internal fields through polarization of atoms in the space between the layers. This unique feature assists in effective separation of photogenerated electron-hole pairs. Sato et al. reported that the local internal fields, owing to the dipole moments of distorted polyhedra, can promote charge separation in the very initial process of photoexcitation and they are useful for enhancing the photocatalytic activity [32]. In the present work, we found that all three methods did not change this important crystal feature. With the Mulliken charges and lattice parameters in Table 1 and Table 2, the absolute values of the dipole moments for the BiO4I4 polyhedra within the relaxed BiOI crystal structure for the different DFT methods are 2.502 D (GGA), 2.624 D (GGA + U), and 3.933 D (HSE06). The estimated values by the former two methods are consistent with previous reports [33,34], while the HSE06 method clearly overestimates the value because of the above-mentioned reason.

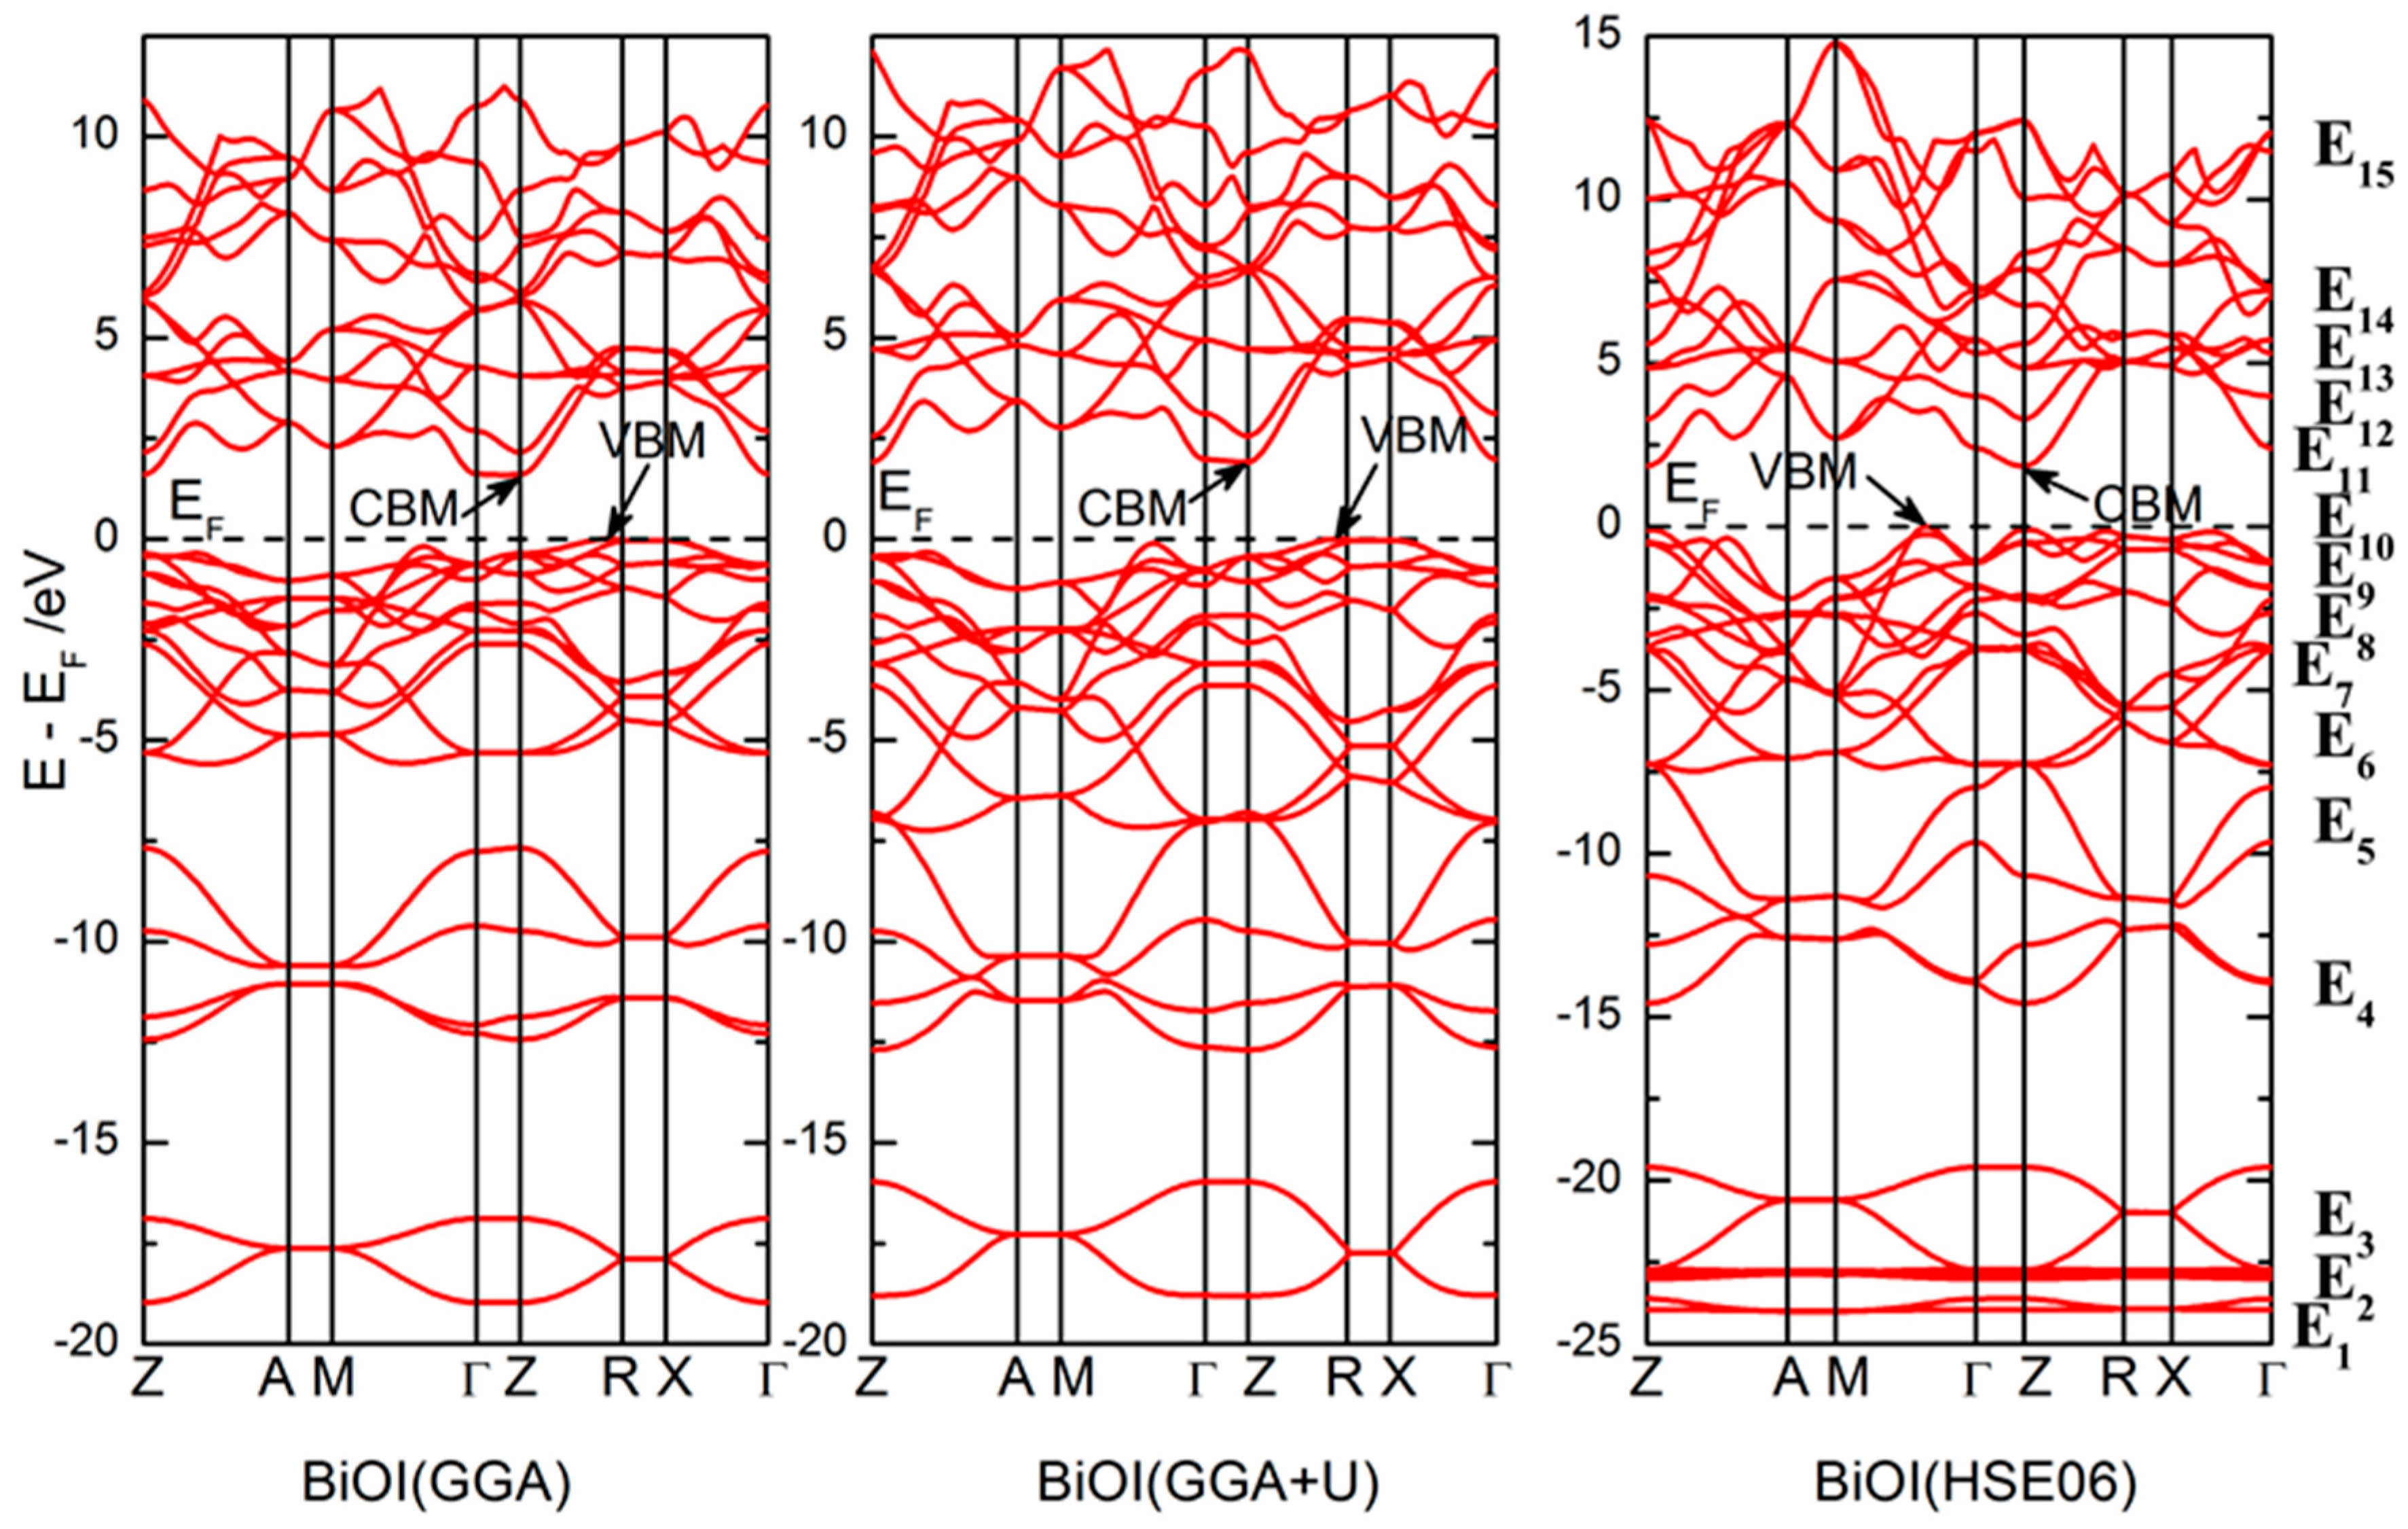
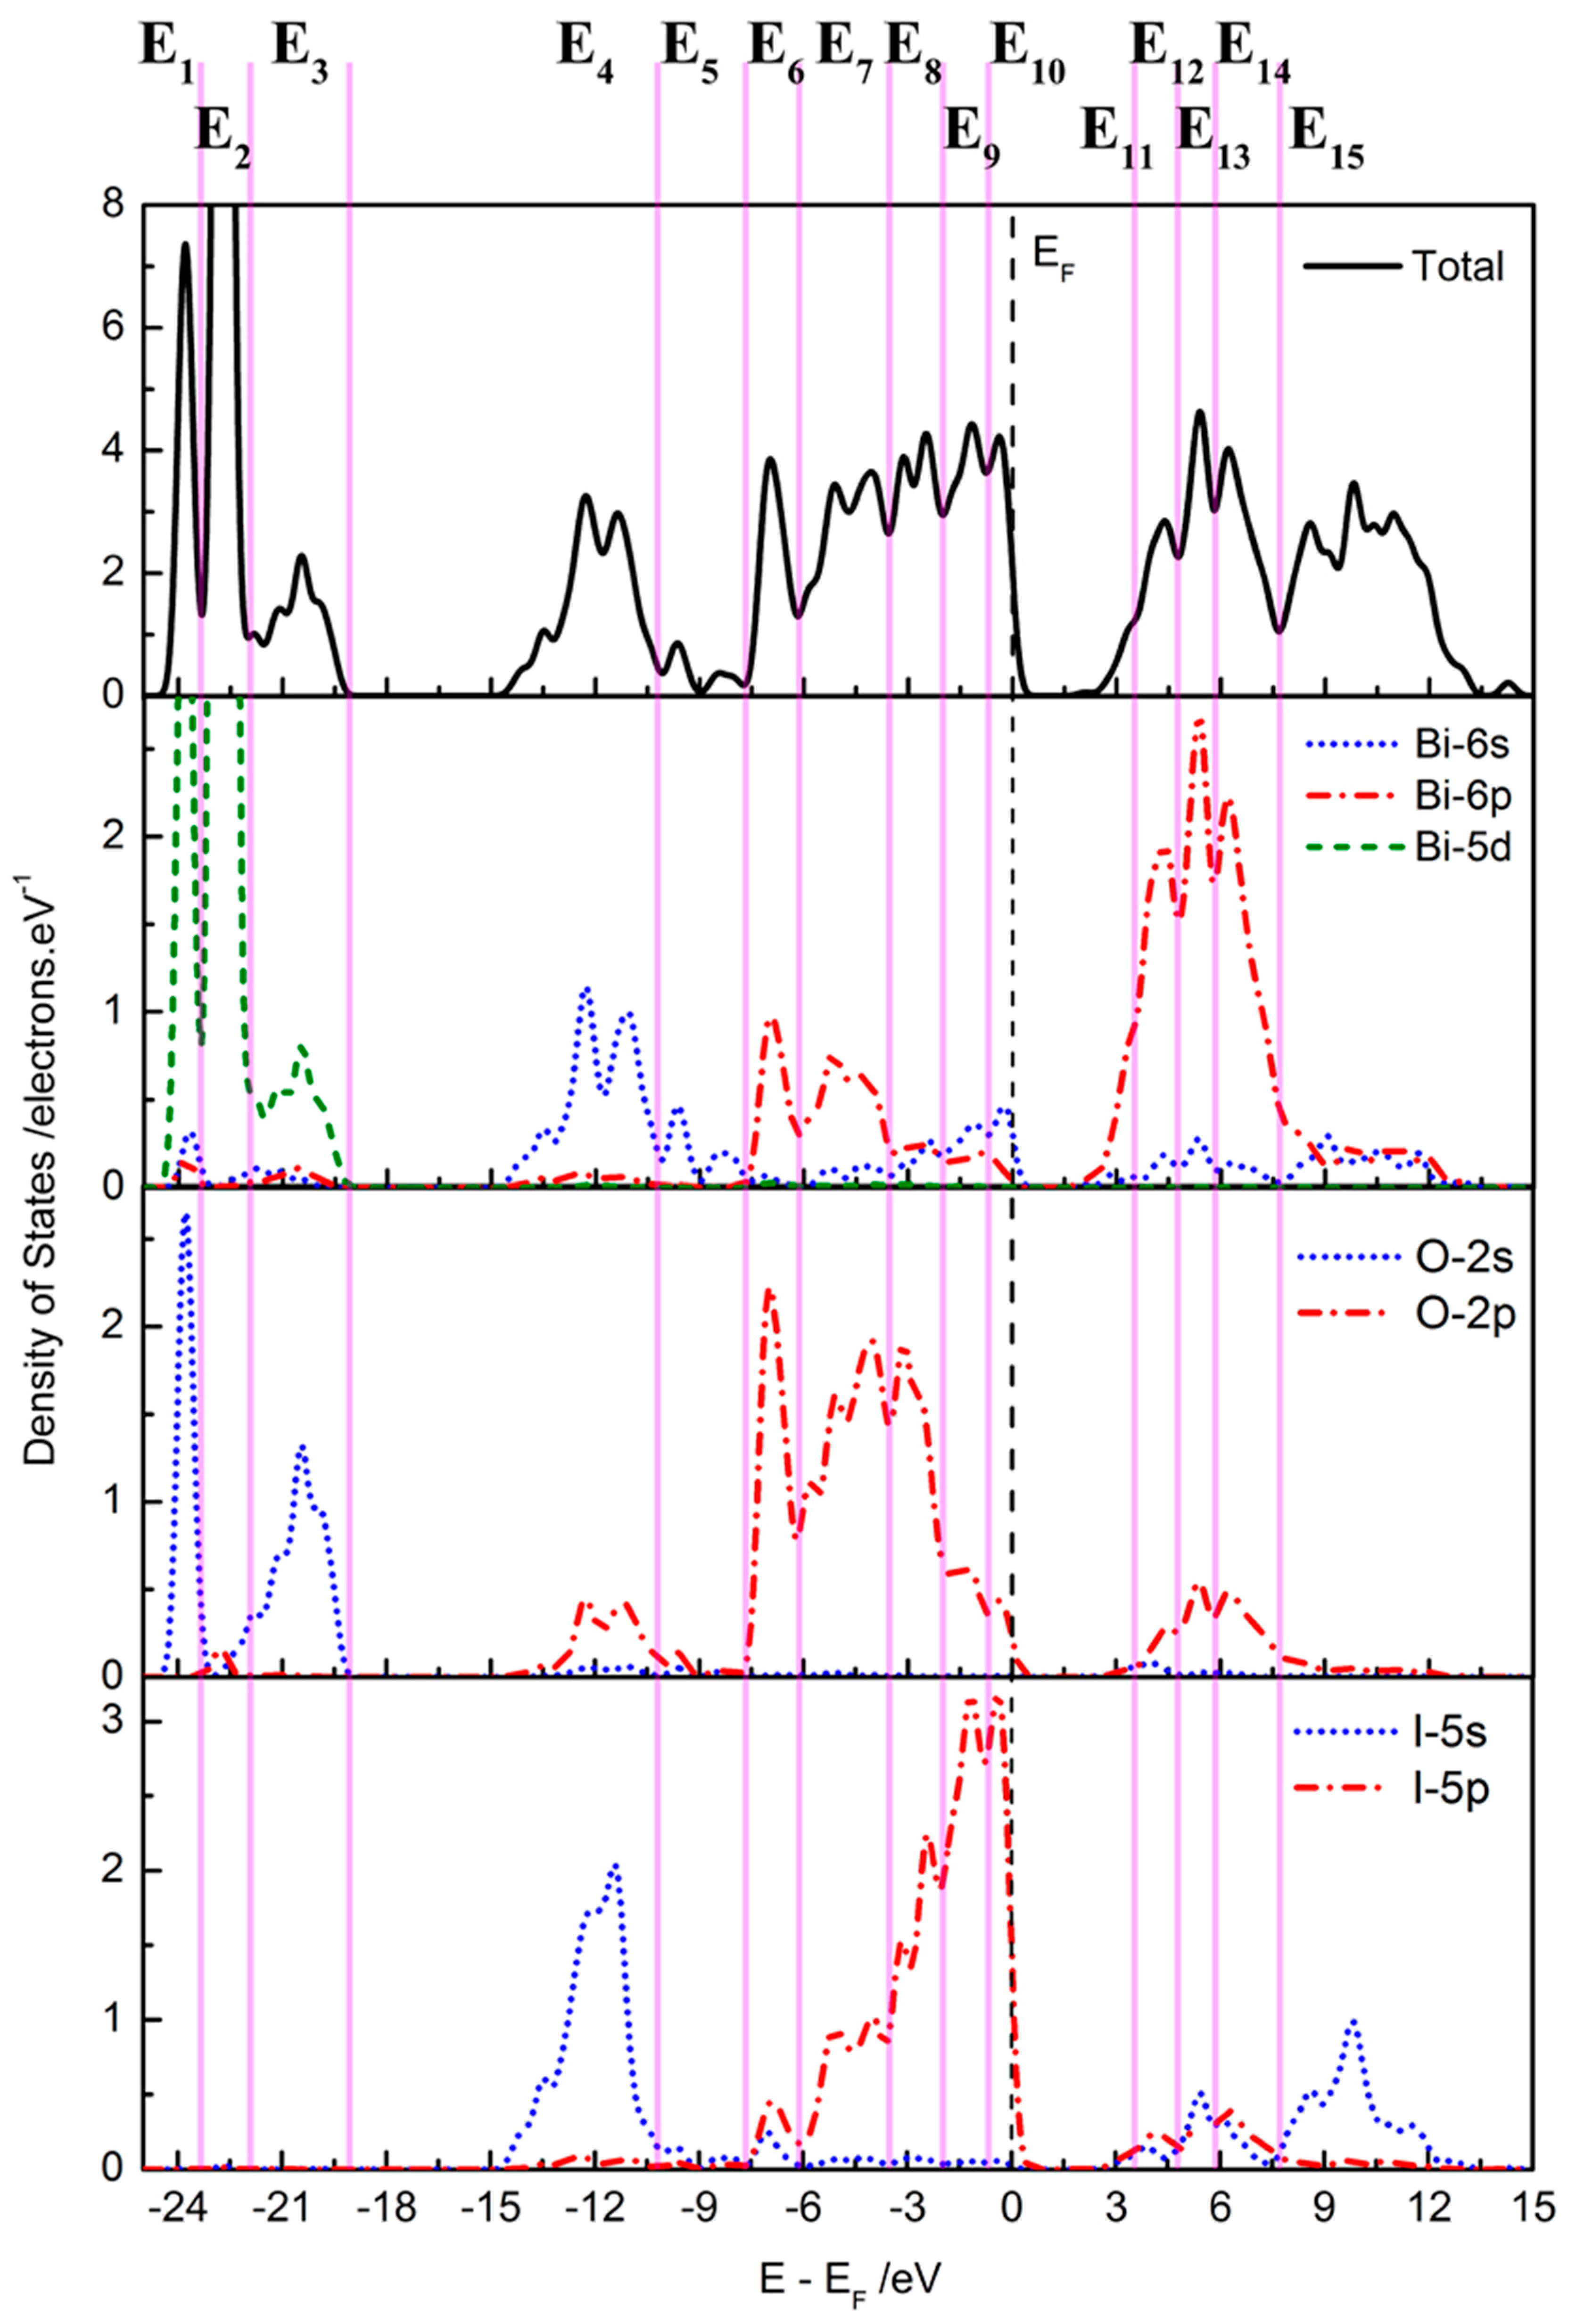
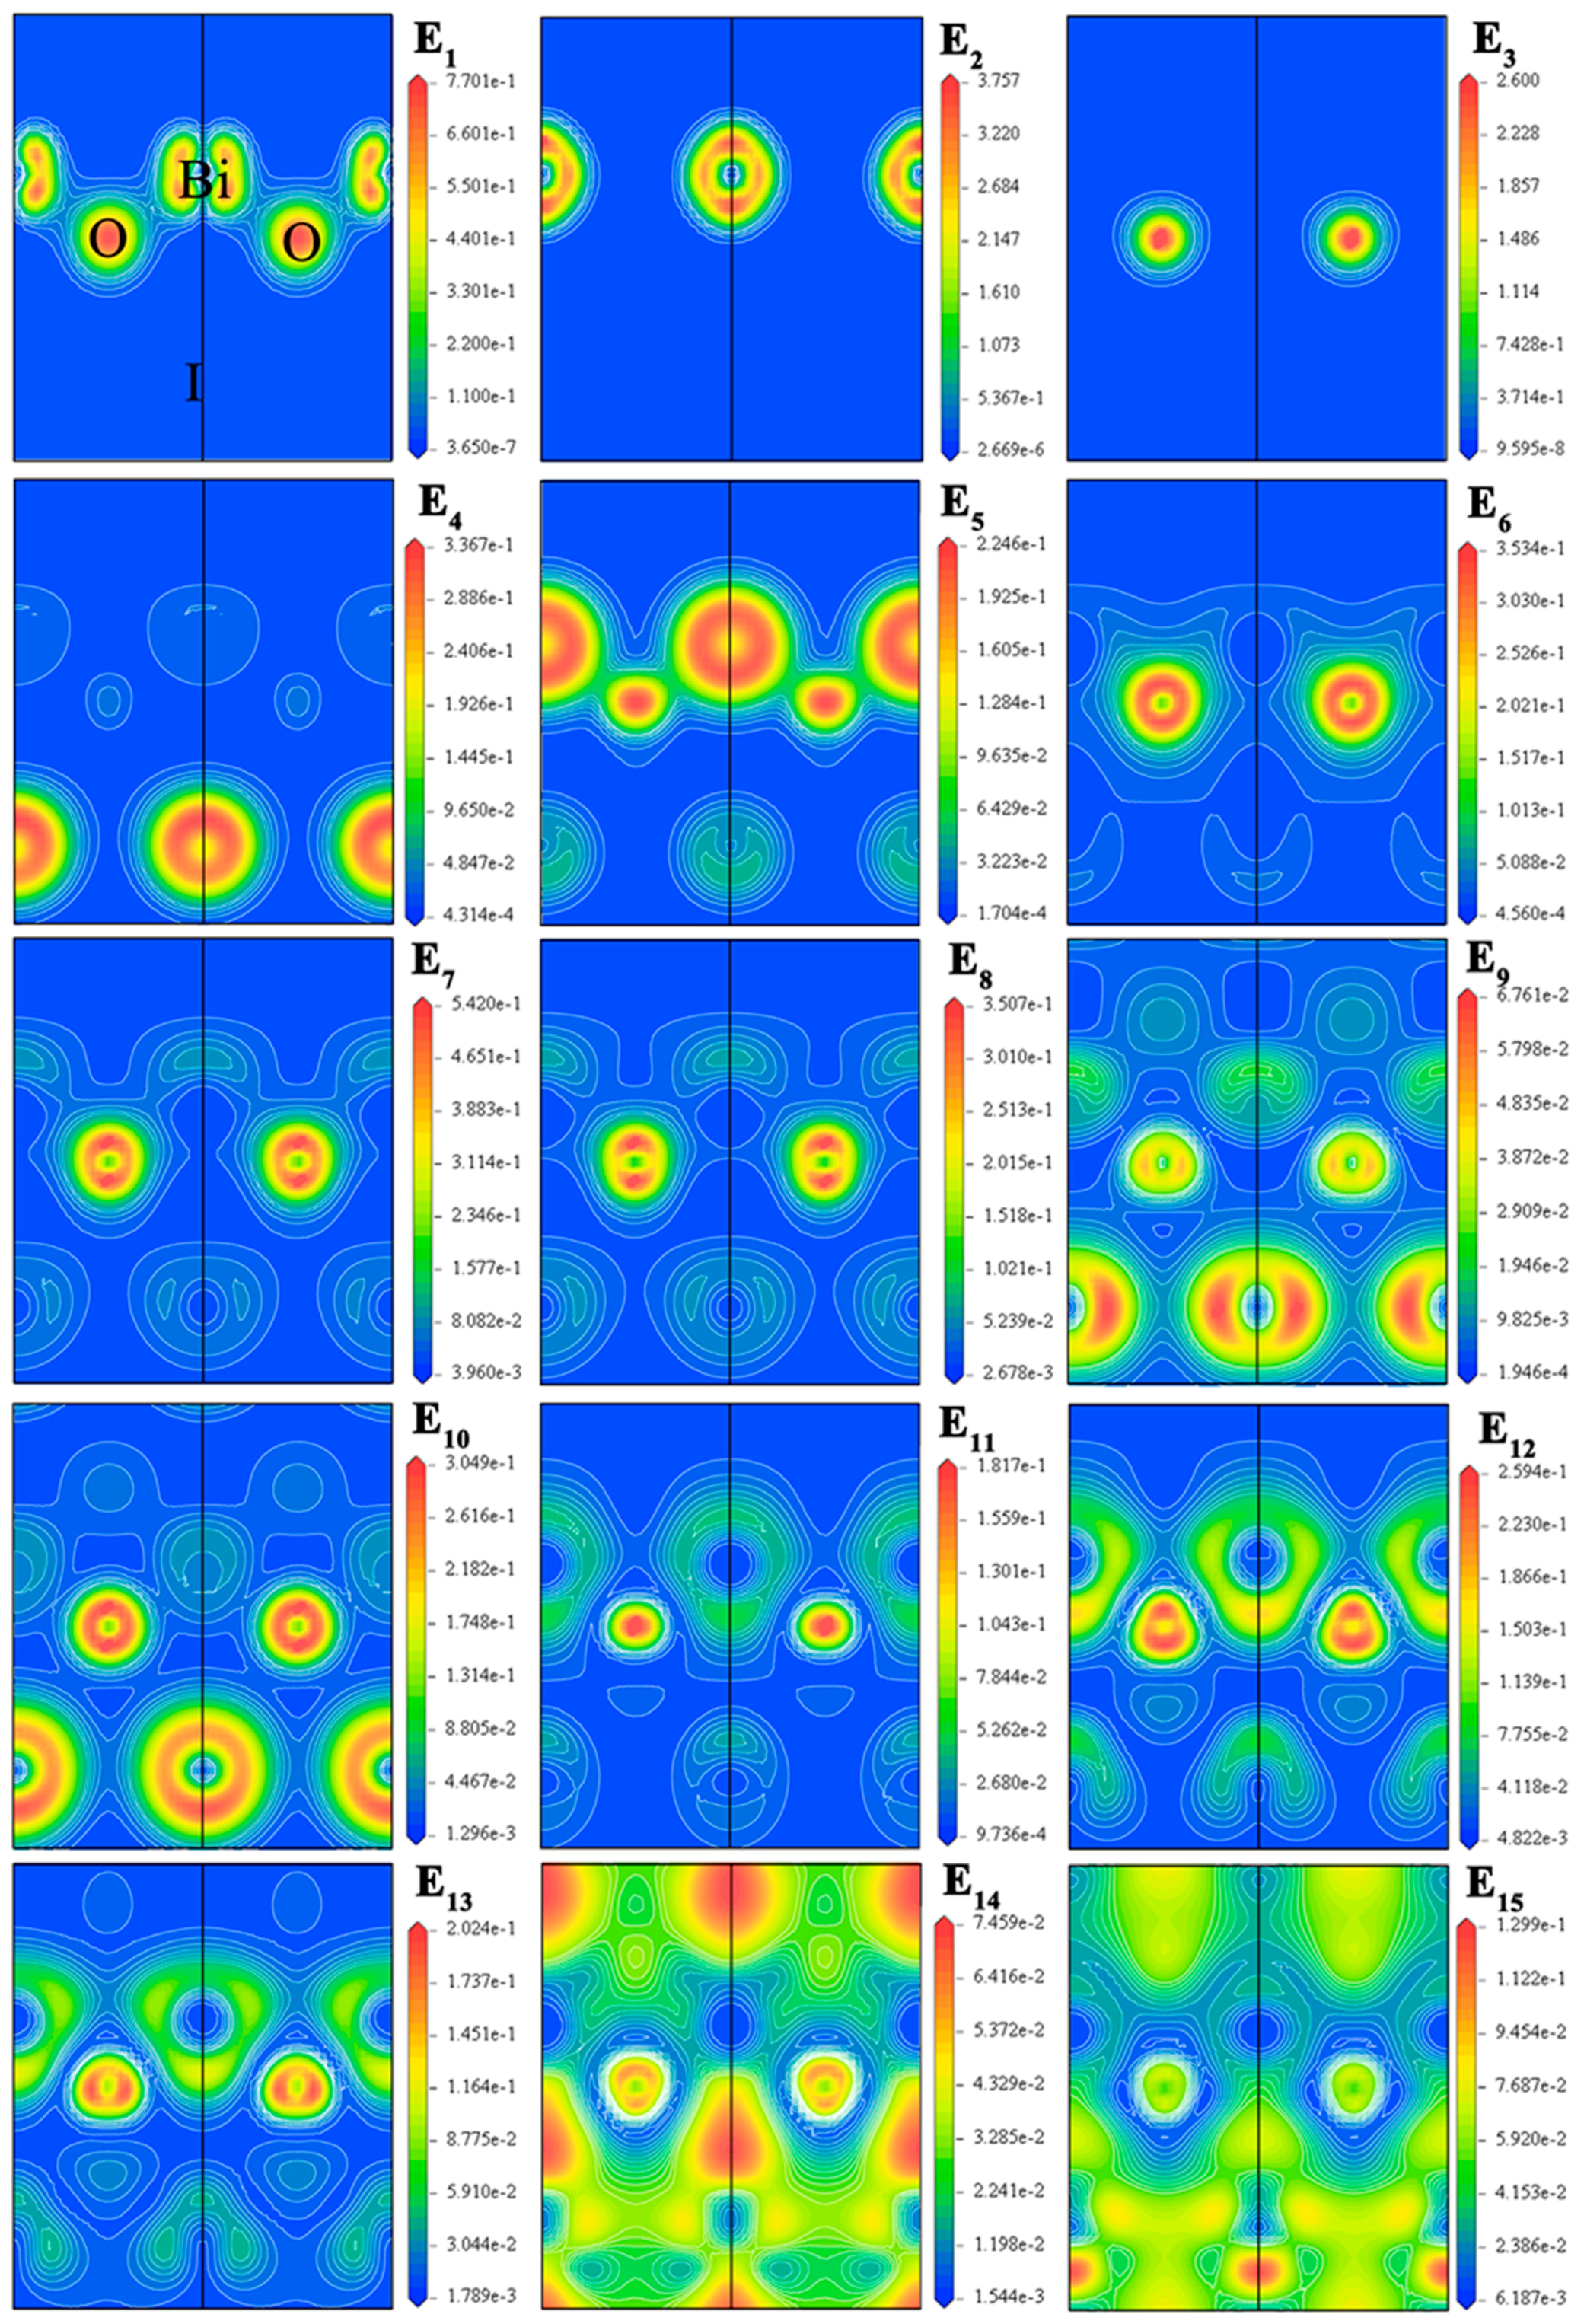
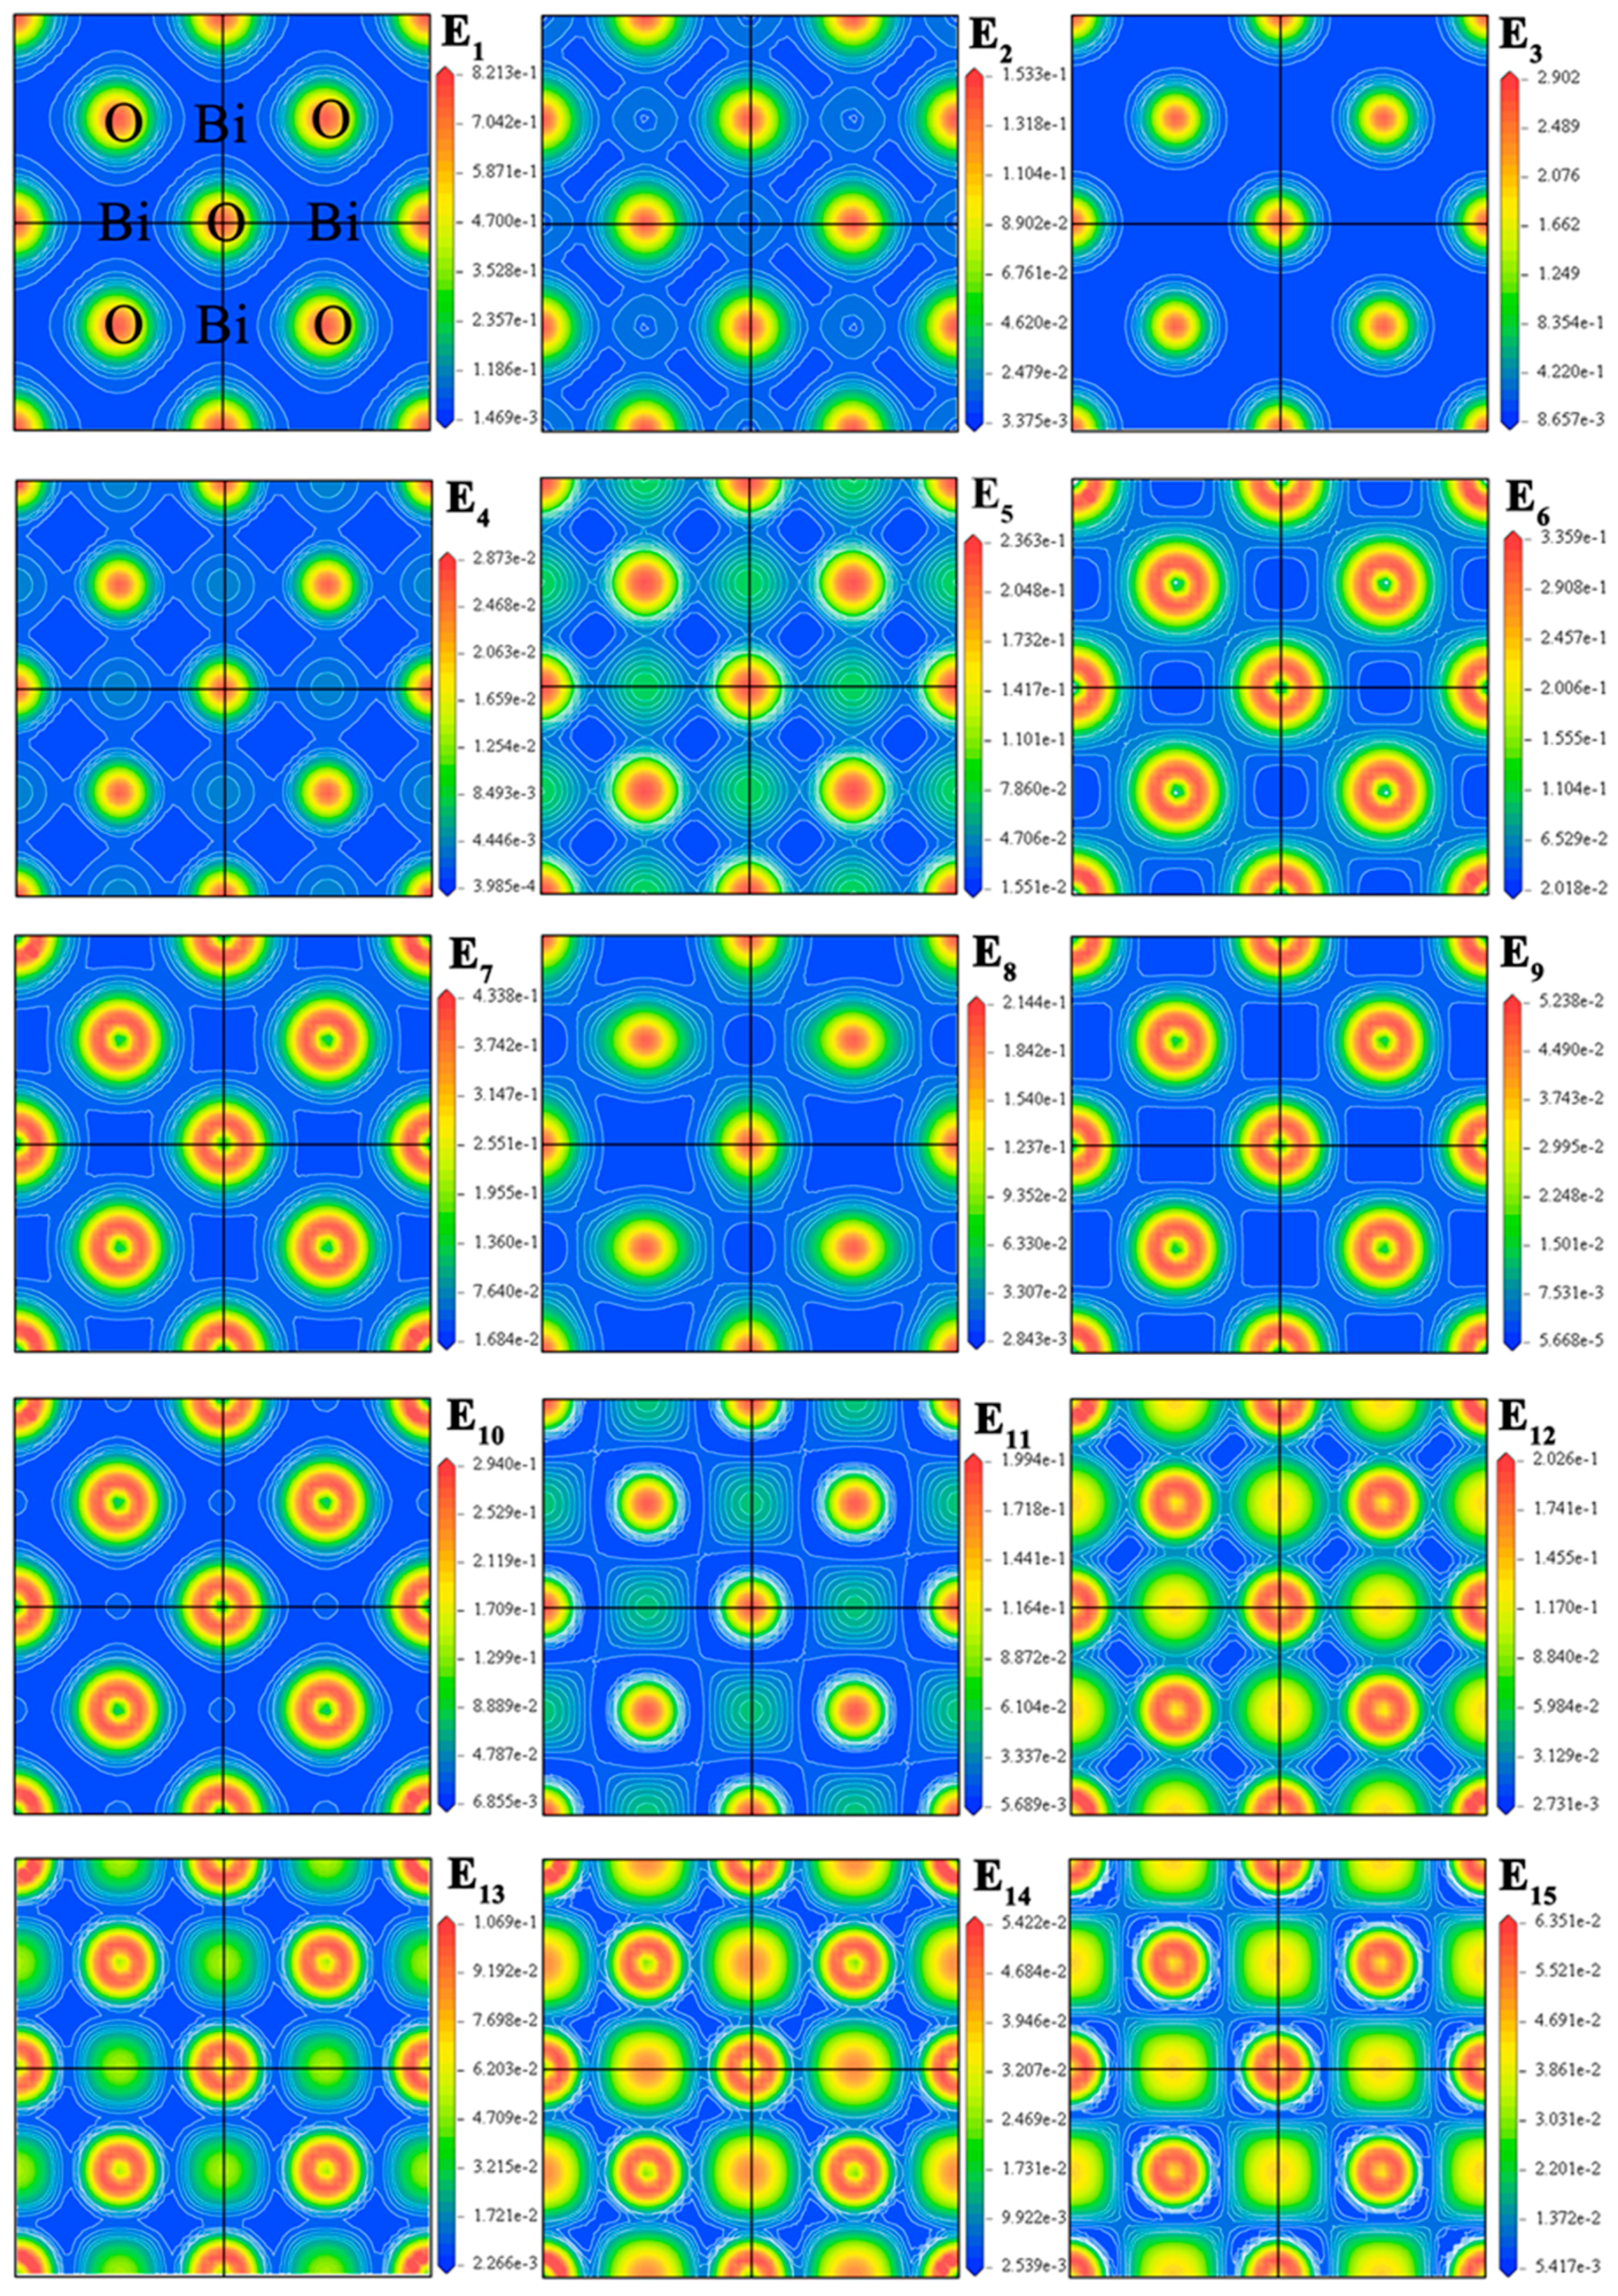
2.2. Electronic Structure

The band structures of BiOI obtained by the different DFT methods are shown in Figure 2. The energy zero point (i.e., the Fermi energy level, EF) is set at the valence band (VB) maximum (VBM). In the cases of the GGA and GGA + U calculations, the VBM is located at the k-point line of Z → R, and the CB (conduction band) minimum (CBM) is located at the k-point of Z. In the case of the HSE06 calculation, the VBM is located at the k-point line of M → Γ, and the CBM is located at the k-point of Z. All of the results calculated by the different DFT methods indicate that BiOI is an indirect band gap semiconductor. The spin-orbit coupling effect was considered, but we found that the spin-up states and spin-down states are completely coincident. Therefore, in the following discussion, spin-orbit coupling is not provided. The band gap (i.e., the distance from the VBM to the CBM) obtained by the GGA method is 1.623 eV, which is less than the experimental value (~1.9 eV) but consistent with previous theoretical calculations [12,29,35,36]. The underestimated band gap value obtained by the GGA method is because of the well-known shortcoming of the GGA method [37,38]. The band gaps obtained by the GGA + U and HSE06 methods are in good agreement with the experimental value (1.997 eV for the GGA + U method and 1.980 eV for the HSE06 method). In the HSE06 method, there are two dense energy bands in the range −24 to −23 eV, which are ascribed to the Bi-5d10 states. Huang et al. found that the shapes of the VB top and CB bottom are almost independent of the involvement of Bi-5d states [33,39]. Except for this feature in the case of HSE06 calculation, the level distribution area and scope of the VB and CB are highly consistent for the three methods. To better investigate the associated relationships between the microstructure characteristics and the macroscopic optical properties, we present the calculated results obtained by the HSE06 method, and the calculated results obtained by the GGA and GGA + U methods are provided in Figure S1.
For photoelectric applications, the effective mass of carriers is a very important parameter, which is defined as the curvature-dependent parameter at the extreme points of the forbidden band edge. By fitting the energy-momentum dependence, we estimated the effective masses of electrons (me*) on the bottom of the CB or the effective mass of holes (mh*) on the top of the VB based on the band structures obtained by the different DFT methods, and the results are listed in Table 3. The minimum of the effective mass of photogenerated electrons on the bottom of the CB is ~0.19 m0 at the k-point of Γ, which is significantly smaller than the values of conventional semiconductor photocatalysts (e.g., me* ≈ 1 m0 for anatase TiO2 [40] and me* ≈ 3–20 m0 for rutile TiO2 [41,42]). The minimum of the effective mass of photogenerated holes on the top of the VB is ~0.2 m0, which is significantly smaller than that of other oxide semiconductors (e.g., mh* ≈ 16 m0 for In2O3 [43]). For photocatalysis applications, photogenerated carriers with a smaller effective mass have higher mobility or a longer diffusion length, so they can reach surface reaction sites within their lifetime. The excellent photocatalytic performance of BiOI is exhibited in Methylene blue (MB) or other organic pollutant degradation under visible-light irradiation [14,27,28,30,44,45]. In these reaction processes, the dominant reactive species are photogenerated holes on the top of the VB. Therefore, the small effective mass of photogenerated holes in BiOI should contribute to the efficient photocatalytic performance.
To investigate the underlying chemical bonding mechanism of BiOI, the total density of states (DOS) and local partial DOS obtained by the HSE06 method are plotted in Figure 3. In the range −24.2 to −19 eV, there are three DOS peaks. The lowest peak predominantly consists of hybridized states between Bi-5d states and O-2s states. The middle peak mainly consists of Bi-5d states, with a slight contribution from O-2p states. The highest peak mainly consists of O-2s states and Bi-5d states. In the range −15 to −10.2 eV, the DOS peaks are mainly composed of I-5s and Bi-6s states, slightly hybridized with O-2p states. In the range −10.2 to −7.5 eV, Bi-6s states are localized, which is an almost isolated state. Most importantly, O-2p, I-5p, and Bi-6p states significantly contribute to the VB. In other words, the VB is mainly composed of the hybridization states between Bi-6p states and O-2p or I-5p states. The main feature of this band is the multiple peaks. At the bottom and middle of the VB, Bi-6s states also exhibit hybridization with O-2p or I-5p states, while the top of the VB is mainly composed of I-5p states. From the bottom to the top of the VB, the contribution of I-5p states gradually increases. At the bottom of the CB, the antibonding states of Bi–O and Bi–I, which are composed of Bi-6p, O-2p, and I-5p states, are much more disperse. The CB is mainly composed of Bi-6p states. Above 7 eV, the DOS peaks are mainly composed of I-5s states.
We then further examined the chemical bonding information. The projected contour maps of the electronic wave function were analyzed. In Figure 4 and Figure 5, we plot the projected wave function for the different energy ranges E1–E15, which are defined in Figure 2 and Figure 3, and the plane of contour maps parallel to the (100) and (001) surfaces, respectively. In the lowest energy region (E1), Bi-5d states are dominant. The Bi-5d states clearly hybridize with the O-2s states in this energy region, showing σ bonding features. In the E2 energy region, the Bi-5d states dominate the whole space, showing nonbonding features. A similar situation occurs in the next highest energy region (E3), which mainly shows nonbonding features of O-2s states. The O-2s states slightly hybridize with Bi-5d states in this energy region, showing σ bonding features. In the E4 energy region, the chemical bonding information shows an σ bonding feature, which comes from the Bi-6s states hybridizing with O-2p/I-5s states. In the next highest energy region, (E5), Bi-6s states are the predominant states, although the hybridization states of Bi-6s states with O-2p/I-5s states in the E4 energy region slightly extend to this energy region. In the next three highest energy regions (E6–E8), O-2p states are dominant, and show an obvious interaction with Bi-6p/I-5p states. In this energy region, there are two bonding features: the hybridized states between Bi-6p states and O-2p states show σ bonding features, and the hybridized states between Bi-6p states and I-5p states show π bonding features. In the E9 and E10 energy regions (where E10 is the top of the VB), I-5p states are the predominant states. The Bi-6s states are slightly hybridized with O-2p/I-5p states, and show σ bonding features. At the bottom of the CB (i.e., the E11 energy region), the predominant states are Bi-6p states, which interact with neighboring O-2p/I-5p states. There are two bonding features in this energy region: the hybridized states between Bi-6p states and O-2p states show σ antibonding features, and the hybridized states between Bi-6p states and I-5p states show π antibonding features. Similar situations are found in the next three energy regions (i.e., the E12–E14 energy regions). The only difference is that different atomic orbitals have different contributions for the same chemical bond. I-5s states predominately compose the last energy region (E15), and combine with Bi-6s states to form σ antibonding orbitals. In this energy region, the weak hybridized states between Bi-6s states and O-2p states also show σ antibonding features. Except for the abovementioned chemical bonding features, there is another important bonding feature in these contour maps: the hybridized states between Bi atoms and O atoms are very strong, so they mainly form covalent bonds, while the interaction between Bi atoms and I atoms is very weak, so they mainly form ionic bonds.
Combining the above calculated results of the band structure, density of states, and projected wave function, we propose the molecular-orbital bonding diagram of BiOI in Figure 6. A noticeable feature of the nonbonding state at the bottom of the CB is that it is mainly composed of Bi-6p states. Another important feature is the different chemical bonds between Bi and O/I atoms: the covalent bonds between Bi and O atoms arise from strong orbital hybridization, whereas the ionic bonds between Bi and I atoms in the lower energy regions (E1–E9) arise from electron gathering or loss. In the higher energy regions (E10–E15), orbital hybridization between Bi and I atoms becomes stronger, and thus covalent bonds form in these energy regions.

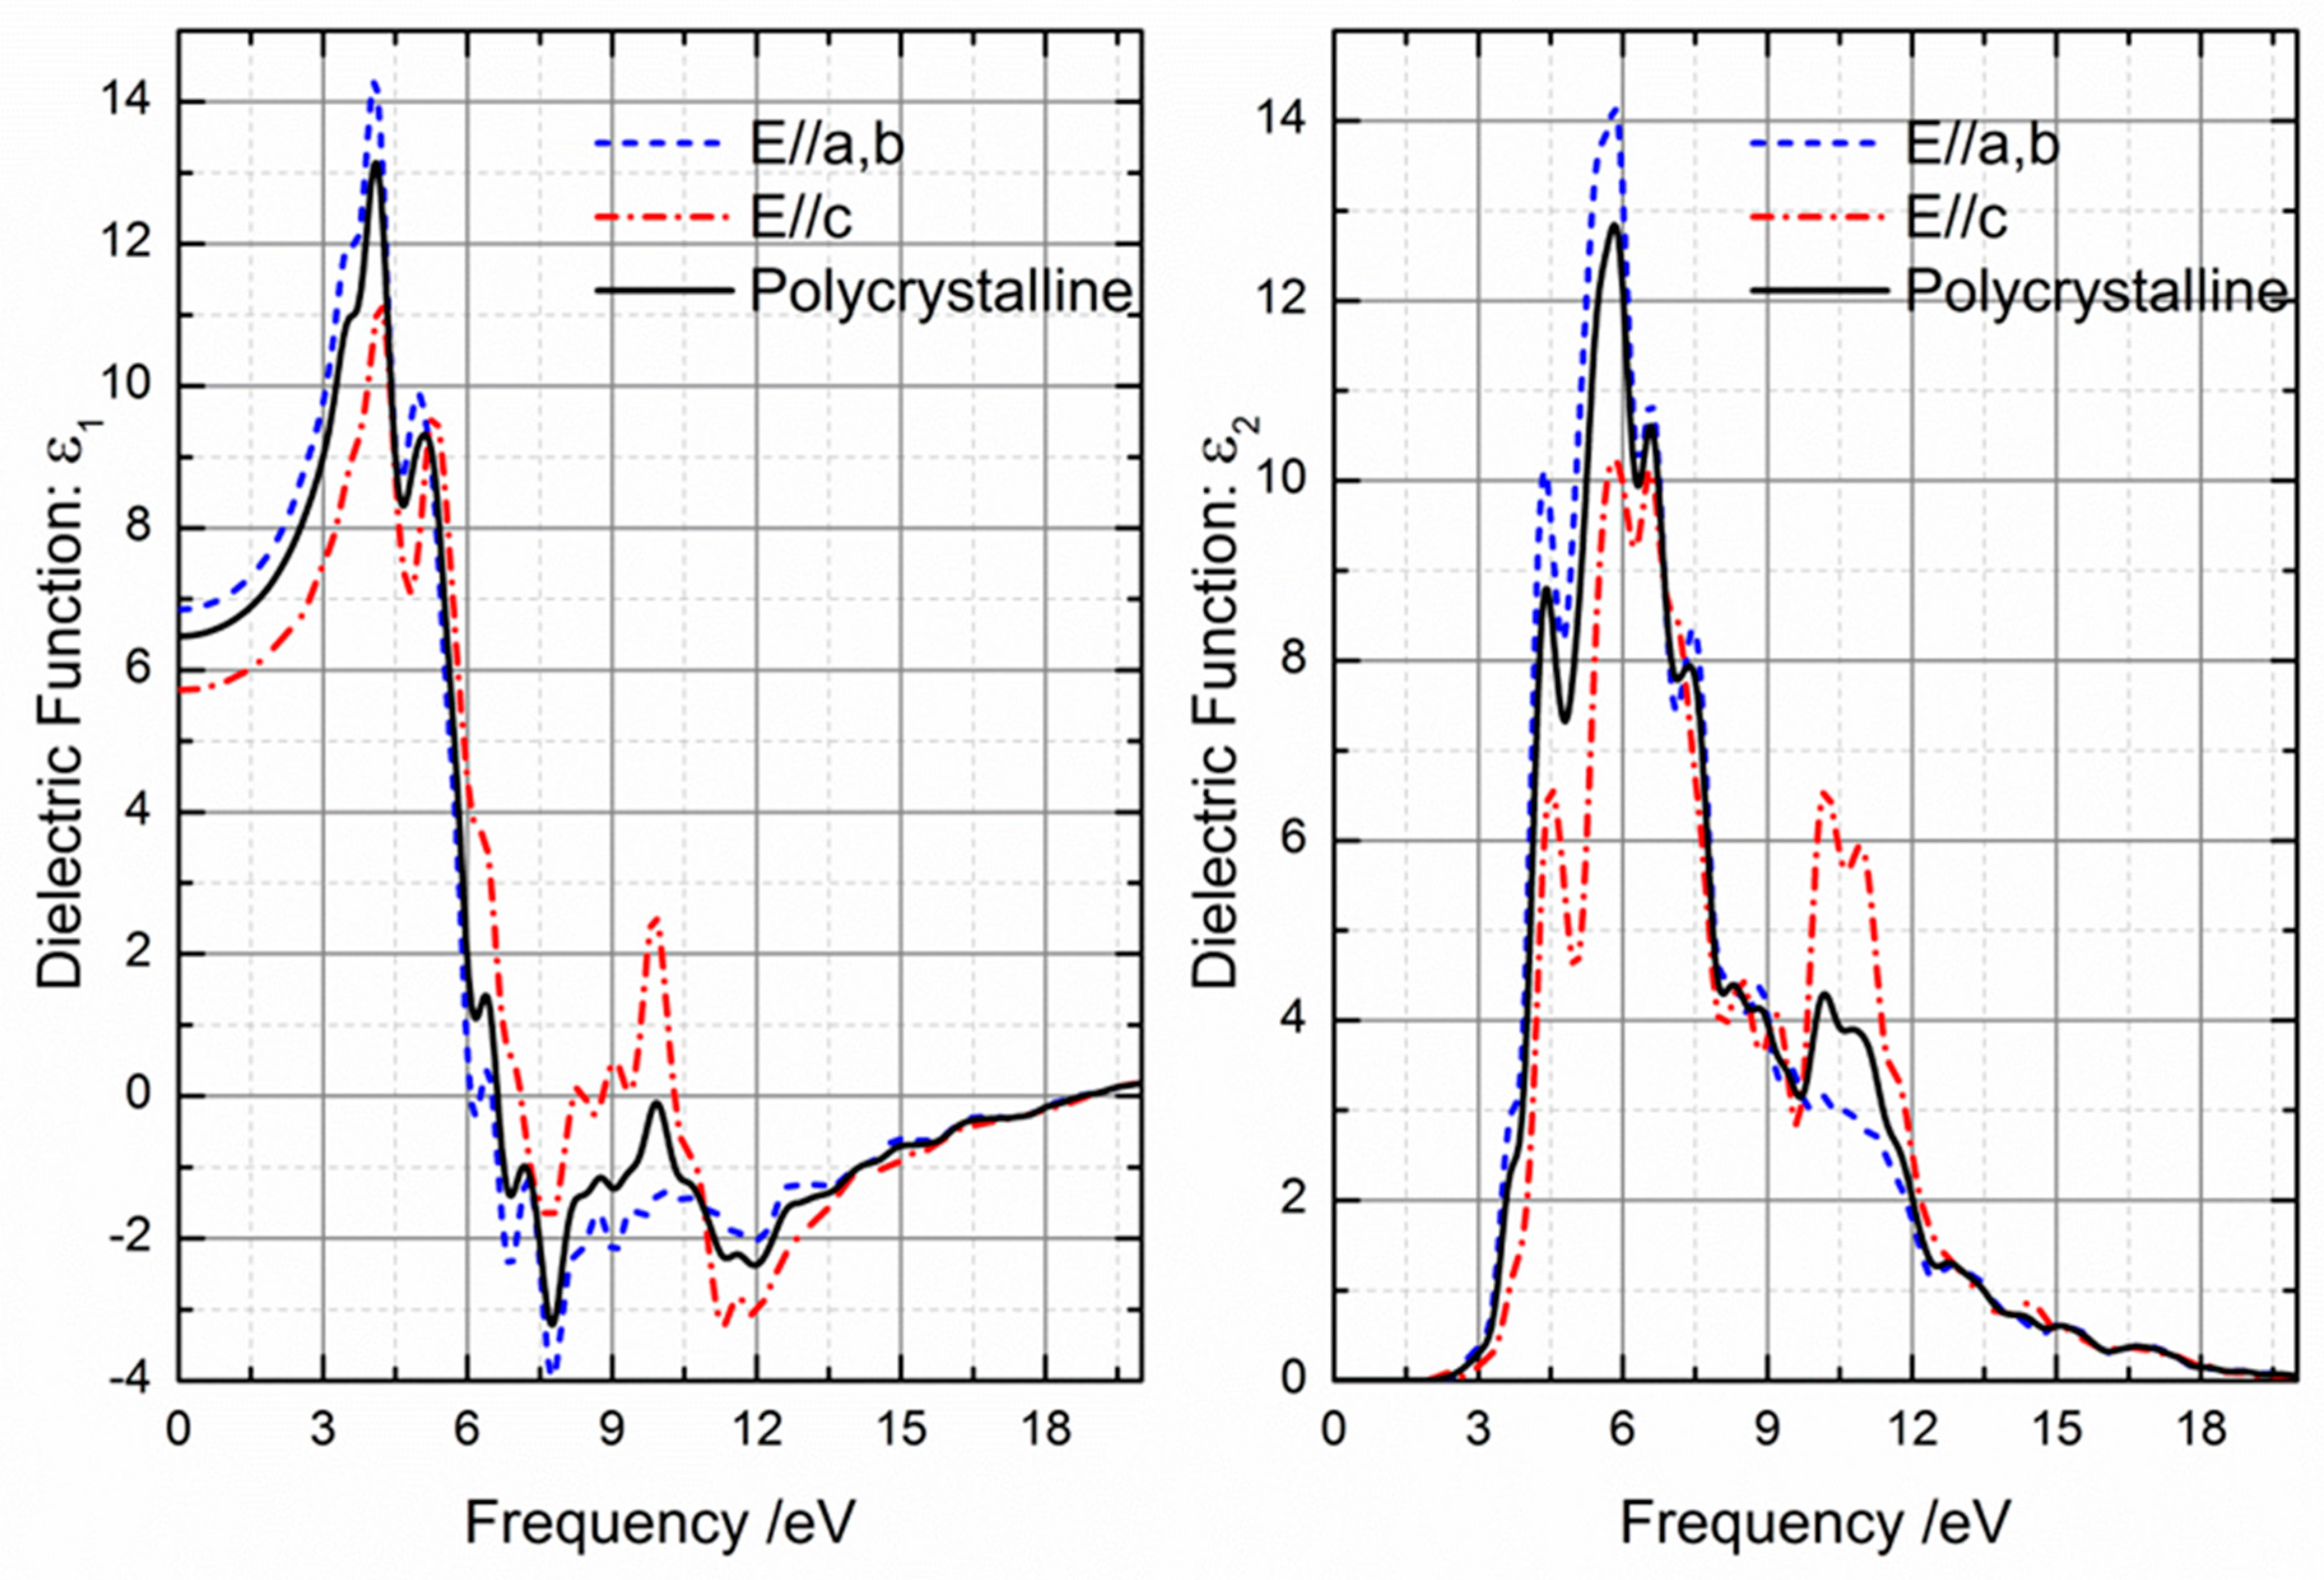
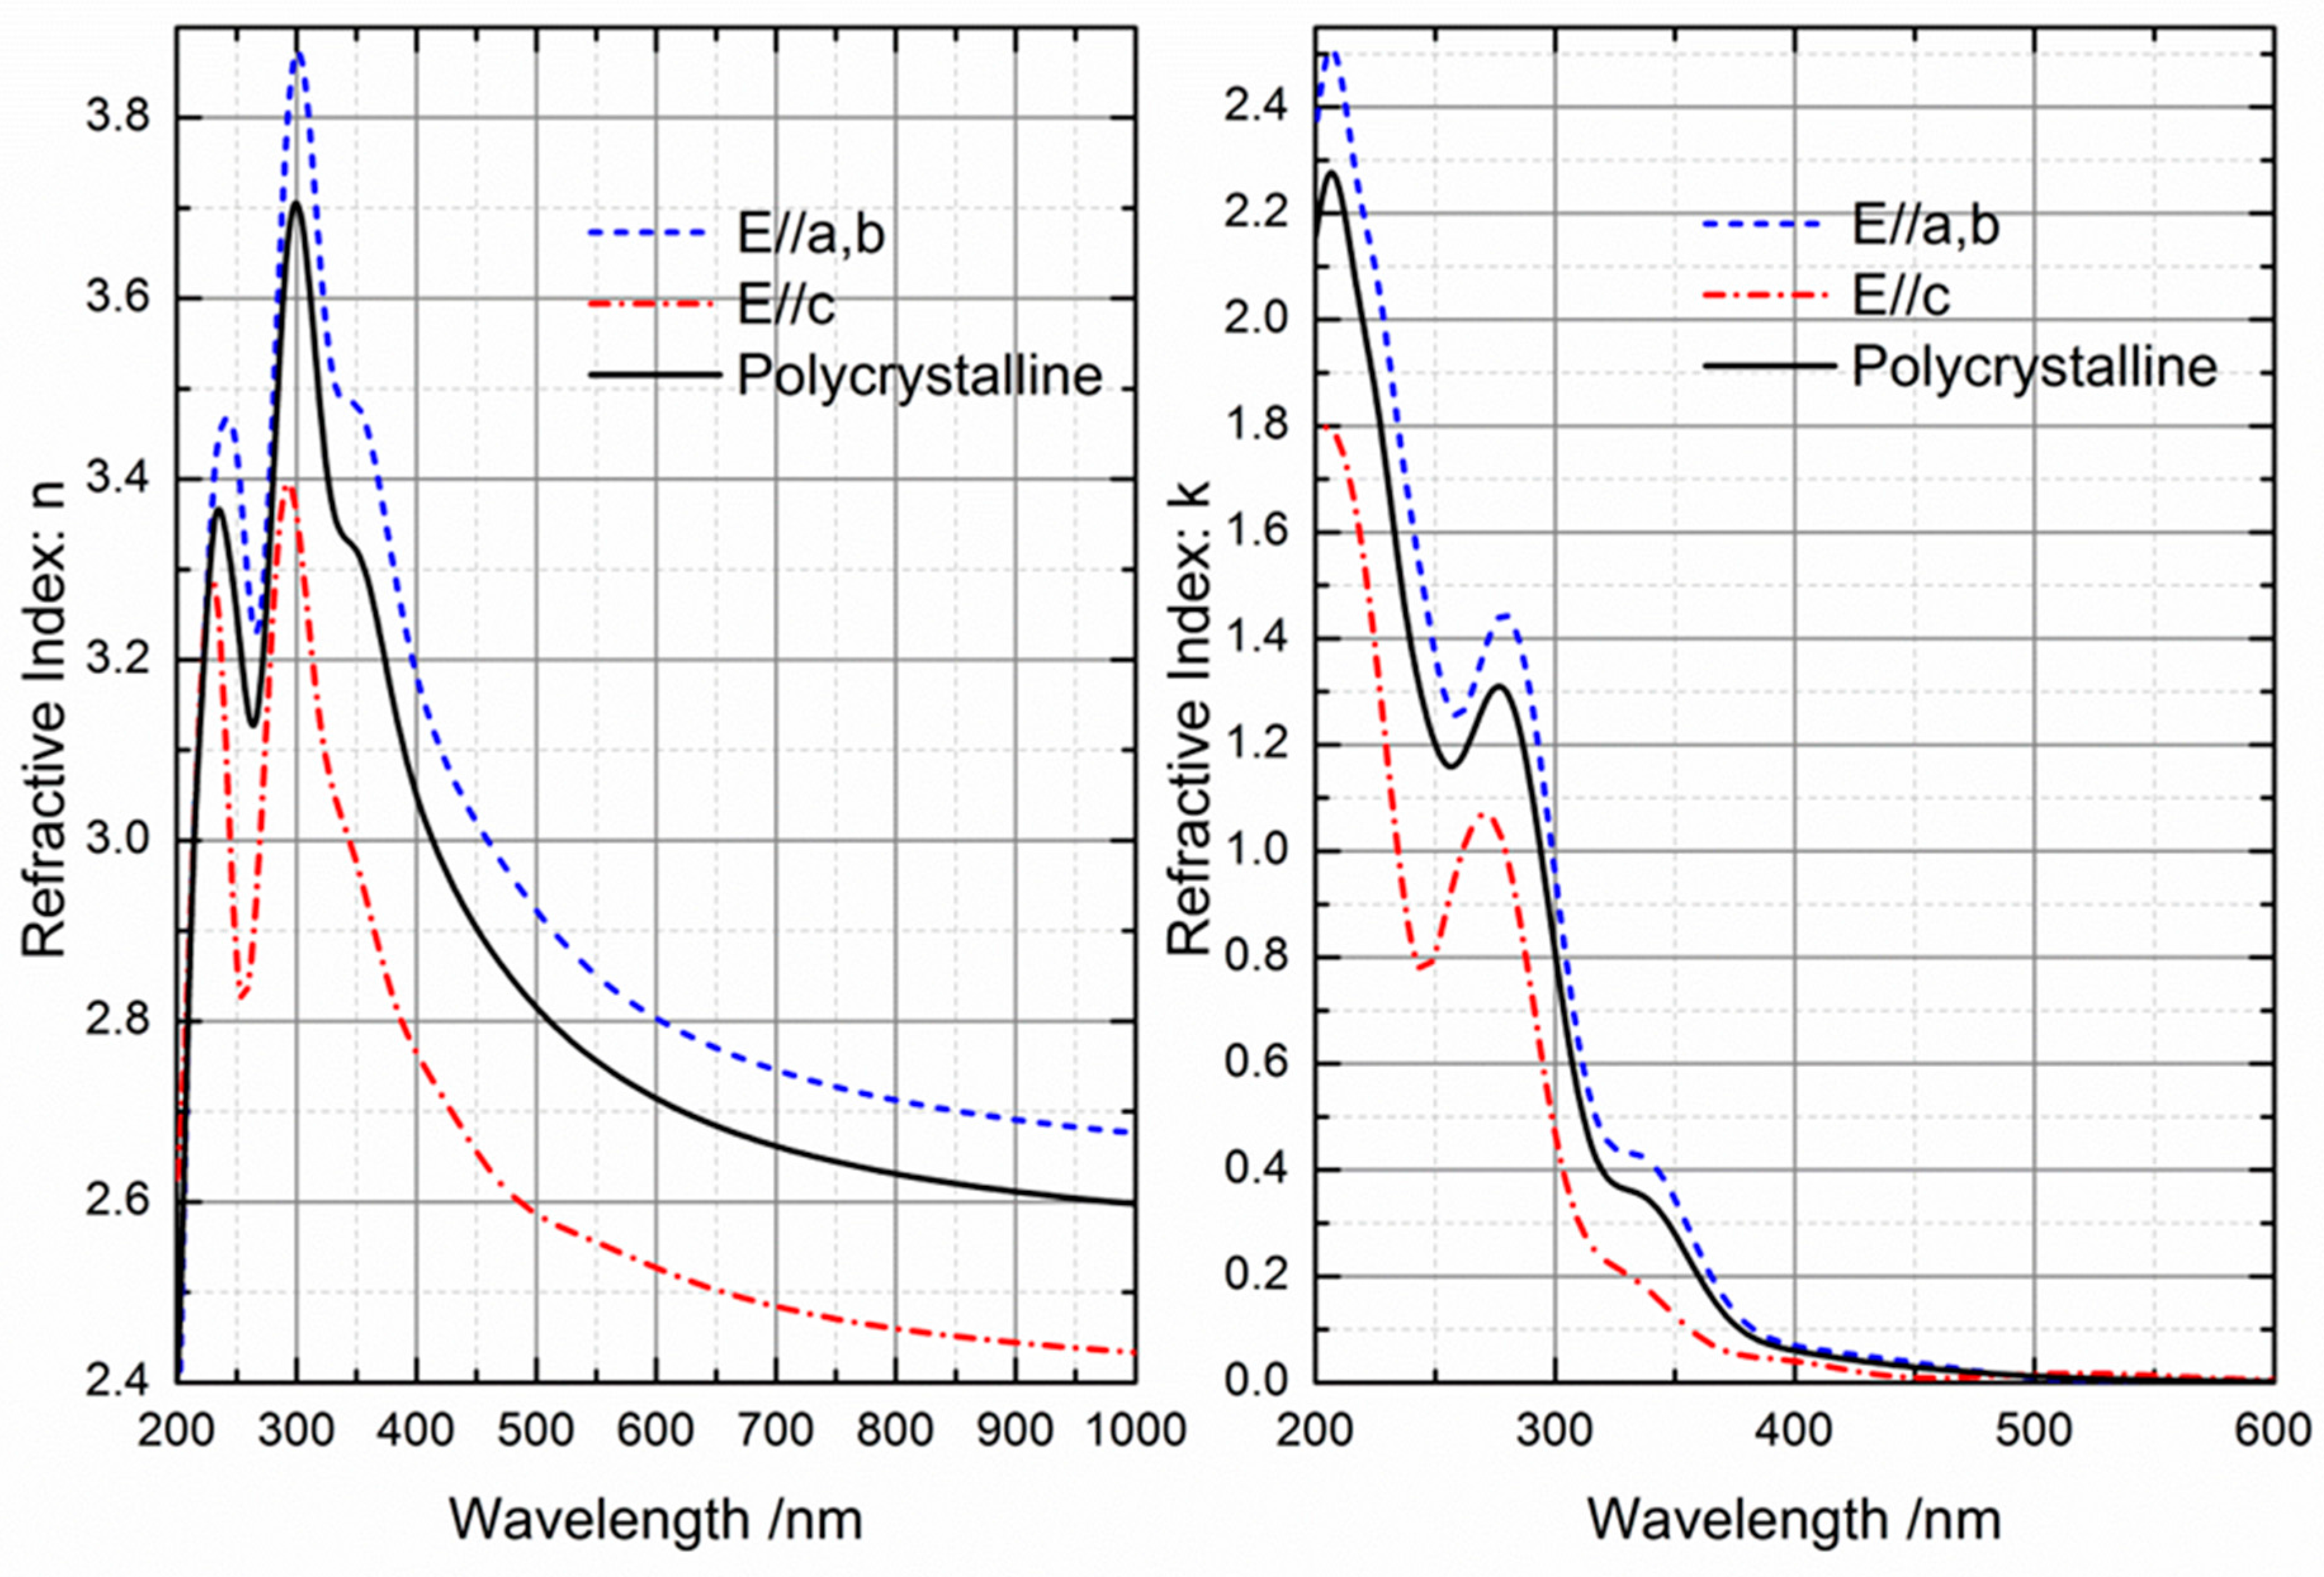
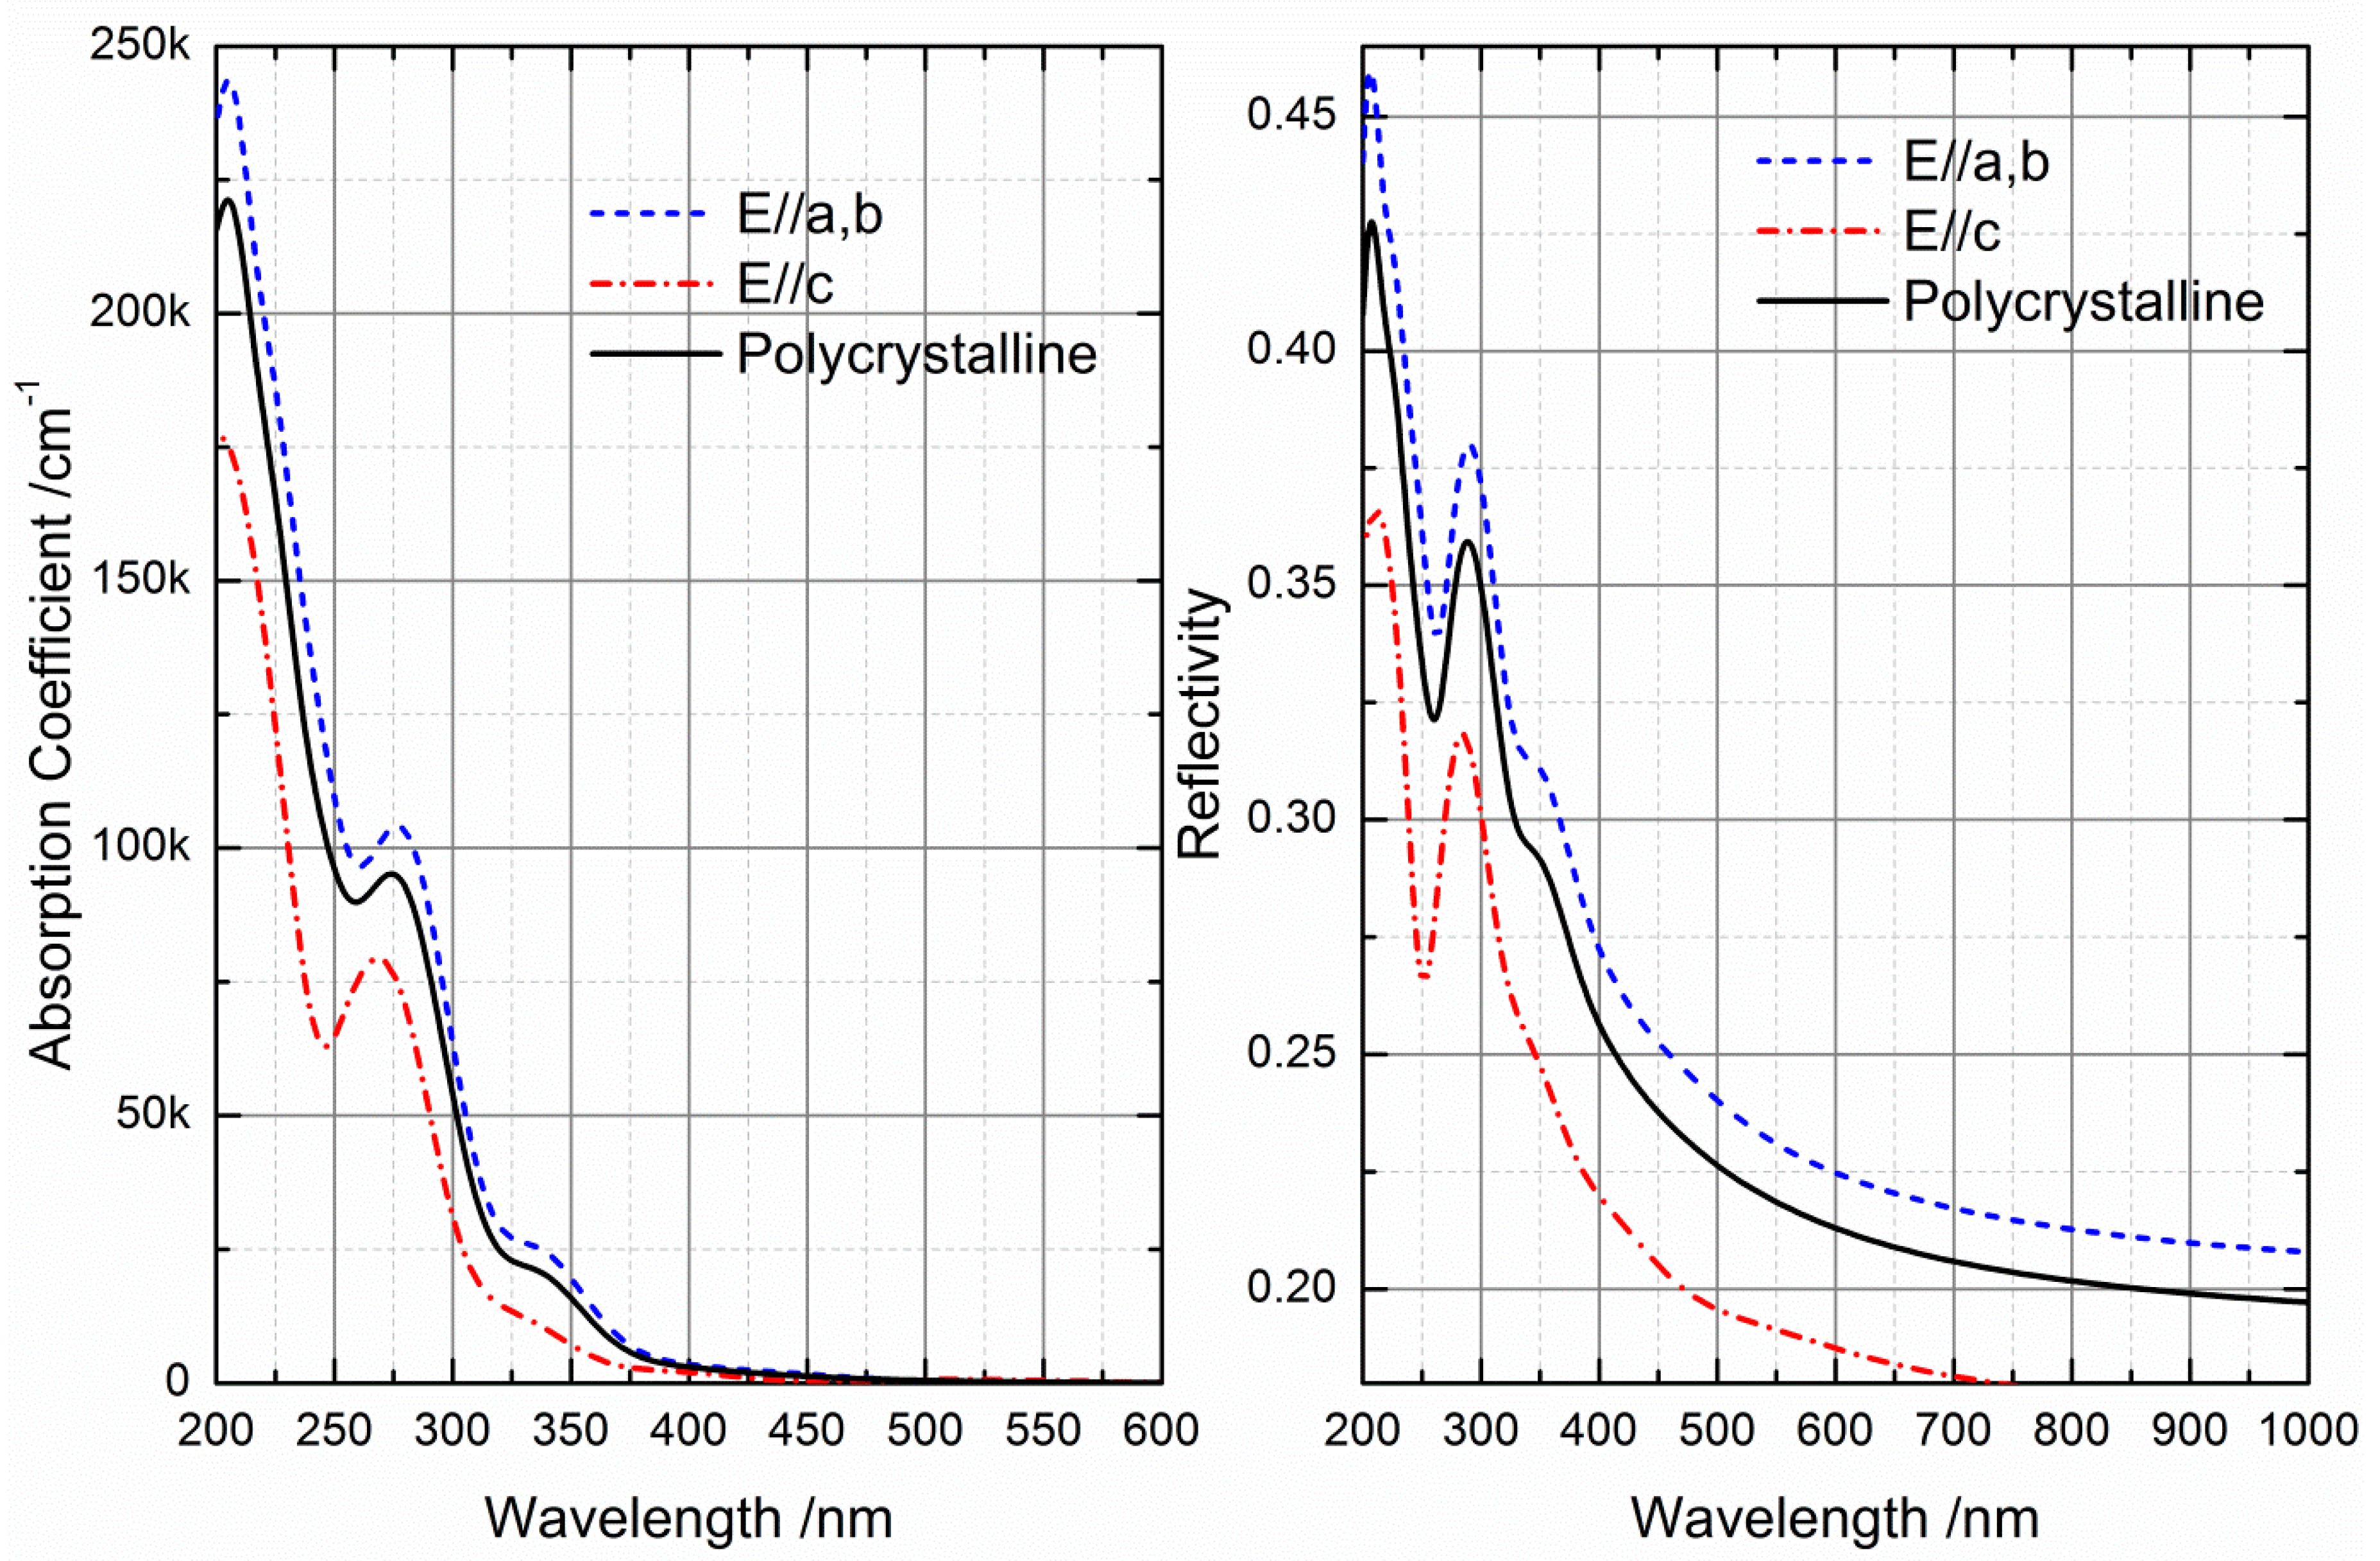
2.3. Optical Properties

As a photoelectric functional material, the optical properties of BiOI should be considered. Based on the band structure calculations, the real (ε1) and imaginary (ε2) parts of the dielectric function calculated by the HSE06 method are plotted in Figure 7. The corresponding results calculated by the GGA and GGA + U methods are provided in Figure S2 and Figure S3, respectively. Because the crystal structure of BiOI has the tetragonal matlockite PbFCl-type structure, the calculated optical properties along the polarization directions of E//a and E//b are the same. However, the optical curves for E//a or E//b are clearly different from those for E//c owing to the anisotropic properties of this type of crystal structure. To conveniently compare with experimental observations, the optical properties were also calculated for the polycrystalline model, as shown in Figure 7, Figure 8 and Figure 9. The peak intensities along the two polarization directions are clearly different, which shows that BiOI has anisotropic characteristics in the range 0 to 20 eV. The calculated static dielectric constants are ε1a(0) = 6.85, ε1c(0) = 5.72, and ε1p(0) = 6.47 at a frequency approaching zero. In the low energy range, the real part of the calculated dielectric function increases along the two polarization directions and for the polycrystalline model with increasing photon frequency. Along the E//a or E//b polarization direction, the first peak (ε1a = 14.18) appears at E = 4.08 eV, arising from the electron transition from I-5p/O-2p occupied states (i.e., the top of the VB) to Bi-6p unoccupied states (i.e., the bottom of the CB). The next peak (ε1a = 9.88) at E = 5.00 eV is also ascribed to the electron transition from I-5p/O-2p occupied states to Bi-6p unoccupied states. Along the E//c polarization direction, there are two peaks (ε1c = 10.99 and ε1c = 9.47) at E = 4.35 and 5.15 eV. The mechanism of the electronic transition mechanism is the same as the former. The features of the real part for the polycrystalline model are similar to that along the E//a or E//b polarization direction. The fundamental absorption edge of the imaginary part is ~1.9 eV. The imaginary part (ε2) of the calculated dielectric function sharply increases along the two polarization directions and for the polycrystalline model with increasing frequency, with the first peaks at ε2a = 10.05, ε2c = 6.44, and ε2p = 8.76 appearing at E = 4.34, 4.59, and 4.56 eV, respectively. As the photon frequency increases, the value of ε2 gradually tends to zero for all three curves.
Figure 8 shows the calculated refractive index curves of BiOI. The static refractive indexes are n0 = 2.62, 2.39, and 2.55 for E//a or E//b, E//c, and polycrystalline, respectively. The imaginary part (k) of the refractive index curves is the extinction coefficient, which represents the absorption coefficient, as shown in Figure 9. The absorption intensity along the E//c polarization direction is slightly higher than that along the E//a or E//b polarization direction in the wavelength range 200 to 600 nm, while the absorption intensity for the polycrystalline model falls in between. All of the absorption curves have two shoulder absorption peaks located at ~280 and ~370 nm. The response range of BiOI to visible light is wide, so it has excellent light absorption characteristics. The reflectivities of BiOI along the two polarization directions and for the polycrystalline model are also provided in Figure 9. The sharp decrease point of reflection is at about 300 nm. In the visible-light region, the reflectivity of BiOI is less than 25%, especially along the E//c polarization direction. Based on the above descriptions, the main contribution to visible-light absorption of BiOI is from photon absorption along the direction of the a/b axis. Therefore, if the morphology of the BiOI photocatalyst is controlled to have more exposed {100} crystal facets, it can efficiently absorb visible light in the solar spectrum. In other words, the photocatalytic performance of BiOI under visible-light irradiation could be greatly improved by intentional crystal orientation control synthesis.

3. Computational Methods

The DFT calculations were performed using the Cambridge Serial Total Energy Package (CASTEP) code, which is included in Materials Studio software (8.0, Accelrys Softwave Inc., San Diago, CA, USA, 2014) [46]. Owing to its advantages in both efficiency and credibility, the ultrasoft pseudopotential was chosen to describe the interaction between ionic cores and valence electrons in the GGA and GGA + U methods, while the norm-conserving pseudopotential was used in the HSE06 calculations. The Kohn-Sham wave functions of the valence electrons were expanded using a plane wave basis set within a specified energy cutoff of 380 eV for the GGA and GGA + U methods, while an 830 eV energy cutoff was used for the HSE06 method. The valence electrons that were considered in the calculations were Bi-5d106s26p3, O-2s22p4, and I-5s25p5 for the GGA and GGA + U, while only Bi 5d10 was considered for the HSE06 method. A 5 × 5 × 7 irreducible Brillouin zone was set for k-point grid sampling in the Monkhorst-Pack scheme, and the fast Fourier transformation was set as a 50 × 50 × 40 mesh. The minimization algorithm chosen was the Broyden-Fletcher-Goldfarb-Shanno scheme [47]. To accurately describe the nonbonding van der Waals interactions along the c axis in BiOI, DFT with van der Waals dispersion corrections (DFT-D) was used [48]. The value of Ueff = UJ was set to 4.8 eV for the p orbitals of Bi and O, and 2.1 eV for the p orbital of I. These values were obtained by comparing the calculated and measured band gap of pure BiOI.
The lattice parameters and atomic coordinates were fully optimized by simultaneously minimizing the total energy and atomic forces, which is an iterative process. In other words, the internal coordinates of the atoms and cell parameters were repeatedly adjusted to obtain the minimum total energy. When the convergence criteria (forces on the atoms less than 0.01 eV/Å, stresses on the atoms less than 0.02 GPa, atomic displacements less than 5 × 10⁻⁴ Å, and energy change per atom less than 5 × 10⁻⁶ eV) were satisfied, the equilibrium structure was finally obtained. Based on the optimized BiOI crystal structure, the electronic structure and optical properties were calculated. For the band structure, the energy eigenvalues were calculated according to the following high symmetry k-point path in the first Brillouin zone: Z (0, 0, 1/2) → A (1/2, 1/2, 1/2) → M (1/2, 1/2, 0) → Γ (0, 0, 0) → Z (0, 0, 1/2) → R (0, 1/2, 1/2) → X (0, 1/2, 0) → Γ (0, 0, 0).

4. Conclusions

The crystal structure of BiOI was optimized by different DFT methods, including GGA, GGA + U, and HSE06 functionals. Compared with the experimental structure, the most important structural features of BiOI are well reproduced by the three methods, except for the HSE06 method that does not apply a van der Waals correction. For the electronic structure, there are different chemical bonding features between different atoms in the different energy regions. Bi atoms have strong orbital hybridization with O atoms, and form covalent bonds. Bi atoms have relatively weak orbital hybridization with I atoms in the lower energy regions, and form ionic bonds. Bi atoms have relatively strong orbital hybridization with I atoms in the higher energy regions, and form covalent bonds. The parameters of the electronic structure of BiOI were calculated and compared for the three different DFT methods. The calculated results are consistent with each other, and can also explain some phenomena found in experiments. The optical properties, such as the dielectric function, refractive index, absorption coefficient, and reflectivity, were also calculated, and they are discussed. The results of the optical properties show that BiOI has anisotropic characteristics, and visible-light absorption by BiOI is mainly because of photon absorption along the direction of the a/b axis. Therefore, the photocatalytic performance of BiOI under visible-light irradiation could be greatly improved by intentional crystal orientation control synthesis. Considering the accuracy of the calculated results, utilization of computational resources, and computational time consumption, the GGA + U method is suitable for BiOI, especially for large models.

Supplementary Materials

The following are available online at www.mdpi.com/2073-4344/6/9/133/s1, Figure S1: The comparison of total and partial density of states of BiOI by different density functional theory (DFT) methods. Figure S2: The imaginary part and the real part of the dielectric functions of BiOI along two polarization direction and polycrystalline model by generalized-gradient approximation (GGA) method. Figure S3: The imaginary part and the real part of the dielectric functions of BiOI along two polarization direction and polycrystalline model by on-site Coulomb interactions (GGA + U) method.

Acknowledgments

The authors would like to acknowledge financial support from the National Natural Science Foundation of China (Grant No. 21473082) and the 18th Yunnan Province Young Academic and Technical Leaders Reserve Talent Project (Grant No. 2015HB015).

Author Contributions

W.-W.D. carried out the DFT calculations, analyzed the calculated results, and prepared the manuscript; Z.-Y.Z. designed and planed the research work, guided W.-W.D. to complete the present work, and revised the manuscript.

Conflicts of Interest

The authors declare no conflict of interest.

References

  1. Fujishima, A.; Honda, K. Electrochemical photolysis of water at a semiconductor electrode. Nature 1972, 238, 37–38. [Google Scholar] [CrossRef] [PubMed]
  2. Hoffmann, M.R.; Martin, S.T.; Choi, W.; Bahnemann, D.W. Environmental applications of semiconductor photocatalysis. Chem. Rev. 1995, 95, 69–96. [Google Scholar] [CrossRef]
  3. Mills, A.; Le Hunte, S. An overview of semiconductor photocatalysis. J. Photochem. Photobiol. A 1997, 108, 1–35. [Google Scholar] [CrossRef]
  4. Choi, W.; Termin, A.; Hoffmann, M.R. The role of metal ion dopants in quantum-sized TiO2: Correlation between photoreactivity and charge carrier recombination dynamics. J. Phys. Chem. 1994, 98, 13669–13679. [Google Scholar] [CrossRef]
  5. Yu, J.-G.; Jimmy, C.Y.; Cheng, B.; Hark, S.K.; Iu, K. The effect of F-doping and temperature on the structural and textural evolution of mesoporous TiO2 powders. J. Solid State Chem. 2003, 174, 372–380. [Google Scholar] [CrossRef]
  6. Maeda, K.; Takata, T.; Hara, M.; Saito, N.; Inoue, Y.; Kobayashi, H.; Domen, K. GaN:ZnO solid solution as a photocatalyst for visible-light-driven overall water splitting. J. Am. Chem. Soc. 2005, 127, 8286–8287. [Google Scholar] [CrossRef] [PubMed]
  7. Li, Q.; Xie, R.; Shang, J.K.; Mintz, E.A. Effect of precursor ratio on synthesis and optical absorption of TiON photocatalytic nanoparticles. J. Am. Cera. Soc. 2007, 90, 1045–1050. [Google Scholar] [CrossRef]
  8. Lin, H.-P.; Chen, C.-C.; Lee, W.W.; Lai, Y.-Y.; Chen, J.-Y.; Chen, Y.-Q.; Fu, J.-Y. Synthesis of a SrFeO3−x/g-C3N4 heterojunction with improved visible-light photocatalytic activities in chloramphenicol and crystal violet degradation. RSC Adv. 2016, 6, 2323–2336. [Google Scholar] [CrossRef]
  9. Yang, C.-T.; Lee, W.W.; Lin, H.-P.; Dai, Y.-M.; Chi, H.-T.; Chen, C.-C. A novel heterojunction photocatalyst, Bi2SiO5/g-C3N4: Synthesis, characterization, photocatalytic activity, and mechanism. RSC Adv. 2016, 6, 40664–40675. [Google Scholar] [CrossRef]
  10. Feng, Y.; Li, L.; Li, J.; Wang, J.; Liu, L. Synthesis of mesoporous BiOBr 3D microspheres and their photodecomposition for toluene. J. hazard. Mater. 2011, 192, 538–544. [Google Scholar] [CrossRef] [PubMed]
  11. Huo, Y.; Zhang, J.; Miao, M.; Jin, Y. Solvothermal synthesis of flower-like BiOBr microspheres with highly visible-light photocatalytic performances. App. Catal. B 2012, 111, 334–341. [Google Scholar] [CrossRef]
  12. Zhang, K.-L.; Liu, C.-M.; Huang, F.-Q.; Zheng, C.; Wang, W.-D. Study of the electronic structure and photocatalytic activity of the BiOCl photocatalyst. App. Catal. B 2006, 68, 125–129. [Google Scholar] [CrossRef]
  13. Shenawi-Khalil, S.; Uvarov, V.; Kritsman, Y.; Menes, E.; Popov, I.; Sasson, Y. A new family of BiO(ClxBr1−x) visible light sensitive photocatalysts. Catal. Commun. 2011, 12, 1136–1141. [Google Scholar] [CrossRef]
  14. Zhang, X.; Ai, Z.; Jia, F.; Zhang, L. Generalized one-pot synthesis, characterization, and photocatalytic activity of hierarchical BiOX (X = Cl, Br, I) nanoplate microspheres. J. Phys. Chem. C 2008, 112, 747–753. [Google Scholar] [CrossRef]
  15. Xiao, X.; Hao, R.; Liang, M.; Zuo, X.-X.; Nan, J.-M.; Li, L.-S.; Zhang, W.-D. One-pot solvothermal synthesis of three-dimensional (3D) BiOI/BiOCl composites with enhanced visible-light photocatalytic activities for the degradation of bisphenol-A. J. Hazard. Mater. 2012, 122–130, 233–234. [Google Scholar] [CrossRef] [PubMed]
  16. Jiang, Y.-R.; Chou, S.-Y.; Chang, J.-L.; Huang, S.-T.; Lin, H.-P.; Chen, C.-C. Hydrothermal synthesis of bismuth oxybromide-bismuth oxyiodide composites with high visible light photocatalytic performance for the degradation of CV and phenol. RSC Adv. 2015, 5, 30851–30860. [Google Scholar] [CrossRef]
  17. Chou, S.-Y.; Chen, C.-C.; Dai, Y.-M.; Lin, J.-H.; Lee, W.W. Novel synthesis of bismuth oxyiodide/graphitic carbon nitride nanocomposites with enhanced visible-light photocatalytic activity. RSC Adv. 2016, 6, 33478–33491. [Google Scholar] [CrossRef]
  18. Lin, H.-P.; Lee, W.W.; Huang, S.-T.; Chen, L.-W.; Yeh, T.-W.; Fu, J.-Y.; Chen, C.-C. Controlled hydrothermal synthesis of PbBiO2Br/BiOBr heterojunction with enhanced visible-driven-light photocatalytic activities. J. Mol. Catal. A: Chem. 2016, 417, 168–183. [Google Scholar] [CrossRef]
  19. Huang, S.-T.; Jiang, Y.-R.; Chou, S.-Y.; Dai, Y.-M.; Chen, C.-C. Synthesis, characterization, photocatalytic activity of visible-light-responsive photocatalysts BiOxCly/BiOmBrn by controlled hydrothermal method. J. Mol. Catal. A: Chem. 2014, 391, 105–120. [Google Scholar] [CrossRef]
  20. Jiang, Y.-R.; Lin, H.-P.; Chung, W.-H.; Dai, Y.-M.; Lin, W.-Y.; Chen, C.-C. Controlled hydrothermal synthesis of BiOxCly/BiOmIn composites exhibiting visible-light photocatalytic degradation of crystal violet. J. Hazard. Mater. 2015, 283, 787–805. [Google Scholar] [CrossRef] [PubMed]
  21. Lee, W.W.; Lu, C.-S.; Chuang, C.-W.; Chen, Y.-J.; Fu, J.-Y.; Siao, C.-W.; Chen, C.-C. Synthesis of bismuth oxyiodides and their composites: Characterization, photocatalytic activity, and degradation mechanisms. RSC Adv. 2015, 5, 23450–23463. [Google Scholar] [CrossRef]
  22. Zhao, Z.-Y.; Dai, W.-W. Structural, Electronic, and Optical Properties of Eu-Doped BiOX (X = F, Cl, Br, I): A DFT+U Study. Inorg. Chem. 2014, 53, 13001–13011. [Google Scholar] [CrossRef] [PubMed]
  23. Zhang, X.; Zhang, L. Electronic and Band Structure Tuning of Ternary Semiconductor Photocatalysts by Self Doping: The Case of BiOI. J. Phys. Chem. C 2010, 114, 18198–18206. [Google Scholar] [CrossRef]
  24. Min, Y.; Zhou, M.; Wen, L.-Y.; Zhao, H.-P.; Lei, Y. A highly efficient visible-light driven photocatalyst: Two dimensional square-like bismuth oxyiodine nanosheets. Dalton Trans. 2014, 43, 9549–9556. [Google Scholar]
  25. Pan, M.; Zhang, H.; Gao, G.; Liu, L.; Chen, W. Facet-Dependent Catalytic Activity of Nanosheet-Assembled Bismuth Oxyiodide Microspheres in Degradation of Bisphenol A. Environ. Sci. Technol. 2015, 49, 6240–6248. [Google Scholar] [CrossRef] [PubMed]
  26. Liu, H.; Cao, W.; Su, Y.; Wang, Y.; Wang, X. Synthesis, characterization and photocatalytic performance of novel visible-light-induced Ag/BiOI. Appl. Catal. B 2012, 111–112, 71–279. [Google Scholar] [CrossRef]
  27. Reddy, K.H.; Martha, S.; Parida, K.M. Fabrication of Novel p-BiOI/n-ZnTiO3 Heterojunction for Degradation of Rhodamine 6G under Visible Light Irradiation. Inorg. Chem. 2013, 52, 6390–6401. [Google Scholar] [CrossRef] [PubMed]
  28. Zhang, X.; Zhang, L.; Xie, T.; Wang, D. Low-Temperature Synthesis and High Visible-Light-Induced Photocatalytic Activity of BiOI/TiO2 Heterostructures. J. Phys. Chem. C 2009, 113, 7371–7378. [Google Scholar] [CrossRef]
  29. Wang, W.; Huang, F.; Lin, X.; Yang, J. Visible-light-responsive photocatalysts xBiOBr–(1−x) BiOI. Catal. Commun. 2008, 9, 8–12. [Google Scholar] [CrossRef]
  30. Chen, L.; Huang, R.; Xiong, M.; Yuan, Q.; He, J.; Jia, J.; Yao, M.-Y.; Luo, S.-L.; Au, C.-T.; Yin, S.-F. Room-Temperature Synthesis of Flower-Like BiOX (X = Cl, Br, I) Hierarchical Structures and their Visible-Light Photocatalytic Activity. Inorg. Chem. 2013, 52, 11118–11125. [Google Scholar] [CrossRef] [PubMed]
  31. Keller, E.; Krämer, V. A Strong Deviation from Vegard's Rule: X-Ray Powder Investigations of the Three Quasi-Binary Phase Systems BiOX-BiOY (X, Y = Cl, Br, I). Z. Naturforsch. B 2005, 60, 1255–1263. [Google Scholar]
  32. Sato, J.; Kobayashi, H.; Inoue, Y. Photocatalytic activity for water decomposition of indates with octahedrally coordinated d10 configuration. II. Roles of geometric and electronic structures. J. Phys. Chem. B 2003, 107, 7970–7975. [Google Scholar] [CrossRef]
  33. Huang, W.L. Electronic structures and optical properties of BiOX (X = F, Cl, Br, I) via DFT calculations. J. Comput. Chem. 2009, 30, 1882–1891. [Google Scholar] [CrossRef] [PubMed]
  34. Zhang, H.; Liu, L.; Zhou, Z. Towards better photocatalysts: First-principles studies of the alloying effects on the photocatalytic activities of bismuth oxyhalides under visible light. Phys. Chem. Chem. Phys. 2012, 14, 1286–1292. [Google Scholar] [CrossRef] [PubMed]
  35. Henle, J.; Simon, P.; Frenzel, A.; Scholz, S.; Kaskel, S. Nanosized BiOX (X= Cl, Br, I) particles synthesized in reverse microemulsions. Chem. Mater. 2007, 19, 366–373. [Google Scholar] [CrossRef]
  36. Wang, W.; Huang, F.; Lin, X. xBiOI–(1 − x) BiOCl as efficient visible-light-driven photocatalysts. Scr. Mater. 2007, 56, 669–672. [Google Scholar] [CrossRef]
  37. Perdew, J.P.; Levy, M. Physical content of the exact Kohn-Sham orbital energies: Band gaps and derivative discontinuities. Phys. Rev. Lett. 1983, 51, 1884–1887. [Google Scholar] [CrossRef]
  38. Stampfl, C.; Van de Walle, C. Density-functional calculations for III-V nitrides using the local-density approximation and the generalized gradient approximation. Phys. Rev. B 1999, 59. [Google Scholar] [CrossRef]
  39. Huang, W.L.; Zhu, Q. DFT calculations on the electronic structures of BiOX (X = F, Cl, Br, I) photocatalysts with and without semicore Bi 5d states. J. Comput. Chem. 2009, 30, 183–190. [Google Scholar] [CrossRef] [PubMed]
  40. Tang, H.; Prasad, K.; Sanjines, R.; Schmid, P.E.; Levy, F. Electrical and optical properties of TiO2 anatase thin films. J. Appl. Phys. 1994, 75, 2042–2047. [Google Scholar] [CrossRef]
  41. Pascual, J.; Camassel, J.; Mathieu, H. Resolved Quadrupolar Transition in TiO2. Phys. Rev. Lett. 1977, 39, 1490–1493. [Google Scholar] [CrossRef]
  42. Frederikse, H.P.R. Recent Studies on Rutile (TiO2). J. Appl. Phys. 1961, 32, 2211–2215. [Google Scholar] [CrossRef]
  43. Walsh, A.; Da Silva, J.L.F.; Wei, S.-H. Origins of band-gap renormalization in degenerately doped semiconductors. Phys. Rev. B 2008, 78, 075211. [Google Scholar] [CrossRef]
  44. Wang, Y.; Deng, K.; Zhang, L. Visible Light Photocatalysis of BiOI and its Photocatalytic Activity Enhancement by in Situ Ionic Liquid Modification. J. Phys. Chem. C 2011, 115, 14300–14308. [Google Scholar] [CrossRef]
  45. Jiang, J.; Zhang, X.; Sun, P.; Zhang, L. ZnO/BiOI Heterostructures: Photoinduced Charge-Transfer Property and Enhanced Visible-Light Photocatalytic Activity. J. Phys. Chem. C 2011, 115, 20555–20564. [Google Scholar] [CrossRef]
  46. Clark, S.J.; Segall, M.D.; Pickard, C.J.; Hasnip, P.J.; Probert, M.I.; Refson, K.; Payne, M.C. First principles methods using CASTEP. Z. Kristallog. 2005, 220, 567–570. [Google Scholar] [CrossRef] [Green Version]
  47. Pfrommer, B.G.; Côté, M.; Louie, S.G.; Cohen, M.L. Relaxation of crystals with the quasi-Newton method. J. Comput. Phys. 1997, 131, 233–240. [Google Scholar] [CrossRef]
  48. Tkatchenko, A.; Scheffler, M. Accurate Molecular Van Der Waals Interactions from Ground-State Electron Density and Free-Atom Reference Data. Phys. Rev. Lett. 2009, 102. [Google Scholar] [CrossRef] [PubMed]
Figure 1. Crystal structure model of BiOI.
Catalysts 06 00133 g001
Figure 2. Calculated band structure of BiOI obtained by the different DFT (density functional theory) methods. The red lines represent spin-up states and the blue lines represent spin-down states (for BiOI, the spin-up states and the spin-down states are almost completely coincident, the blue lines are overlapped by the red lines, so there are almost not seen in this figure).
Catalysts 06 00133 g002
Figure 3. Calculated total and partial DOS (density of states) of BiOI obtained by the HSE06 method. The energy regions E1–E15 are as labeled in Figure 2.
Catalysts 06 00133 g003
Figure 4. Projected wave function contour of BiOI through the (010) plane. The energy regions E1–E15 are as labeled in Figure 2.
Catalysts 06 00133 g004
Figure 5. Projected wave function contour of BiOI through the (001) plane. The energy regions E1–E15 are as labeled in Figure 2.
Catalysts 06 00133 g005
Figure 6. Proposed molecular-orbital bonding diagram for BiOI. The solid and dashed lines represent large and small contributions, respectively.
Catalysts 06 00133 g006
Figure 7. Imaginary and real parts of the dielectric functions of BiOI along two polarization directions and for the polycrystalline model calculated by the HSE06 method.
Catalysts 06 00133 g007
Figure 8. Imaginary and real parts of the refractive index of BiOI along two polarization directions and for the polycrystalline model obtained by the HSE06 method.
Catalysts 06 00133 g008
Figure 9. Absorption coefficient and reflectivity of BiOI along two polarization directions and for the polycrystalline model obtained by the HSE06 method.
Catalysts 06 00133 g009
Table 1. Optimized crystallographic parameters of BiOI obtained by different density functional theory (DFT) methods, as well as the experimental values. The atomic fractional coordinates of all of the atoms and bond lengths are also given.
MethodCrystallographic ParametersFractional Coordinates of AtomsBond Lengths (Å)
a and b (Å)c (Å)V3)OIBiBi–OBi–I a
GGA3.99009.4984151.2155(0, 0, 0)(0, 0.5, 0.6760)(0, 0.5, 0.1294)2.34313.3370, 5.1920
GGA + U3.91999.3099143.0519(0, 0, 0)(0, 0.5, 0.6761)(0, 0.5, 0.1291)2.29903.3130, 5.0930
HSE063.75567.8692110.9911(0, 0, 0)(0, 0.5, 0.6466)(0, 0.5, 0.1440)2.19313.1260, 3.9550
Exp.b3.885 (2)9.151 (5)138.12 (2)(0, 0, 0)(0, 0.5, 0.6671)(0, 0.5, 0.1338)2.34303.3615, 4.8795
a The first value is the bond length of Bi with the first I layer atoms (Bi–I1 in Figure 1), and the second value is the bond length of Bi with the second I layer atoms (Bi–I2 in Figure 1). b Ref. [31].
Table 2. Atomic Mulliken populations of BiOI obtained by the different DFT (density functional theory) methods (the unit is elementary charge (symbol: e)).
MethodOIBi
spTotalChargespTotalChargespTotalCharge
GGA1.914.986.90−0.901.965.377.33−0.331.971.803.781.22
GGA + U1.885.086.97−0.971.985.377.35−0.351.931.753.681.32
HSE061.895.137.02−1.021.815.397.20−0.202.111.6713.781.22
Table 3. Effective masses of photogenerated holes at the top of the VB (valence band) and photogenerated electrons at the bottom of the CB (conduction band) obtained by different DFT methods.
k-point (direction)mh* (m0)k-point (direction)me* (m0)
GGAGGA + UHSE06GGAGGA + UHSE06
Z (Z → A)0.7950.8090.658Z (Z → A)0.2040.1940.217
Z A ¯ (Z → A)0.4540.6750.464 Z A ¯ (A → Z)0.3180.3190.270
Γ M ¯ (Γ → M)0.2540.2350.187M (Γ → M)0.4600.3930.204
ZR (Z → R)1.1580.9770.663 M Γ ¯ (Γ → M)0.7680.6740.430
---- Z R ¯ (Z → R)0.4240.4210.277
----Γ (Γ → X)0.1850.1880.162

