Article

Flower-like Titanium Dioxide/Cellulose Acetate Nanofibers for Catalytic Decomposition of Organic Pollutants Including Particulate Matter Removal

1
Department of Environmental Engineering, National Ilan University, Yilan 26047, Taiwan
2
School of Graduate Studies, Mapúa University, Intramuros, Manila 1002, Philippines
3
School of Chemical, Biological, and Materials Engineering and Sciences, Mapúa University, Intramuros, Manila 1002, Philippines
*
Author to whom correspondence should be addressed.
Catalysts 2024, 14(4), 233; https://doi.org/10.3390/catal14040233
Submission received: 28 February 2024 / Revised: 21 March 2024 / Accepted: 26 March 2024 / Published: 31 March 2024

Abstract

:
Volatile organic compounds (VOCs) are common organic pollutants that can cause adverse effects on human health. Treatment techniques, including photocatalytic oxidation, have been studied to remediate VOCs. Acetone was used as a model pollutant to investigate the photocatalytic degradation performance of electrospun photocatalytic nanofibers with synthesized flower-like titanium dioxide (F-TiO2) and cellulose acetate (CA). The synthesized F-TiO2 and photocatalytic nanofibers were characterized using FE-SEM, XRD, FTIR, UVVis, XPS, and a pore size and porosity analyzer. The addition of F-TiO2 decreases the diameter of the nanofibers. The photocatalytic degradation performance test showed an enhanced acetone degradation efficiency on F-TiO2/CA photocatalytic nanofibers (FT-CFs), with an up to 95.0% acetone degradation efficiency under optimum conditions, over P25 TiO2/CA photocatalytic nanofibers (T-CFs). The filtration efficiency of 3.0%FT-CF reached 99.9% with a filter basis weight of 0.660 g m−2 and face velocity of 5.0 cm−1 s. The filtration and photocatalytic degradation cycle tests revealed excellent reusability, with 97% particle filtration and no sign of material deterioration. Moreover, the biodegradability tests showed that the material can biodegrade in water and in soil for 30 and 40 days, respectively. This study demonstrates that electrospun FT-CFs exhibit exceptional photocatalytic degradation of acetone, a high filtration efficiency, excellent reusability, and biodegradability, making them a promising solution for VOC remediation.

1. Introduction

Volatile organic compounds (VOCs) are considered one of the common air pollutants that are produced naturally and anthropogenically. Due to their high volatility and mobility, VOCs can be difficult to treat and degrade [1]. In addition, VOCs can cause adverse health effects to humans when they are exposed to them through inhalation, ingestion, or skin contact, including respiratory illnesses, cancer, diabetes, obesity, and cardiovascular diseases [2].
Several treatment techniques, including biodegradation, phytoremediation, electrostatic precipitation, adsorption, and photocatalytic oxidation, have been studied for their effectiveness in VOC remediation [3]. Due to its simplicity, sustainability, and high efficiency, photocatalytic degradation has been favored for VOC removal [4]. Photocatalytic degradation utilizes UV and visible light for VOC removal. The photocatalytic reaction produces radicals and positive holes in valence bands, which undergo a redox reaction with the VOC, causing VOC degradation [4]. Metal oxides, such as ZnO2 and TiO2, have been used as photocatalysts due to their non-toxicity and high photosensitivity [5].
TiO2 has a band gap of approximately 3.2 eV, which requires a light source of <390 nm [6]. The TiO2 anatase crystalline phase has shown the highest photocatalytic activity among other TiO2 nanostructures. The band gap, porosity, pore volume, and surface area of nanocrystalline structure play an important role in the photocatalytic activity of TiO2 [7]. Controlling the morphology of TiO2 nanoparticles can enhance their photocatalytic activity [8]. The flower-like TiO2 (F-TiO2) nanoparticles have shown an enhanced photocatalytic property over P25 TiO2. F-TiO2 nanoparticles are prepared via a hydrothermal process combined with a calcination process [8]. In addition, to prevent nanoparticle agglomerations, support structures can be used [9]. Due to its non-toxicity, biodegradability, sustainability, and low cost, cellulose acetate (CA) is a promising support structure for nanoparticles. CA has been used in preparation of polymeric membranes, electrospun nanofibers, and composite materials [10,11].
The present study aims to assess the performance of F-TiO2/CA photocatalytic nanofibers (FT-CFs) on VOC degradation and PM filtration. Herein, TiO2 was synthesized using a hydrothermal process combined with a calcination process to produce flower-like nanoparticles. F-TiO2/CA photocatalytic nanofibers were prepared via electrospinning. The synthesized F-TiO2 and electrospun F-TiO2/CA photocatalytic fibers were characterized using FE-SEM, XRD, FTIR, UVVis, XPS, and a pore size and porosity analyzer. The photocatalytic degradation performance of the FT-CFs was evaluated using an annular photocatalytic reactor equipped with UV lamps. Acetone was used as a model pollutant for the photocatalytic degradation tests for VOC removal [12]. In addition, the particulate matter (PM) filtration performance was evaluated. Moreover, the synergistic effect of the filtration and photocatalytic degradation performance was investigated. Furthermore, the reusability and biodegradability of the FT-CFs were investigated. To the best of our knowledge, the present study provides a novel electrospun F-TiO2/CA photocatalytic nanofiber material prepared via electrospinning with improved photocatalytic degradation properties and applications in VOC remediation and PM filtration.

2. Results and Discussion

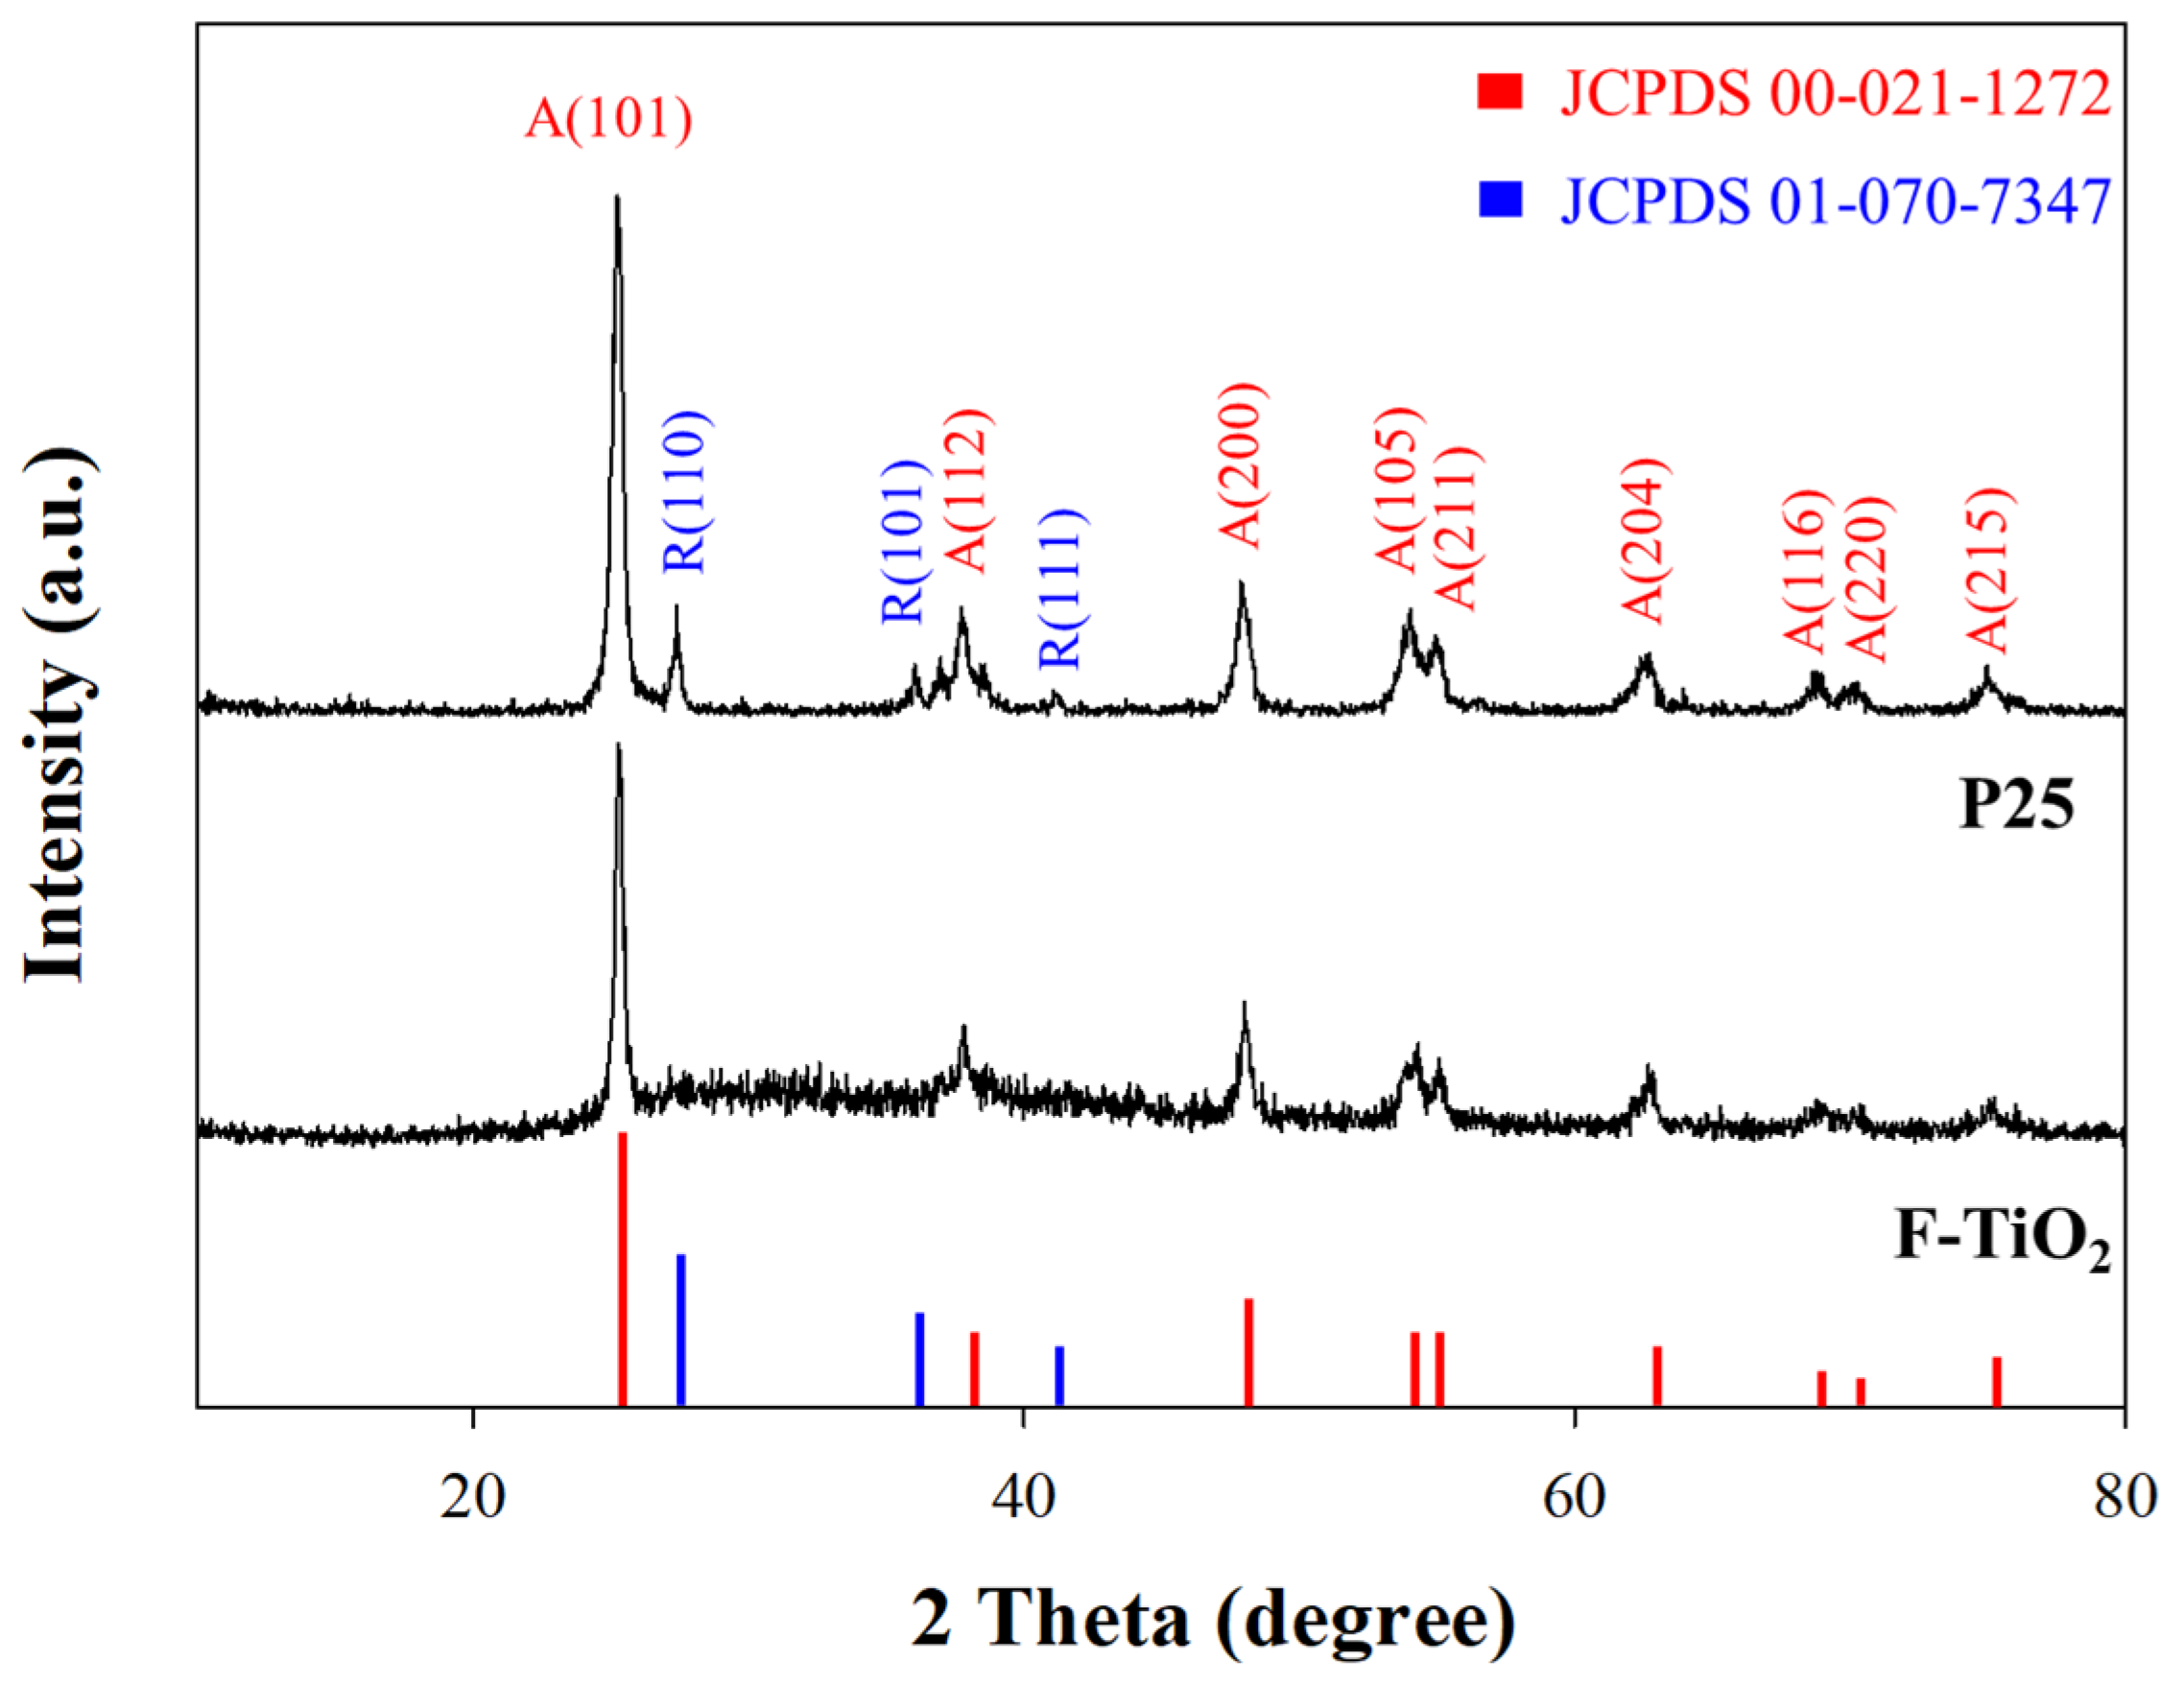
2.1. Characterizations

The surface morphology of F-TiO2 was investigated using a scanning electron microscope. Figure 1 shows the surface morphology of PT25 TiO2 and F-TiO2. P25 TiO2 has an inconsistent nanoparticle structure with visible agglomeration, while F-TiO2 has a more consistent and uniform particle structure. The synthesized F-TiO2 was formed from the hydrothermal reaction between titanium (IV) N-butoxide (TBOT) and glycerol, which produced flower-like titanium glycerolate (TiGly) precursor nanostructures. The flower-like structure of the TiGly was not affected by the calcination process, which produced TiO2 nanoparticles from the TiGly nanostructure precursors [8].
Similarly, the FE-SEM analysis of the photocatalytic fibers is shown in Figure 2a–c. The FE-SEM images reveal that the CA nanofibers (CF) have a smooth and flat surface, unlike the P25 TiO2/CA nanofibers (T-CFs) and FT-CFs, which have a rougher surface and visible protrusions. Ten nanofibers were used to measure the average diameter. The average diameter of CF, 0.5%FT-CF, 1.0%FT-CF, 2.0%FT-CF, 3.0%FT-CF, and 3.0%T-CF were measured as 182.2, 137.8, 107.6, 104.4, 96.1, and 97.9 nm, respectively. The addition of TiO2 decreased the diameter of the nanofibers, as shown in Figure 2d–f. The average diameters of the nanofibers decreased from 182.2 nm to 96.1 nm. Moreover, FT-CFs have smaller diameters than T-CFs. Along with the FE-SEM analysis, the EDS elemental analysis of the 3.0%FT-CF confirmed the presence of Ti on the surface of the nanofibers that are shown in Figure 2g. In addition, the EDS elemental analysis revealed the percentages of C, O, and Ti, which were 53.09, 43.69, and 3.22%, respectively.
The XRD analyses of the P25 TiO2 and F-TiO2 are shown in Figure 3. The XRD spectrum of F-TiO2 reveals that the F-TiO2 crystalline structure is purely anatase-phase TiO2, confirmed with the characteristic peaks from [13] JCPDS 00-021-1272 standard reference cards, with peaks at 25.3°, 37.8°, 48.0°, 53.9°, 54.9°, 62.7°, 68.7°, 69.7°, and 75.1°, corresponding to (101), (112), (200), (105), (211), (204), (116), (220), and (215) crystal planes of the anatase-phase TiO2. Similarly, the P25 TiO2 XRD spectrum shows characteristic peaks of anatase-phase TiO2. In addition, the XRD spectrum of P25 TiO2 contains the characteristics peaks of rutile-phase TiO2, as can be seen from the [14] JCPDS 01-070-7347 characteristics peaks at 27.4°, 36.0°, and 41.1°, which correspond to (110), (101), and (111) crystal planes of the rutile-phase TiO2. The XRD analysis reveals P25 TiO2 polycrystalline structures from anatase- and rutile-phase TiO2.
The energy band gaps of the P25 TiO2, F-TiO2, and prepared photocatalytic nanofibers were measured using UVVis analysis (Figure 4). The F-TiO2 shows a lower energy band gap of 2.95 eV, which is lower than that of the P25 TiO2. Generally, anatase-phase TiO2 has a lower energy band cap compared to other crystalline structures of TiO2. This confirms the results from the XRD analysis of the F-TiO2 and P25 TiO2 crystalline structures, which demonstrated a pure anatase phase and a mixture of an anatase and rutile phase, respectively. This means that F-TiO2 requires less energy to excite its proton, thereby enhancing its photocatalytic activity. The energy band gap and maximum absorption wavelength are summarized in Table 1. P25 TiO2 and F-TiO2 showed excellent absorption values below 300 nm. In contrast, the T-CFs and FT-CFs have higher energy band gaps and lower absorption values below 300 nm. The stabilization of the P25 TiO2 and F-TiO2 in CA decreases the absorption values and increases the energy band gap. The FT-CFs showed better optical characteristics over the T-CFs, which can be attributed to the larger surface area of F-TiO2 and the lesser tendency of F-TiO2 to aggregate.
The XPS analysis of the synthesized F-TiO2 revealed that the binding energy peaks of C 1s, Ti 2p, and C 1s appear at 530.0, 459.0, and 284.0 eV, respectively (Figure 5a). Similarly, the binding energy peaks at 458.1 and 463.8 eV represent Ti4+2p3/2 and Ti4+2p1/2 (Figure 5b), respectively, which are consistent with the values reported by previous studies [15,16]. In addition, the binding energy peaks of lattice oxygen (Olatt) and adsorbed oxygen (Oabs) are at 529.3 and 530.1 eV (Figure 5c), which is similar to the results obtained by the synthesis of TiO2 using a hydrothermal process [17].
The characteristic peaks of TiO2 and its functional groups in CA, CF, T-CFs, and FT-CFs were identified using FTIR analysis (Figure 6). P25 TiO2 and F-TiO2 showed a characteristic peak around 650 cm−1, which corresponds to the stretching vibration of the Ti-O-Ti bond [6,18]. This characteristic peak is visible in the T-CF and FT-CF FTIR spectra. The peak at 1,050 cm−1 corresponds to C-O-C stretching vibrations in dehydrated glucose units. C-O stretching, C-H bending vibrations, and C=O stretching from acetyl groups can be seen in the peaks at 1240 cm−1, 1370 cm−1, and 1750 cm−1, respectively. Additionally, the peak in the range of 2900–2950 cm−1 corresponds to the C-H stretching vibrations of CH2 or CH3. These peaks are characteristic peaks of CA [19,20]. The peak at 3450 cm−1 corresponds to O-H stretching vibrations, which are attributed to the adsorbed water on the material.
The nitrogen adsorption/desorption isotherms of P25 TiO2 and F-TiO2 were analyzed (Figure 7). P25 TiO2 exhibits Type II isotherms in the nitrogen adsorption/desorption curves, which means that P25 TiO2 has a microporous structure [19]. On the other hand, F-TiO2 follows a Type IV isotherm with a hysteresis loop in the middle section, which indicates the mesoporous structure of F-TiO2, with capillary condensation in the pores [21].
The specific surface areas and pore characteristics of the P25 TiO2 and F-TiO2 were analyzed using the Brunauer–Emmett–Teller (BET) method and the Barrett–Joyner–Halenda (BJH) method, respectively. The specific surface area and pore characteristics of the TiO2 nanoparticles are summarized in Table 2. F-TiO2 exhibits a higher specific surface area than P25 TiO2. The high specific surface area of F-TiO2 can be attributed to its nanopetal structures and uniform distribution without visible agglomerations, which can be seen from the FE-SEM images of the F-TiO2 nanoparticles. In contrast, P25 TiO2 has a tendency to agglomerate and has inconsistent structures, which can lower its specific surface area.

2.2. Photocatalytic Degradation Performance

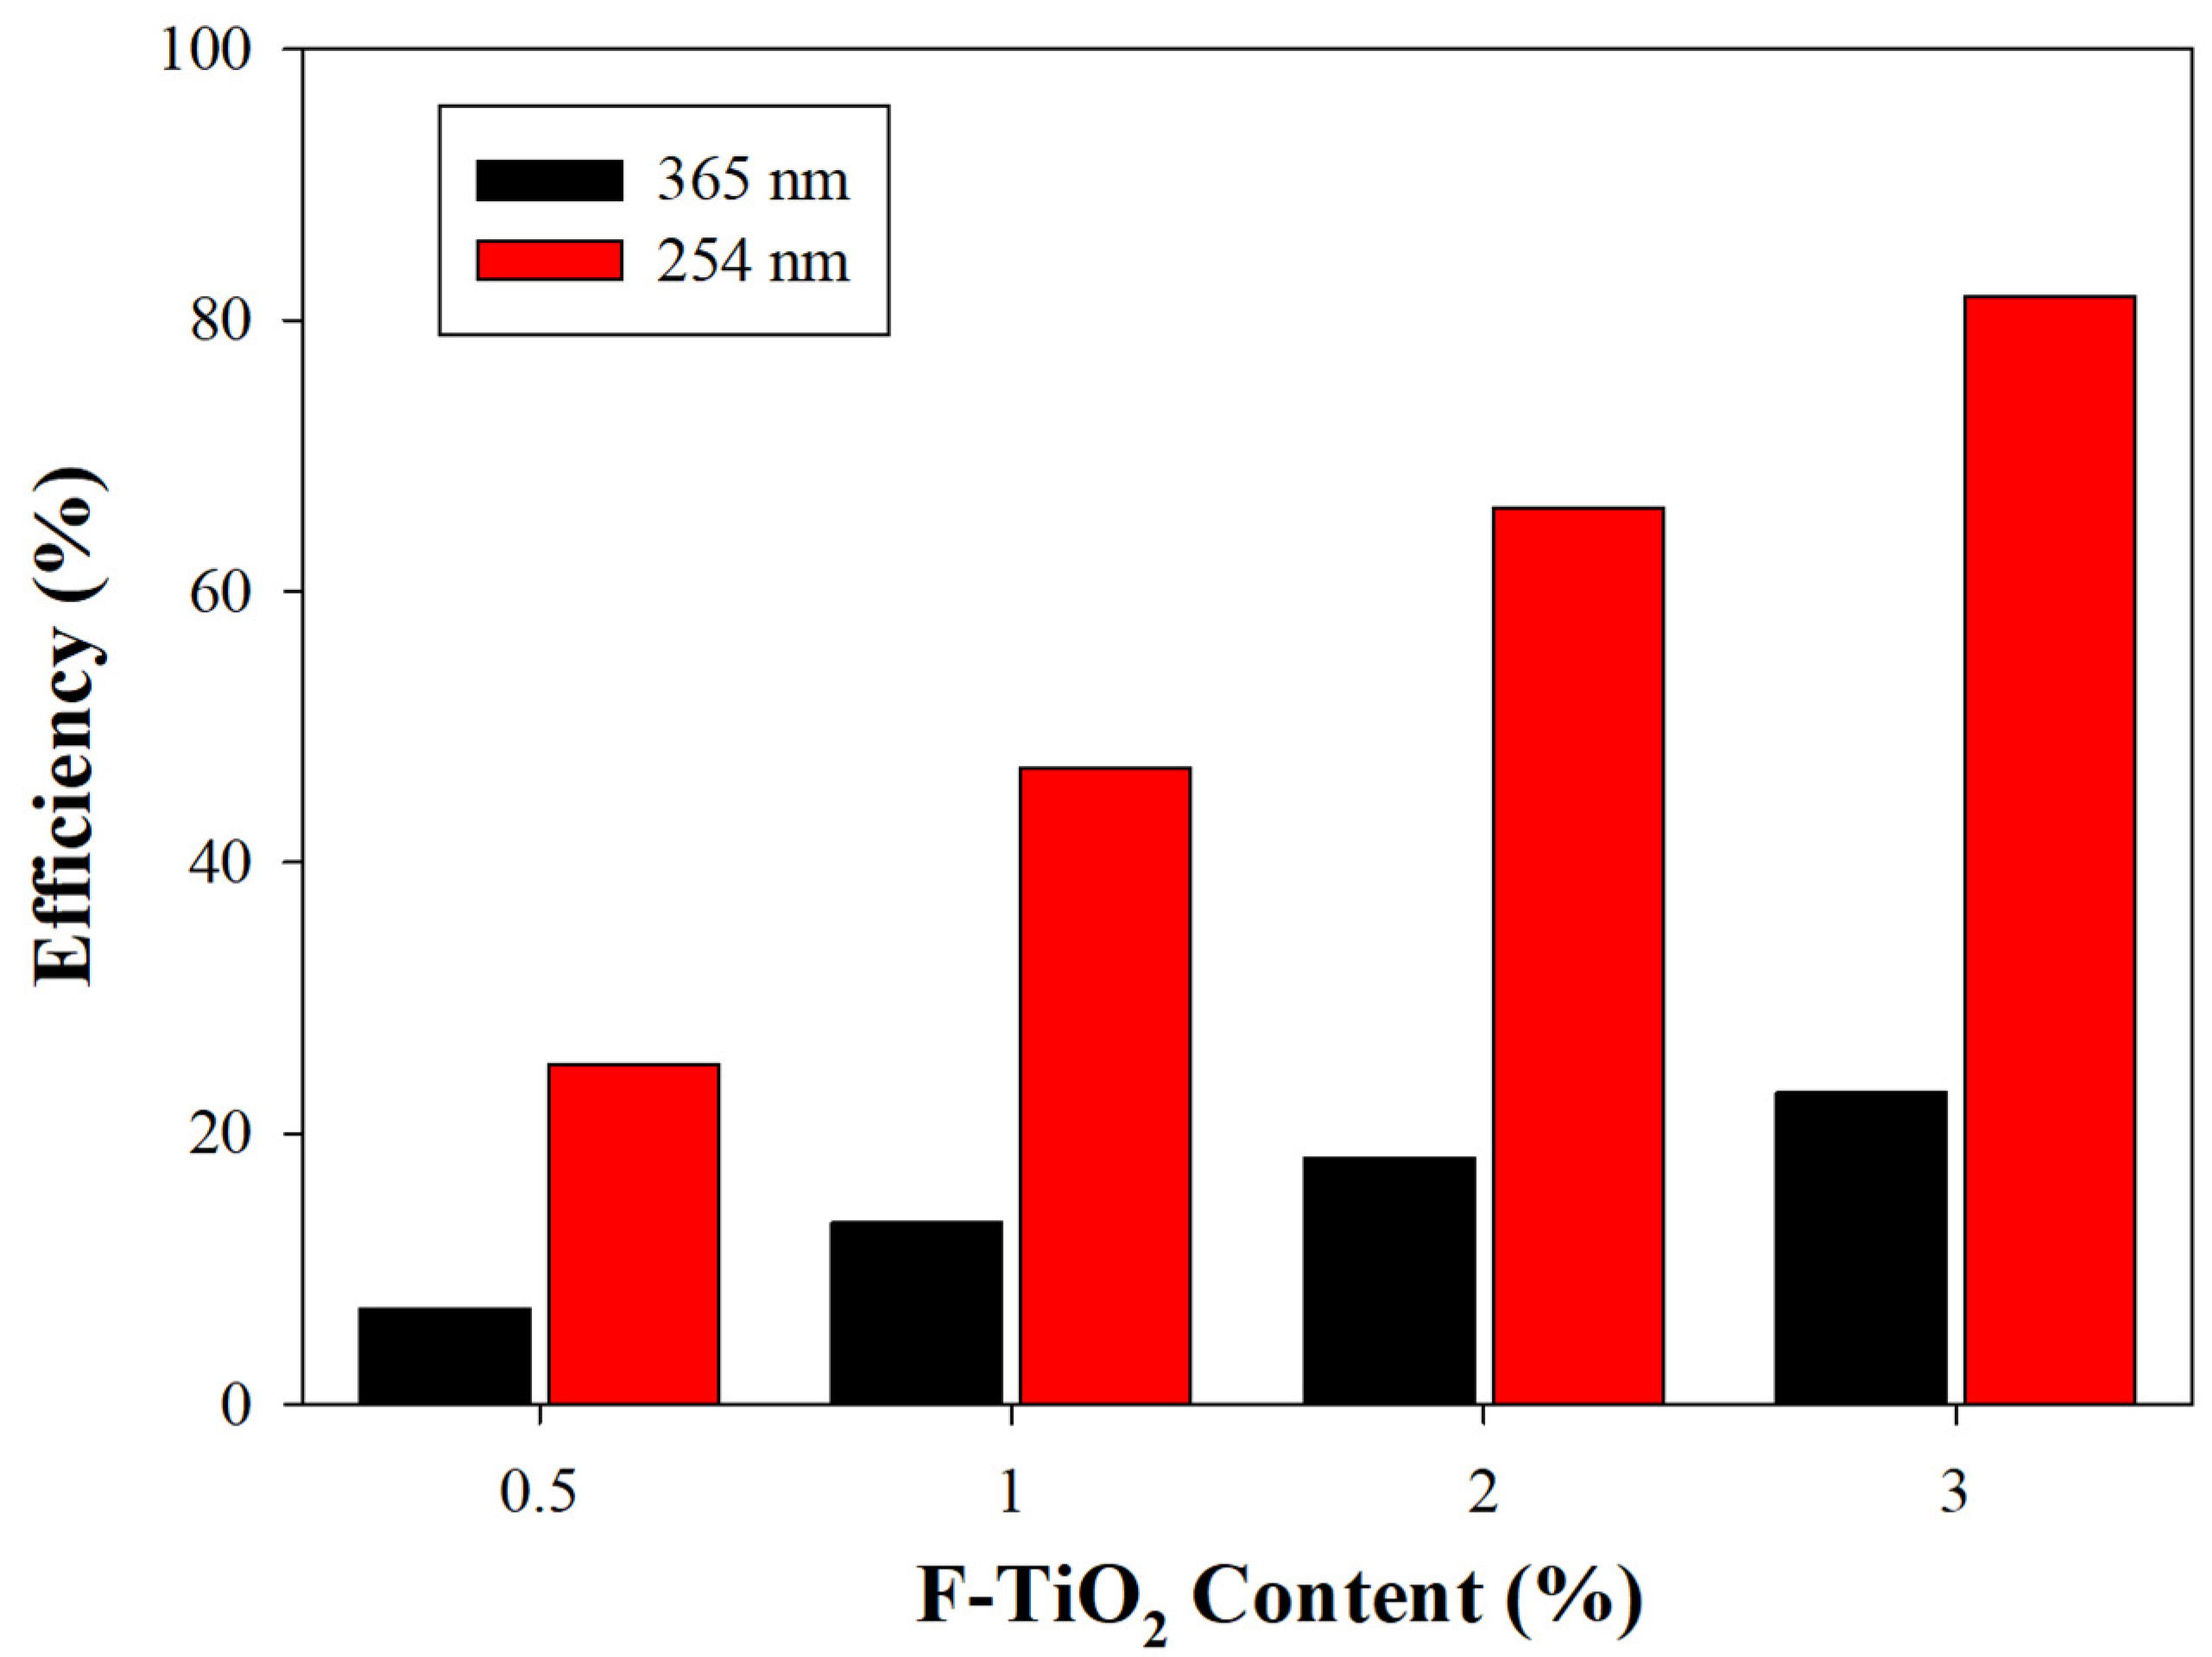
2.2.1. Effect of TiO2 Concentration

The concentration of P25 TiO2 in the photocatalytic nanofibers was varied at 0, 0.5, 1.0, 2.0, 3.0, and 4.0% (CF, 0.5%T-CF, 1.0%T-CF, 2.0%T-CF, 3.0%T-CF, and 4.0%T-CF) to determine its effect on the degradation efficiency of acetone using the following parameters: a residence time of 90 s, light source at 254 nm, and acetone initial concentration of 30 ppm. The degradation rate of acetone by P25 TiO2 at different concentrations is summarized in Figure 8. The degradation efficiency of the 254 nm UV light alone only reached approximately 5% reduction, while the CF reached 4% reduction, which is lower than the UV light alone. This can be attributed to the shielding effect of CF, which blocks the UV light.
While the concentration of P25 TiO2 increases, the degradation efficiency of acetone increases. More TiO2 is distributed on the nanofiber surface, which provides more active sites for photocatalytic reactions for the degradation of acetone. The degradation efficiency of acetone reaches 65.6% for 3.0%T-CF. However, as the concentration of P25 TiO2 reaches 4.0%, the degradation efficiency decreases from 65.6% to 55.5%. The addition of more P25 TiO2 above 3.0% makes the solution more viscous, which causes a poor nanofiber quality with an inconsistent fiber diameter. In addition, P25 TiO2 nanoparticle agglomeration is more favorable at higher concentrations. The agglomeration of P25 TiO2 nanoparticles decreases the specific surface area and active sites for photocatalytic degradation.
Similarly, the effect of the concentration of F-TiO2 on the degradation of acetone was investigated. Different F-TiO2 concentrations, namely, 0.5, 1.0, 2.0, and 3.0% (0.5%FT-CF, 1.0%FT-CF, 2.0%FT-CF, and 3.0%FT-CF), were used in the photodegradation performance test. Similar trends were observed between the effect of the concentration of P25 TiO2 and F-TiO2. The degradation efficiencies of 0.5%FT-CF, 1.0%FT-CF, 2.0%FT-CF, and 3.0%FT-C are 25.1%, 47.0%, 66.1%, and 81.8%, respectively. As shown in Figure 9, FT-CFs exhibit a better degradation efficiency than T-CFs. The superior photocatalytic activity of FT-CFs can be attributed to the excellent properties of FT-CFs compared with T-CFs, including higher adsorption properties, a lower band gap, a thinner fiber diameter, and a larger specific surface area. Moreover, F-TiO2’s superior photocatalytic activity over P25 TiO2 enhanced the degradation efficiency of the FT-CFs. F-TiO2 has an anatase-phase TiO2 crystalline structure, which has better photocatalytic activity than rutile-phase TiO2, while P25 TiO2 has a combination of anatase- and rutile-phase TiO2 crystalline structures.

2.2.2. Effect of Initial Concentration, Residence Time, and UV Light Source

The experiment was conducted using a fixed amount of photocatalytic nanofibers. As shown in Figure 10, the degradation efficiency of acetone decreases as the initial concentration of acetone increase. The degradation efficiency at 15 ppm reached 95.0%, while it only reached 34.0% at 90 ppm. At higher concentrations, acetone molecules compete for the limited active sites of the photocatalytic nanofibers.
The effect of residence time was evaluated by adjusting the flow rate of the acetone gas mixture through the annular photocatalytic reactor (Figure 11). The degradation efficiency of acetone reached 59.7%, 72.5%, 79.7%, and 89.8% for residence times of 23, 45, 90, and 180 s, respectively. The degradation efficiency of acetone increases as the residence time is increased. A higher residence time means a longer contact of acetone with the photocatalytic nanofibers and a longer exposure to UV light, thereby increasing the photodegradation reaction of acetone. In contrast, it can be observed at one minute of contact time that the degradation efficiency of acetone at 23 s is higher than at the other residence time. A higher flow rate increases the convective mass transfer and diffusion rates, thereby increasing the interactions between the acetone molecules and the active sites in the photocatalytic nanofibers. However, as the contact time increases, the surface reactions dominate the photodegradation, which means that a higher residence time has a higher degradation efficiency.
The effect of the light source on the degradation efficiency of acetone was evaluated using light sources at 254 nm and 365 nm (Figure 12). The experiment was conducted using 0.5%FT-CF, 1.0%FT-CF, 2.0%FT-CF, and 3.0%FT-CF, with a residence time of 90 s and an initial acetone concentration of 30 ppm. It can be observed that the degradation efficiency of acetone using a 254 nm light source is higher than using 365 nm light source. A 254 nm light source carries more energy, which promotes more electrons and radicals, promoting more interactions between the radicals and acetone molecules, thereby enhancing the degradation of acetone. In addition, the degradation efficiency under dark conditions is 25%.

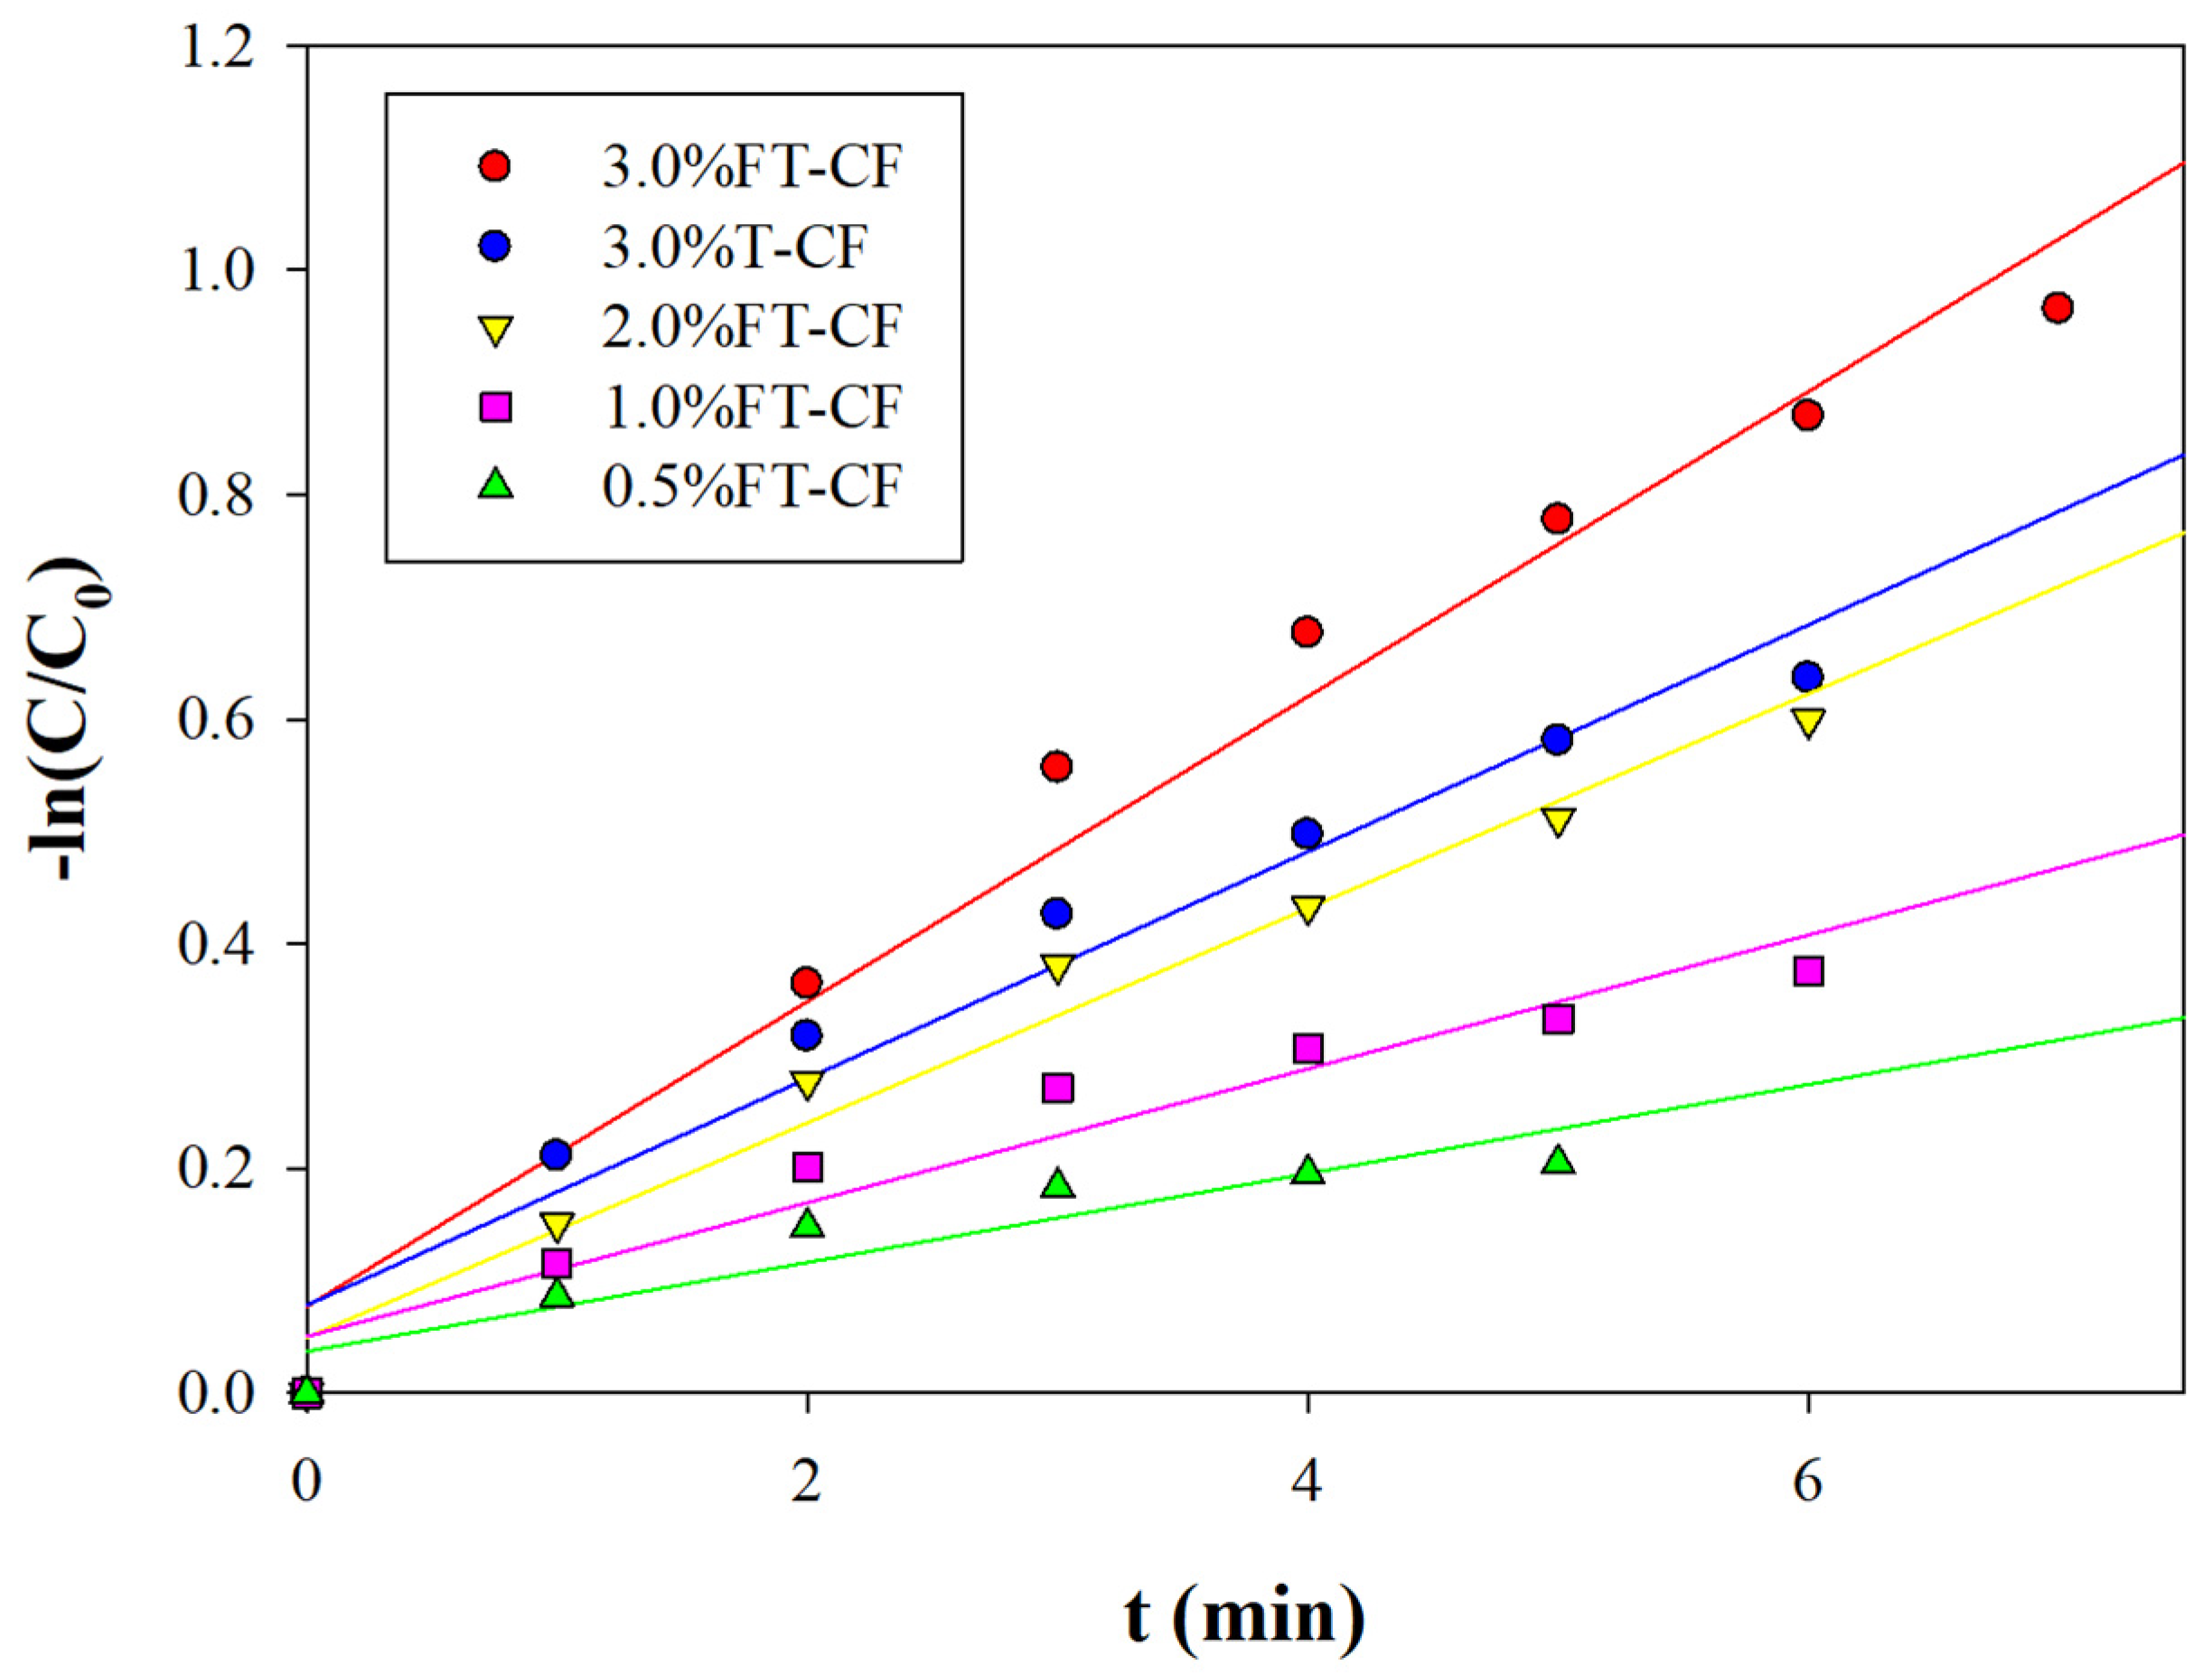
2.2.3. Photocatalytic Degradation Kinetics and Mechanism

The reaction kinetics of acetone degradation were studied using 0.5%FT-CF, 1.0%FT-CF, 2.0%FT-CF, 3.0%FT-CF, and 3.0%T-CF (Figure 13). A pseudo-first-order kinetic model was used to determine the photocatalytic reaction rate. The authors of [22] state that the photodegradation rate follows the pseudo-first-order kinetic model, which means that the reaction depends on two reactants; however, it appears that it only depends on a single reaction, due to its concentration being significantly higher than that of the second reactant. The reaction rate constants of the different photocatalytic nanofibers are summarized in Table 3. The highest reaction rate is 0.1358 min−1 and belongs to 3.0%FT-CF.
The reaction involved in the photocatalytic degradation of acetone is illustrated in Scheme 1. Radicals are formed when an electron and positively charged hole, generated from the photoexcitation of TiO2, react with H2O and O2 molecules that are present in the air [6]. These radicals participate in the oxidation of acetone, producing CO2 and H2O.

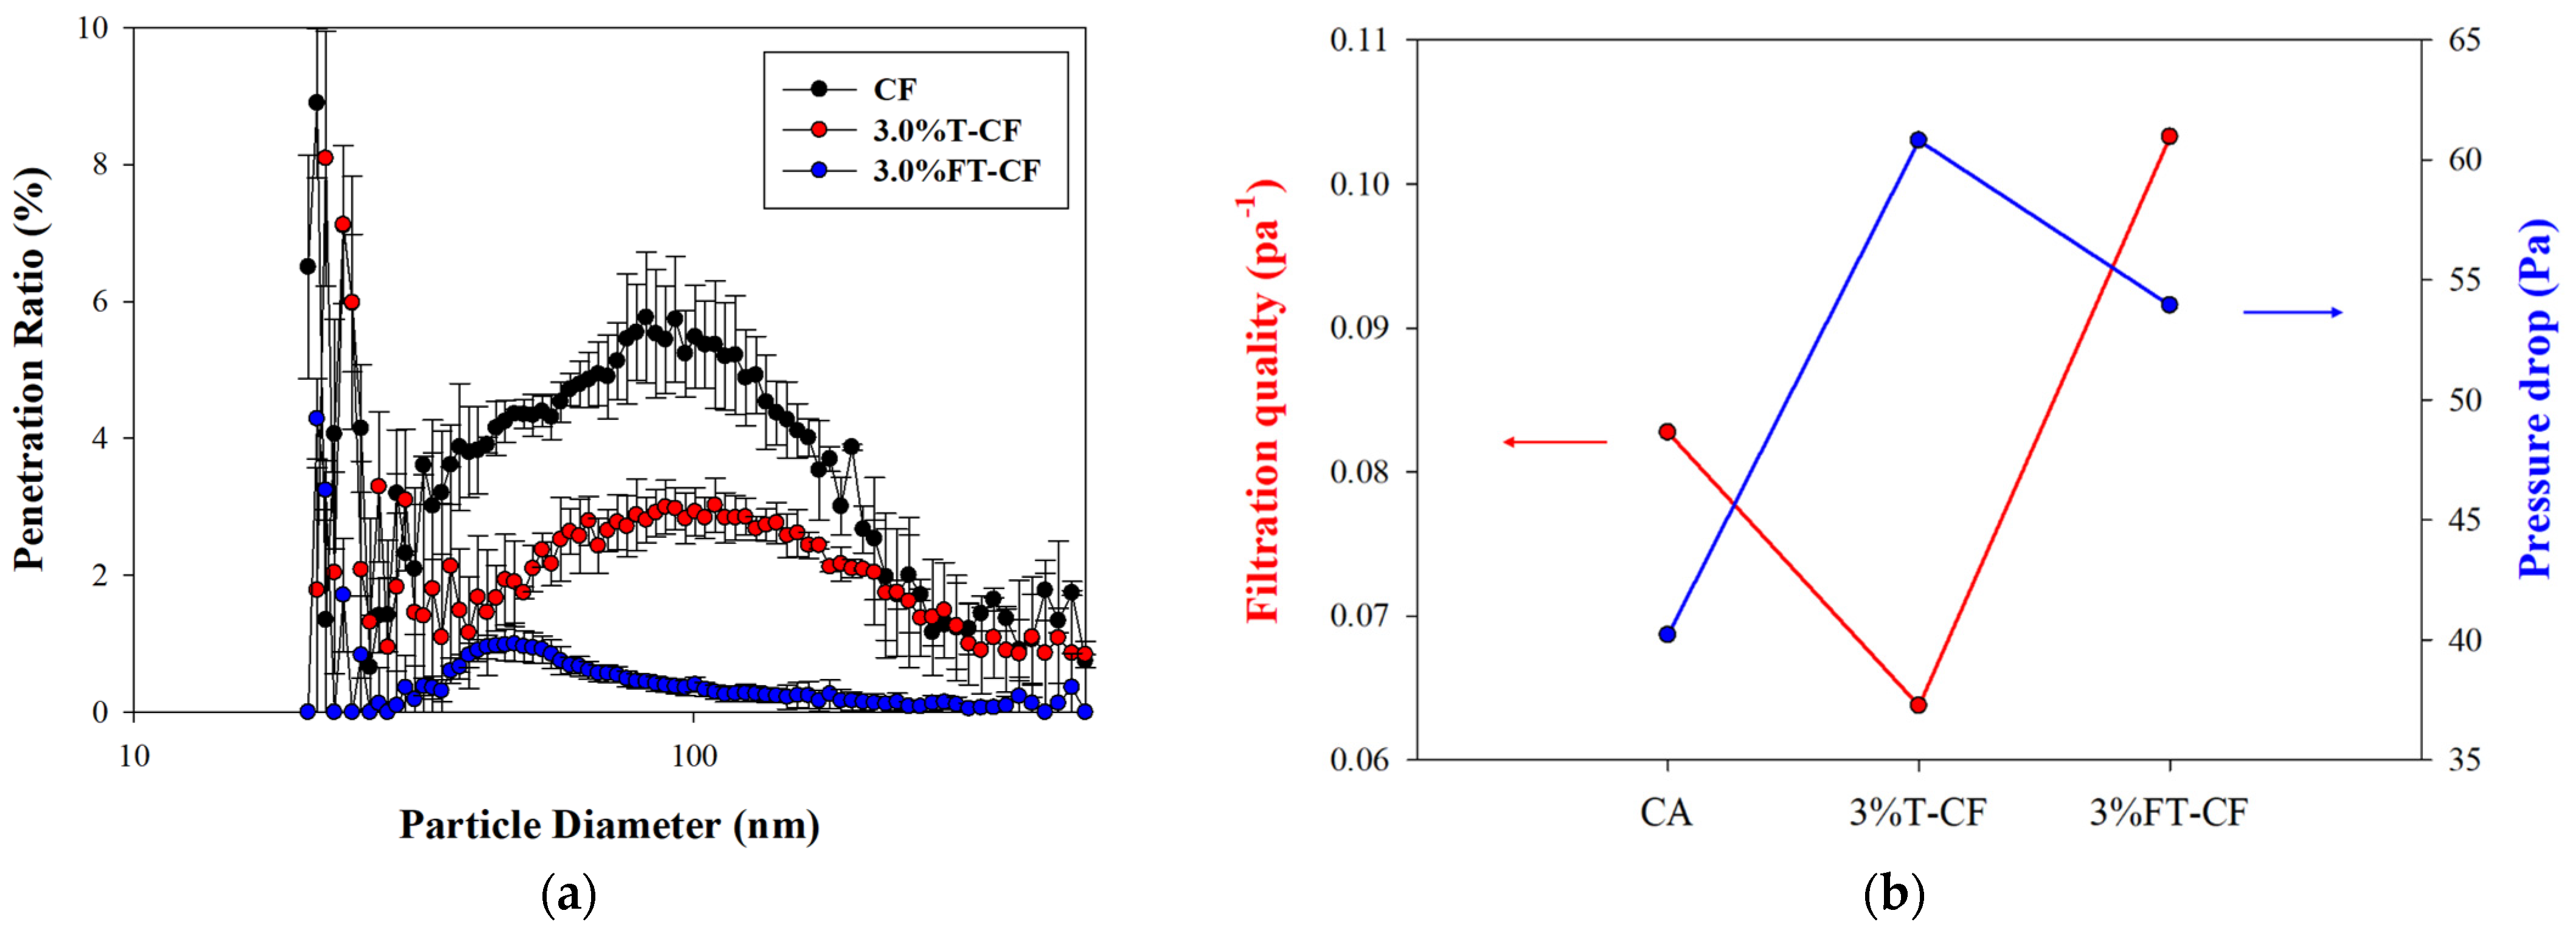
2.3. Filtration Performance

2.3.1. Effect of TiO2 on Filtration Performance

CF, 3.0%T-CF, and 3.0%FT-CF were used to investigate the effect of TiO2’s nanocrystalline structure on the filtration performance of the nanofibers (Figure 14a). Filtration performance tests were conducted with the following parameters: a particle size range from 10 to 500 nm, particle number concentration between 3.04 and 3.83 × 10⁵ particles per cm−3, face velocity of 5.0 cm s−1, and filter basis weight of 0.33 g m−2. The average penetration ratios for CF, 3.0%T-CF, and 3.0%FT-CF were 3.59%, 2.07%, and 0.38%, respectively. The Most Penetrating Particle Sizes (MPPSs) for the CF, 3.0%T-CF, and 3.0%FT-CF materials were 92 nm, 89 nm, and 47 nm, corresponding to maximum penetration ratios of 5.74%, 2.99%, and 0.99%, respectively. For ultrafine particles (10–50 nm), the penetration ratio peaks vary significantly due to the instability of particle generation. Ultrafine particles are captured via Brownian diffusion. As the particle size increases, direct interception and inertial impaction capture mechanisms dominate, which improves the filtration efficiency. T-CF and FT-CF have significantly lower penetrations ratio than CF.
The filtration qualities of CF, 3.0%T-CF, and 3.0%FT-CF were calculated based on the penetration ratio and pressure drop (Figure 14b). A high filtration quality is achieved when the penetration ratio and pressure drop are both low. The addition of TiO2 increases the pressure drop across the filter. 3.0%FT-CF has the highest filtration quality, followed by CF, and then 3.0%T-CF. The high pressure drop across the T-CF nanofibers lowers its filtration quality. Although FT-CF has a high pressure drop as well, its low penetration ratio allows the FT-CF nanofibers to have a high filtration quality. The nanocrystalline structure of F-TiO2 contributes to the lower penetration ratio and lower pressure drop. In addition, FT-CFs have thinner diameters compared to T-CFs.
The effect of the TiO2 content on the filtration performance of the nanofibers was evaluated using 0.5%FT-CF, 1.0%FT-CF, 2.0%FT-CF, and 3.0%FT-CF (Figure 15). Particle sizes ranging from 10 to 500 nm, particle number concentrations between 3.04 and 3.83 × 10⁵ particles per cm−3, a face velocity of 5.0 cm s−1, and a filter basis weight of 0.33 g m−2 were used in this experiment. The average permeability rates were 2.01%, 1.02%, 0.67%, and 0.38% for 0.5%FT-CF, 1.0%FT-CF, 2.0%FT-CF, and 3.0%FT-CF, respectively. In addition, the MPPSs were 44 nm, 48 nm, 49 nm, and 47 nm, respectively. The permeability rates decrease as the amount of TiO2 is increases. Intuitively, increasing the concentration of TiO2 above 3.0% may increase the filtration efficiency of the nanofibers. However, a higher concentration above 3.0% TO2 results in electrospinning issues including needle blockage, fiber breakage, and inconsistent fiber diameters. Moreover, the filtration quality of 3.0%FT-CF showed superiority among the FT-CFs nanofibers. The filter quality increased from 0.087 Pa−1 to 0.103 Pa−1. Therefore, 3.0%FT-CF was used for further studies.

2.3.2. Effect of Face Velocity and Filter Basis Weight on Filtration Performance

As shown in Figure 16, the filtration quality of CF, 3.0%T-CF, and 3.0%FT-CF at different face velocities decreases as the face velocity increases. The filtration quality of 3.0%FT-CF decreased from 0.41 to 0.02 Pa−1. The decrease in the filtration quality was due to the increase in both the penetration ratio and the pressure drop across the nanofiber filter (Figure 17).
As shown in Figure 18, the filtration efficiency is directly proportional to the filter’s basis weight. The filtration efficiency reached a 99.9% filtration efficiency with a minimum filter basis weight of 0.495 g m−2. The dense structure of the nanofiber filter allows for more interaction between the particles and nanofibers. However, the same property blocks the airflow, which drastically increases the pressure drop across the filter. The high pressure drop lowers the filtration quality of the nanofiber filters. A filter basis weight of 0.330 g m−2 obtained the highest filtration quality.

2.3.3. Filtration Penetration Ratio Simulation

Simulations were conducted to understand the behavior of the nanofiber filters (Figure 19). The simulated average penetration ratio was 0.092%, and the MPPS was 72 nm. In contrast, the experimental results indicated a penetration ratio of 0.381%, with an MPPS of 48 nm. The significant difference between the simulated result and the experimental data reveals that there are more factors that affect the penetration ratio than the parameters investigated in this study. The effect of TiO2 on the surface structure of the nanofibers, such as the fiber roughness, dendritic structures, and other effects, makes the experimental data deviate from the simulation result. The observed capture mechanism involved Brownian diffusion of ultrafine particles and an interception mechanism for larger particles.

2.4. Photocatalytic Degradation and Filtration Synergistic Effect

As shown in Figure 20a, the concentration of acetone in the gas mixture has no significant effect on the filtration performance of the nanofiber filter. The filtration efficiency remained 99.6% (±0.05%). The dominant filtration mechanism involved Brownian diffusion and direct interception. Therefore, any gaseous pollutant has little to no effect on the filtration performance of the filter.
The degradation efficiency of photocatalytic nanofibers can be affected by the presence of PM in the gas mixture, as shown in Figure 20b. The degradation efficiency decreased from 81.8% to 66.3%. PM accumulation on the surface of the nanofibers blocks the UV light from exciting the TiO2, resulting in less generation of positively charged electron holes, which reduces the degradation efficiency of acetone by means of photocatalytic reaction.

2.5. Recyclability and Biodegradation Tests

The cycle tests reveal good stability and reusability of the nanofibers (Figure 21 and Figure 22). The degradation efficiency of the photocatalytic nanofibers decreased from 81.8% to 73.8%, which accounts for an approximately 10% reduction in the efficiency. Similarly, after five cycles of filtration performance tests, the tests showed a minimal reduction in the efficiency and pressure drop.
The biodegradation tests revealed that the nanofiber material can be decomposed in 30 days in water environments and 45 days in a soil environment. These results highlight the biodegradability of the nanofiber in natural environments, showcasing its ability to degrade and decompose over time.

3. Materials and Methods

3.1. Chemicals and Materials

Titanium(IV) N-butoxide [Ti(OBu)4] (TBOT) (99%, CAS no. 5593-70-4) and cellulose acetate (CA) (MW 100,000; CAS no. 9004-35-7) were purchased from Dinghao Trading Co., Ltd., Weifang, China. Glycerol (99%, CAS no. 56-81-5) was obtained from Kehua Co., Ltd., Xiamen, China. Acetone (99.5%, CAS no. 67-64-1), ethanol (99.8%, CAS no. 64-17-5), and N,N-dimethyl acetamide (99.8%, CAS no. 127-19-5) were purchased from Youhe Trading Co., Ltd., Shenzhen, China. The deionized water was obtained from Lotun ultrapure water system.

3.2. Synthesis of Flower-like Titanium Dioxide

The F-TiO2 nanoparticles were synthesized using a hydrothermal process under high-temperature and high-pressure conditions as described in [8]. The hydrothermal process combined with a calcination process induces nucleation and crystalline growth of titanium dioxide [8].
With constant stirring, 1 mL of TBOT was mixed with 15 mL of ethanol. On a separate container, 5 mL of glycerol was mixed with 15 mL of ethanol. Both of these solutions were mixed for 10 min under constant stirring. The mixed solution was then placed in a polytetrafluoroethylene (PTFE) reaction vessel at 180 °C for 24 h. After the reaction, the vessel was allowed to cool at room temperature.
The solution was filtered to obtain the solid product from the reaction. The solid product was washed with ultrapure water and ethanol several times. The washed solid product was dried in an oven at 80 °C for 12 h. The dried solid product was annealed at 450 °C in air for 3 h. The annealed solid product was ground and sieved to obtain the F-TiO2.

3.3. Preparation of Titanium Dioxide/Cellulose Acetate Fibers

Titanium dioxide/cellulose acetate fibers were prepared by electrospinning method. A known amount of CA was dissolved in a 2:1 solution of acetone and dimethylacetamide to make 16 wt% CA solution. The solution was stirred for 8 h followed by 30 min of ultrasonic agitation. The solution was coded as CF. Different amounts of synthesized F-TiO2 were added to the CA solution to make 0.5, 1.0, 2.0, and 3.0% of F-TiO2 and coded as 0.5%FT-CF, 1.0%FT-CF, 2.0%FT-CF, and 3.0%FT-CF, respectively. The solution was mixed for 8 h, followed by 30 min of ultrasonic agitation. The solutions were separately transferred to a 10 mL syringe with a needle attachment and connected to the electrospinning instrument. The electrospinning parameters are summarized in Table 4. The nanofibers were dried at 40 °C for 24 h.
Similarly, P25 TiO2 powder was added to the CA solution to make 0.5, 1.0, 2.0, 3.0, and 4.0% of P25 TiO2 and named 0.5%T-CF, 1.0%T-CF, 2.0%T-CF, 3.0%T-CF, and 4.0%T-CF, respectively. The same electrospinning parameters were used for T-CFs. The collected nanofibers were dried at 40 °C for 24 h.

3.4. Characterizations

Surface morphology analysis, crystal structure analysis, surface functional group analysis, optic characteristics analysis, and nitrogen isothermal adsorption/desorption analysis were performed to characterize the P25 TiO2 powder and the synthesized F-TiO2. The electrospun nanofibers were characterized using scanning electron microscope.
Surface morphology analysis was carried out using JEOL JSM-7800F scanning electron microscope (FE-SEM) equipped with energy-dispersive X-ray spectrometer (EDS). Crystal structure analysis was conducted using X-ray diffraction over a 2θ range of 10–80°. JCPDS card numbers 00-021-1272 and 01-070-7347 were used to identify surface functional groups using Thermo Fisher Scientific Nicolet iS10 Fourier transform infrared (FTIR) spectrometer in the range of 650–4000 cm−1. Optic characteristics were evaluated using HITACHI U-3900 UV–Visible absorption spectrophotometer in the range of 200–700 nm. Chemical valence state and composition of F-TiO2 were identified using XPS analysis. Nitrogen adsorption and desorption isotherms were analyzed using Micromeritics ASAP 2020 surface area and porosity analyzer. Specific surface area was evaluated using Brunauer–Emmett–Teller (BET) method, and for pore size and pore volume, Barrett–Joyner–Halenda (BJH) method was used.

3.5. Photocatalytic Degradation Performance of Titanium Dioxide/Cellulose Acetate Nanofibers

The photocatalytic activity of the CF, T-CFs, and FT-CFs were evaluated using the photocatalytic degradation performance testing system illustrated in Figure 23. The system is equipped with an acetone generation system, which mixes acetone and nitrogen gas to obtain acetone concentrations of 15, 30, 60, and 90 ppm. The flow rates were fixed at 50, 100, 200, and 400 mL min−1, which correspond to residence times of 180, 90, 45, and 23 s, respectively.
The acetone–nitrogen gas mixture flows through an annular photocatalytic reactor with a capacity of approximately 150 mL. The reactor is equipped with 254 nm and 365 nm UV lamps in the center of the reactor, as shown in Figure 24. The photocatalytic nanofibers (CF, T-CFs, and FT-CFs) were placed inside the reactor to cover the entire UV lamp. The outer stainless steel jacket has circulating water, which can be used to control the temperature of the reactor. The concentration of the acetone–nitrogen gas mixture before and after the photocatalytic reaction were measured using ION Science Tiger Photo Ionization Detector (PID).
The reusability of 3.0%FT-CF photocatalytic nanofiber was investigated under 5 consecutive cycles of photocatalytic reactions. The experiment was conducted using 254 nm UV lamp, with initial acetone concentration of 30 ppm and residence time of 90 s. The photocatalytic nanofiber was regenerated by heating in oven at 50 °C for 1 h to remove CO2, water, and residual acetone.
The rate of acetone’s photocatalytic reaction with photocatalytic nanofibers (CF, T-CFs, and FT-CFs) was determined using first-order kinetic model. Experimental results from using an initial acetone concentration of 30 ppm, a residence time of 90 s, and a 254 nm light source were used to determine the photocatalytic reaction rate. Moreover, the reaction mechanism of the acetone photocatalytic degradation was investigated.

3.6. Filtration Performance of Titanium Dioxide/Cellulose Acetate Nanofibers

The filtration performance of the CF, T-CFs, and FT-CFs were evaluated using a filtration performance testing system illustrated in Figure 25. The system is equipped with a particle generation system, which utilizes an atomizer to generate sub-micro to nanosized particles. A 1 M NaOH solution was used to produce aerosol particles. The moisture was removed from the aerosol particles using silica gel desiccant. The dried aerosol particles were introduced into a Kr-85 electrostatic neutralizer. The electrostatic neutralizer releases beta particles and a small amount of gamma radiation, which dissociates air molecules into positive and negative ions. The aerosol particles reach Boltzmann charge equilibrium as the ions attach to their surface. The generated particles were introduced to a mixing chamber. The particle number and particle size distribution were monitored.
The generated particles were passed through the photocatalytic nanofibers (CF, T-CFs, and FT-CFs), fixed inside a stainless steel clamp. The photocatalytic nanofibers have an effective area of approximately 16 cm2, with 0.165, 0.330, 0.495, and 0.660 g m−2 filter basis weights. The flow rate of the particles was fixed at 1000, 4000, 7000, and 10,000 mL min−1, which corresponds to a face velocity of 1, 4, 7, 10 cm s−1. The number of particles before and after the filtration was measured using MSP 1000XP Wide-range Particle Size (WPS) Spectrometer, which can measure particles with a size in the range of 10–50 nm. A pressure gauge is connected to the filtration set up to measure the pressure drop across the photocatalytic nanofibers.
The reusability of 3.0%FT-CF was evaluated under 5 cycles of filtration experiments, with face velocity of 5 cm s−1, filter basis weight of 0.33 g m−2. The nanofiber filters were regenerated by soaking in clean water for one minute under ultrasonic agitation. The nanofiber filters were dried in an oven at 50 °C.
To evaluate the synergistic effect of filtration and photocatalytic reaction to acetone degradation, 3.0%FT-CF photocatalytic nanofiber was used. A photocatalytic reaction experiment using a 254 nm UV lamp, with parameters of initial acetone concentration of 30 ppm, residence time of 90 s, and particle number concentrations 0, 3.4 × 10⁵, 7.6 × 10⁵, 1.2 × 10⁶, and 2.1 × 10⁶ particles cm−3, was conducted to evaluate the performance of the photocatalytic nanofiber at different particle number concentrations. Similarly, a filtration experiment with initial acetone concentrations of 0, 15, 30, and 90 ppm, particle number concentrations of 3.04 × 10⁵–3.83 × 10⁵ particles cm−3, face velocity of 5.0 cm s−1, and a filter basis weight of 0.33 g m−2 was performed to evaluate the filtration performance of the nanofibers at different acetone concentrations.

3.7. Biodegradation Tests

The biodegradation activity of the 3.0%FT-CF photocatalytic nanofiber in tap water, artificial seawater, and soil was evaluated. The artificial seawater was prepared according to the international standard ASTM D1141-98 from the American Society for Testing and Materials (ASTM). In separate containers, samples of the photocatalytic nanofiber were immersed in 500 mL of tap water and 500 mL of artificial seawater for 30 days. The soil was obtained from the vicinity of the National Ilan University campus. The photocatalytic nanofiber was buried under the soil at a depth of 10 to 15 cm, with a soil area of at least 30 × 30 cm2. The samples were observed regularly.

4. Conclusions

The photocatalytic degradation performance and filtration performance of electrospun F-TiO2/CA under different parameters were studied. The synthesized F-TiO2 showed superior properties and photocatalytic activity compared with P25 TiO2, which enhances the properties of FT-CF nanofibers for both acetone degradation and PM filtration applications. The acetone degradation filtration performance reached 95.0% and 99.6% efficiency under optimal conditions. The synergistic effects of filtration and photocatalytic reaction were investigated. The cycle tests revealed good stability and reusability of the nanofibers.

Author Contributions

Conceptualization, C.-T.C.; methodology, Y.-T.K.; validation, Y.-T.K.; formal analysis, Y.-T.K.; investigation, Y.-T.K.; resources, C.-T.C.; data curation, Y.-T.K.; writing—original draft preparation, Y.-T.K. and J.J.B.R.; writing—review and editing, J.J.B.R. and R.B.L.; visualization, Y.-T.K. and J.J.B.R.; supervision, R.B.L. and C.-T.C.; project administration, C.-T.C.; funding acquisition, C.-T.C. All authors have read and agreed to the published version of the manuscript.

Funding

This research was funded by the National Science and Technology Council, Taiwan, grant number NSTC 111-2622-E-197-010-.

Data Availability Statement

The dataset is available on request from the authors.

Conflicts of Interest

The authors declare no conflicts of interest.

References

  1. David, E.; Niculescu, V.-C. Volatile Organic Compounds (VOCs) as Environmental Pollutants: Occurrence and Mitigation Using Nanomaterials. Int. J. Environ. Res. Public Health 2021, 18, 13147. [Google Scholar] [CrossRef] [PubMed]
  2. Zhou, X.; Zhou, X.; Wang, C.; Zhou, H. Environmental and Human Health Impacts of Volatile Organic Compounds: A Perspective Review. Chemosphere 2023, 313, 137489. [Google Scholar] [CrossRef] [PubMed]
  3. Pandey, P.; Yadav, R. A Review on Volatile Organic Compounds (VOCs) as Environmental Pollutants: Fate and Distribution. Int. J. Plant Environ. 2018, 4, 14–26. [Google Scholar] [CrossRef]
  4. Almaie, S.; Vatanpour, V.; Rasoulifard, M.H.; Koyuncu, I. Volatile Organic Compounds (VOCs) Removal by Photocatalysts: A Review. Chemosphere 2022, 306, 135655. [Google Scholar] [CrossRef] [PubMed]
  5. Gautam, S.; Agrawal, H.; Thakur, M.; Akbari, A.; Sharda, H.; Kaur, R.; Amini, M. Metal Oxides and Metal Organic Frameworks for the Photocatalytic Degradation: A Review. J. Environ. Chem. Eng. 2020, 8, 103726. [Google Scholar] [CrossRef]
  6. Chen, H.; Nanayakkara, C.E.; Grassian, V.H. Titanium Dioxide Photocatalysis in Atmospheric Chemistry. Chem. Rev. 2012, 112, 5919–5948. [Google Scholar] [CrossRef] [PubMed]
  7. Tayade, R.J.; Surolia, P.K.; Kulkarni, R.G.; Jasra, R. V Photocatalytic Degradation of Dyes and Organic Contaminants in Water Using Nanocrystalline Anatase and Rutile TiO2. Sci. Technol. Adv. Mater. 2007, 8, 455–462. [Google Scholar] [CrossRef]
  8. Tian, G.; Chen, Y.; Zhou, W.; Pan, K.; Tian, C.; Huang, X.; Fu, H. 3D Hierarchical Flower-like TiO2 Nanostructure: Morphology Control and Its Photocatalytic Property. CrystEngComm 2011, 13, 2994–3000. [Google Scholar] [CrossRef]
  9. Dong, H.; Zeng, G.; Tang, L.; Fan, C.; Zhang, C.; He, X.; He, Y. An Overview on Limitations of TiO2-Based Particles for Photocatalytic Degradation of Organic Pollutants and the Corresponding Countermeasures. Water Res. 2015, 79, 128–146. [Google Scholar] [CrossRef] [PubMed]
  10. Vatanpour, V.; Pasaoglu, M.E.; Barzegar, H.; Teber, O.O.; Kaya, R.; Bastug, M.; Khataee, A.; Koyuncu, I. Cellulose Acetate in Fabrication of Polymeric Membranes: A Review. Chemosphere 2022, 295, 133914. [Google Scholar] [CrossRef] [PubMed]
  11. Konwarh, R.; Karak, N.; Misra, M. Electrospun Cellulose Acetate Nanofibers: The Present Status and Gamut of Biotechnological Applications. Biotechnol. Adv. 2013, 31, 421–437. [Google Scholar] [CrossRef] [PubMed]
  12. Schmidt, C.M.; Buchbinder, A.M.; Weitz, E.; Geiger, F.M. Photochemistry of the Indoor Air Pollutant Acetone on Degussa P25 TiO2 Studied by Chemical Ionization Mass Spectrometry. J. Phys. Chem. A 2007, 111, 13023–13031. [Google Scholar] [CrossRef] [PubMed]
  13. JCPDS 00-021-1272; Joint Committee on Powder Diffraction Standards. The International Centre for Diffraction Data: Newtown Square, PA, USA, 2024.
  14. JCPDS 01-070-7347; Joint Committee on Powder Diffraction Standards. The International Centre for Diffraction Data: Newtown Square, PA, USA, 2024.
  15. Zhang, Y.; Wang, T.; Zhou, M.; Wang, Y.; Zhang, Z. Hydrothermal Preparation of Ag-TiO2 Nanostructures with Exposed {001}/{101} Facets for Enhancing Visible Light Photocatalytic Activity. Ceram. Int. 2017, 43, 3118–3126. [Google Scholar] [CrossRef]
  16. Wang, T.; Tang, T.; Gao, Y.; Chen, Q.; Zhang, Z.; Bian, H. Hydrothermal Preparation of Ag-TiO2-Reduced Graphene Oxide Ternary Microspheres Structure Composite for Enhancing Photocatalytic Activity. Physica E Low. Dimens. Syst. Nanostruct 2019, 112, 128–136. [Google Scholar] [CrossRef]
  17. Gao, X.; Zheng, K.; Zhang, Q.; Cao, X.; Wu, S.; Su, J. Self-Assembly TiO2-RGO/LDHs Nanocomposite: Photocatalysis of VOCs Degradation in Simulation Air. Appl. Surf. Sci. 2022, 586, 152882. [Google Scholar] [CrossRef]
  18. Hou, Y.D.; Wang, X.C.; Wu, L.; Chen, X.F.; Ding, Z.X.; Wang, X.X.; Fu, X.Z. N-Doped SiO2/TiO2 Mesoporous Nanoparticles with Enhanced Photocatalytic Activity under Visible-Light Irradiation. Chemosphere 2008, 72, 414–421. [Google Scholar] [CrossRef] [PubMed]
  19. Abdellah Ali, S.F.; William, L.A.; Fadl, E.A. Cellulose Acetate, Cellulose Acetate Propionate and Cellulose Acetate Butyrate Membranes for Water Desalination Applications. Cellulose 2020, 27, 9525–9543. [Google Scholar] [CrossRef]
  20. Yao, A.; Yan, Y.; Tan, L.; Shi, Y.; Zhou, M.; Zhang, Y.; Zhu, P.; Huang, S. Improvement of Filtration and Antifouling Performance of Cellulose Acetate Membrane Reinforced by Dopamine Modified Cellulose Nanocrystals. J. Memb. Sci. 2021, 637, 119621. [Google Scholar] [CrossRef]
  21. Xu, L.; Zhang, J.; Ding, J.; Liu, T.; Shi, G.; Li, X.; Dang, W.; Cheng, Y.; Guo, R. Pore Structure and Fractal Characteristics of Different Shale Lithofacies in the Dalong Formation in the Western Area of the Lower Yangtze Platform. Minerals 2020, 10, 72. [Google Scholar] [CrossRef]
  22. Rao, Z.; Shi, G.; Wang, Z.; Mahmood, A.; Xie, X.; Sun, J. Photocatalytic Degradation of Gaseous VOCs over Tm3+-TiO2: Revealing the Activity Enhancement Mechanism and Different Reaction Paths. Chem. Eng. J. 2020, 395, 125078. [Google Scholar] [CrossRef]
Figure 1. FE-SEM surface morphology images: (a) P25 TiO2; (b) F-TiO2.
Catalysts 14 00233 g001
Figure 2. FE-SEM surface morphology analysis: (a) CF; (c) 0.5%FT-CF; and (e) 1.0%FT-CF (magnification ×10,000). Diameter distribution of fibers: (b) CF; (d) 0.5%FT-CF; and (f) 1.0%FT-CF with different TiO2 addition amounts. And (g) EDS spectrum of 3.0%FT-CF.
Catalysts 14 00233 g002aCatalysts 14 00233 g002b
Figure 3. XRD spectra of different TiO2 nanoparticles.
Catalysts 14 00233 g003
Figure 4. UVVis spectra of TiO2 nanoparticles and TiO2/CA nanofibers.
Catalysts 14 00233 g004
Figure 5. (a) XPS analysis of F-TiO2 nanoparticles; (b) Ti 2p; (c) O 1s.
Catalysts 14 00233 g005
Figure 6. FTIR spectra of (a) P25 TiO2; (b) F-TiO2; (c) CA; (d) 3.0T-CF; (e) 3.0FT-CF.
Catalysts 14 00233 g006
Figure 7. Nitrogen isothermal adsorption/desorption curves of different TiO2 nanoparticles.
Catalysts 14 00233 g007
Figure 8. Degradation efficiency of (a) 254 UV, CF, T-CFs; (b) FT-CFs at different catalyst concentrations (initial concentration: 30 ppm; residence time: 90 s; light source: 254 nm).
Catalysts 14 00233 g008
Figure 9. Comparison of degradation efficiencies between P25 TiO2 and F-TiO2 at different TiO2 contents (3.0%FT-CF; initial concentration: 30 ppm; residence time: 90 s; light source: 254 nm).
Catalysts 14 00233 g009
Figure 10. Degradation efficiency at different initial acetone concentrations (3.0%FT-CF; residence time: 90 s; light source: 254 nm).
Catalysts 14 00233 g010
Figure 11. Degradation efficiency over different residence times (3.0%FT-CF; initial concentration: 30 ppm; light source: 254 nm).
Catalysts 14 00233 g011
Figure 12. Comparison of degradation efficiency of FT-CFs under different UV light sources (initial concentration: 30 ppm; residence time: 90 s).
Catalysts 14 00233 g012
Figure 13. Pseudo-first-order kinetic model fitting for different TiO2/CA nanofibers (initial concentration: 30 ppm; residence time: 90 s; light source: 254 nm).
Catalysts 14 00233 g013
Scheme 1. Reaction mechanism of TiO2 photoexcitation and acetone oxidation.
Catalysts 14 00233 sch001
Figure 14. Filtration performance of different nanofiber filters: (a) penetration ratio; (b) filtration quality (particle sizes: 10 to 500 nm; particle count: 3.04–3.83 × 10⁵ particles cm−3; face velocity: 5.0 cm s−1; filter basis weight: 0.33 g m−2).
Catalysts 14 00233 g014
Figure 15. Effect of TiO2 concentration on (a) penetration ratio; (b) filtration quality (particle sizes: 10 to 500 nm; particle counts: 3.04–3.83 × 10⁵ particles cm−3; face velocity: 5.0 cm s−1; filter basis weight: 0.33 g m−2).
Catalysts 14 00233 g015
Figure 16. Effect of face velocity on the filtration quality (particle sizes: 10 to 500 nm; particle counts: 3.04–3.83 × 10⁵ particles cm−3; filter basis weight: 0.33 g m−2).
Catalysts 14 00233 g016
Figure 17. Effect of face velocity on (a) penetration ratio; (b) pressure drop (particle sizes: 10 to 500 nm; particle counts: 3.04–3.83 × 10⁵ particles cm−3; filter basis weight: 0.33 g m−2).
Catalysts 14 00233 g017
Figure 18. Effect of filter’s basis weight on filtration efficiency (particle sizes: 10 to 500 nm; particle counts: 3.04–3.83 × 10⁵ particles cm−3; face velocity: 5.0 cm s−1).
Catalysts 14 00233 g018
Figure 19. Comparison of penetration ratios of simulated and experimental data.
Catalysts 14 00233 g019
Figure 20. Filtration and photocatalytic degradation synergistic effect: (a) filtration efficiency (3.0FT-CF; particle sizes: 10 to 500 nm; particle counts: 3.04–3.83 × 10⁵ particles cm−3; face velocity: 5.0 cm s−1; filter basis weight: 0.33 g m−2); (b) photodegradation efficiency (3.0%FT-CF; initial concentration: 30 ppm; residence time: 90 s; light source: 254 nm). (# = number).
Catalysts 14 00233 g020
Figure 21. Photocatalytic degradation cycle test (3.0%FT-CF; initial concentration: 30 ppm; residence time: 90 s; light source: 254 nm).
Catalysts 14 00233 g021
Figure 22. Biodegradation process in (a) tap water; (b) artificial seawater; (c) soil.
Catalysts 14 00233 g022
Figure 23. Schematic diagram of photocatalytic degradation performance testing system.
Catalysts 14 00233 g023
Figure 24. Internal structure diagram of the annular photocatalytic reactor.
Catalysts 14 00233 g024
Figure 25. Filtration performance testing system.
Catalysts 14 00233 g025
Table 1. Energy band gaps of different TiO2 materials.
MaterialMaximum Absorption Wavelength (nm)Energy Band Gap
F-TiO24003.10
P25 TiO23913.17
3%FT-CF3753.30
3%T-CF3723.33
Table 2. Specific surface area and pore characteristics of different TiO2 nanoparticles.
MaterialSpecific Surface Area (m2 g−1)Pore Volume (cm3 g−1)Pore Size (nm)
P25 TiO247.20.0545.8
F-TiO270.10.0827.9
Table 3. Reaction rate constants for TiO2/CA nanofibers.
Parameter0.5%FT-CF1.0%FT-CF2.0%FT-CF3.0%FT-CF3.0%T-CF
k1 (min−1)0.04880.05960.08540.13580.0956
R20.9160.9350.9870.9750.975
Table 4. Electrospinning parameters.
ParameterSetting
Feed rate1.5 mL h−1
Collector distance15 cm
Electrical field voltage20 kV
Collector rotation speed100 rpm
Base materialPolyethylene terephthalate nonwoven fabric
Disclaimer/Publisher’s Note: The statements, opinions and data contained in all publications are solely those of the individual author(s) and contributor(s) and not of MDPI and/or the editor(s). MDPI and/or the editor(s) disclaim responsibility for any injury to people or property resulting from any ideas, methods, instructions or products referred to in the content.

