Article

Effect of Copper Particle Size on the Surface Structure and Catalytic Activity of Cu–CeO2 Nanocomposites Prepared by Mechanochemical Synthesis in the Preferential CO Oxidation in a H2-Rich Stream (CO-PROX)

by
Olga M. Zhigalina
1,2,
Olga S. Morozova
3,*,
Dmitry N. Khmelenin
1,
Alla A. Firsova
3,
Olga V. Silchenkova
3,
Galina A. Vorobieva
3,
Andrey V. Bukhtiyarov
4,
Evgeny N. Cherkovskiy
1,* and
Victoria G. Basu
1
1
Shubnikov Institute of Crystallography of Federal Scientific Research Center “Crystallography and Photonics”, Russian Academy of Sciences, Leninskiy Prospekt, 59, 119333 Moscow, Russia
2
Department of Materials and Technology, Bauman Moscow State Technical University, 2nd Baumanskaya St., 105005 Moscow, Russia
3
N.N. Semenov Federal Research Center for Chemical Physics RAS, 4, Kosygin St., 119991 Moscow, Russia
4
Federal Research Center Boreskov Institute of Catalysis SB RAS, 5, Ac. Lavrentieva Ave., 630090 Novosibirsk, Russia
*
Authors to whom correspondence should be addressed.
Catalysts 2024, 14(4), 222; https://doi.org/10.3390/catal14040222
Submission received: 1 June 2023 / Revised: 5 July 2023 / Accepted: 25 March 2024 / Published: 27 March 2024
(This article belongs to the Special Issue Catalysts and Photocatalysts Based on Mixed Metal Oxides)

Abstract

:
An effect of Cu powder dispersion and morphology on the surface structure and the physical–chemical and catalytic properties of Cu–CeO2 catalysts prepared by mechanochemical synthesis was studied in the preferential CO oxidation in a H2-rich stream (CO-PROX). Two catalysts, produced by 30 min ball-milling from CeO2 and 8 mass% of copper powders and with particle sizes of several tens (dendrite-like Cu) and 50–200 nm (spherical Cu obtained with levitation-jet method), respectively, were characterized by X-ray diffraction and electron microscopy methods, a temperature-programmed reduction with CO and H2, and with Fourier-transform infrared spectroscopy. The catalyst synthesized from the “large-scale” dendrite-like Cu powder, whose surface consisted of CuxO (Cu+) agglomerates located directly on the surface of facetted CeO2 crystals with a CeO2(111) and CeO2(100) crystal planes exposition, was approximately two times less active at 120–160 °C than the catalyst synthesized from the fine Cu powder, whose surface consisted of CuxO (Cu2+) clusters of 4–6 nm in size located on the steps of facetted CeO2 nanocrystals. Although a large part of CO2 reacted with a ceria surface to give carbonate-like species, no blockage of CO-activating centers was observed due to the surface architecture. The surface structure formed by the use of highly dispersed Cu powder is found to be a key factor responsible for the catalytic activity.

1. Introduction

The Cu-containing catalysts based on ceria are widely used for different industrially and ecologically important processes. For example, oxidation of volatile organic compounds [1], soot of various genesis [2,3], direct and reverse Water–Gas Shift reaction [4,5], low-temperature CO oxidation, and preferential CO oxidation in a H2-rich stream [6,7]. A zero CO2 emission policy assumes hydrogen, a clean and zero-carbon fuel, as the main fuel resource. Nowadays, H2 is produced by natural gas reforming, coal gasification and other techniques. In all cases, except for electrolytic hydrogen production, the obtained H2 contains a significant admixture of CO: CH4 + H2O (+ heat) → CO + 3H2. Even a small CO content in H2 acts as a catalytic poison to the Pt alloy anode of modern polymer fuel cells, which hinders the efficiency of its application. The acceptable CO concentration for different purposes is less than 100 ppm. The CO-PROX reaction (preferential CO oxidation in H2-rich stream) allows one to reduce the CO concentration to a desired level [7]. A combination of CeO2 with metallic copper or copper oxide is widely used as an efficient catalyst for the CO-PROX reaction. Catalytic activity of such a system is driven by two major factors. The first is a strong metal-support interaction accompanied by the interfacial charge transfer Cu0–Cu+–Cu2+ and Ce4+–Ce3+ on the Cu/CuO–CeO2 surface [8,9]. The second is the high oxygen storage capacity of the CeO2 lattice together with high oxygen mobility. The promotion of the formation of oxygen vacancies through a strong metal–ceria interaction is a common driving factor of oxygen mobility in Me-CeO2 systems, something which has been discovered even for the noble metals and is extremely important for CO oxidation [10,11]. The formation of oxygen vacancies, caused by the intrusion of copper atoms or ions into the ceria surface, stimulates the latter process [12,13]. The particular oxygen state, the binding energy of which differs from that of an oxide lattice, has been detected in all of the Cu/CuO–CeO2 catalysts prepared by different techniques. This is attributed to a variety of factors, from “oxygen ions with unusual coordination in a defective CeOx (x < 2)” [14], to surface oxygen [15], which is favorable to CO oxidation, and from “highly polarized oxide ions at the surface (and the interface) of the nanocrystallites with an unusually low coordination” [16] to surface superoxides (O2) and peroxides (O22−) [17,18]. CO reacts with Cu ions located on the CeO2 surface to form carbonyl-like structures. The surface oxygen from CeO2 is abstracted to oxidize such a complex to CO2. The compensation of this occurs due to the oxygen existing in a gas phase. The reaction goes through a redox Mars–van Krevelen type mechanism [19]. Additionally, CeO2 plays a role of dispersion agent for Cu or CuO [20]. The nanometer-sized Cu/CuO particles have been shown to be the most effective modifiers of the CeO surface. The reason for this is the enlarged interfacial perimeter and a special feature of the sites localized at this perimeter [21]. The Cu/CuO–CeO2 interface is characterized by a high concentration of surface defects, as well as by the formation of solid-solution-like two-dimensional structures of the CuxCe1−xO2−y type [22]. The key role of the Cu/CuO–CeO2 phase boundary in the catalytic activity of copper–ceria compositions prepared by different techniques (the co-precipitation, the hydrothermal method, the template-assisted method, the solid-state preparation method, the sol–gel method, the solvent-free method, etc.) [23,24] has been extensively studied and has been demonstrated in dozens of in-situ/ex-situ experimental works and theoretical studies. It has been recently shown in the example of a CuO/CeO2 catalyst prepared by the deposition of copper oxide on a rod-shaped ceria [25], where interfacial active sites exist in the form of copper clusters on the surface of CeO2. The lower part of these consists of Cu+ bound to CeO2 oxygen vacancies in the form of Cu+–Ov–Ce3+, while the upper part consists of Cu0 coordinated with lower copper Cu+ ions. Additionally, the presence of CeOx has been found to promote the reactivity of Cu in CO-PROX, suggesting that the high CO2 selectivity relates to Cu+ sites on the Cu/CeO2 interface [10,26,27]. However, the structure of the stable active sites for CO-PROX reaction, and especially the chemical state of copper, the most important component of an active site (Cu+ or Cu2+), are still under discussion, as are the means by which to directly identify the active sites. The copper–ceria interface has been presumed responsible for the catalytic performance.
Our previous investigations were focused on the application of Cu/CuO–CeO2 compositions prepared by zero-waste mechanochemical synthesis as the catalysts for CO-PROX reaction [28,29,30]. The ball collisions in a ball-mill reactor lead to high local pressure accompanied by shear deformations and overheating in the as-milled powder. As a result, dispersion of copper in the ceria matrix is accompanied by (1) Cu introduction in the CeO2 surface followed by the formation of oxygen vacancies, (2) the partial oxidation of Cu0 to Cu+ (and partially to Cu2+) states by CeO2 oxygen, and (3) appearance of specially reactive oxygen species. All of these parameters are known to be driving forces for the development of the catalytic properties of Cu/CuO-CeO2 systems [9,12,13,14,15]. The newly discovered properties were found to be responsible for the catalytic activity of the copper–ceria composite in CO-PROX. The catalytic and physical–chemical properties of the synthesized catalysts were comparable with those prepared by the wet-impregnation method. In the process of selecting the optimal conditions of mechanochemical synthesis, it was found that catalytic activity at first increased, as Cu dispersion in CeO2 increased, but reduced after prolonged processing because of the blocking of the CeO2 surface by the Cu and/or CuO “layers”. Thus, it was shown that the local (on a microscopic scale) interaction between Cu dopant and CeO2 matrix played a key role in an active surface of the catalyst formation despite the macroscopic parameters of the components involved in the catalyst preparation. Based on this study, it was suggested that the use of nano-sized Cu powder can significantly ease and accelerate the process of Cu–CeO2 catalyst preparation while also protecting the CeO2 surface from blocking by “harmful” Cu “layers”.
The aim of this work was to clarify the relationship between the dispersion of Cu metal powder used as dopant to CeO2 in the mechanochemical synthesis of the Cu–CeO2 catalyst for CO-PROX, and the structural, physical–chemical and catalytic properties of the obtained materials. In particular, the aim of the research was to determine the effect of the original copper particle size on (1) the architecture of the “active” surface, (2) the surface’s composition, (3) the concentration of “active oxygen”, (4) the redox properties of composites, and, as a result, (5) the catalytic activity in the CO-PROX reaction. In this context, we studied two model Cu–CeO2 catalysts prepared from CeO2 and Cu metal powders that differed in size (~0.6 μm and 50–200 nm, respectively) and morphology (dendrite-like and spherical, respectively). The morphology of the samples (scanning electron microscopy (SEM)); the phase composition at different stages of processing (X-ray diffraction (XRD)); the fine structure of the crystals, their local phase composition and their chemical element distribution (high-resolution transmission electron microscopy (HRTEM)); their electron diffraction (energy dispersive X-ray analysis (EDX) and mapping); their surface composition (X-ray photoelectron spectroscopy (XPS)); and their redox properties towards H2 and CO temperature-programmed reduction (H2- and CO–TPR)) were studied in detail. Fourier IR spectroscopy was used to study the interaction of CO with the catalysts’ surface under conditions corresponding with CO–TPR. The catalytic properties were compared in the selective oxidation of CO in an excess of H2 (CO-PROX).

2. Results and Discussion

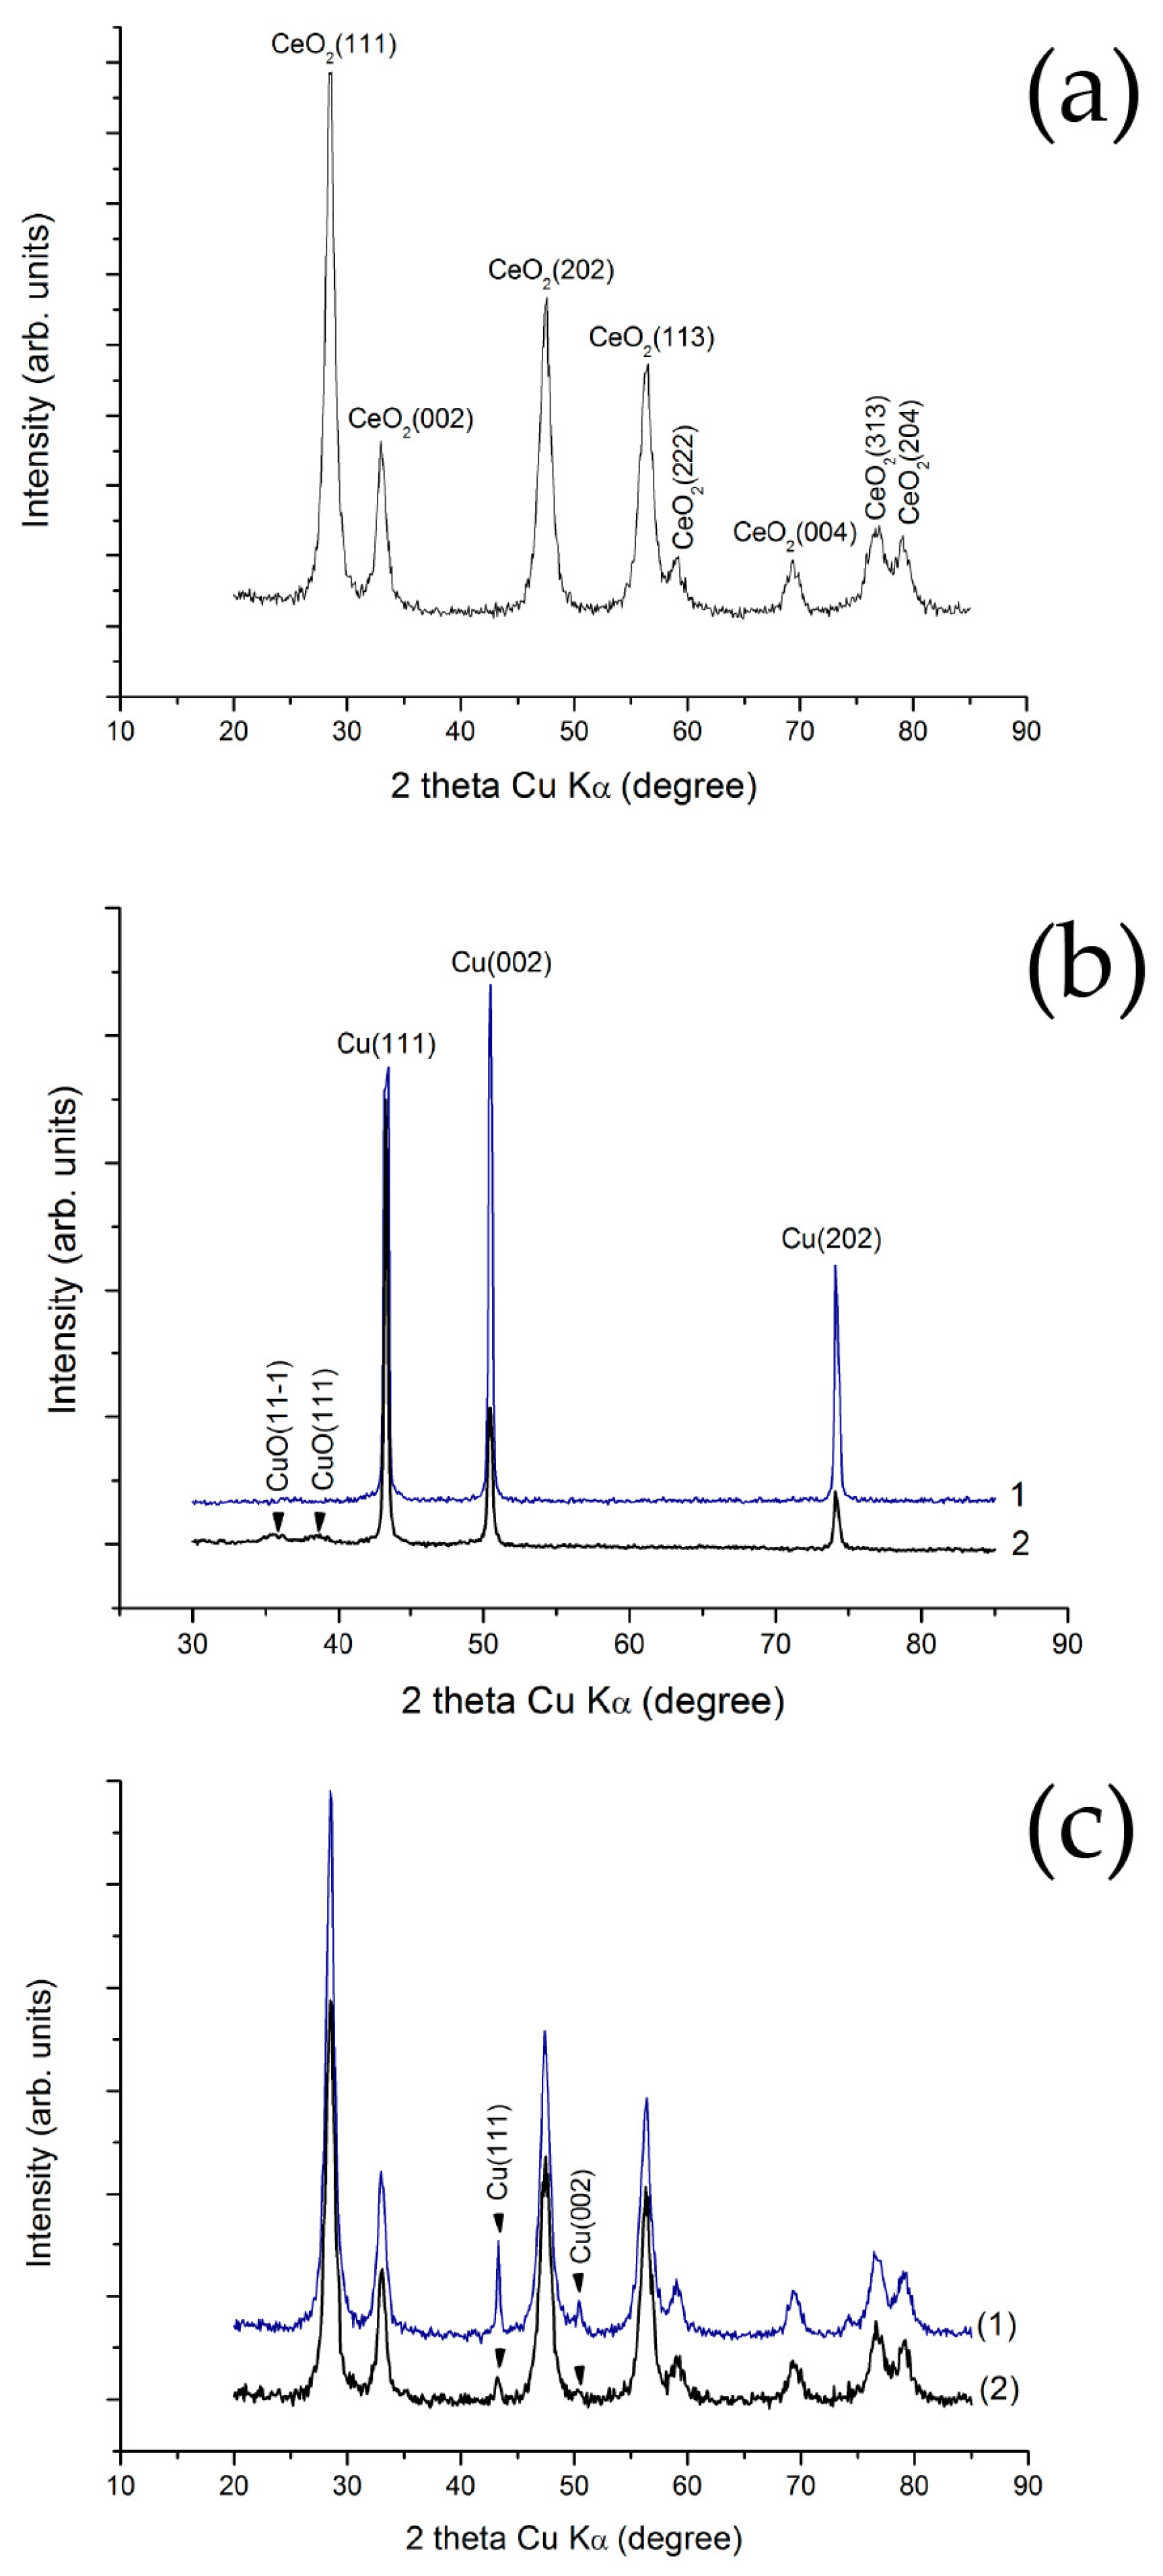
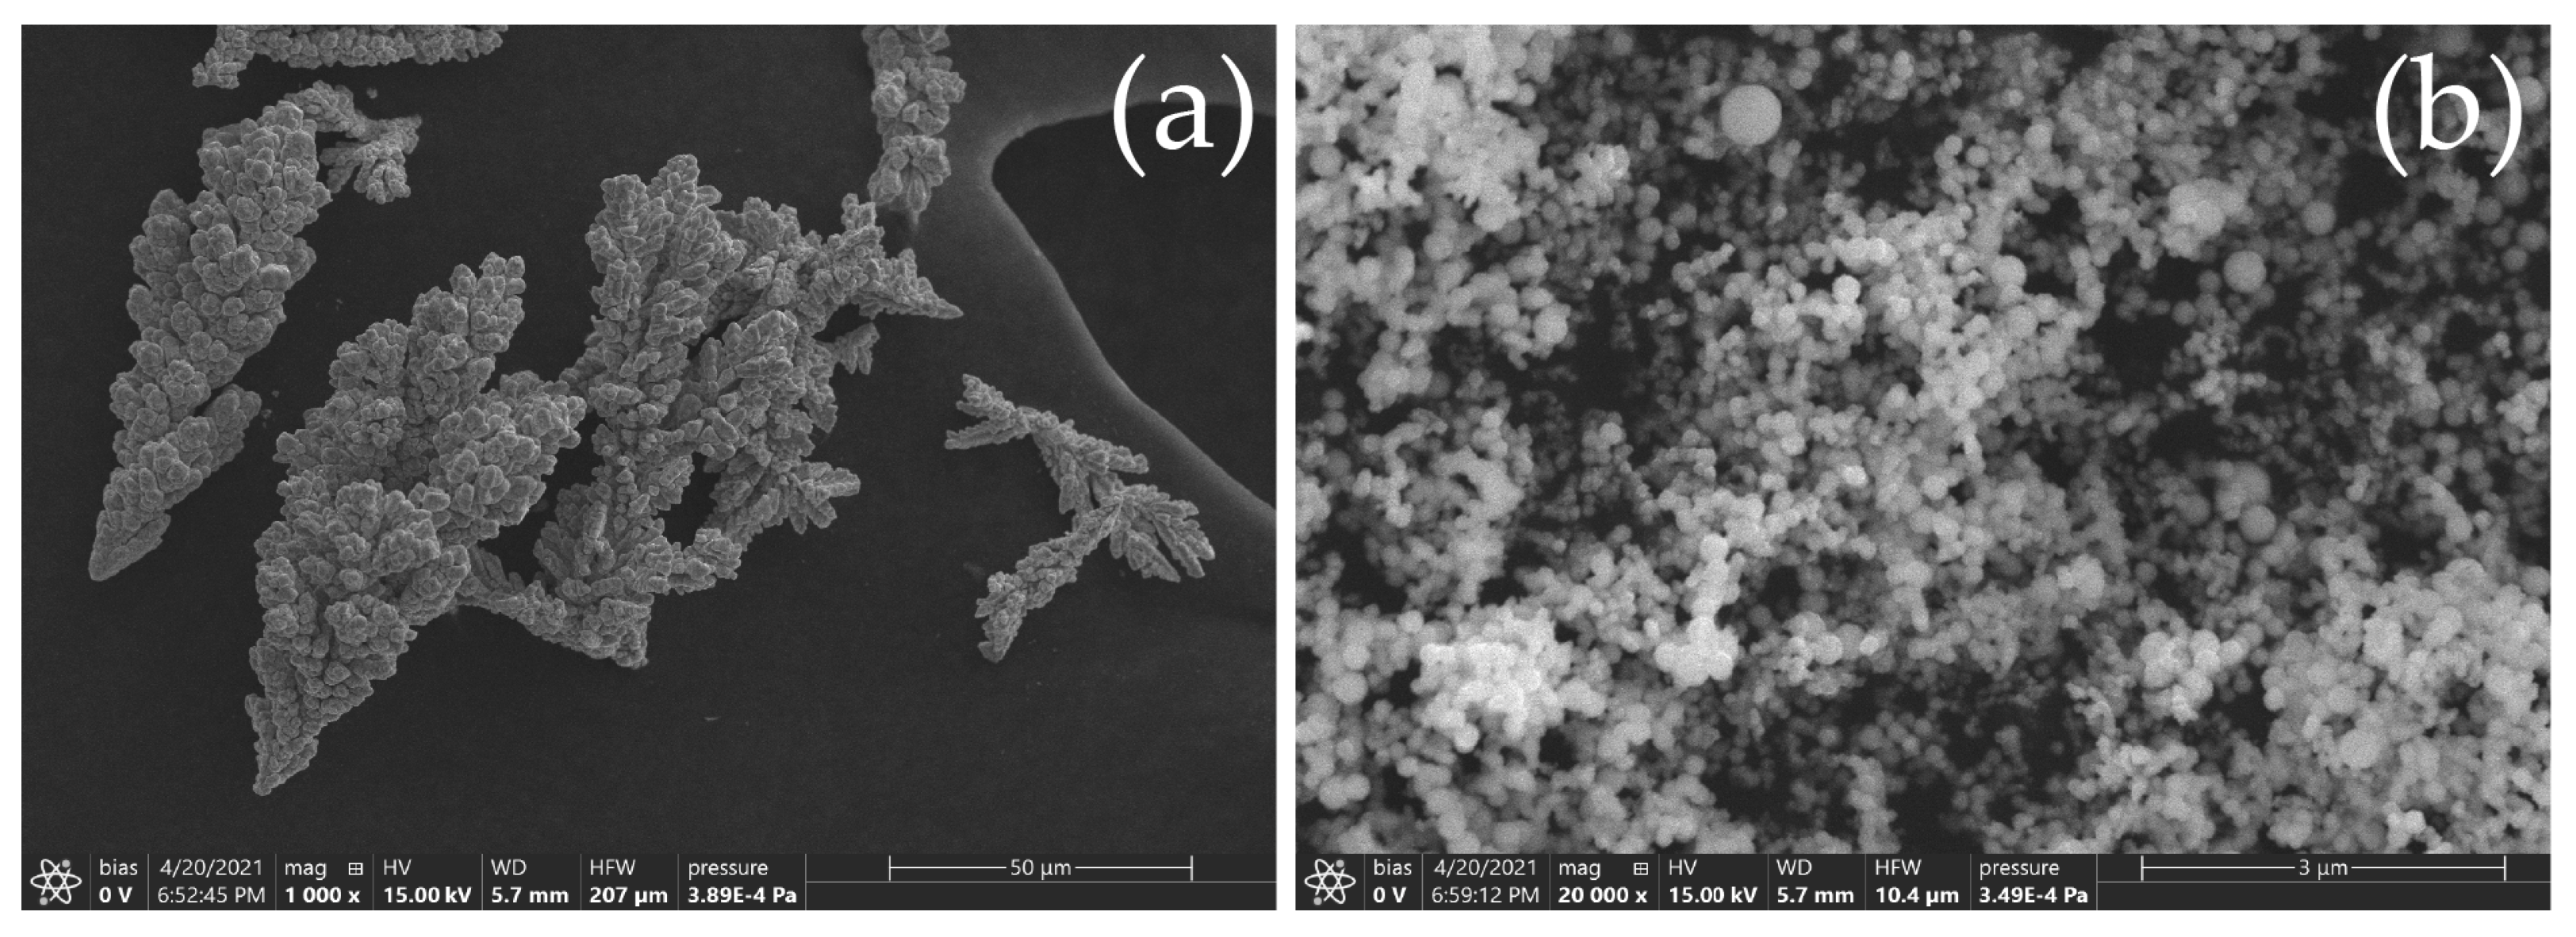
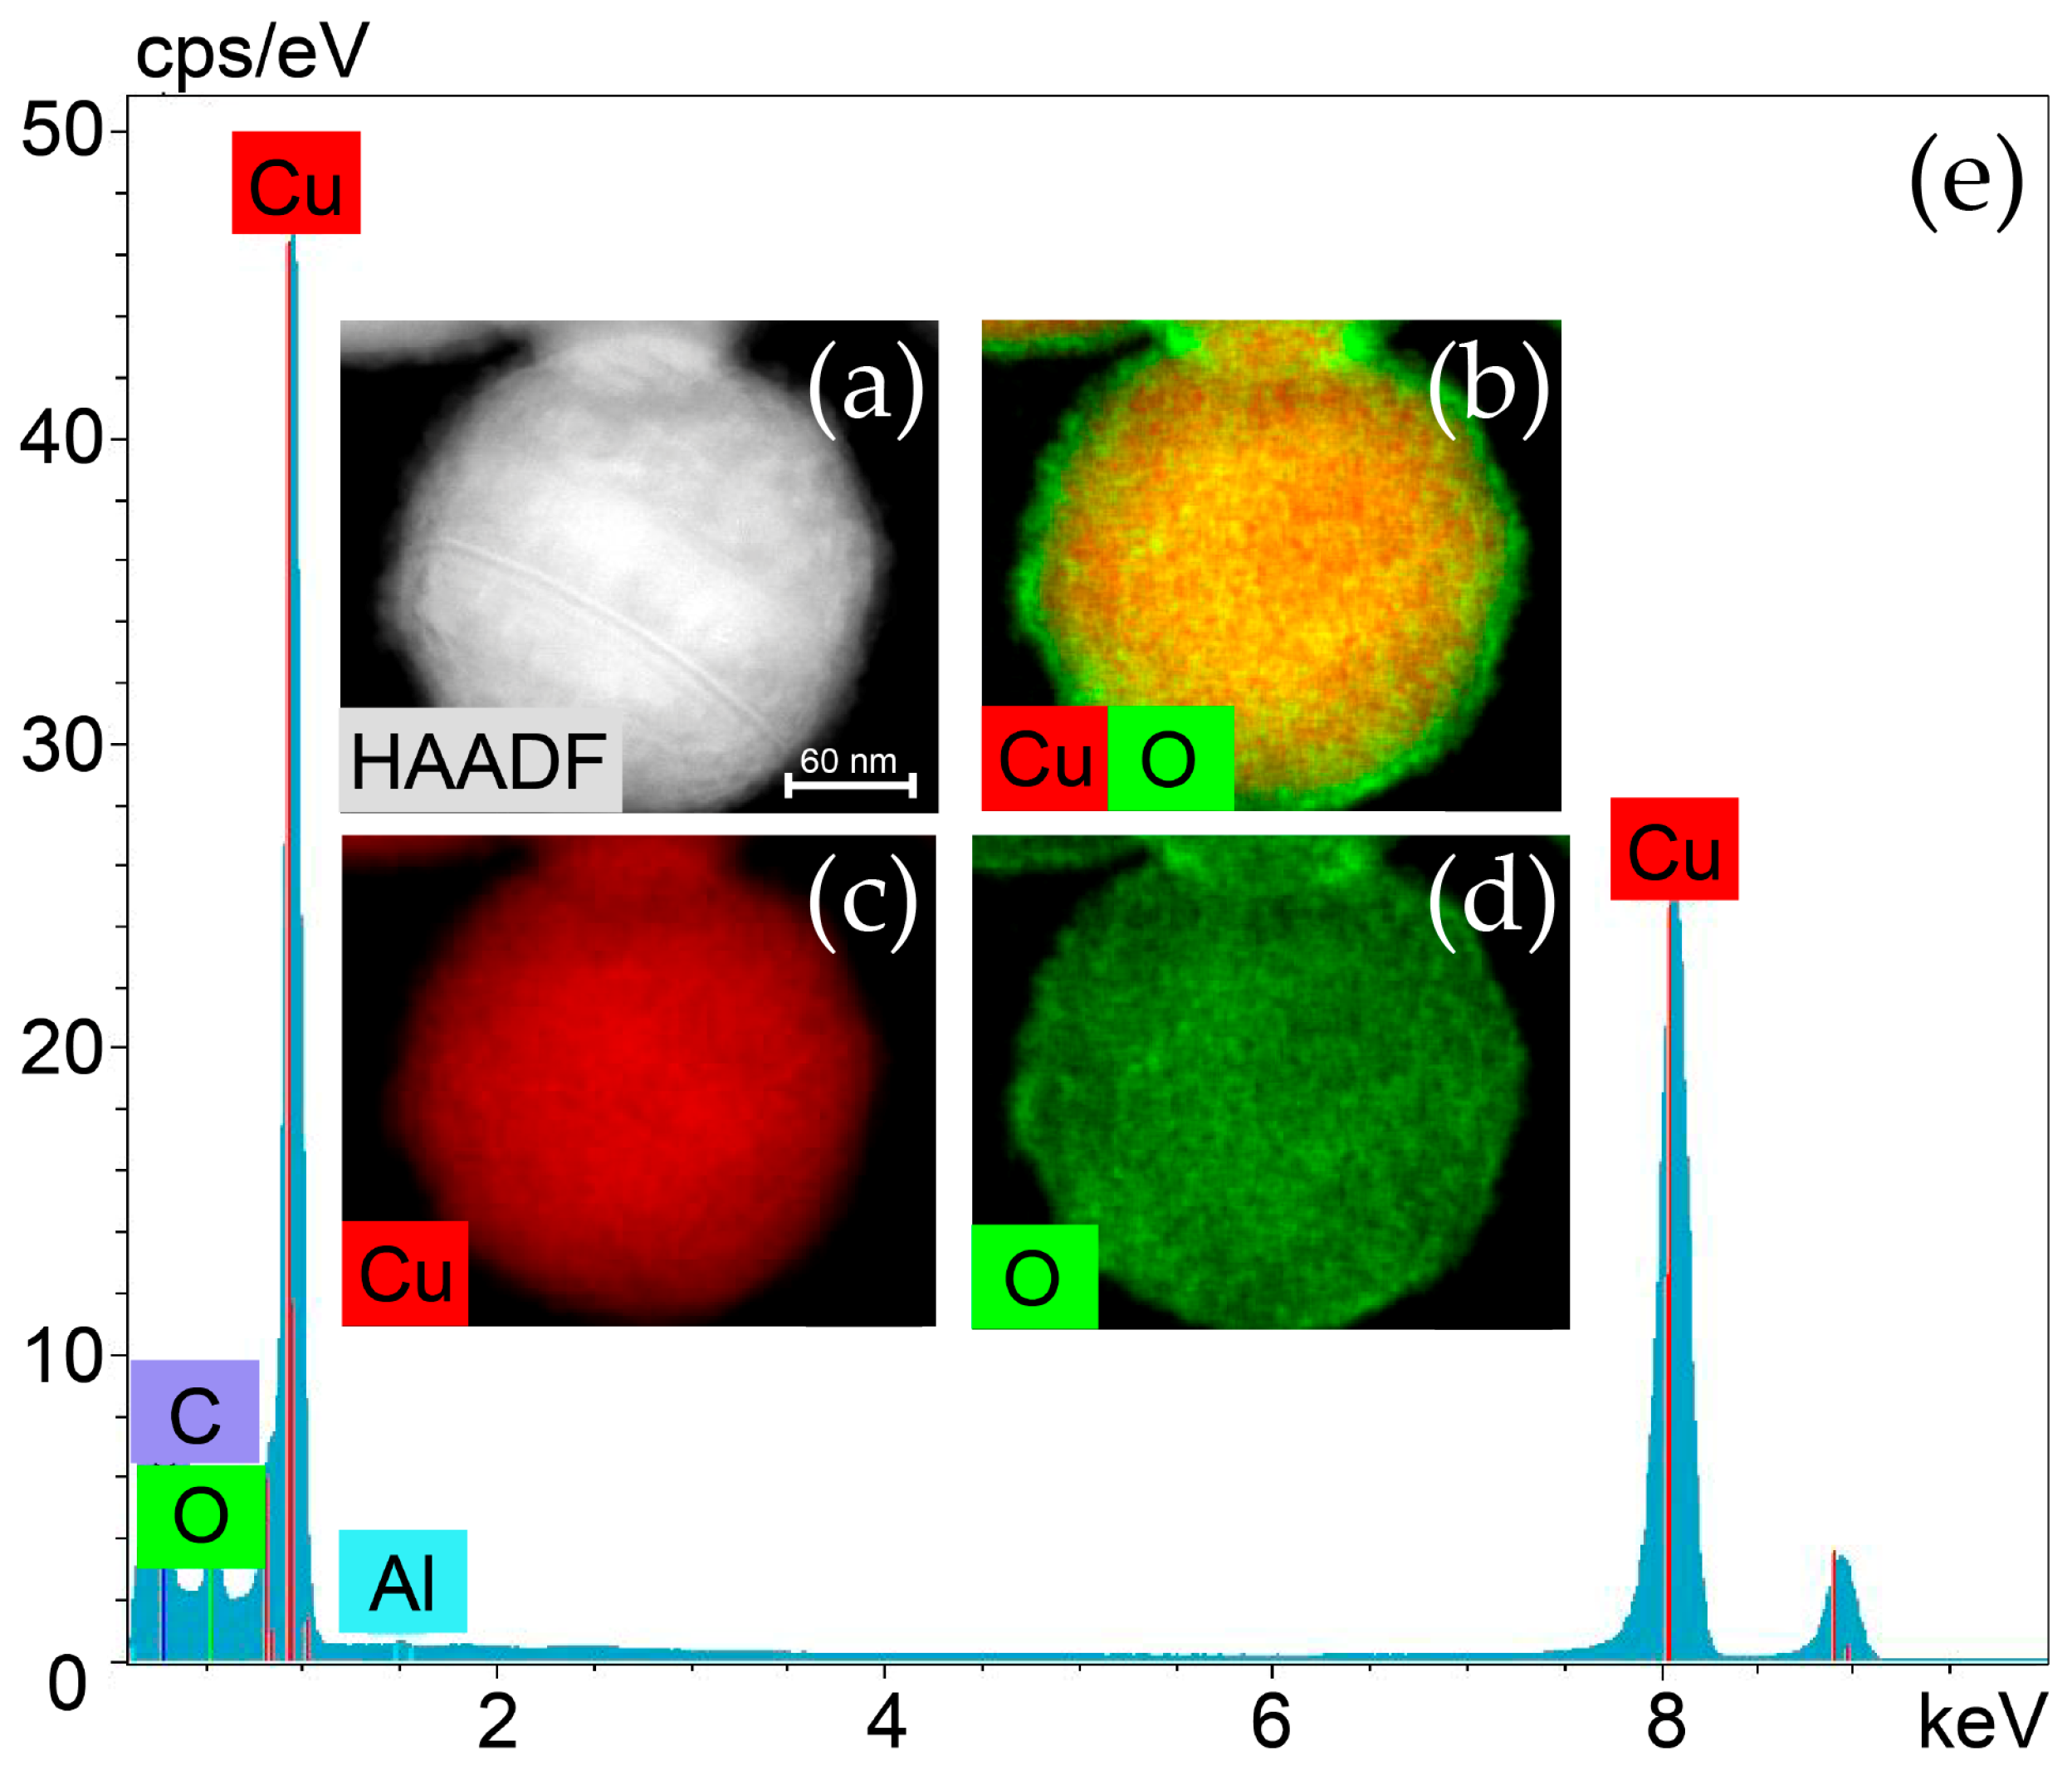
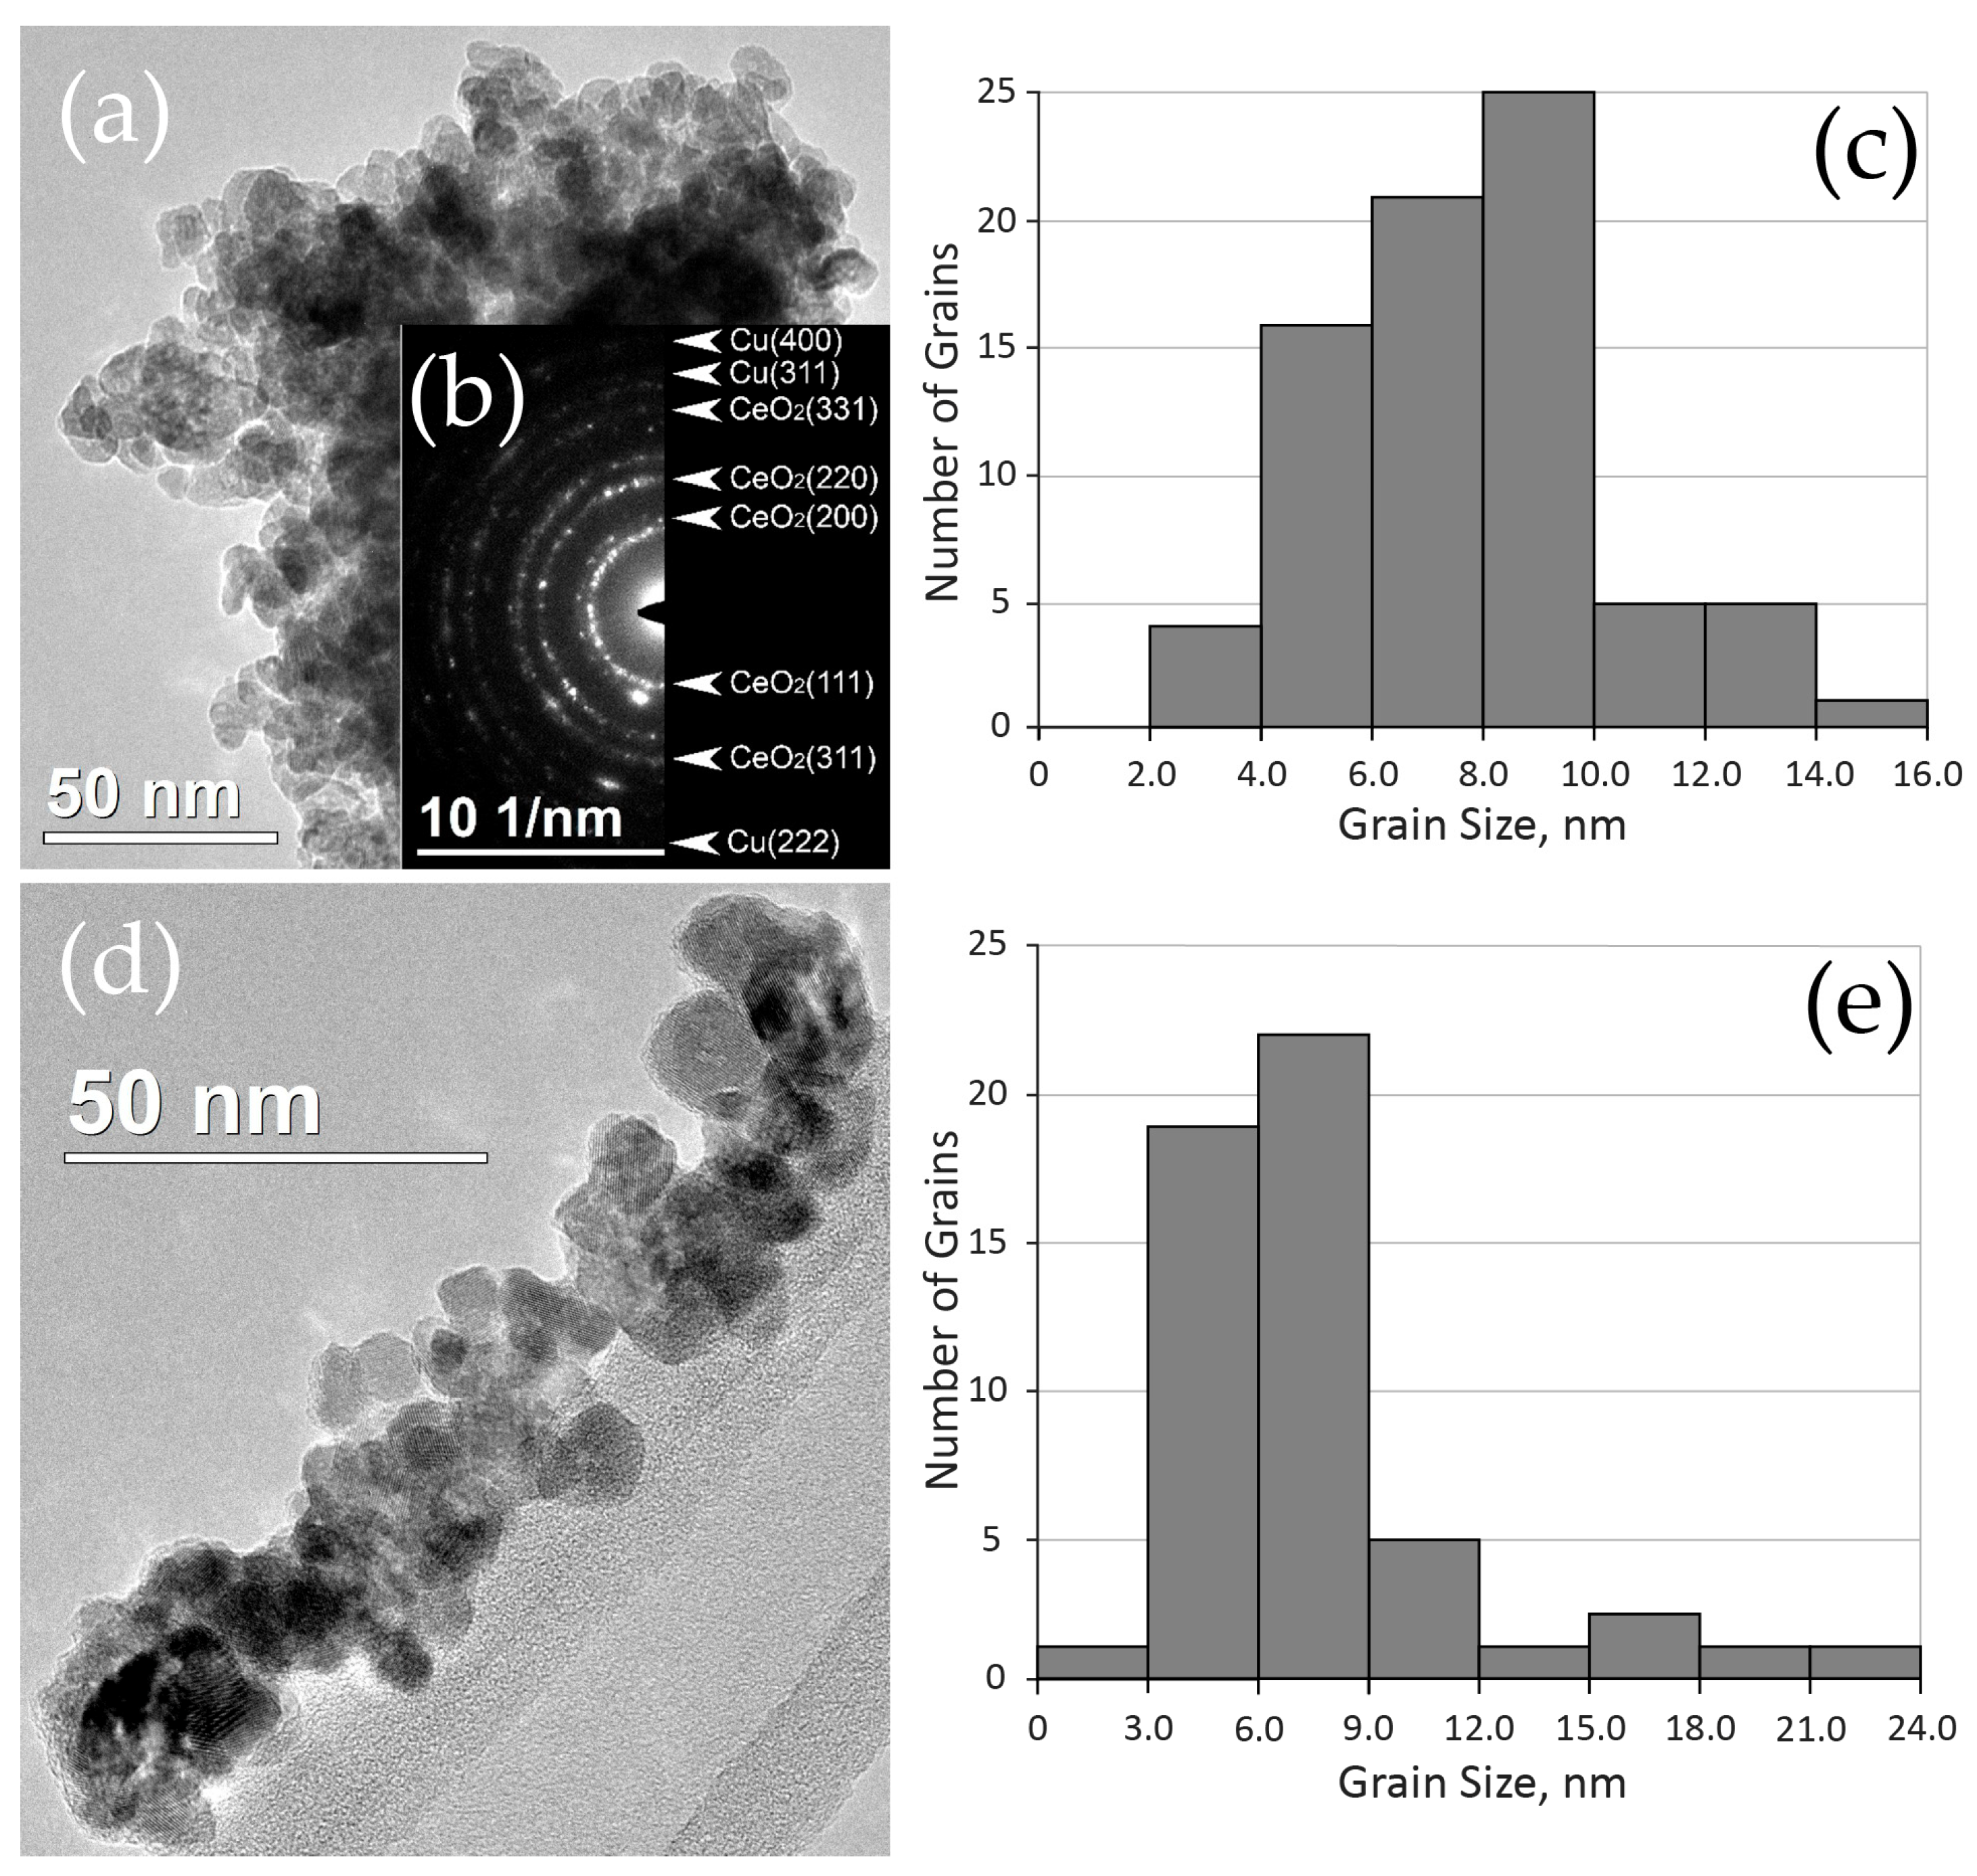
2.1. Structure and Morphology of Initial Materials

The initial CeO2 powder consisted of particles of an arbitrary shape and size. According to TEM data (Figure 1), some of these were rather large (1–2 μm) single crystals, but the major part was polycrystalline particles consisting of sticky small crystallites, 30–40 nm in diameter, as can be seen from the dark field (DF) TEM image and corresponding selected area electron diffraction (SAED) patterns. In the EDX spectrum, one can see peaks corresponding with cerium and oxygen. The carbon and copper peaks are presented due to the application of the powder onto the copper grids with an amorphous carbon substrate. Thus, no impurities were found in the initial powder under the study.
According to XRD measurements (Figure 2a), CeO2 has a fluorite-type FCC structure (Fm3m) with a lattice constant a = 0. 5411 nm (JCPDS 89-8436), the average crystalline size was evaluated as 11 nm.
Figure 3 shows SEM images of initial copper metal powders. The Cu dendrite powder (Cu(D)) consisted of agglomerated flat metal particles (~0.6 μm long and 0.14 μm thick). According to XRD, the average crystalline size was 80 nm. The Cu(002)/Cu(111) ratio equal to 1.18 instead of the standard value of 0.46 indicates the texturing of particles in accordance with the dendrite morphology observed by SEM (Figure 3a). Cu metal powder prepared by the levitation-jet method consisted of round particles of 100–200 nm in size, most of which were agglomerated in chains, which is typical for the powder method used to obtain it (Figure 3b). According to XRD, the average crystalline size was ~25 nm. CuO traces (2ϴ = 35.58° and ~38.7° for CuO( 1 ¯ 11 ) and CuO(111), respectively) were also detected (Figure 2b).
TEM studies have also confirmed that Cu(L) particles were joined in chains. In addition to large particles (100–200 nm), there was also a fine fraction less than 50 nm in size. Figure 4a shows TEM images of a typical single particle. It can be seen that, as the measured interplanar spacings reveal, this consists of a single crystal Cu core (Figure 4b) and a polycrystalline CuO shell (Figure 4c). An oxide shell consisting of nanocrystals less than 10 nm in size holds the particles together. The size distribution histogram of copper particles (Figure 4d) was constructed only for the particles with copper nuclei.
EDX-analysis of the element distribution over the particle volume confirmed our assumption about the copper oxide layer located on the particle surface (Figure 5).

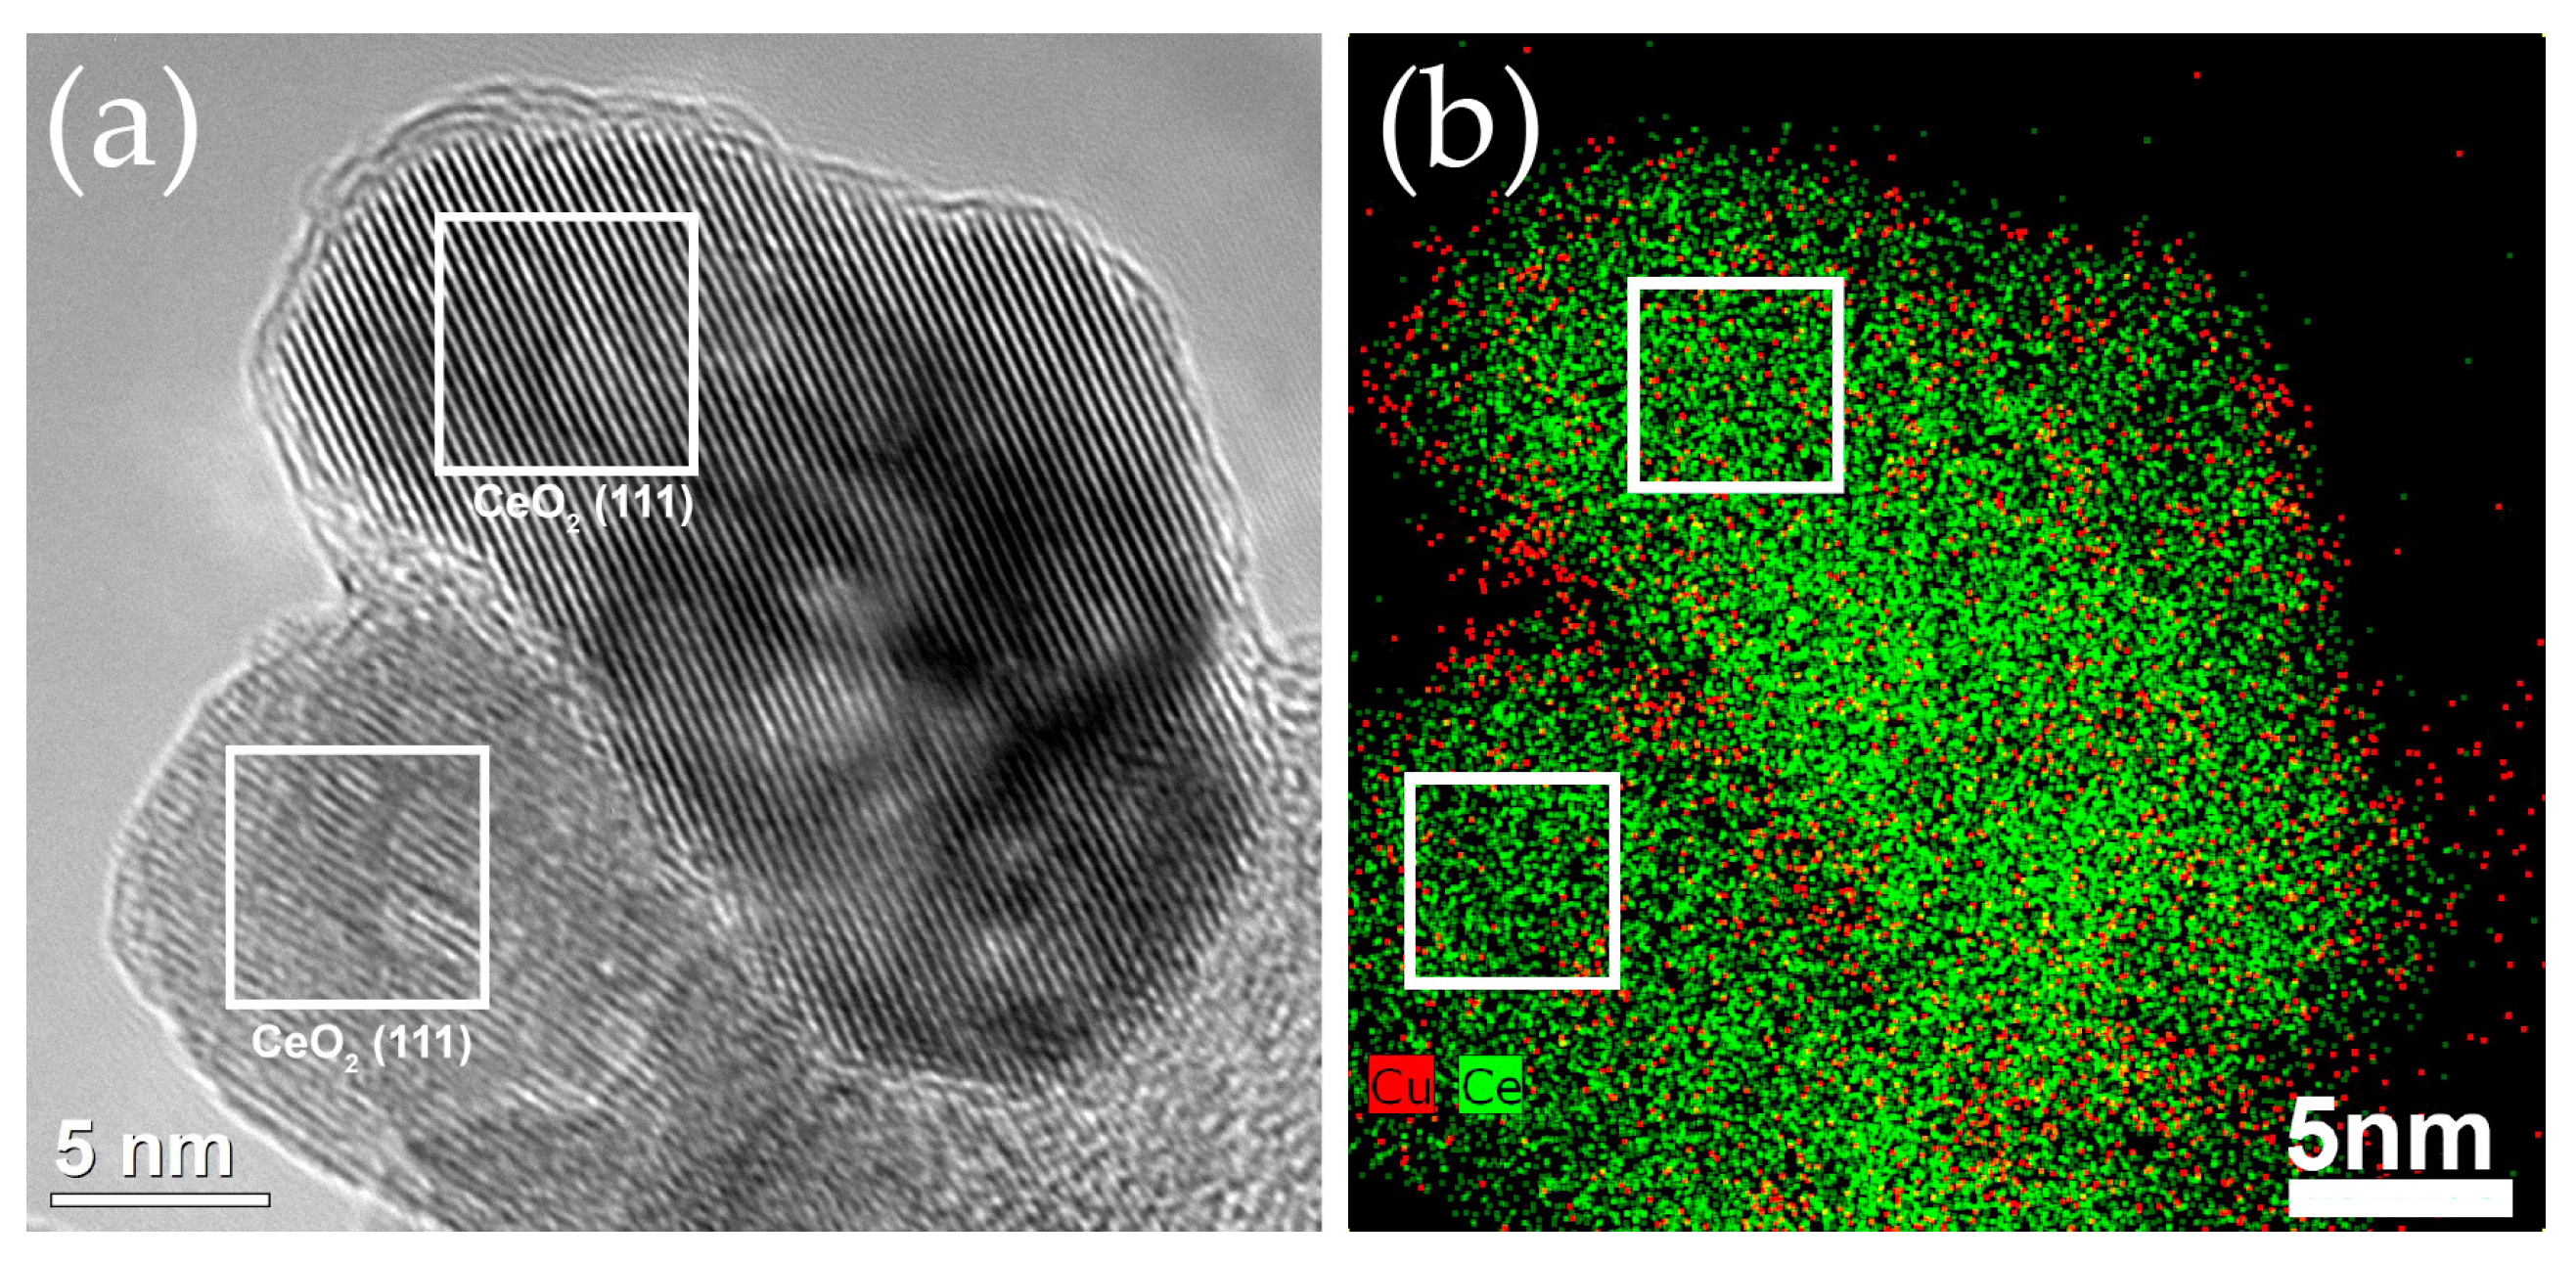
2.2. Structure and Morphology of Composite Materials

2.2.1. Distribution of Cu Supported on CeO2

Only two phases—CeO2 and metallic Cu—were detected in XRD patterns of as-milled Cu–CeO2 powders (Figure 2c). The intensity of Cu(111) and Cu(200) peaks (43.2° and 50.4°, respectively) is significantly lower for Cu(L)–CeO2, in spite of the same content of Cu additive in CeO2: 8 mass% in the original powders before milling and 7.89 mass% in as-milled powders, according to AAS analysis. Quantitative calculations of XRD data gave 7.3 mass% and 1.6 mass% Cu for Cu(D)–CeO2 and Cu(L)–CeO2, respectively. Thus, it is reasonable to suggest that a part of Cu can’t be detected by XRD because of the amorphous state. This part was found to be 10–12% for Cu(D)–CeO2 and ~80% for Cu(L)–CeO2. As for the as-milled Cu(D)–CeO2, the Cu(200)/Cu(111) ratio became equal to the standard 0.47 value, indicating the crushing of the large Cu textured particles under the milling. The obtained small particles had no texture and their average crystallite size decreased from ~80 to ~40 nm. Structural parameters (obtained by XRD) and the specific surface area of original and mechanically activated powders are presented in Table 1.
The effect of the mechanical treatment on the morphology of the original CeO2 and special features of the morphology of Cu–CeO2 composites were studied in detail by TEM and STEM with the use of electron diffraction and EDX element mapping.

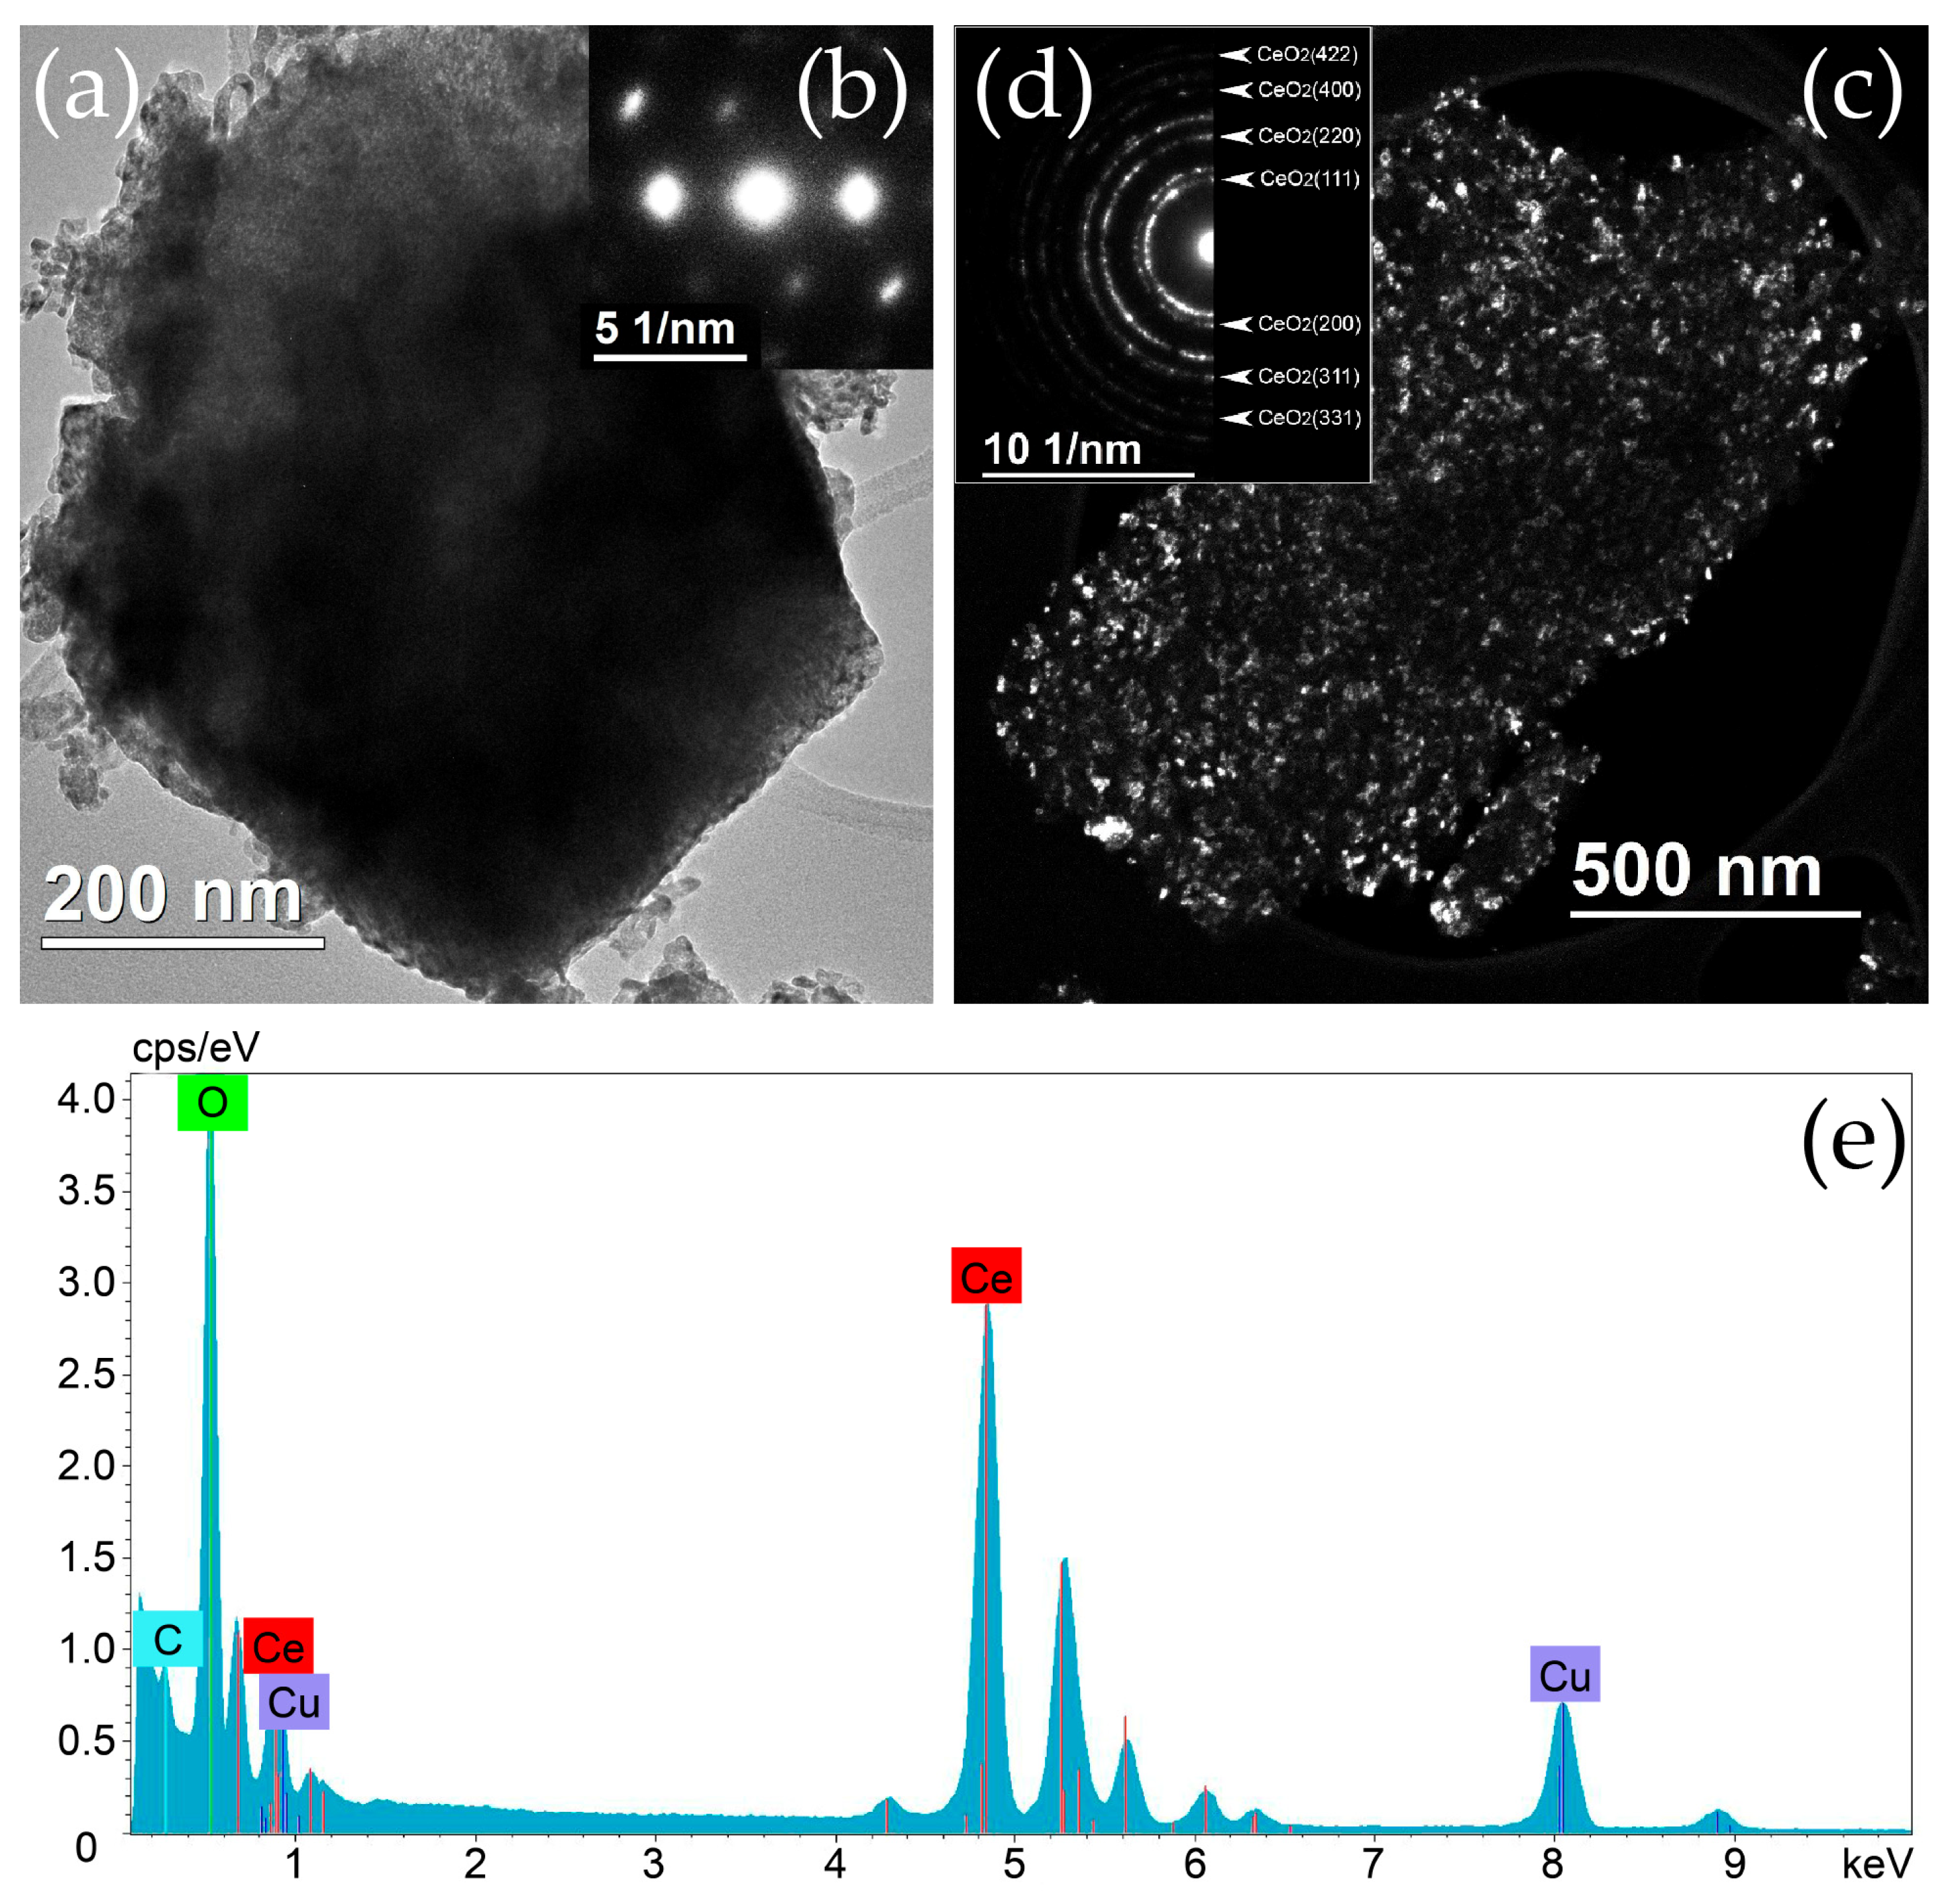
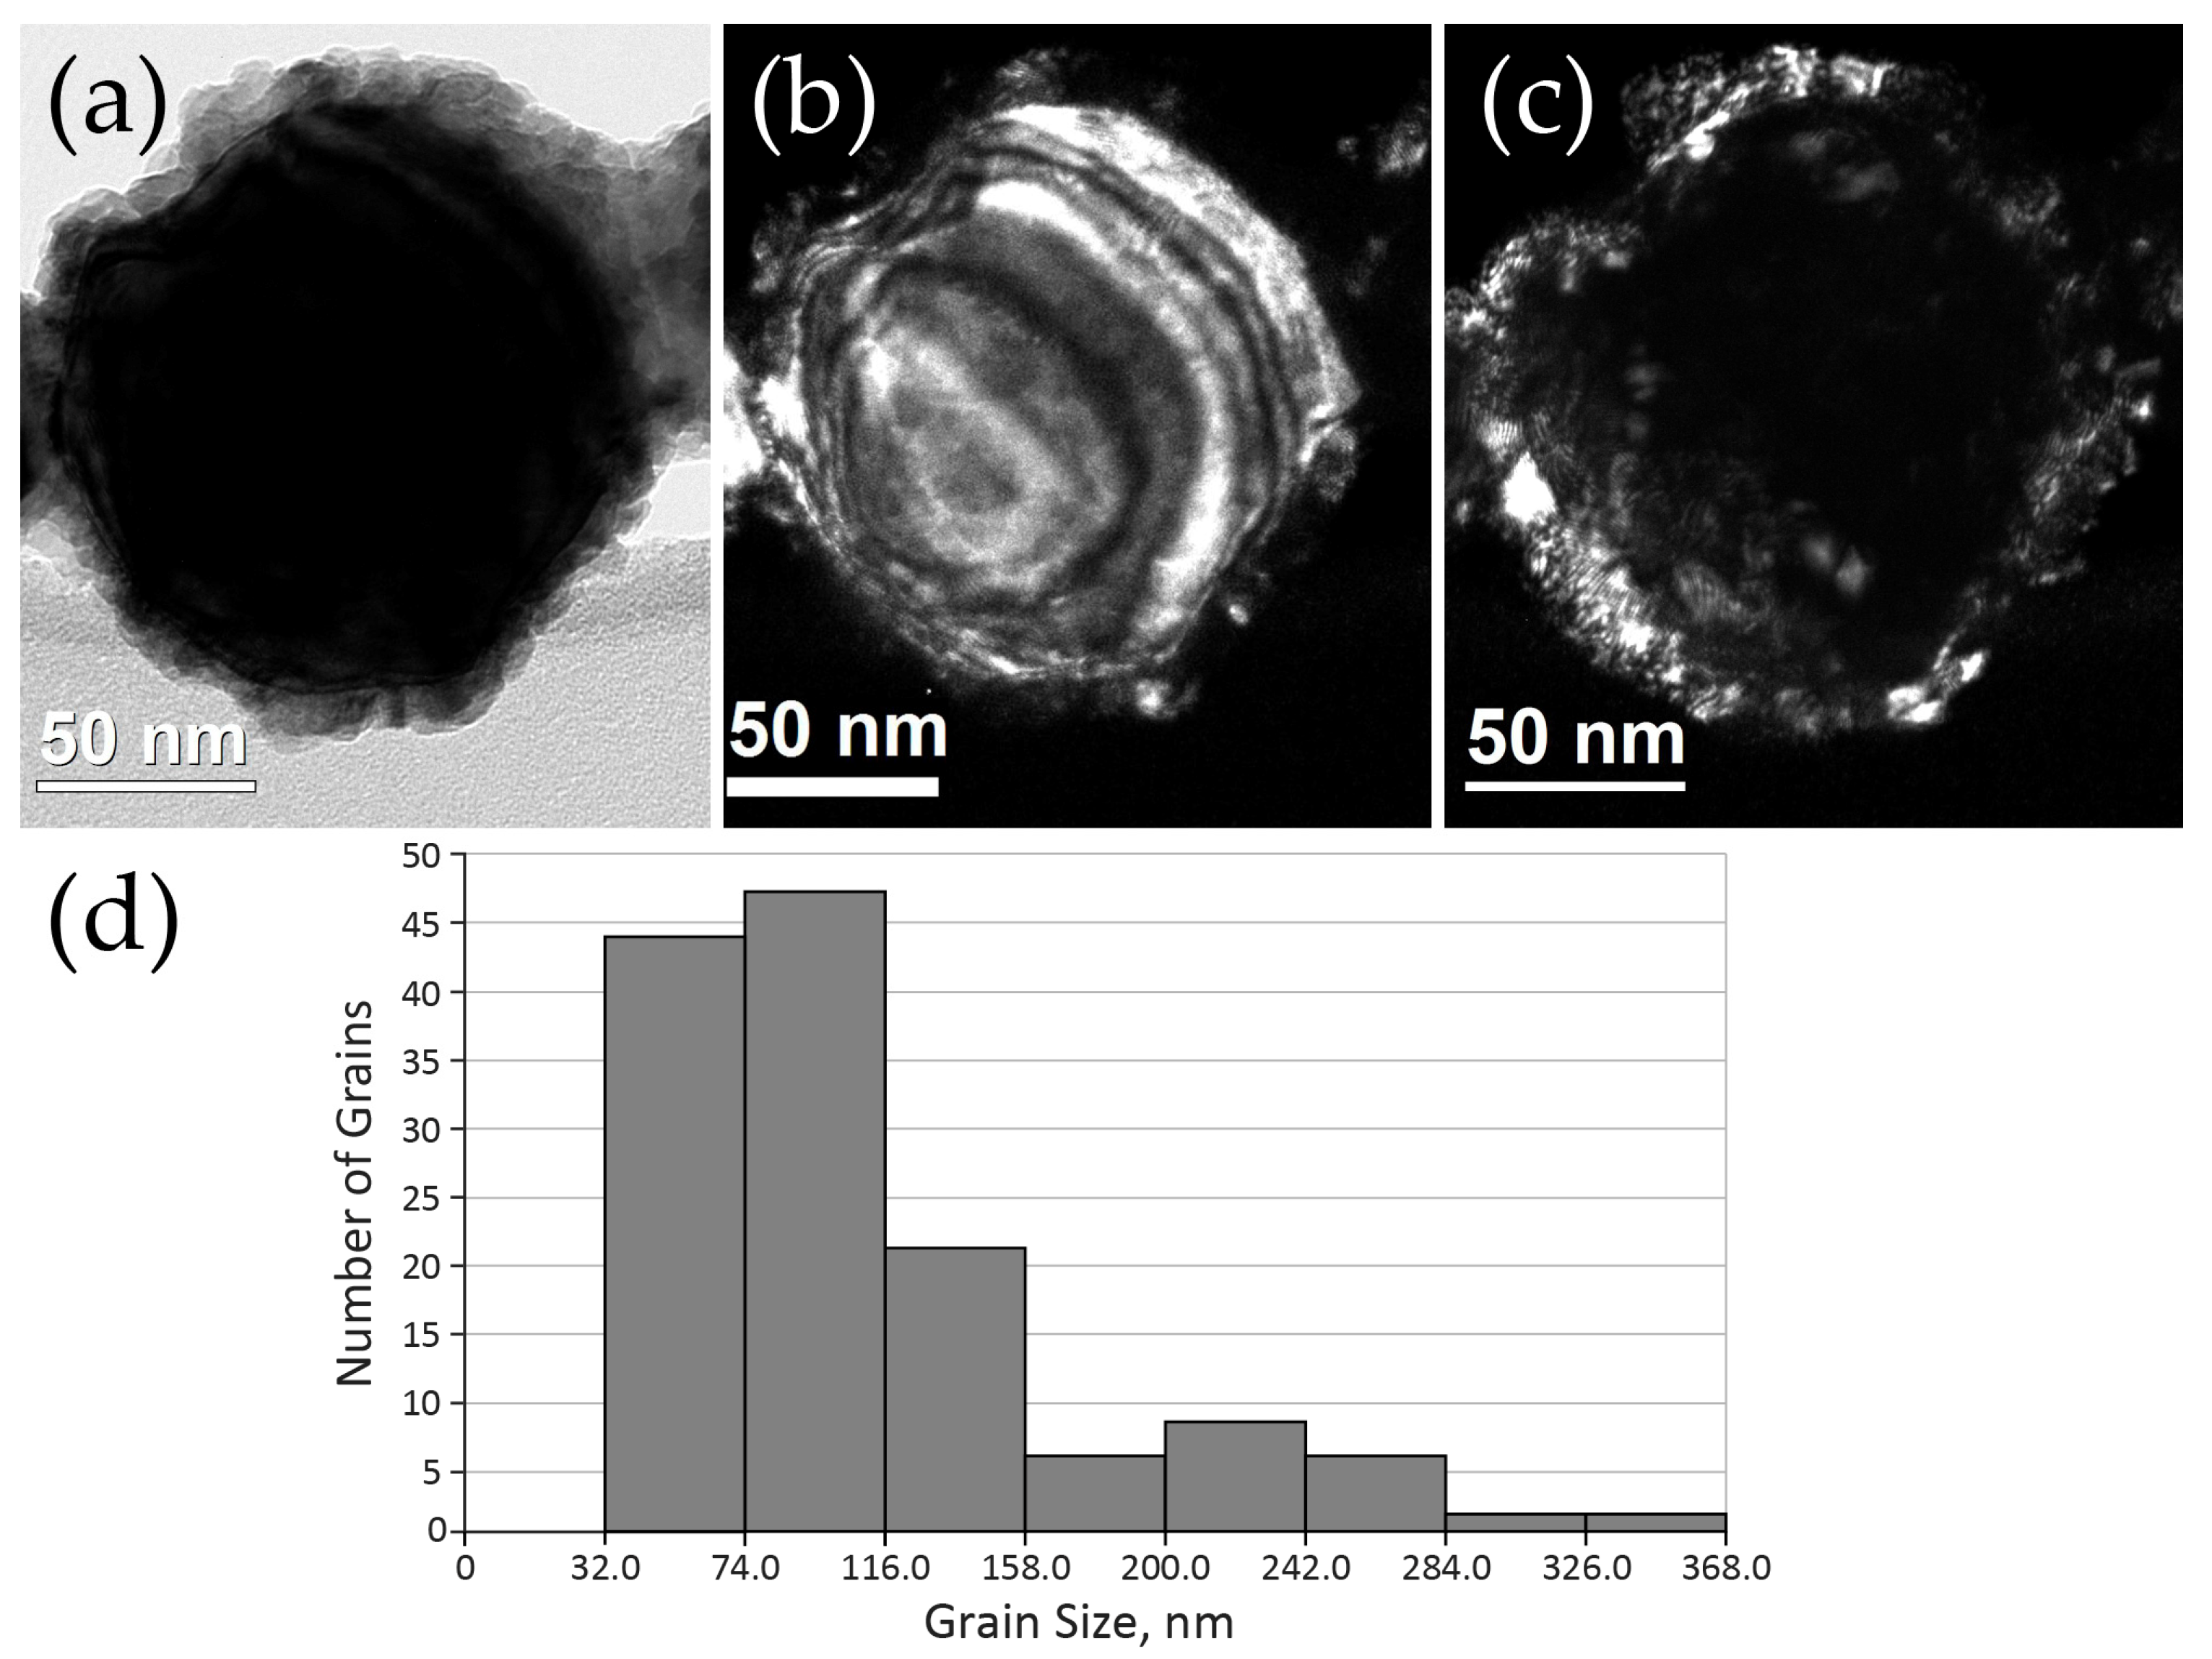
2.2.2. Cerium Oxide Powders after Grinding for 30 min

Figure 6 shows a general view and the corresponding particle size distribution histogram plotted for CeO2 powder obtained by grinding in a ball mill for 30 min. In contrast with the initial powder, the particles do not form large conglomerates but form an arbitrary shape and a large contact area with their sizes ranging from 2 nm to 22 nm. As shown by the HREM images, a characteristic feature of their fine structure is the presence of steps of monatomic height (Figure 6b, indicated by black arrows), which is a consequence of breaking during grinding in a ball mill. The calculation of diffraction patterns (Figure 6e) revealed interplanar distances that correspond well with the single phase of cerium oxide with an FCC lattice (Fm3m), consistent with the X-ray data.
EDX spectra also contain peaks corresponding only to cerium and oxygen. Thus, no impurities were found in the powder under study after the grinding. Distribution maps of the chemical elements—oxygen and cerium—show that these elements are localized equally and evenly.

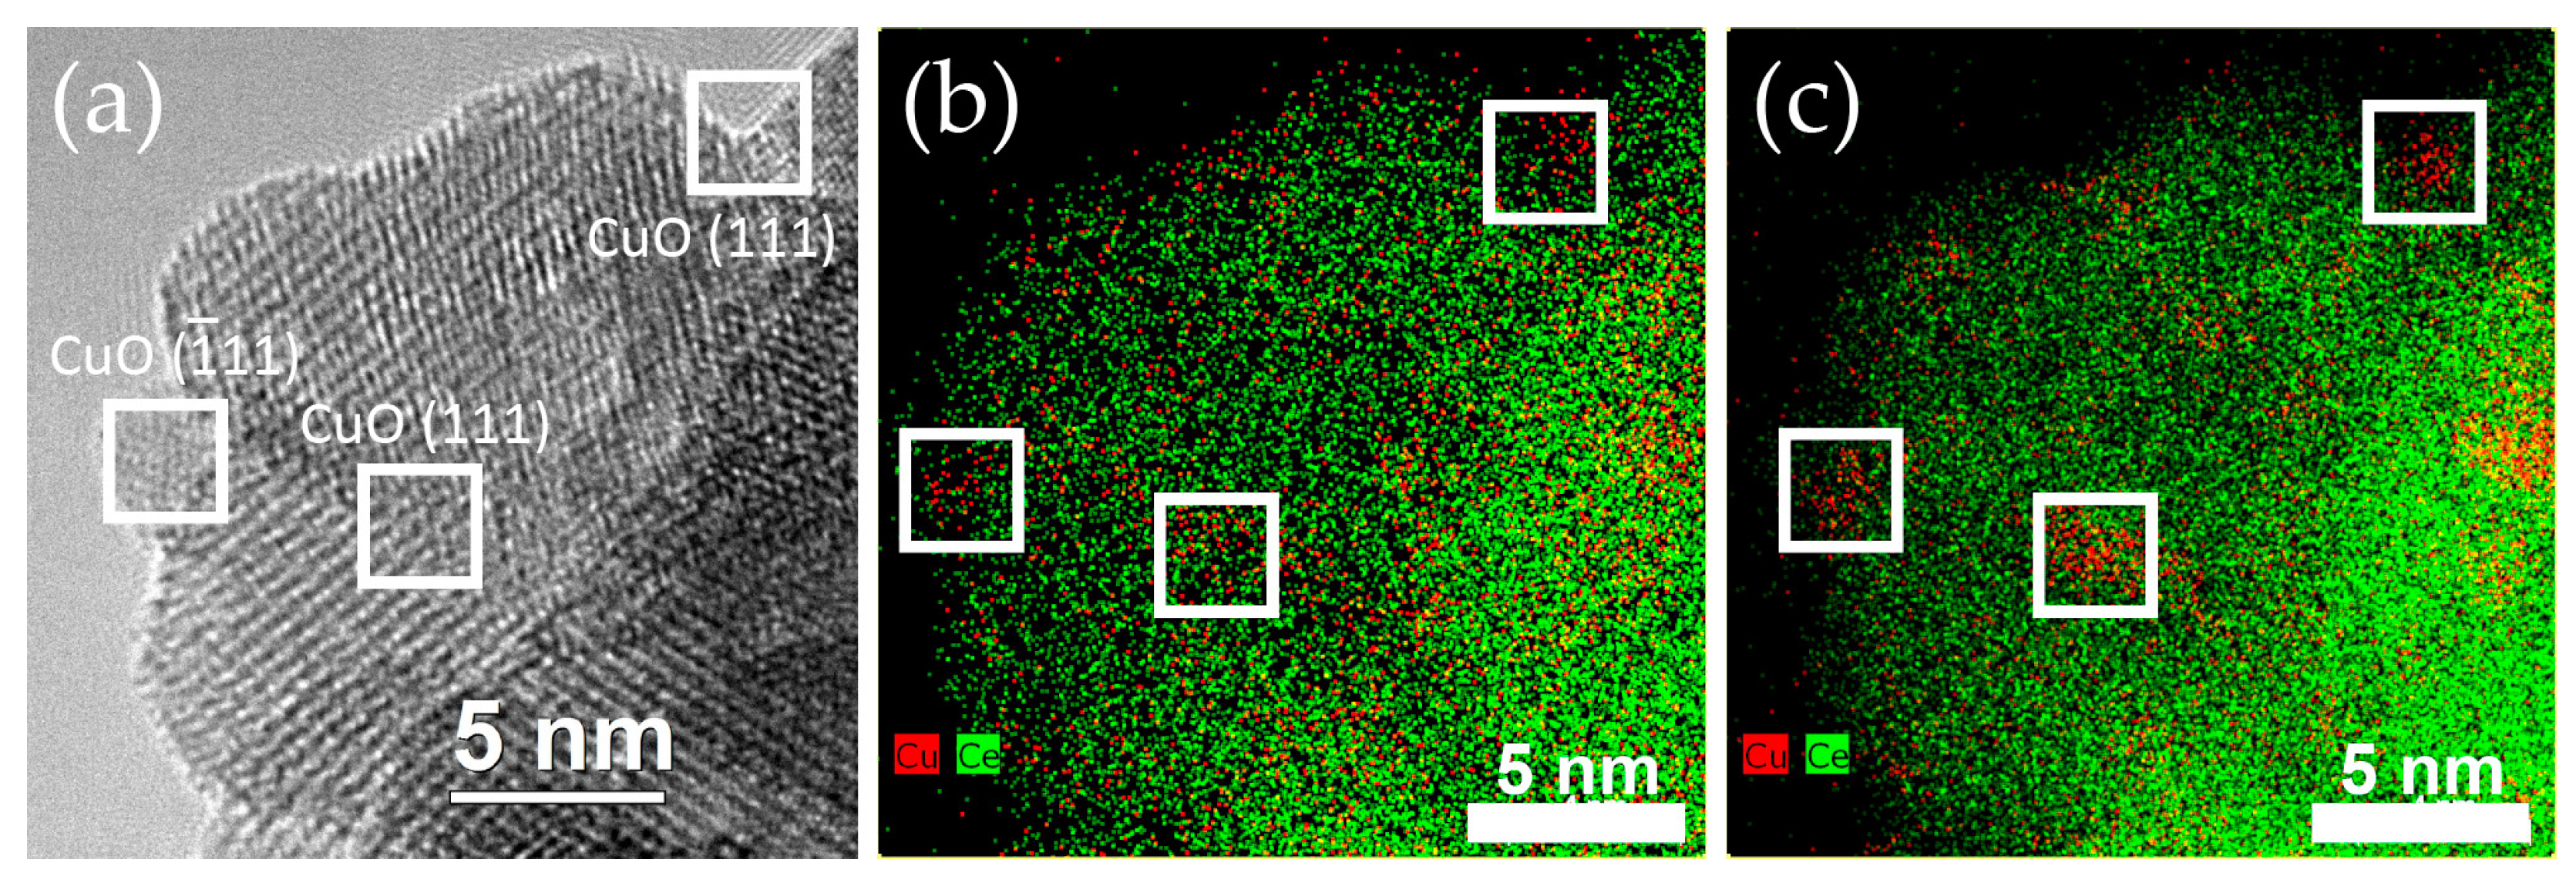
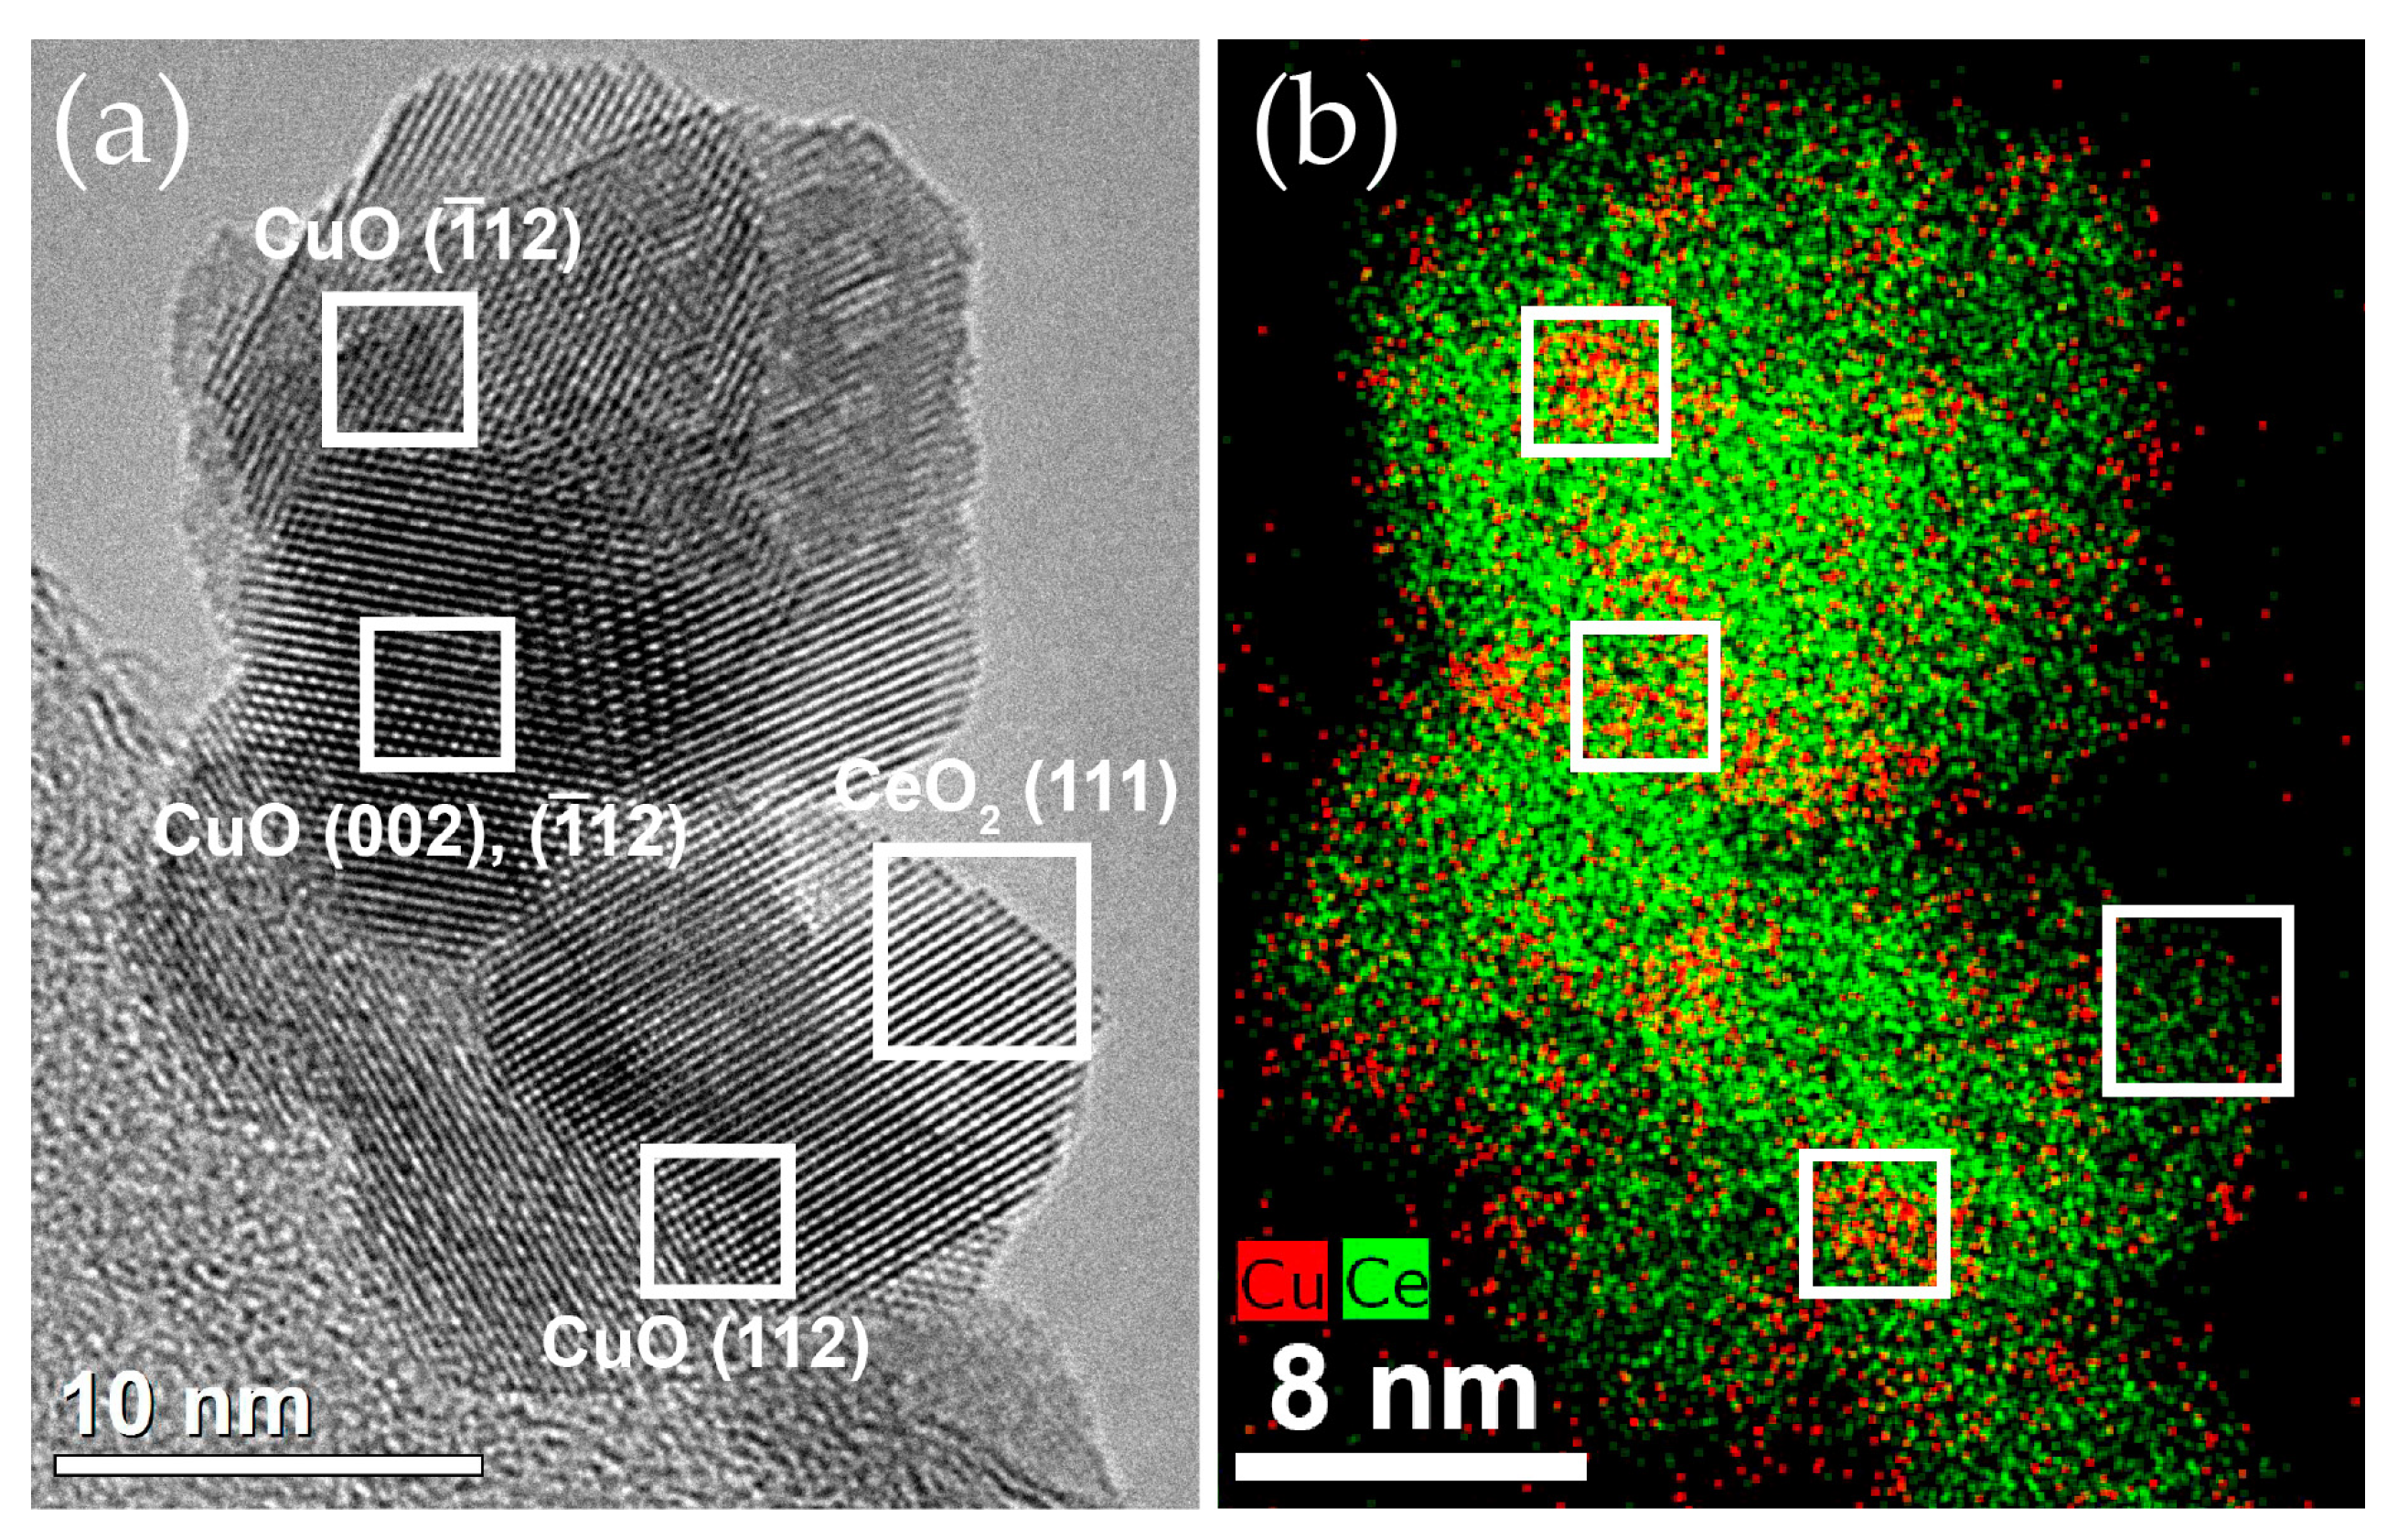
2.2.3. Structure of Cu–CeO2 Composites

As can be seen from Figure 7, Cu(L)–CeO2 composite particles of up to 20 nm form conglomerates of about a tenth of a micron in size. In general, the particles have an arbitrary shape, in some cases acutely angled, which is a consequence of grinding in a ball mill. The sizes, morphology of the particles, the presence of monoatomic steps and terraces all testify to the similarity with the structure of the particles of the initial cerium oxide powder. The phase composition, which was deciphered from microelectron diffraction patterns (Figure 7b), partially differs from the initial powder. In addition to the CeO2 phase, one can see very weak rings corresponding with the (311) and (400) copper interplanar spacings.
To eliminate the influence of the copper grid material on the results of the EDX analysis, additional composite samples were deposited on nickel grids with a carbon holey substrate. To visualize particles or clusters of copper, the obtained HREM images were compared with the corresponding mapping of copper and cerium (Figure 8). It was found that the distribution of chemical elements of copper and cerium changes under electron beam irradiation. In the initial state, and up to an irradiation time of 1 min, the distribution of copper on cerium oxide is quite uniform (Figure 8a,b). After 10–15 min of irradiation with an electron beam, Cu/CuO regions of 4–6 nm in size with the predominant planes (111) and ( 1 ¯ 11 ) become clearly visible in copper–cerium maps, regions which are indicated by white squares in the corresponding HREM images and element maps (Figure 8). Such a reorganization of the copper structures under the irradiation happens due to the lack of stability of separated atoms on a ceria surface. When heated with an electron beam, copper atoms gain enough energy to migrate and form more stable structures (clusters or nanoparticles). It can be noted that, in Cu(L)–CeO2 composites, an excess of copper is usually formed at the edges and in the intercrystallite spaces of CeO2. Fourier diffractograms show reflections with interplanar distances dhkl = 2.32 Å and 2.31 Å, which correspond with the (111) and (200) CuO planes, respectively (Figure 9).
A similar experiment, wherein the sample was heated with an electron beam in the electron microscope column, was carried out with composites obtained from powders of electrolytic copper Cu(D)–CeO2. In this case, a different behavior of the material was observed, in which a fairly uniform copper edging appeared around the cerium oxide particles after heating for 10–15 min (Figure 10). These places are also marked with white squares in the corresponding HREM images. An analysis of the Fourier diffractograms in those places where an excess of copper atoms was formed also revealed reflections corresponding with CuO interplanar distances dhkl = 2.31 Å and 2.32 Å, as mentioned above.
Thus, in the course of experiments in which the sample was heated with an electron beam in a column of the electron microscope, it was shown that the use of electrolytic copper in the composition of the catalyst led Cu (CuxO) atoms to be arranged uniformly in a thin layer on the surface areas of cerium oxide nanocrystals. In contrast, Cu (CuxO) atoms are more likely to arrange in clusters when copper is obtained by the levitation-jet method. This indicates a less stable state (less bound) of copper atoms located on the CeO2 surface.

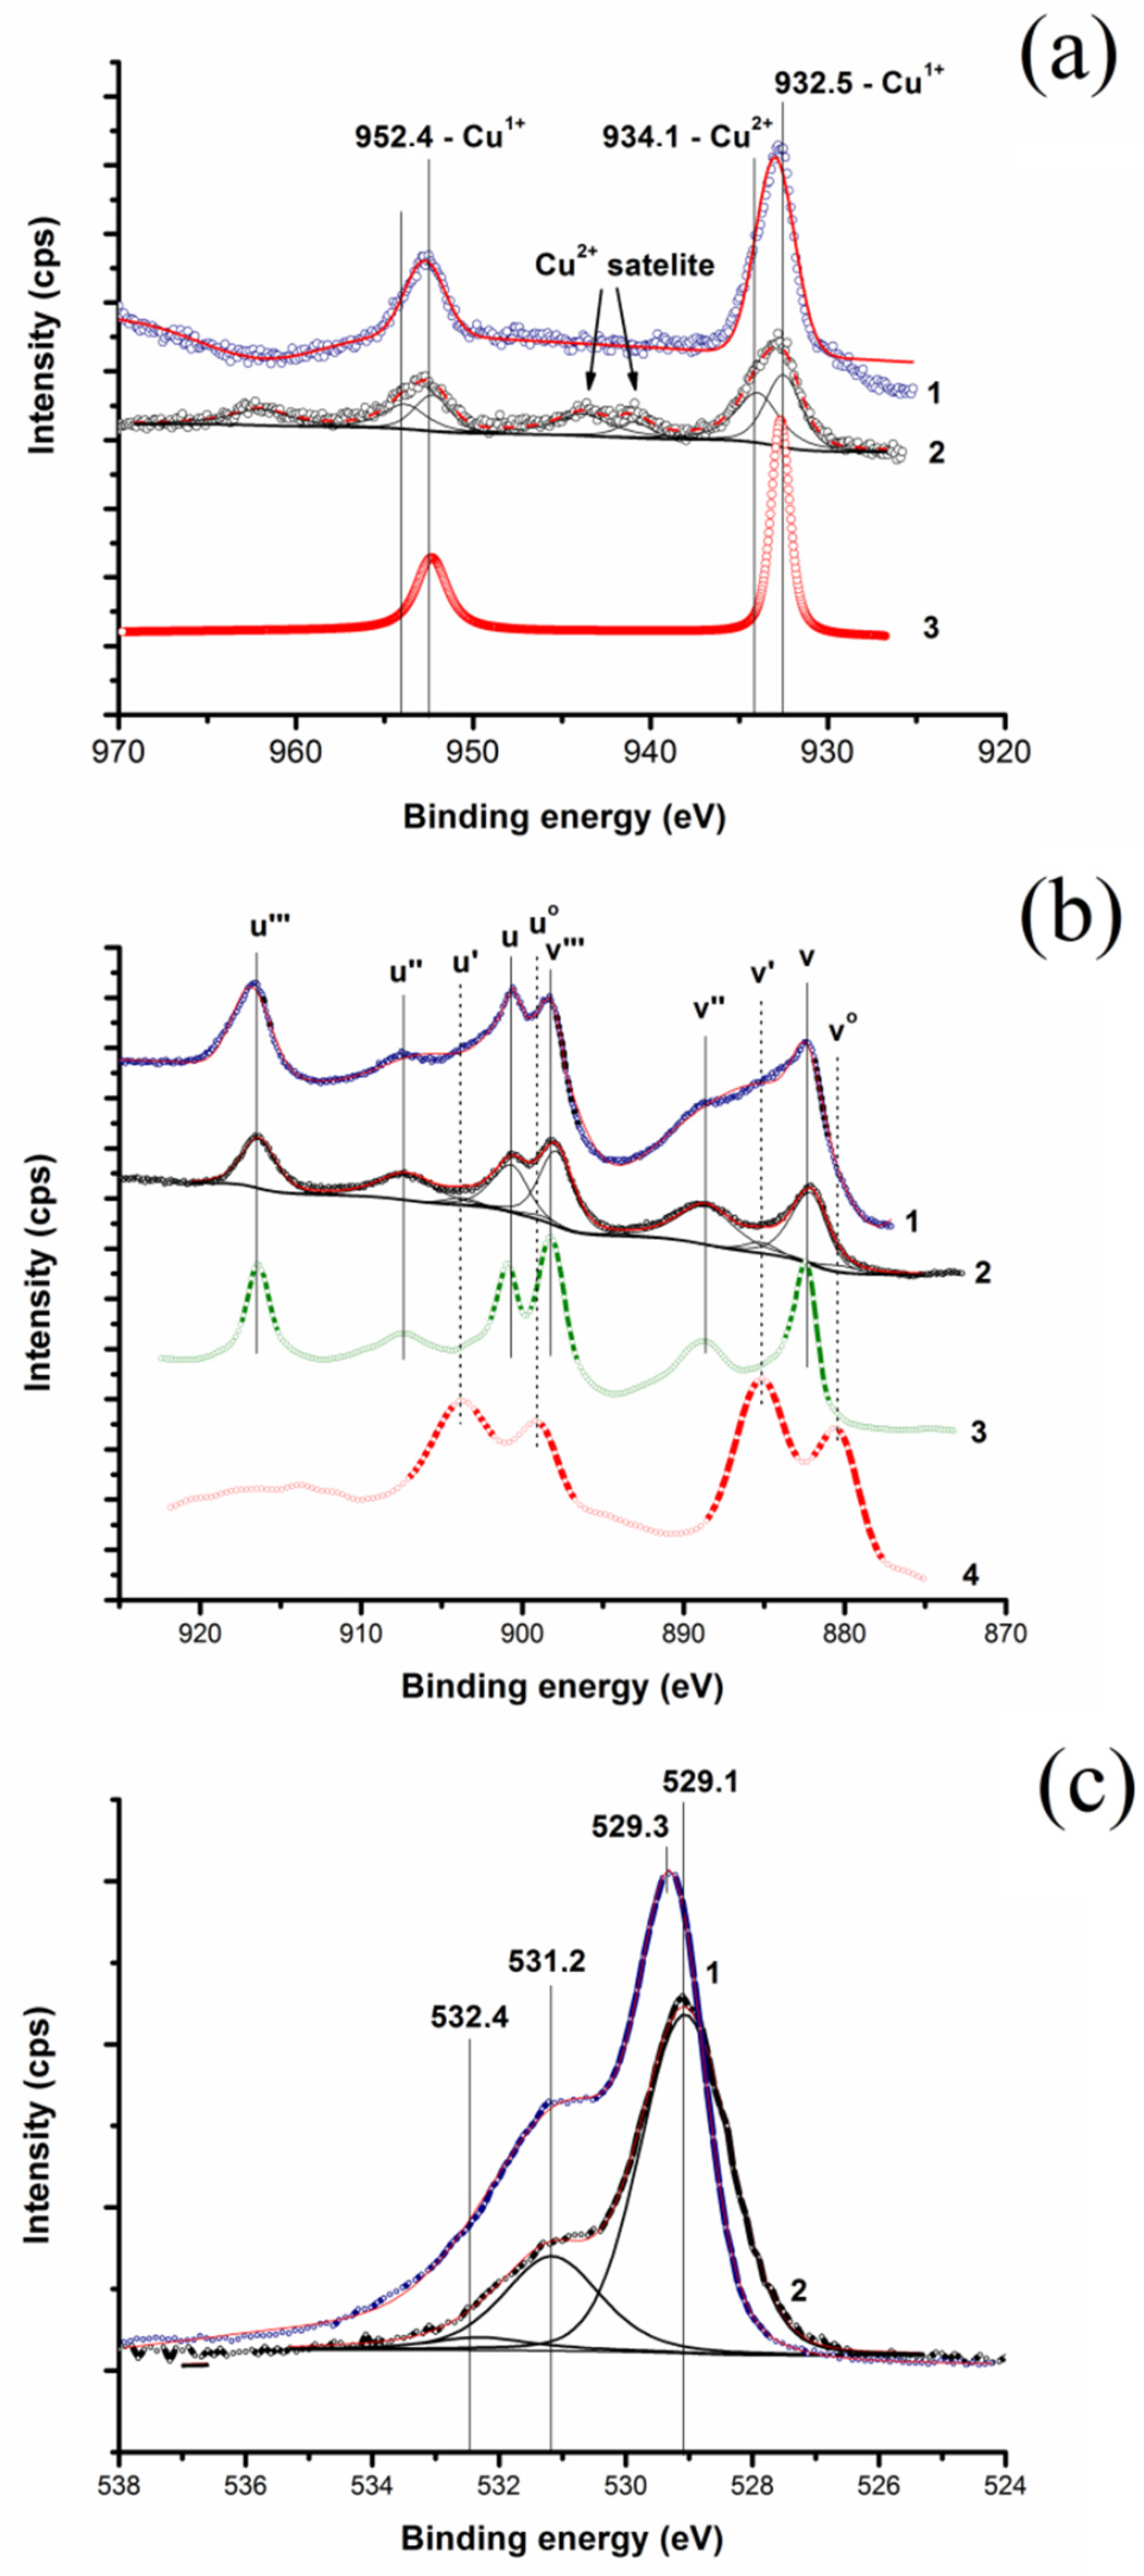
2.3. Chemical State of Cu–CeO2 Surface

Chemical states of Ce, Cu and O atoms in Cu–CeO2 catalysts were studied by XPS. The Cu/Ce atomic ratio (calculated from integral intensities of Cu 2p and Ce 3d lines corrected against their atomic sensitivity factors) on the surface was found to be virtually the same for Cu(D)–CeO2 and Cu(L)–CeO2 samples (0.47 and 0.46, respectively). This means that the modification degree of the ceria surface by Cu under the mechanical treatment is unaffected by the size and morphology of initial Cu powder. However, these parameters are crucial for the chemical state of copper on the ceria surface due to the difference in the Cu/CeO2 surface configuration. Analysis of Cu 2p spectra measured for Cu(D)–CeO2 and Cu(L)–CeO2 powders (Figure 11a) showed the coexistence of both Cu+ (BE = 932.5 eV) and Cu2+ (BE = 934.1 eV) ions on the surface [32,33]. The ratio between each type of ion (Cu+/Cu2+) varied from 3.8 for Cu(D)–CeO2 to 0.54 for Cu(L)–CeO2. Thus, Cu+ dominantly presents on the Cu(D)/CeO2 surface and Cu2+ dominantly presents on the Cu(L)/CeO2 surface. Concurrently, Ce3+ appeared on the CeO2 surface (see Figure 11b). The surface composition consisting of a Cu2O-like state together with a Ce2O3-like state suggests a partial oxidation of Cu metal by CeO2 lattice oxygen induced by ball-milling [28]. Ce3+ was the minor component, but these species were directly related to oxygen vacancies stimulating oxygen transport in the CeO2 lattice [10]. Unfortunately, it is impossible to quantify the number of oxygen vacancies on the basis of our experimental data. Figure 11c shows O 1s spectra recorded for Cu(D)–CeO2 and Cu(L)–CeO2, respectively. The O 1s spectra consisted of two peaks overlapping due to the presence of two chemical states of oxygen. The major intense peaks with BE = 529.3 eV correspond to lattice oxygen in the Cu- and Ce-oxides. The well-defined shoulder with BE equal to 531.2 eV could be attributed “to oxygen ions with unusual coordination in a defective CeOx (x < 2)” [14], to surface oxygen [15], which is favorable to CO oxidation, to “highly polarized oxide ions at the surface (and interface) of the nanocrystallites with an unusually low coordination” [16], and to oxygen in the surface of the OH и CO32− groups [34]. Characteristic bands usually attributed to these groups were also detected in FTIR spectra of these powders. The peak position at 531.2 eV is also in perfect agreement with the 531.3–531.5 eV attributed to oxygen on the surface of Cu oxides and Cu-O films containing Cu0 and Cu+ [35,36]. An additional peak of very low intensity at 532.4 eV could be attributed to the oxygen in H2O adsorbed on the surface [34,37]. A fraction of surface oxygen (calculated as Os/Ol = Os (531.2)/Os (531.2) + Ol (529.1), where Os is the surface oxygen and Ol is the lattice oxygen, was found to be 65.6% and 25% for Cu(D)–CeO2 and Cu(L)–CeO2, respectively. This means that the Cu(D)–CeO2 surface is more oxidized. Together with a higher concentration of Ce3+ ions (Figure 11b, curve 1) directly related to oxygen vacancies in CeO2, this fact suggests localization of nearby Os oxygen vacancies. Previously, we have shown that this type of oxygen is favorable to both CO and H2 oxidation [28]. The ratio of the main components on the catalyst surface is given in Table 2.

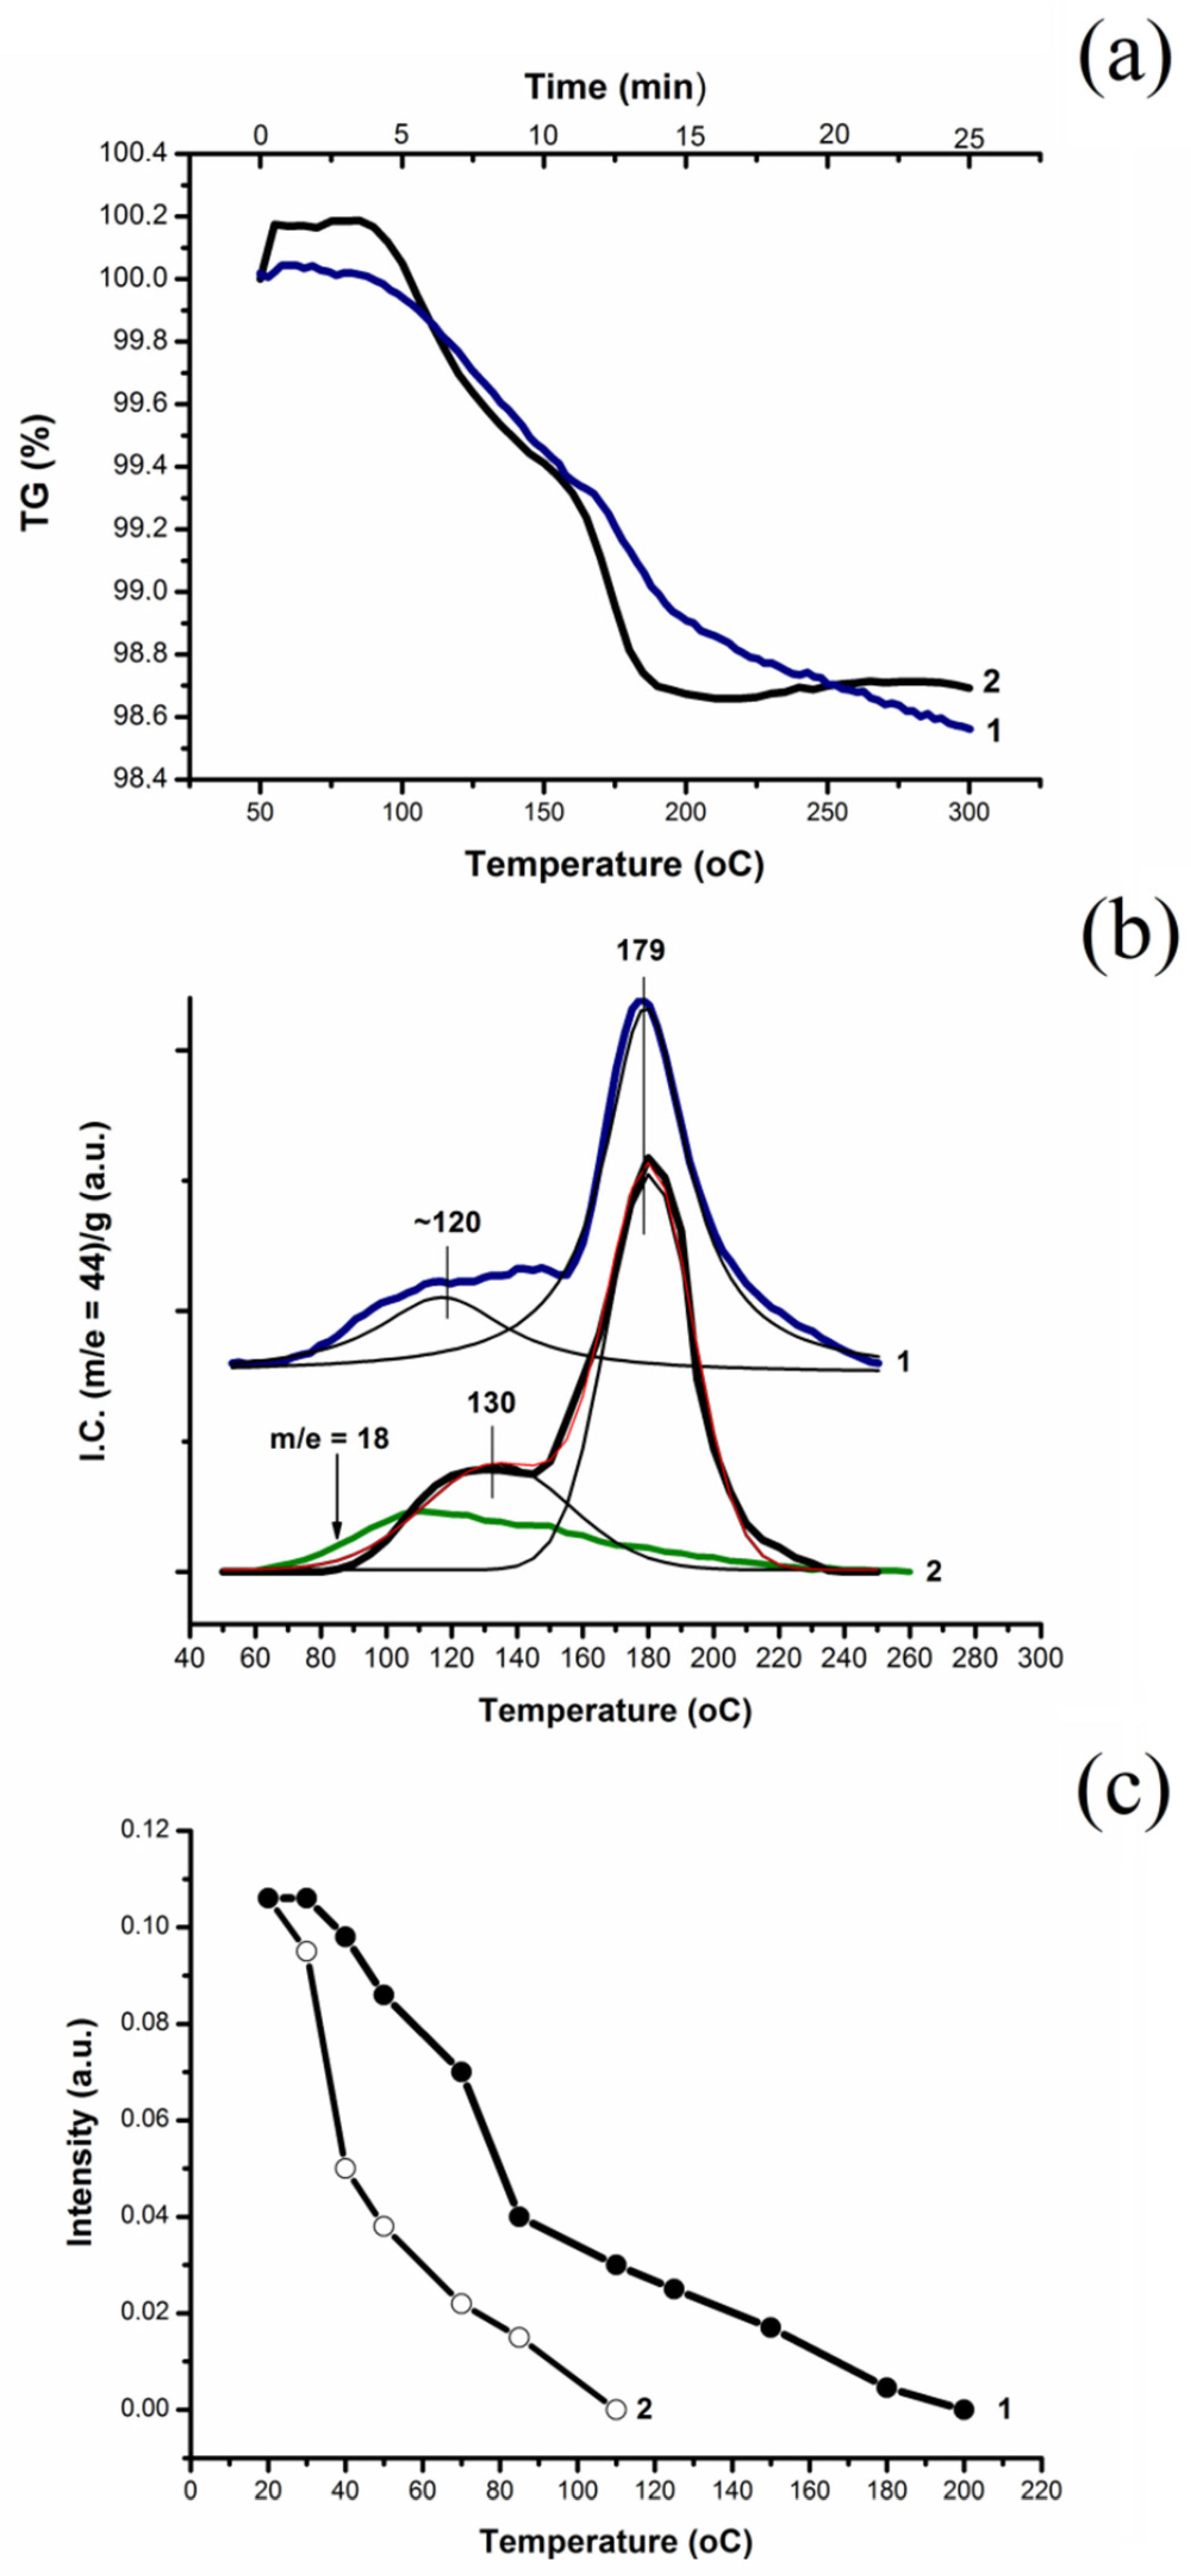
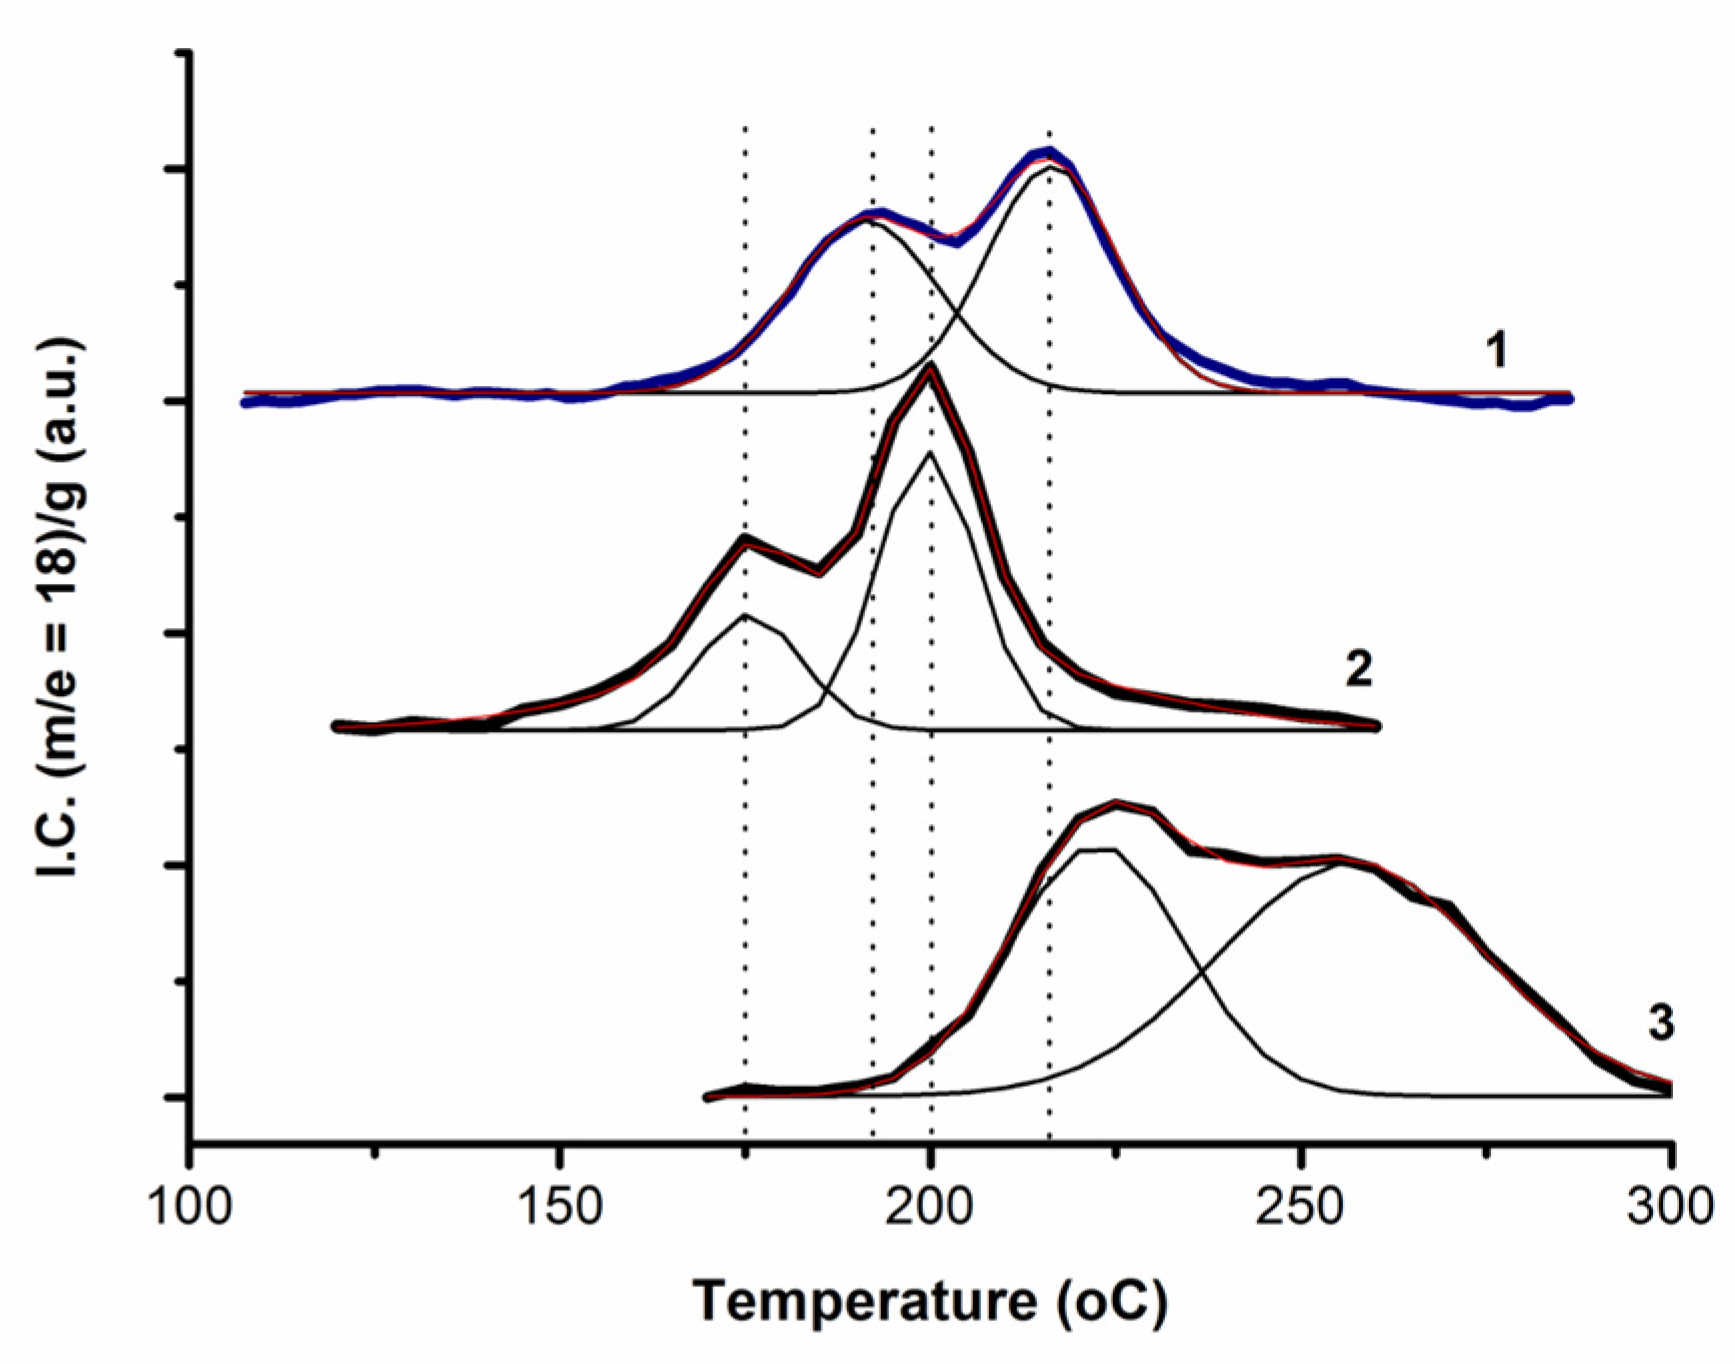
2.4. Oxidation of CO and H2 by Surface and Lattice Oxygen of Cu(D)–CeO2 and Cu(L)–CeO2

Reactivity of oxygen from Cu–CeO2 catalysts in CO and H2 oxidation was tested by CO- and H2–TPR experiments.
Figure 12 shows CO–TPR profiles, MS curves (m/e = 44, CO2 and m/e = 18, H2O), and TG curves of the mass loss. CO interaction with Cu–CeO2 catalysts can be described as a three-stage process.
The first stage, CO adsorption, was observed with the first 3–4 min of blowing CO/Ar mixture through a setup (Figure 12a). As per the TG data, CO adsorption on the Cu(D)–CeO2 surface was more than three times less than that of Cu(L)–CeO2: 2.5 × 10¹⁷ molec·m−2 and 8.1 × 10¹⁷ molec·m−2, respectively. In the case of Cu(L)–CeO2, CO adsorption was accompanied by residual H2O displacement (Figure 12b): at T ≤ 75 °C the OH group layer starts depleting. The effect of the different chemical states of the Cu ions and the morphology of the sample surface on the CO adsorption was verified by DRIFTS measurements under conditions similar to those of CO–TPR. The difference in experimental conditions was the use of 1 vol.% CO/He flow in DRIFTS experiments instead of the 10 vol.% CO/Ar–He mixture applied in CO–TPR experiments. Peaks centered at 2112 cm−1 and 2180 cm−1 were detected, indicating CO chemisorbed on Cu+ and Cu2+, respectively. This is in good agreement with the XPS data and proves that there was a predominance of Cu+ on the Cu(D)–CeO2 surface and of Cu2+ on the Cu(L)–CeO2 surface. Moreover, it is clear that the extended Cu/CeO2 interface visualized by HRTEM measurements was preferable for CO adsorption. The fact of the stimulation of H2O desorption/displacement by adsorbed CO was also proven in FTIR experiments (Figure 12c). A decrease in intensity of the 1630 cm−1 band (δ O-H in H2O) was significantly faster in CO/He flow, when compared with pure He. The band disappeared completely from the DRIFT spectrum at 100 °C in the flow of 10 vol.% CO/He and at 200 °C in the pure He flow.
The second stage was the low-temperature oxidation (Tmax equals to ~120 °C and 130 °C for Cu(D)–CeO2 and Cu(L)–CeO2, respectively), which directly corresponds with the temperature range of CO oxidation under the CO-PROX conditions. This follows from Figure 12: CO oxidation started at ~80 °C and was totally suppressed by a competitive H2 oxidation at 140–160 °C that is in line with [40]. Approximately 24% and 29% of total CO was oxidized to CO2 at this stage for the Cu(D)–CeO2 and Cu(L)–CeO2 catalysts, respectively. In both cases, the second stage was carried out in a superficial oxide layer where the Cu+ and Cu2+ surfaces from a two-dimensional oxide or from mixed oxide structures could be reduced to Cu0 by CO. Additionally, partial reduction of CeO2 to CeO2-x (x = ~0.1) occurred. According to our estimations based on the analysis of MS data, the “active” oxygen occupied ~25 and ~11% of the single surface layer (in our terms, the single surface layer is a layer of one crystallographic cell thick CeO2). The low-temperature peak shape points to the broad binding energy–site distribution of the surface oxygen reacting with CO. It is important that no changes in the phase composition of the catalyst and its structural parameters were observed.
The third stage was the high-temperature stage (Tmax = 179 °C for both catalysts), which involved interaction of CO with the Cu oxide components dispersed in the CeO2 matrix. This suggestion is supported by our previous study [29]. However, in the case of Cu(L), Cu(111) peak (ϴ = 43.16°) diminished significantly, which points to the further incorporation of Cu nanofragments in the CeO2 matrix under CO–TPR conditions.
H2–TPR was carried out to test reactivity of the surface and lattice Cu–CeO2 oxygen towards H2 oxidation. Figure 13 shows a two-peak H2–TPD profile with a well-divided MS peak (m/e = 18, H2O). These curves are remarkably shifted to higher temperatures, when compared with corresponding CO–TPD curves. The low-temperature peaks are found to be at Tmax = 191 and 175 °C instead of Tmax = ~120 and ~130 °C for Cu(D)–CeO2 and Cu(L)–CeO2 catalysts, respectively. The high-temperature peaks are found to be at Tmax = 216 and 200 °C instead of Tmax = 179 °C for both Cu(D)–CeO2 and Cu(L)–CeO2 catalysts. The H2–TPR peak attribution is the same, as is that of the CO–TPR. The low-temperature peak can be associated with H2 oxidation by labile oxygen from the CeO2 surface modified by Cu ions (or two-dimensional Cu oxide structures localized on the ceria surface) [28]. As it has been shown earlier [28], this is the oxygen participating in the low-temperature CO oxidation. Approximately 27 and 17% of oxygen from a single surface layer of CeO2 was used. The large temperature gap between CO–TPR and H2–TPR low-temperature peaks offer the prospect of CO oxidation in H2 excess. The high-temperature peak is associated with a reduction of Cu oxide nanofragments distributed in the CeO2 matrix. As one can see from a comparison of the H2–TPR profiles of the Cu(D)–CeO2 catalyst and pure Cu2O (Figure 13, curves 1 and 3), the real three-dimensional Cu2O phase remained unformed on both the surface and in the bulk of the ceria under milling conditions.

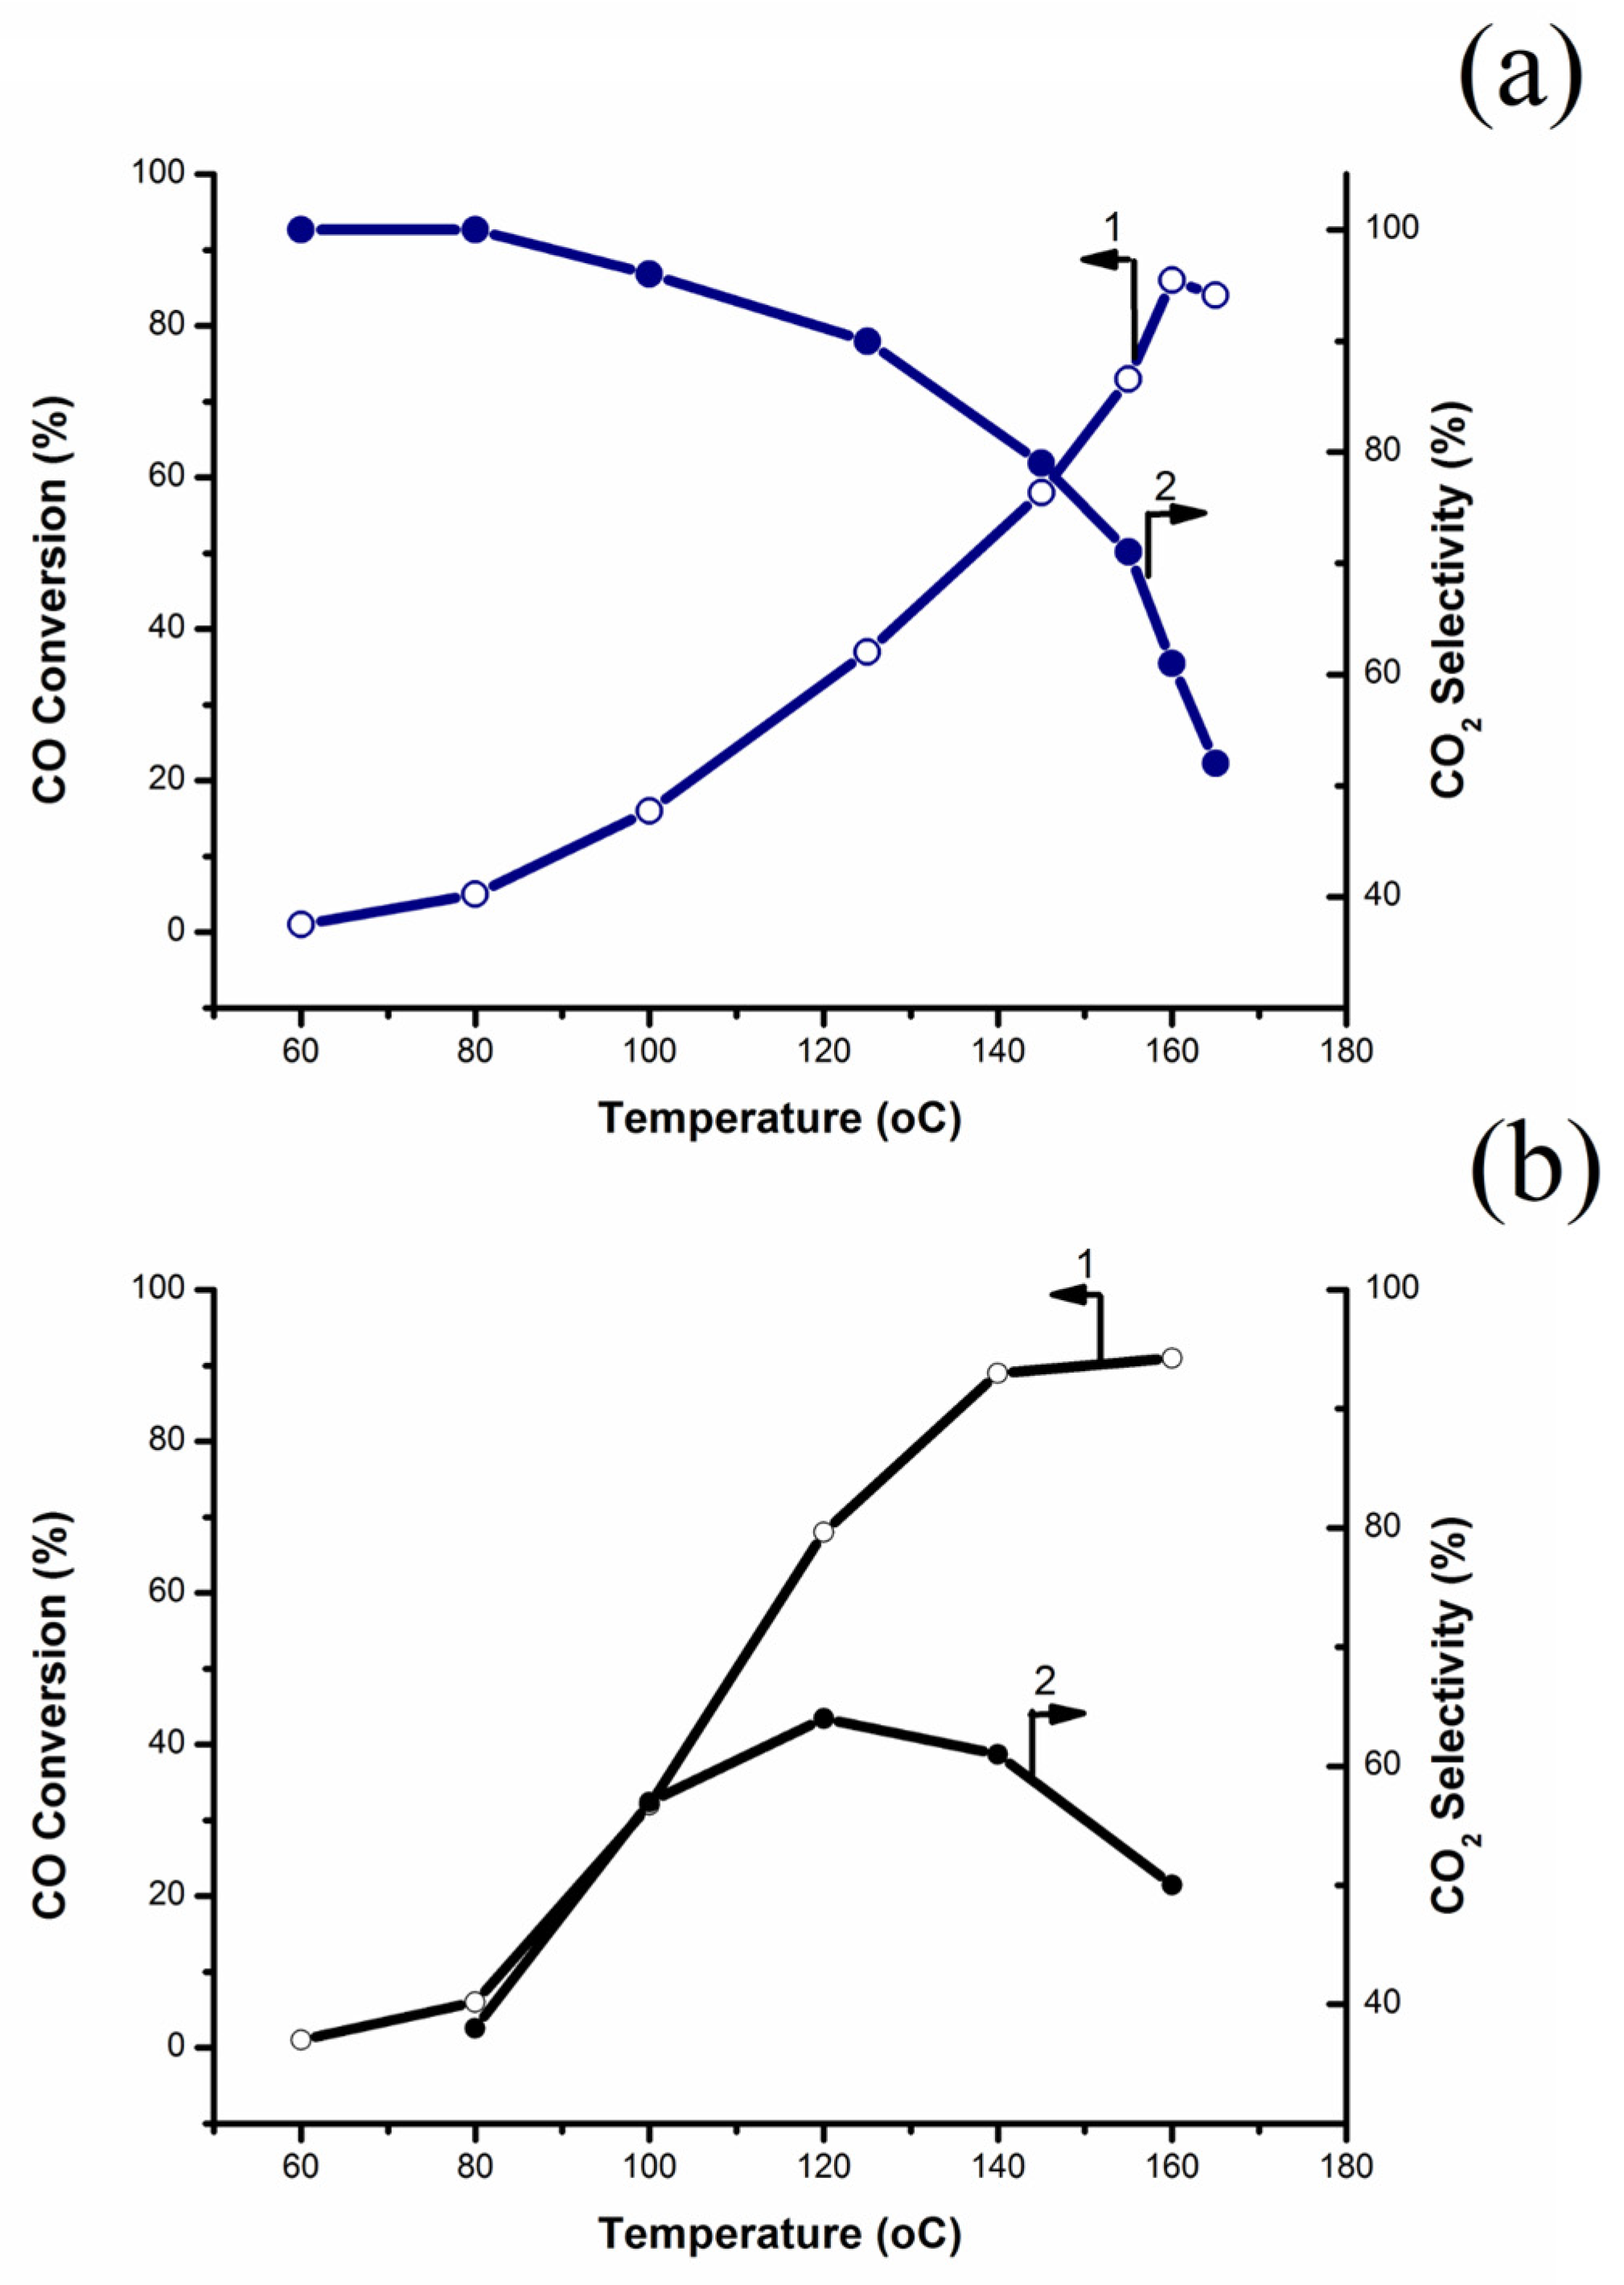
2.5. Catalytic Tests

Figure 14 demonstrates the temperature dependence of the CO conversion for the Cu(D)–CeO2 and Cu(L)–CeO2 catalysts. The CO oxidation was realized at the temperatures corresponding with the low-temperature CO-TPD peak. This fact points to the participation of “active” low-coordinated labile oxygen in this process, where the CO oxidation is dominant below ~140 °C. At higher temperatures, the H2 oxidation starts to compete with that of CO. For both catalysts, the CO oxidation started at T ≥ 80 °C and reached the maximum CO conversion (~90%) at T~160 °C. However, a dramatic difference in the process realization between these temperatures was observed. Fifty percent CO conversion was reached at T~110 °C in the case of Cu(L)–CeO2, contrary to the T~140 °C in the case of Cu(D)–CeO2. The CO2 selectivity calculated for Cu(L)–CeO2 was enormously low, with the maximum value not exceeding 36%.
There is no doubt that the high CO conversion observed for Cu(L)–CeO2 at low temperatures was primarily caused by the surface structure: the Cu oxide clusters of 4–6 nm in size are deposed on the CeO2 surface. Due to this, the interfacial contact is much longer, when compared with Cu(D)–CeO2, wherein Cu oxide is localized on the CeO2 surface as a thin layer. The second reason for the high CO conversion at low temperatures could be CuO(111) crystal planes exposition in the Cu oxide clusters on the Cu(L)–CeO2 surface, contrary to the CuO(110) and (002) detected for thin Cu oxide layers in Cu(D)–CeO2 catalysts. As has been shown in [41], Cu2+, especially CuO(111), has a particular catalytic activity in CO oxidation, in contrast with Cu+, because of the significantly lower activation barrier of the reaction (0.58 eV and 1.36 eV, respectively).
Another special feature observed for Cu(L)–CeO2 catalytic behavior was an extremely low selectivity towards CO2, even at low temperatures. Usually, CO2 selectivity is rather high as long as no H2 oxidation begins. The combination of the high CO conversion and the low CO2 selectivity indicates that only a small part of CO2 was released into the gas phase. The major part was adsorbed on the catalyst surface to give a carbonate-like surface species. As follows from the FTIR measurements (Figure 15), a set of IR bands, which could be assigned “to ‘monodentate’, ‘polydentate’, or polymeric carbonate, or to carboxylate species coordinated via the carbon atom to a surface Ce ion” [42] were detected on the Cu(L)–CeO2 surface at 30 °C, immediately after the CO/He flow was blown through a cuvette. The reason is likely to be a large “free” CeO2 surface. Only a small part of this was occupied by Cu oxide clusters as one should remember that the Cu dopant percentage was 8% (or 19.5 at.%). Arantxa Davó–Quiñonero, et al. have shown carbonate-like species formation on ceria surface before and under CO oxidation in the presence and in the absence of H2 [41]. These surface species, being formed before the CO oxidation started, initiated the depletion of OH groups from the ceria surface and the H2O desorption that was observed in the CO–TPR and FTIR experiments (Figure 12). The intensity of the IR band, set to correspond with carbonate-like structures (1000–1800 cm−1), significantly increased with an increase in temperature of up to 200 °C, the temperature at which the interaction of CO with oxygen from the catalyst surface and bulk was virtually complete (Figure 15). This is also the temperature at which CO conversion in CO-PROX fell due to a preference for H2 oxidation. Carbonate-like structures depleted under CO/Ar flow with a rise in temperature along with the generation of CO2. A remarkable increase in the MS signal (m/e = 44, CO2) intensity after reaching a base line was observed at T > 250 °C under CO–TPR conditions. Thus, the carbonate-like structures were found to be stable enough to exist on the catalyst surface in the wide temperature range correlating to the CO-PROX operating conditions. However, contrary to numerous publications claiming the suppression of the CO-PROX process by surface carbonate-like structures due to “modifications of interfacial sites upon formation of specific carbonates which limit redox/catalytic activity” [43,44], no hindrances in low-temperature preferential CO oxidation at Cu(L)–CeO2 were found. The reason is likely to be the different areas of the ceria surface suitable for Cu oxide cluster deposition and carbonate-like species formation. According to TEM experiments, the as-milled CeO2 powder consisted of polycrystalline flat or cube-like facetted particles with monoatomic steps. These steps could indicate Cu oxide cluster localization [45,46]. On the contrary, the most exposed CeO2(111) surface, as well as CeO2(110), fits well for carbonate-like species stabilization [47]. In H2 excess, not only could carbonate-like structures be found, but also carboxylate- and formate-like surface structures.
It is common knowledge that there are several important parameters that provide the stable and effective work of copper–ceria catalysts for CO-PROX, including the high dispersion of Cu or copper oxide dopant on the ceria surface, the chemical nature of the metal-oxide–ceria interface, the redox features of the catalysts, and a sufficient portion of the active surface oxygen [17,25,48]. In this work we have found the pronounced effect of the original morphology of the Cu metal dopant on the physical–chemical, redox and catalytic properties of the Cu–CeO2 system prepared by the direct mechanochemical synthesis of Cu and ceria powders. Importantly, the modification degree of the ceria surface was found to be independent of the particle size of the original Cu powder. However, in the case of the “large” Cu metal powder (Cu(D)–CeO2 samples), Cu oxide containing agglomerates of tens of nm in size were formed on the ceria surface. The major Cu state in these agglomerates was Cu+. On the contrary, in the case of the “fine” Cu metal powder (Cu(L)–CeO2 samples) Cu oxide containing clusters of 4–6 nm in size was formed on the ceria surface. The major Cu state in these clusters was Cu2+. According to XPS, CO–TPR and H2–TPR measurements, a fraction of the “active” low-coordinated oxygen was found to be significantly higher for Cu(D)–CeO2. The low-temperature reactivity of the catalyst in CO-PROX depends remarkably on the reactivity of the carbonyl-like intermediate (Cu+/CO) towards the labile oxygen from the CeO2 surface [49]. The presence of copper in the state of Cu+ on the surface and a high concentration of the active oxygen both seemed to provide high catalytic activity in CO-PROX. Nevertheless, the low-temperature CO conversion for Cu(D)–CeO2 was approximately half that of Cu(L)–CeO2. The structure of the latter catalyst surface containing tiny CuxO clusters spread on ceria is likely to be a reason for this difference.
The following early stages of CO interaction with the Cu(L)–CeO2 catalyst during CO-PROX can be realized as follows: (1) activation of the CO molecule on the Cu oxide cluster in order to make a carbonyl-like intermediate; (2) oxidation of the intermediate by active surface oxygen to CO2; (3) partial release of CO2 to the gas phase and partial adsorption on to the corresponding CeO2 surface become sources of CO32− species; and (4) accumulation of carbonate-like species stimulates displacement of OH groups from the surface, further improving carbonate-like species formation. No blockage of copper-containing CO activation centers was observed under the reaction conditions because the strongly bonded carbonaceous species were accumulated on a “free” ceria surface, contrary to the above steps, where the copper–oxide clusters could be “fixed”. The rather high CO conversion at low temperature on the Cu(L)–CeO2 catalyst was reached due to the high concentration of copper–oxide clusters of several nm in size, which furnished CO activation through their extended interface with the ceria matrix. The low selectivity to CO2 gas was caused by a strong affinity of ceria to carbonate-like surface species.
As for the Cu(D)–CeO2 catalyst, a lesser concentration of active sites was responsible for the significantly lower CO conversion at the temperature range of 80–140 °C. A reason for this is the significantly larger Cu oxide agglomerates located on the ceria surface, characterized by a shorter interfacial perimeter. A custom form of CO2 selectivity/temperature dependence indicated that a fraction of the copper-free CeO2 surface was insufficient for the formation of a noticeable amount of stable carbonates.
In a large number of the publications, the catalytic activity in the CO-PROX was related to the Cu+ active centers [22,49,50,51]. As has been previously shown, Cu metal was oxidized partially by oxygen from CeO2 under ball-milling conditions [45]. Because of the significant difference in powder size, Cu(D) was oxidized to Cu2O and Cu(L) to CuO during 30 min of milling with CeO2. On the basis of XPS and FTIR data, the major copper state on the Cu(D)–CeO2 surface was found to be Cu+ instead of the Cu2+ observed on the Cu(L)–CeO2, with vibration bands at 2112 cm−1 and 2180 cm−1 detected under titration of the samples that corresponded with CO (FTIR) and which can be attributed to Cu–carbonyl-like species stabilized on Cu+ and Cu2+, respectively. As has been mentioned above, the Cu(L)–CeO2 catalyst demonstrated significantly better catalytic properties at temperatures below 160 °C. This supports the idea that the presence of Cu+ on the ceria surface is not the only factor affecting the catalytic activity in CO-PROX.
The obtained experimental results provide strong evidence that the surface structure played a key role in the preferential CO oxidation. In turn, the surface structure depended crucially on the dispersion of the initial Cu powder applied as dopant to the ceria. The use of fine copper powder with particles of 50–100 nm in size provided stable and sufficiently high catalytic activity at 120–160 °C due to the surface structure, wherein CuxO clusters of 4–6 nm in size with a CuO(111) crystal planes were localized on the steps of facetted CeO2 nanocrystals with CeO2(111) and CeO2(100) crystal planes. The catalyst produced from the copper powder, with particles of several tens of μm in size, and whose surface consisted of significantly larger agglomerates of CuxO located directly on the surface of facetted CeO2 nanocrystals, was approximately half as effective at CO conversion. These findings are partially in line with a recent publication [52].

3. Materials and Methods

3.1. Reagents

All the reagents were analytically graded: Ce(NO3)3∙6H2O of 99% purity, Sigma-Aldrich (Saint Louis, MO, USA); electrolytic Cu metal powder, dendritic, of 99.9% purity, GGP Metalpowder AG (Fürth, Germany); Cu wire of 99.9% purity, Sigma-Aldrich. The gases, Ar, He, CO and H2, were of 99.999% purity.

3.2. Preparation of Cu–CeO2 Catalysts

CeO2 was prepared by decomposition of Ce(NO3)3∙6H2O in air: the salt was heated from 20 to 500 °C with a heating rate of 7 °C/min and was then ignited for two hours at this temperature. Ultra-fine Cu powder (Cu(L)) was produced from Cu wire by the levitation-jet method [53].
For the synthesis of Cu–CeO2 powders, 1.66 g of CeO2 was mixed with 0.14 g of metal powder in agate mortar and placed in a mechanochemical reactor that was formed by a stainless-steel container, together with 15.3 g of hardened steel balls (3–5 mm in diameter). The reactor was hermetically closed and fixed to the vibrator. Ball milling was carried out under static conditions at room temperature. Vibration frequency was 50 Hz, amplitude was 7.25 mm and the average energy intensity was 1 W/g. The milling time was 30 min, corresponding with an energy dose of 1.8 kJ. No iron metal or iron oxide traces were detected in the as-milled powders.

3.3. Catalytic Activity in CO-PROX Reaction

Catalytic experiments were carried out in a flow quartz-tube reactor with an inner diameter of 3 mm connected online with a gas-preparation system and a gas chromatograph equipped with a thermal conductivity detector and two columns (molecular sieve NaX(13A) and Porapak QS). The reactor was charged with 20 mg of the catalyst placed to the isothermal region of the tube. The reaction mixture containing 98 vol.% H2, 1 vol.% CO and 1 vol.% O2 was blown through the reactor with a flow rate of 40 mL/min. The catalytic activity was tested in the temperature range of 20–400 °C and the reaction temperature was raised in steps of 20 °C. The desired temperature was held for 15 min in order to reach a steady state. After the test, the reactor was cooled to room temperature. The next catalytic tests were carried out using the same regime. No special pretreatment of the catalysts was performed. The CO conversion ( X C O , %) was calculated as:
X C O = C O i n C O o u t C O i n .
CO2 selectivity ( S C O , %) was calculated through a O2 conversion ( X O 2 , %):
S C O = 0.5 X C O X O 2 · 100 ,
according to the reaction equation (2CO + O2 = 2CO2).

3.4. Catalyst Characterization

The specific surface area of the Cu–CeO2 powders was measured by N2 adsorption–desorption isotherms with a Quantachrome NovaWin instrument in accordance with the Brunauer–Emmet equation. Metal loadings in the Cu–CeO2 composites were determined by atomic absorption spectroscopy (AAS) with a ThermoScientific iCAP 6300 Duo (Thermo Scientific, Waltham, MA, USA) instrument. The samples’ morphologies were studied with scanning electron microscopy (SEM) using a Prisma E (ThermoFisher Scientific, San Diego, CA, USA) instrument. The sample was fastened to double-sided tape before measurements were taken. The nanostructure of the sample particles was performed with high-resolution transmission electron microscopy (HR TEM), scanning transmission electron microscopy (STEM), electron diffraction and EDX elemental mapping in a Tecnai Osiris transmission electron microscope (ThermoFisher Scientific, USA) with a high-angle annular dark field (HAADF) detector at 200 kV. For electron microscopy investigations, the samples of powders were dispersed in acetone using an ultrasonic bath for 5–30 min to separate large conglomerates. Then, the solutions were dropped on copper and nickel TEM lacey grids with a thin and holey carbon support. X-ray diffraction of original, as-milled and as-treated powders was recorded with a DRON-3 diffractometer (Burevestnik, Moscow, Russia) with Cu Kα radiation in the range of 20–90°; a quantitative X-ray phase analysis was performed with a fitting procedure based on computer programs from [31], crystallite sizes were calculated using the Scherrer equation and according to [31] in the case of CeO2. Temperature-programmed reduction experiments (H2–TPR and CO–TPR) were carried out with a TG-DTA/DSC apparatus (NETZSCH STA 449C, Gebrüder-Netzsch-Straße, Germany) equipped with a mass-spectrometer (MS) AEOLOS-32 in a temperature range of 20–400 °C at a heating rate of 10 °C·min−1. An amount of 15 mg of testing powder was loaded and dried in He flow under temperature programming conditions from 20 to 200 °C. After the samples were cooled to 20 °C and pumped 3–4 times, a reduction agent consisting of 10 vol.% H2/Ar–He or 10 vol.% CO/Ar–He was introduced with a flow rate of 80 mL/min. X-ray photoelectron spectroscopy (XPS) measurements were performed with a SPECS (Berlin, Germany) Electron Spectrometer with a Mg Kα (hν = 1253.6 eV, 150 W) radiation. The binding energy (BE) scales were pre-calibrated using the positions of Au4f7/2 (84.0 eV) and Cu2p3/2 (932.7 eV). Binding energies were referenced to the C 1s line at 285 eV from adventitious carbon. Spectral analysis and data processing were performed with the XPS Peak 4.1 program. The pressure in the analytical chamber did not exceed 8×10⁻⁹ mbar. The sample was fixed onto a standard holder with the use of double-sided conductive copper tape (Scotch 3M©). A PHI 5000 VersaProbe electron spectrometer (ULVAC-Physical Electronics, Methuen, MA, USA) with Al Kα radiation was also used. To avoid the photoreduction of Cu2+-spices in vacuum during the XPS measurements [20,50], the accumulation time of the Cu 2p-spectra was minimized and averaged no more than 8–9 min, though it is impossible to completely eliminate this effect. Transmission infrared Fourier-transformed spectra (FTIR) were recorded under operando conditions with a Spectrum RX I FT-IR System IR Fourier spectrometer IFS-45 (Brucker, Bremen, Germany) equipped with a heated flow cuvette reactor (V = 1 cm3) which was combined online with a system for the product and reagent analysis. A pellet of 20–30 mg prepared from Cu–CeO2 powder was (1) placed in a cuvette and treated in He flow at 200 °C for 1 h, (2) cooled down in He flow to room temperature and (3) heated in 1 vol.% CO/He flow with a heating rate of 10 °C·min−1 together with FTIR spectra registration. The spectrum of original sample treated and cooled in He was used as a base line.

4. Conclusions

We studied the size effect of Cu powder (Cu(D), i.e., dendrite-like Cu particles of several tens of μm, and Cu(L), i.e., spherical Cu particles of 50–200 nm in size) on the physical, chemical and catalytic properties of Cu–CeO2 composites containing 8 mass% Cu that had been prepared directly from copper and ceria using mechanochemical synthesis. XRD, HRTEM, STEM, EDX analyses, and XPS, CO–TPR, H2–TPR and FTIR operando techniques were employed for characterization of the catalysts. The preferential CO oxidation in an H2-rich stream (CO-PROX) was a test reaction. The surface structure being formed when highly dispersed Cu powder was used is found to be a key factor responsible for the catalytic activity.
An extent of ceria surface modification by copper (Cu/Ce = ~0.47% for both catalysts) and specific surface area (39 m2g−1 and 50.5 m2g−1 for Cu(D)–CeO2 and Cu(L)–CeO2, respectively) were found to be independent or slightly dependent on the Cu dispersion. Both Cu+ and Cu2+ were detected on the ceria surface, but Cu+ was the main component on Cu(D)–CeO2, contrary to the Cu2+ on Cu(L)–CeO2 (Cu+/Cu2+ equals 3.8 and 0.54, respectively). A portion of low-coordinated active oxygen also was 2.6 times larger in the case of Cu(D)–CeO2. Despite the predominant content of Cu+ and reactive oxygen, the catalyst synthesized from the “large-scale” Cu, whose surface consisted of CuxO agglomerates located directly on the surface of facetted CeO2 nanocrystals with CeO2(111) and CeO2(100) crystal planes, was approximately half as active, at 120–160 °C, as the catalyst synthesized from the fine Cu powder, whose surface consisted of CuxO (Cu2+) clusters of 4–6 nm in size located on the steps of facetted CeO2 nanocrystals. Although a large part of the CO2 reacted with the ceria surface to give carbonate-like species, no blockage of CO-activating centers was observed due to the surface structure.
As per a large number of publications, the Cu/CuO-CeO2 catalytic activity in various reactions depends on a number of microscopic and macroscopic parameters. In each of the studies, the authors pay attention to those special features of the catalysts that provide the highest catalytic activity and stability. As can be found in this study, the catalytic properties of the Cu–CeO2 composites produced by mechanochemical synthesis depends more on the “architecture” of the catalyst surface than it does on the mobility of oxygen in the catalyst lattice and, probably, on the chemical state of the copper ion on the surface. However, direct introduction of Cu+ ions in CeO2 could allow for the clarification of the true role of different Cu chemical states in CO activation. This form of active surface can be easily achieved if Cu2O nanopowder is used as a dopant.

Author Contributions

Conceptualization, O.M.Z. and O.S.M.; methodology, O.M.Z. and O.S.M.; software, D.N.K. and A.V.B.; validation, E.N.C. and V.G.B.; formal analysis, D.N.K., E.N.C., A.A.F., O.V.S., G.A.V. and A.V.B.; investigation, O.M.Z., O.S.M., D.N.K., A.A.F., O.V.S., G.A.V. and A.V.B.; writing—original draft preparation, O.M.Z., O.S.M. and A.V.B.; writing—review and editing, O.M.Z., O.S.M., E.N.C. and V.G.B.; visualization, D.N.K., E.N.C. and V.G.B.; supervision, O.M.Z. and O.S.M. All authors have read and agreed to the published version of the manuscript.

Funding

This research was funded by the Ministry of Science and Higher Education within the State Assignment of FSRC “Crystallography and Photonics” RAS in part of electron microscopy investigations (using the instrumentation of the Centre of Shared Facilities) and within the State Assignment of N.N. Semenov Federal Research Center for Chemical Physics RAS (topic 122040500058-1) as part of their CO–TPR, H2–TPR and FTIR investigations.

Data Availability Statement

The data presented in this study are available in the article.

Conflicts of Interest

The authors declare no conflict of interest.

References

  1. Aboukaïs, A.; Skaf, M.; Hany, S.; Cousin, R.; Aouad, S.; Labaki, M.; Abi-Aad, E. A comparative study of Cu, Ag and Au doped CeO2 in the total oxidation of volatile organic compounds (VOCs). Mater. Chem. Phys. 2016, 177, 570–576. [Google Scholar] [CrossRef]
  2. Di Sarli, V.; Landi, G.; Di Benedetto, A.; Lisi, L. Synergy Between Ceria and Metals (Ag or Cu) in Catalytic Diesel Particulate Filters: Effect of the Metal Content and of the Preparation Method on the Regeneration Performance. Top. Catal. 2020, 64, 256–269. [Google Scholar] [CrossRef]
  3. Rico-Pérez, V.; Aneggi, E.; Trovarelli, A. The Effect of Sr Addition in Cu- and Fe-Modified CeO2 and ZrO2 Soot Combustion Catalysts. Catalysts 2017, 7, 28. [Google Scholar] [CrossRef]
  4. Lee, Y.-H.; Kim, H.-M.; Jeong, C.-H.; Jeong, D.-W. Effects of precipitants on the catalytic performance of Cu/CeO2catalysts for the water–gas shift reaction. Catal. Sci. Technol. 2021, 11, 6380–6389. [Google Scholar] [CrossRef]
  5. Zhang, Y.; Liang, L.; Chen, Z.; Wen, J.; Zhong, W.; Zou, S.; Fu, M.; Chen, L.; Ye, D. Highly efficient Cu/CeO2-hollow nanospheres catalyst for the reverse water-gas shift reaction: Investigation on the role of oxygen vacancies through in situ UV-Raman and DRIFTS. Appl. Surf. Sci. 2020, 516, 146035. [Google Scholar] [CrossRef]
  6. Ji, W.; Chen, X.; Li, Q.; Lin, K.; Deng, J.; Xing, X. Insights into CO Oxidation in Cu/CeO2 Catalysts: O2 Activation at the Dual-Interfacial Sites. Eur. J. Inorg. Chem. 2023, 26, e202200656. [Google Scholar] [CrossRef]
  7. Du, Z.; Liu, C.; Zhai, J.; Guo, X.; Xiong, Y.; Su, W.; He, G. A Review of Hydrogen Purification Technologies for Fuel Cell Vehicles. Catalysts 2021, 11, 393. [Google Scholar] [CrossRef]
  8. Wang, W.W.; Yu, W.Z.; Du, P.P.; Xu, H.; Jin, Z.; Si, R.; Ma, C.; Shi, S.; Jia, C.J.; Yan, C.H. Crystal plane effect of ceria on supported copper oxide cluster catalyst for CO oxidation: Importance of metal–support interaction. ACS Catal. 2017, 7, 1313–1329. [Google Scholar] [CrossRef]
  9. Konsolakis, M. The role of Copper–Ceria interactions in catalysis science: Recent theoretical and experimental advances. Appl. Catal. B Environ. 2016, 198, 49–66. [Google Scholar] [CrossRef]
  10. Liu, D.; Hu, F.; Yan, Y.; Ye, R.; Chen, X.; Han, B.; Lu, Z.-H.; Zhou, L.; Feng, G.; Zhang, R. Promotion of oxygen vacancies and metal-support interaction over 3DOM Au/CeO2 catalyst for CO oxidation. Appl. Surf. Sci. 2023, 629, 157438. [Google Scholar] [CrossRef]
  11. Kim, H.J.; Shin, D.; Jeong, H.; Jang, M.G.; Lee, H.; Han, J.W. Design of an Ultrastable and Highly Active Ceria Catalyst for CO Oxidation by Rare-Earth- and Transition-Metal Co-Doping. ACS Catal. 2020, 10, 14877–14886. [Google Scholar] [CrossRef]
  12. Vanpoucke, D.E.P.; Bultinck, P.; Cottenier, S.; Van Speybroeck, V.; Van Driessche, I. Aliovalent doping of CeO2: DFT study of oxidation state and vacancy effects. J. Mater. Chem. A 2014, 2, 13723–13737. [Google Scholar] [CrossRef]
  13. D’Angelo, A.M.; Wu, Z.; Overbury, S.H.; Chaffee, A.L. Cu enhanced surface defects and lattice mobility of Pr-CeO2 mixed oxides. J. Phys. Chem. C 2016, 120, 27996–28008. [Google Scholar] [CrossRef]
  14. Holgado, J.; Munuera, G.; Espinós, J.; González-Elipe, A. XPS study of oxidation processes of CeOx defective layers. Appl. Surf. Sci. 2000, 158, 164–171. [Google Scholar] [CrossRef]
  15. Zeng, S.; Zhang, W.; Śliwa, M.; Su, H. Comparative study of CeO2/CuO and CuO/CeO2 catalysts on catalytic performance for preferential CO oxidation. Int. J. Hydrogen Energy 2013, 38, 3597–3605. [Google Scholar] [CrossRef]
  16. Tang, X.; Zhang, B.; Li, Y.; Xu, Y.; Xin, Q.; Shen, W. CuO/CeO2 catalysts: Redox features and catalytic behaviors. Appl. Catal. A Gen. 2005, 288, 116–125. [Google Scholar] [CrossRef]
  17. Paier, J.; Penschke, C.; Sauer, J. Oxygen Defects and Surface Chemistry of Ceria: Quantum Chemical Studies Compared to Experiment. Chem. Rev. 2013, 113, 3949–3985. [Google Scholar] [CrossRef] [PubMed]
  18. Kullgren, J. Oxygen Vacancy Chemistry in Ceria. Digital Comprehensive Summaries of Uppsala. Ph.D. Dissertations, Faculty of Science and Technology, Acta Universitatis Upsaliensis, Uppsala, Sweden, 2012. [Google Scholar]
  19. Mars, P.; van Krevelen, D. Oxidations carried out by means of vanadium oxide catalysts. Chem. Eng. Sci. 1954, 3, 41–59. [Google Scholar] [CrossRef]
  20. Arango-Díaz, A.; Moretti, E.; Talon, A.; Storaro, L.; Lenarda, M.; Núñez, P.; Marrero-Jerez, J.; Jiménez-Jiménez, J.; Jiménez-López, A.; Rodríguez-Castellón, E. Preferential CO oxidation (CO-PROX) catalyzed by CuO supported on nanocrystalline CeO2 prepared by a freeze-drying method. Appl. Catal. A Gen. 2014, 477, 54–63. [Google Scholar] [CrossRef]
  21. Van Deelen, T.W.; Mejía, C.H.; De Jong, K.P. Control of metal-support interactions in heterogeneous catalysts to enhance activity and selectivity. Nat. Catal. 2019, 2, 955–970. [Google Scholar] [CrossRef]
  22. Luo, M.-F.; Song, Y.-P.; Lu, J.-Q.; Wang, X.-Y.; Pu, Z.-Y. Identification of CuO species in high surface area CuO-CeO2 catalyst and their catalytic activities for CO oxidation. J. Phys. Chem. C 2007, 111, 12686–12692. [Google Scholar] [CrossRef]
  23. Cecilia, J.A.; Arango-Díaz, A.; Marrero-Jerez, J.; Núñez, P.; Moretti, E.; Storaro, L.; Rodríguez-Castellón, E. Catalytic Behaviour of CuO-CeO2 Systems Prepared by Different Synthetic Methodologies in the CO-PROX Reaction under CO2-H2O Feed Stream. Catalysts 2017, 7, 160. [Google Scholar] [CrossRef]
  24. Luong, N.T.; Okumura, H.; Yamasue, E.; Ishihara, K.N. Structure and catalytic behaviour of CuO–CeO2 prepared by high-energy ball milling. R. Soc. Open Sci. 2019, 6, 181861. [Google Scholar] [CrossRef] [PubMed]
  25. Chen, A.; Yu, X.; Zhou, Y.; Miao, S.; Li, Y.; Kuld, S.; Sehested, J.; Liu, J.; Aoki, T.; Hong, S.; et al. Structure of the catalytically active copper–ceria interfacial perimeter. Nat. Catal. 2019, 2, 334–341. [Google Scholar] [CrossRef]
  26. Zhang, R.; Haddadin, T.; Rubiano, D.P.; Nair, H.; Polster, C.S.; Baertsch, C.D. Quantification of Reactive CO and H2 on CuOx-CeO2 during CO Preferential Oxidation by Reactive Titration and Steady State Isotopic Transient Kinetic Analysis. ACS Catal. 2011, 1, 519–525. [Google Scholar] [CrossRef]
  27. Gamarra, D.; Belver, C.; Fernández-García, M.; Martínez-Arias, A. Selective CO Oxidation in Excess H2 over Copper−Ceria Catalysts: Identification of Active Entities/Species. J. Am. Chem. Soc. 2007, 129, 12064–12065. [Google Scholar] [CrossRef] [PubMed]
  28. Borchers, C.; Martin, M.L.; Vorobjeva, G.A.; Morozova, O.S.; Firsova, A.A.; Leonov, A.V.; Kurmaev, E.Z.; Kukharenko, A.I.; Zhidkov, I.S.; Cholakh, S.O. Cu–CeO2 nanocomposites: Mechanochemical synthesis, physico-chemical properties, CO-PROX activity. J. Nanopart. Res. 2016, 18, 344. [Google Scholar] [CrossRef]
  29. Borchers, C.; Martin, M.L.; Vorobjeva, G.A.; Morozova, O.S.; Firsova, A.A.; Leonov, A.V.; Kurmaev, E.Z.; Kukharenko, A.I.; Zhidkov, I.S.; Cholakh, S.O. CuO-CeO2 nanocomposite catalysts produced by mechanochemical synthesis. AIP Adv. 2019, 9, 065115. [Google Scholar] [CrossRef]
  30. Morozova, O.S.; Firsova, A.A.; Tyulenin, Y.P.; Vorobieva, G.A.; Leonov, A.V. Mechanochemical Synthesis as an Alternative Effective Technique for the Preparation of the Composite Catalysts. Kinet. Catal. 2020, 61, 824–831. [Google Scholar] [CrossRef]
  31. Shelekhov, E.V.; Sviridova, T.A. Programs for X-ray analysis of polycrystals. Met. Sci. Heat Treat. 2000, 42, 309–313. [Google Scholar] [CrossRef]
  32. Zhai, Y.; Zhao, J.; Di, X.; Di, S.; Wang, B.; Yue, Y.; Sheng, G.; Lai, H.; Guo, L.; Wang, H.; et al. Carbon-supported perovskite-like CsCuCl3 nanoparticles: A highly active and cost-effective heterogeneous catalyst for the hydrochlorination of acetylene to vinyl chloride. Catal. Sci. Technol. 2018, 8, 2901–2908. [Google Scholar] [CrossRef]
  33. Sun, H.; Zelekew, O.A.; Chen, X.; Guo, Y.; Kuo, D.-H.; Lu, Q.; Lin, J. A noble bimetal oxysulfide CuVOS catalyst for highly efficient catalytic reduction of 4-nitrophenol and organic dyes. RSC Adv. 2019, 9, 31828–31839. [Google Scholar] [CrossRef] [PubMed]
  34. Ren, Z.; Peng, F.; Li, J.; Liang, X.; Chen, B. Morphology-Dependent Properties of Cu/CeO2 Catalysts for the Water-Gas Shift Reaction. Catalysts 2017, 7, 48. [Google Scholar] [CrossRef]
  35. Park, J.-Y.; Lim, K.-A.; Ramsier, R.D.; Kang, Y.-C. Spectroscopic and Morphological Investigation of Copper Oxide Thin Films Prepared by Magnetron Sputtering at Various Oxygen Ratios. Bull. Korean Chem. Soc. 2011, 32, 3395–3399. [Google Scholar] [CrossRef]
  36. Svintsitskiy, D.; Stadnichenko, A.; Demidov, D.; Koscheev, S.; Boronin, A. Investigation of oxygen states and reactivities on a nanostructured cupric oxide surface. Appl. Surf. Sci. 2011, 257, 8542–8549. [Google Scholar] [CrossRef]
  37. Sun, S.; Mao, D.; Yu, J.; Yang, Z.; Lua, G.; Ma, Z. Low-temperature CO oxidation on CuO/CeO2 catalysts: The significant effect of copper precursor and calcination temperature. Catal. Sci. Technol. 2015, 5, 3166. [Google Scholar]
  38. Park, P.W.; Ledford, J.S. Effect of Crystallinity on the Photoreduction of Cerium Oxide: A Study of CeO2 and Ce/Al2O3 Catalysts. Langmuir 1996, 12, 1794–1799. [Google Scholar] [CrossRef]
  39. Hardacre, C.; Roe, G.M.; Lambert, R.M. Structure, composition and thermal properties of cerium oxide films on platinum {111}. Surf. Sci. 1995, 326, 1–10. [Google Scholar] [CrossRef]
  40. Cruz, A.R.M.; Assaf, E.M.; Gomes, J.F.; Assaf, J.M. Active copper species of co-precipitated copper-ceria catalysts in the CO-PROX reaction: An in situ XANES and DRIFTS study. Catal. Today 2021, 381, 42–49. [Google Scholar] [CrossRef]
  41. Gao, Y.; Zhang, L.; van Hoof, A.J.; Hensen, E.J. On the surface-dependent oxidation of Cu2O during CO oxidation: Cu2+ is more active than Cu+. Appl. Catal. A Gen. 2020, 602, 117712. [Google Scholar] [CrossRef]
  42. Vayssilov, G.N.; Mihaylov, M.; Petkov, P.S.; Hadjiivanov, K.I.; Neyman, K.M. Reassignment of the Vibrational Spectra of Carbonates, Formates, and Related Surface Species on Ceria: A Combined Density Functional and Infrared Spectroscopy Investigation. J. Phys. Chem. C 2011, 115, 23435–23454. [Google Scholar] [CrossRef]
  43. Mariño, F.; Descorme, C.; Duprez, D. Supported base metal catalysts for the preferential oxidation of carbon monoxide in the presence of excess hydrogen (PROX). Appl. Catal. B Environ. 2005, 58, 175–183. [Google Scholar] [CrossRef]
  44. Gamarra, D.; Martínez-Arias, A. Preferential oxidation of CO in rich H2 over CuO/CeO2: Operando-DRIFTS analysis of deactivating effect of CO2 and H2O. J. Catal. 2009, 263, 189–195. [Google Scholar] [CrossRef]
  45. James, T.E.; Hemmingson, S.L.; Ito, T.; Campbell, C.T. Energetics of Cu Adsorption and Adhesion onto Reduced CeO2(111) Surfaces by Calorimetry. J. Phys. Chem. C 2015, 119, 17209–17217. [Google Scholar] [CrossRef]
  46. Yu, W.Z.; Wang, W.W.; Li, S.Q.; Fu, X.P.; Wang, X.; Wu, K.; Si, R.; Ma, C.; Jia, C.J.; Yan, C.H. Construction of active site in a sintered capper-ceria nanorod catalyst. J. Am. Chem. Soc. 2019, 141, 17548–17557. [Google Scholar] [CrossRef] [PubMed]
  47. Davó-Quiñonero, A.; López-Rodríguez, S.; Chaparro-Garnica, C.; Martín-García, I.; Bailón-García, E.; Lozano-Castelló, D.; Bueno-López, A.; García-Melchor, M. Investigations of the Effect of H2 in CO Oxidation over Ceria Catalysts. Catalysts 2021, 11, 1556. [Google Scholar] [CrossRef]
  48. Puigdollers, A.R.; Schlexer, P.; Tosoni, S.; Pacchioni, G. Increasing Oxide Reducibility: The Role of Metal/Oxide Interfaces in the Formation of Oxygen Vacancies. ACS Catal. 2017, 7, 6493–6513. [Google Scholar] [CrossRef]
  49. Kappis, K.; Papavasiliou, J. Influence of the Hydrothermal Parameters on the Physicochemical Characteristics of Cu−Ce Oxide Nanostructures. Chemcatchem 2019, 11, 4765–4776. [Google Scholar] [CrossRef]
  50. Moretti, E.; Lenarda, M.; Riello, P.; Storaro, L.; Talon, A.; Frattini, R.; Reyes-Carmona, A.; Jiménez-López, A.; Rodríguez-Castellón, E. Influence of synthesis parameters on the performance of CeO2–CuO and CeO2–ZrO2–CuO systems in the catalytic oxidation of CO in excess of hydrogen. Appl. Catal. B Environ. 2013, 129, 556–565. [Google Scholar] [CrossRef]
  51. Lu, J.; Wang, J.; Zou, Q.; He, D.; Zhang, L.; Xu, Z.; He, S.; Luo, Y. Unravelling the Nature of the Active Species as well as the Doping Effect over Cu/Ce-Based Catalyst for Carbon Monoxide Preferential Oxidation. ACS Catal. 2019, 9, 2177–2195. [Google Scholar] [CrossRef]
  52. Martínez-Munuera, J.; Giménez-Mañogil, J.; Yeste, M.; Hungría, A.; Cauqui, M.; García-García, A.; Calvino, J. New findings regarding the role of copper entity particle size on the performance of Cu/ceria-based catalysts in the CO-PROX reaction. Appl. Surf. Sci. 2021, 575, 151717. [Google Scholar] [CrossRef]
  53. Zhigach, A.N.; Kuskov, M.L.; Leipunskii, I.O.; Stoenko, N.I.; Storozhev, V.B. Levitation-jet method for obtaining ultra-fine metal powders, alloys, metal compounds by Gene-Miller technique: History, state of art, perspective. Bull. Russ. Acad. Sci. Energetic 2012, 3, 80–96. [Google Scholar]
Figure 1. TEM images of the initial CeO2 powder. (a,b) A single crystal particle and a corresponding SAED pattern, (c,d) a polycrystalline particle and a corresponding SAED pattern, and (e) an EDX spectrum of a polycrystalline particle.
Catalysts 14 00222 g001
Figure 2. XRD patterns of the initial powders and the powder as-milled for 30 min, consisting of 8 mass% Cu–CeO2. (a) Ceria and (b) 1—Cu(D), 2—Cu(L) (2); (c) 1—Cu(D)–CeO2, 2—Cu(L)–CeO2.
Catalysts 14 00222 g002
Figure 3. SEM images of initial Cu metal powders. (a) The Cu(D) dendrite powder produced by an electrochemical method. (b) The Cu(L) powder prepared by the levitation-jet method.
Catalysts 14 00222 g003
Figure 4. Structure of the Cu(L) particle. (a) A BF image, (b) a DF image of the core in the Cu(200) reflex, (c) a DF image of the shell in the CuO ring, and (d) a grain size distribution histogram.
Catalysts 14 00222 g004
Figure 5. Chemical element distribution in a Cu(L) particle. (a) A HAADF STEM image, (bd) element mapping, and (e) a corresponding EDX spectrum.
Catalysts 14 00222 g005
Figure 6. The structure of CeO2 powder particles after grinding in a ball mill. (a) A BF general view, (b) an HRTEM image of individual particles (black arrows indicate monoatomic steps), (c) a grain size distribution histogram, and (d,e) a DF image of conglomerate particles and corresponding SAED pattern.
Catalysts 14 00222 g006
Figure 7. The structure of Cu–CeO2 composites. (a,b) A general view and a corresponding SAED pattern for Cu(L)–CeO2, (c) a Cu(L)–CeO2 grain size distribution histogram, (d) a general view for Cu (D)-CeO2, and (e) a Cu(D)–CeO2 grain size distribution histogram.
Catalysts 14 00222 g007
Figure 8. Cu(L)–CeO2 composite behavior under electron beam irradiation. (a) An HRTEM image; (b) EDX-mapping, 1 min irradiation; (c) EDX-mapping, 10 min irradiation.
Catalysts 14 00222 g008
Figure 9. Cu(L)–CeO2 composite behavior under electron beam irradiation. (a) An HRTEM image and (b) EDX-mapping, 10 min irradiation.
Catalysts 14 00222 g009
Figure 10. Cu(D)–CeO2 composite behavior under electron beam irradiation. (a) An HRTEM image and (b) EDX-mapping, 10 min irradiation.
Catalysts 14 00222 g010
Figure 11. XPS spectra of Cu(D)–CeO2 and Cu(L)–CeO2 powders. (a) Cu 2p: 1—Cu(D)–CeO2, 2—Cu(L)–CeO2, 3—Cu2O as a reference spectrum; (b) Ce 3d: 1—Cu(D)–CeO2, 2—Cu(L)–CeO2, 3—CeO2, 4—Ce2O3 as a reference spectrum (v, v″, v‴ peaks are attributed to 3d5/2 CeO2 photoemission lines; v and v″ correspond with the mixed configurations of (5d 6s)0 4f2 O 2p4 and (5d 6s)0 4f1 O 2p5; v‴ corresponds to the (5d 6s)0 4f0 O 2p6 configuration in the terminal state of the system; v0 and v’ are attributed to the (5d 6s)0 4f2 O 2p4 and (5d 6s)0 4f1 O 2p5 configurations in Ce2O3; lines u0 … u‴ appear due to spin-orbit splitting (Ce 3d3/2 line) and can be described in a similar way [38,39]); (c) O 1s: 1—Cu(D)–CeO2, 2—Cu(L)–CeO2.
Catalysts 14 00222 g011
Figure 12. CO–TPR curves for 1—Cu(D)–CeO2 and 2—Cu(L)–CeO2 catalysts. (a) TG; (b) MS (m/e = 44, CO2 and m/e = 18, H2O) signal versus temperature, MS signal intensity was normalized to the sample weight; (c) corresponding FTIR measurements for Cu(L)–CeO2 catalysts. Change in the intensity of the absorption band at 1630 cm−1 (δ H-O in H2O) under the heating in 1 is pure He, and in 2 is a mixture of 10 vol.% CO/He.
Catalysts 14 00222 g012
Figure 13. H2–TPR curves for 1—Cu(D)–CeO2; 2—Cu(L)–CeO2; 3—pure Cu2O powder. MS signal (m/e = 18, H2O) intensity was normalized to the sample weight.
Catalysts 14 00222 g013
Figure 14. Temperature dependence of 1—CO conversion and 2—CO2 selectivity. (a) Cu(D)–CeO2, and (b) Cu(L)–CeO2. Reaction mixture: H2:CO:O2 (98:1:1, vol.%).
Catalysts 14 00222 g014
Figure 15. Operando FTIR spectra recorded at different temperatures for Cu(L)–CeO2 catalyst under 1 vol.% CO/He flow: 1—30 °C, 2—70 °C, 3—150 °C, and 4—200 °C.
Catalysts 14 00222 g015
Table 1. The structural parameters and specific surface areas of original and mechanically activated powders.
NoSampleLattice Constant, a (nm)Crystallite Size (nm) 1Specific Surface Area (m2g−1)
1CeO2 original0.541110–1289.0
2CeO2
milled for 30 min
0.5413~1346.5
38 mass% Cu(D)–CeO2
milled for 30 min
0.54149–1239.0
48 mass% Cu(L)–CeO2
milled for 30 min
0.541010–1350.5
1 Calculated on the basis of [31] and by the Scherrer equation derived from the line broadening of Cu {111} peaks.
Table 2. The surface composition of the Cu(D)–CeO2 and Cu(L)–CeO2 samples.
SampleRatio of the Main Components on the Catalyst Surface
Cu/Ce *Cu+/Cu2+ *O/Ce *Os/Ol **
Cu(D)–CeO20.473.805.1365.6
Cu(L)–CeO20.460.543.4225.0
* calculated from the total intensity of all lines; ** Os/Ol = O (b.e. 531.2)/O (b.e. 531.2) + O (b.e. 529.1).
Disclaimer/Publisher’s Note: The statements, opinions and data contained in all publications are solely those of the individual author(s) and contributor(s) and not of MDPI and/or the editor(s). MDPI and/or the editor(s) disclaim responsibility for any injury to people or property resulting from any ideas, methods, instructions or products referred to in the content.

