1. Introduction
Developing highly efficient artificial photoconversion systems over a photocatalyst with a wide wavelength range of light is very challenging [
1]. Titanate and titanate-based wide bandgap semiconductor photocatalysts have been investigated for decades due to their good abundance, biocompatibility, cost effectiveness, photoelectron separation, and long-term thermal stability [
2,
3,
4,
5,
6,
7]. The photocatalytic performance of titanate is strongly dependent on its morphology and structure, as the good nanoscale titanate photocatalysts usually show superior functional properties in the form of nanorods [
8,
9], nanoparticles (NPs) [
10,
11], and hollow spheres [
12]. Specifically, one-dimensional (1D) titanate nanostructures, such as the photocatalytic nanowires (NWs), attract abundant attention because of their large specific surface area and the ease with which the photogenerated charge carriers can transfer along their longitudinal surface [
13,
14,
15,
16,
17]. However, the large bandgap of titanate (3.0~3.2 eV) limits the usability of the wide wavelengths of solar energy [
18,
19,
20,
21]. This limitation is further exacerbated by the rapid recombination of photogenerated electron–hole pairs and the slow transfer of charge carriers in the bulk and on the surface of the nanostructures [
10]. A promising solution has been found in the use of 2D graphene on titanate [
22,
23], which can significantly increase the photocatalysis activity owing to its large surface area, excellent mobility of its charge carriers, and its controllable bandgap. The resultant narrow bandgaps, short transport distances, and accelerated charge mobility have improved the photocatalytic performance of the graphene-on-titanate [
24,
25]. This improvement can help optimize the nanosynthesis for improving the nanocomplex architecture, providing better optoelectronic and photocatalytic properties.
Despite these advancements, the optimal integration of graphene with titanate nanostructures remains a sophisticated endeavor, demanding meticulous control over the composite’s nanoarchitectural design and synthesis. The interfacial interaction between graphene and titanate plays an important role in determining the efficiency of the charge transfer mechanisms, which are essential for enhancing the photocatalytic activity [
26]. By finely tuning the surface properties and the morphology of the titanate nanostructures, it is possible to achieve a more effective spatial separation of photo-generated electron–hole pairs, thus reducing recombination rates. The selection of graphene oxide (GO) or reduced graphene oxide (rGO) as the component in the composite influences the electronic properties of the nanocomposite, including band alignment and charge carrier dynamics [
27,
28]. Through strategic engineering of these nanocomposites, researchers aim to harness the full potential of visible light absorption, thereby overcoming the inherent limitations associated with the wide bandgap of titanate. This approach not only aims to improve the photocatalytic efficiency under a broader spectrum of light but also contributes to the sustainability of the photocatalytic process by utilizing solar energy more effectively.
In this study, a new core–shell nanostructure of titanate NW/GO and a titanate NW/rGO were produced by design as photoelectrodes and photocatalysts, respectively. The new NWs were successfully synthesized by hydrothermal methods and showed a large surface area, high light absorption (UV-Vis-NIR), reduced charge transfer impedance, and a decreased reaction energy barrier. The superior optoelectronic and photocatalytic performance of the nanocomposites was fully demonstrated by the photocurrent and the degradation of methylene blue (MB, a blue-colored drug molecule) under ultraviolet (UV) and visible (Vis) light, with the rGO-titanate NWs exhibiting the highest photocurrent, photo-response, and degradation efficiency when compared with the results for the titanate and GO-titanate NWs. Numerical analysis revealed that the unique structure and chemical assembly of the nanocomposites were responsible for the active photoresponse and photocatalysis. The findings of this study provide new insights into the development of highly efficient and stable photocatalysts for environmental cleaning.
2. Results and Discussion
The process of synthesizing Titanate/GO NWs and Titanate/rGO NWs is clearly illustrated in
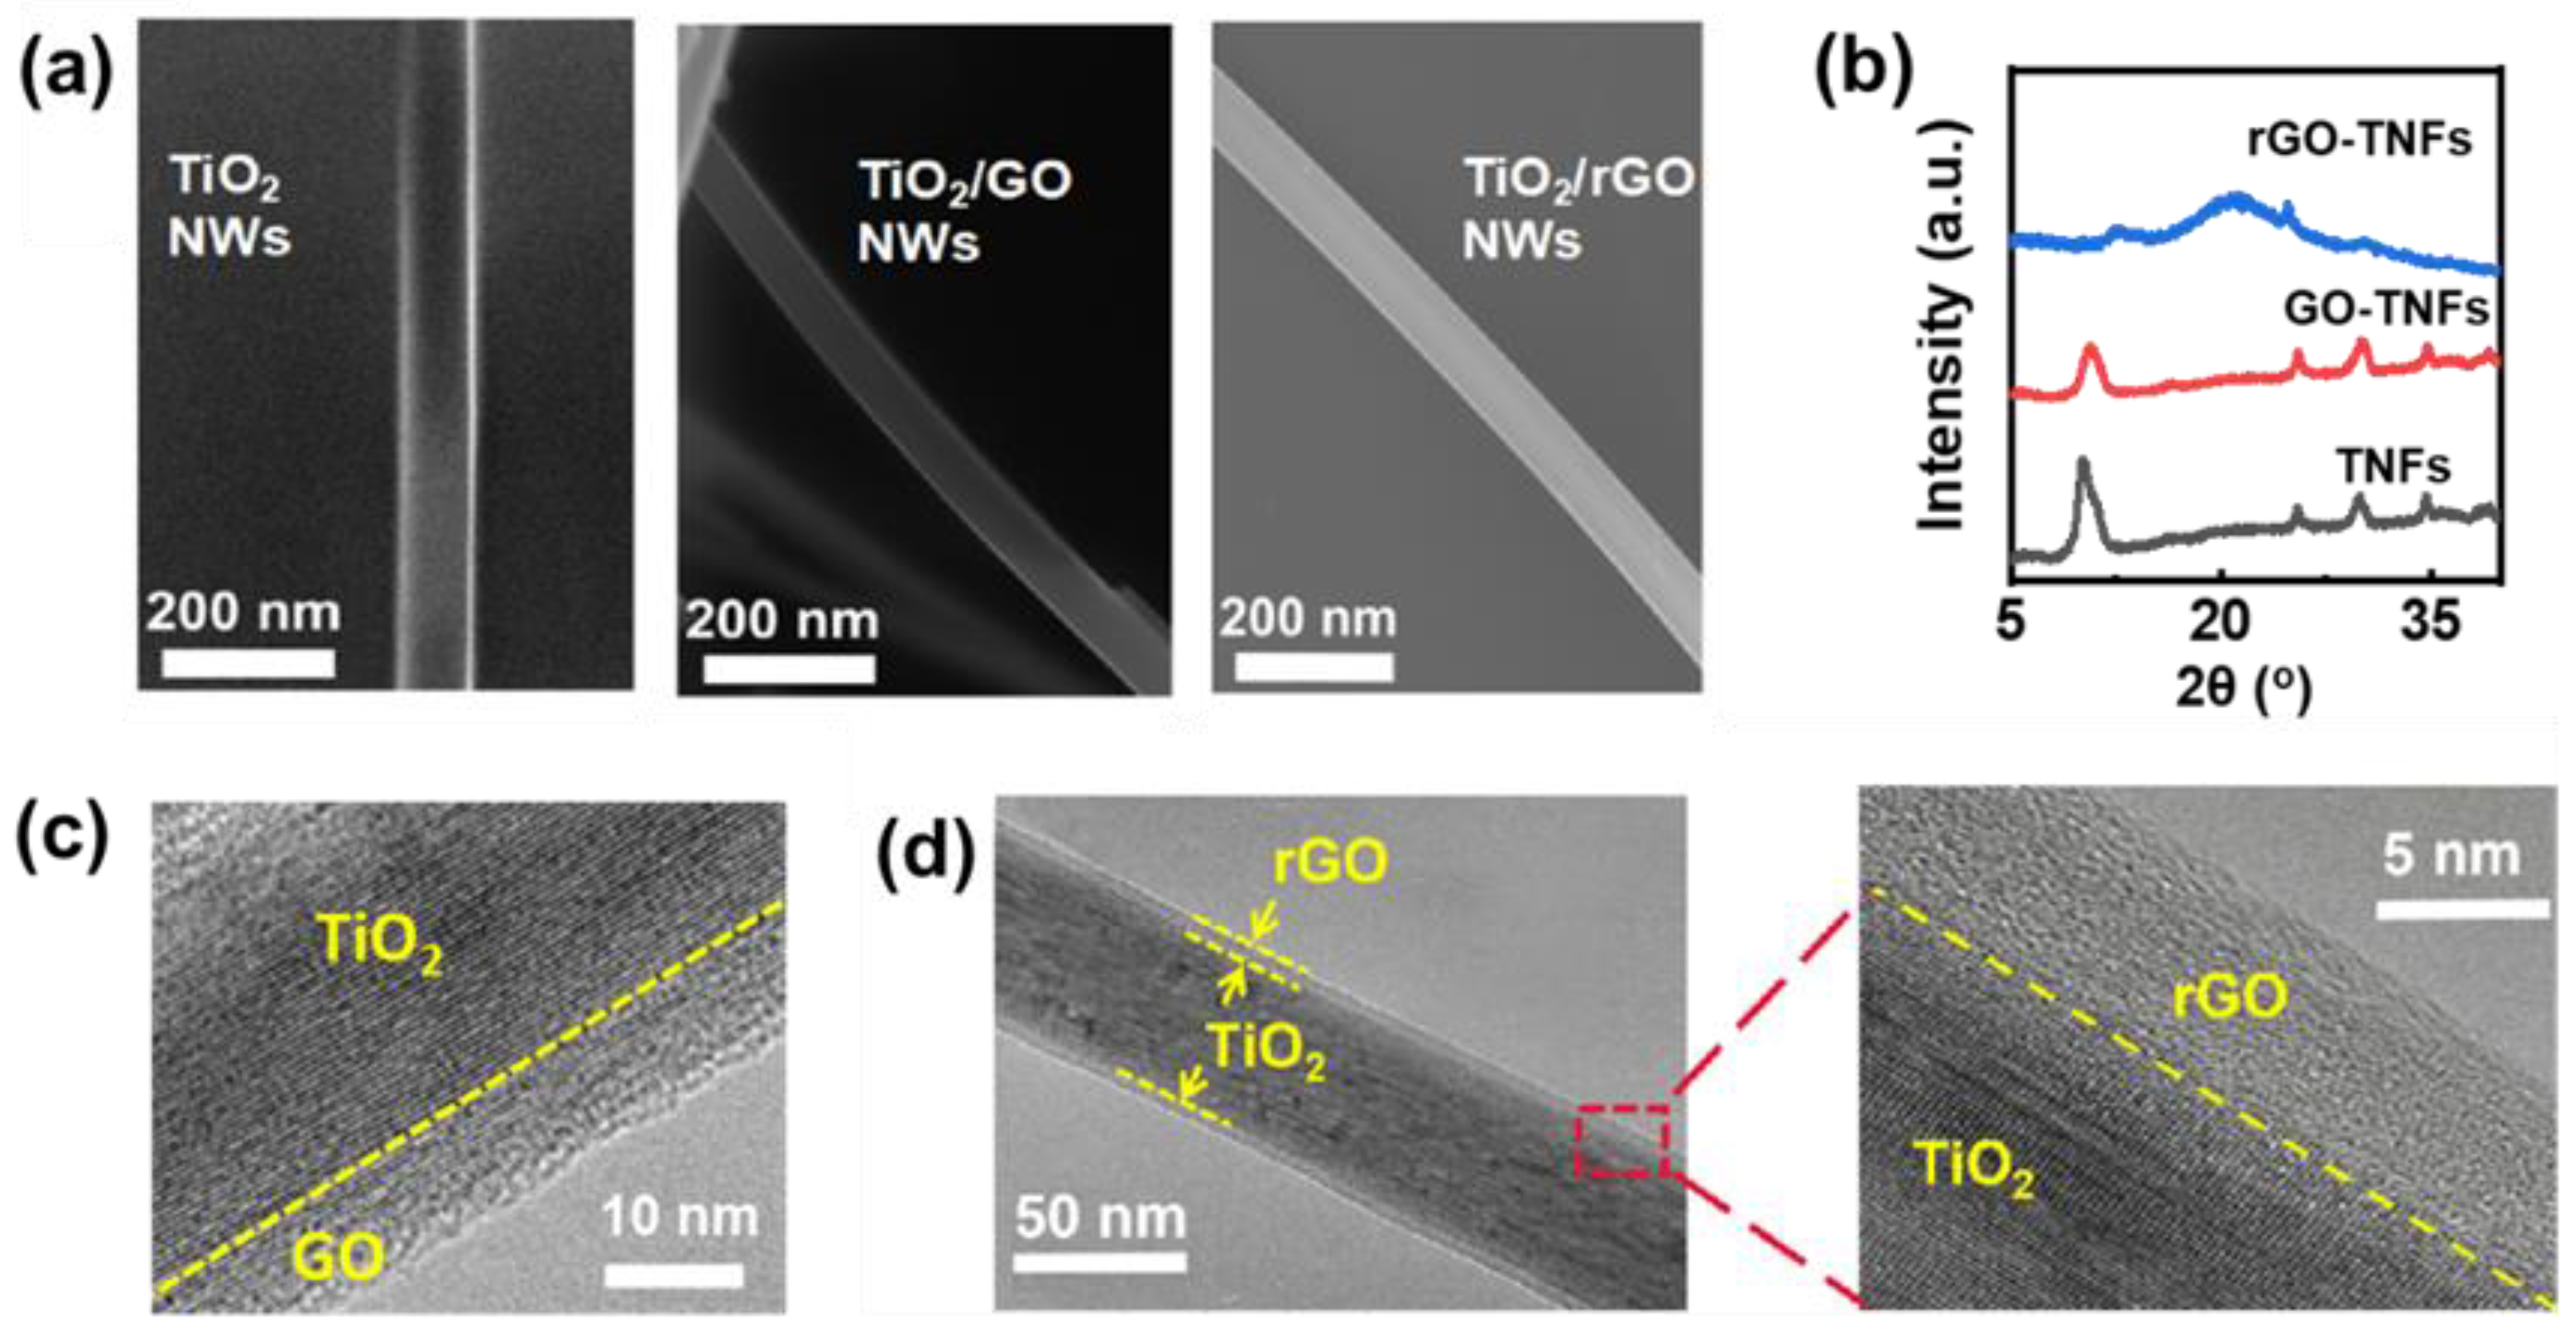
Scheme 1. Initially, Titanate/GO NWs with a core–shell structure were formed hydrothermally by suspending GO and titania powders in NaOH aqueous solution, then reduced to rGO-Titanate NWs at elevated temperatures in the Ar gas environment, approximately 35–40 μm in length and 60 nm in diameter, with a smooth surface and uniform distribution, as shown in
Figure 1a and
Figure S2. The energy dispersive X-ray (EDX) spectrum shown in
Figure S2(a
2) confirmed the elemental components of Ti and O, with a small amount of background C present on the specimen, as well as Si from the substrate, supporting the specimen. The annealing method in an inert gas atmosphere has been proven in the literature to be a simple and effective way to reduce GO to rGO. Moreover, the SAED pattern shown in
Figure S3 revealed the mixed diffraction patterns of the crystalline titanate. The X-ray diffraction (XRD) peaks of titanate NWs (
Figure 1b) at 9.8°, 11.2°, 24.4°, and 29.7° can be assigned to the (001), (200), (110), and (003) faces, respectively, of the monoclinic titanate (Joint Committee on Powder Diffraction Standards 47-0561). Evidently, a broad peak at 18–30° can be attributed to the amorphous phase of rGO, indicating that the GO-titanate NWs have been successfully and effectively reduced to rGO-Titanate NWs by the calcination in the inert gas atmosphere [
29]. As shown in
Figure 1c,d, the rGO shell thickness of the rGO-titanate NWs was reduced from 10 nm to approximately 6 nm, and the morphology was unchanged during the calcination.
On this basis, the core–shell NWs were analyzed using the EDX, FTIR spectroscopy, XPS, and micro-Raman techniques to further confirm that the GO on titanate NWs was successfully reduced to rGO. From the EDX elemental analysis data shown in
Figure 2a,b, the O element ratio decreased from 46.42% (for the GO-Titanate NWs) to 43.73% (for the rGO-Titanate NWs), while the C ratio increased from 1.92% to 3.38%. Consistently, the FTIR peaks shown in
Figure S4 displayed the IR spectra of the samples. The broad and strong absorption band at 400–700 (cm
−1) belonged to the stretching vibration of Ti–O–Ti and Ti–O. The bands at 930 and 1250 (cm
−1) were attributed to the C–O and C–OH groups, respectively, while the band at 1720–1750 (cm
−1) was derived from the carbonyl groups on the GO and rGO edge. The peak at 1630 (cm
−1) was ascribed to the C=O bonds and the deformation vibrations of the absorbed water. The peak at 2900 cm
−1 corresponded to the stretching and bending vibrations of the hydroxyl group in the basal plane and the edge, and the broad band from 3300 to 3500 (cm
−1) was derived from the surface hydroxyl group or the absorbed water molecules. On the TiO
2/rGO NWs, these modes were mostly diminished from the oxygen-containing functional groups, which supports the reduction of GO to rGO, which is in line with other reports [
30]. The micro-Raman spectra of the samples are presented in
Figure S5. The peaks at 142, 194, 400, 517, and 645 cm
−1 correspond to the Raman modes of Eg
(1), Eg
(2), B1g
(1), A1g+B1g
(2), and Eg
(3) of the titanate [
31], respectively. Additionally, two broad bands were observed at approximately 1348 cm
−1 and 1592 cm
−1 (
Figure 2c), which were attributed to the disordered amorphous carbon (the D band) and the graphitic sp
2 carbon (the G band) [
31]. The ID/IG ratio was approximately 0.9 (with ID and IG corresponding to the intensity of the D band and G band, respectively), which confirmed the presence of the GO or rGO layer on the TiO
2 NWs. The low content of GO or rGO in the hybrid composites resulted in no significant shift of the D band and G band. In parallel, the XPS was employed to analyze the element chemical state. The spectra demonstrated the presence of O, Ti, and C in the Titanate NWs, Titanate/GO NWs, and Titanate/rGO NWs (
Figure S6). The O 1s spectra exhibited two distinct peaks. Specifically, for Titanate NWs, the two peaks at 531.2 eV and 529.9 eV can be attributed to the C–O and Ti–O groups, respectively. The incorporation of the GO and rGO shells results in a blue shift of the Ti–O band at 530.1 eV, indicating the interaction and binding between the GO (rGO)-shell and the Titanate-core. In the C 1s spectra (
Figure 2d), there are three distinct peaks: the 284.7 (eV) from the C–C and C=C, the 286.8 (eV) from C–O–C and C–O–H, and the 288.6 (eV) from O–C=O and C–O–Ti, respectively. Apparently, the C–O–C, C–O–H, O–C=O, and C–O–Ti peaks of the rGO-titanate NWs were reduced significantly compared with those of the GO-titanate NWs. Based on the EDX, FTIR, and XPS data, the GO was largely reduced to the rGO during the calcination, and the titanate nanowires were well wrapped with the GO or rGO, which agreed with the results of the XRD and Raman analyses.
Figure S6c showed the Ti 2p spectra of all the specimens, indicating that the titanium elements in the samples were in the form of the Ti
4+ value, as evidenced by the energy difference between the Ti 2p
3/2 and Ti 2p
1/2 peaks of 5.7 eV. Comparing Titanate NWs with Titanate/GO and Titanate/rGO NWs, the GO and rGO shells caused a blue shift of 0.3 eV and 0.1 eV, respectively for the two bands, implying chemical bonding between the core and the shell. Overall, the XPS data provided a new insight into the elemental composition and chemical state of the specimens, revealing interaction and binding between the core and the shell.
To further support the photocatalysis performance of NWs, the optoelectronic properties were characterized by means of the UV-Vis absorption and photocurrent response experiments, which are supported using the finite element analysis-based theoretical simulation. The theoretical analysis indicates that the oxidation level of GO is related to the GO bandgap [
17]. GO is a non-crystalline material with different oxidation-containing functional groups, so a sharp adsorption edge with a precise bandgap energy cannot be observed in the conversion plots. Therein, the Tauc plots derived from the UV-Vis absorption spectra were employed to determine the NW bandgap (as depicted in
Figure 3a,b), showing that the rGO-titanate NW’s bandgap was significantly reduced to 2.75 eV (vs. titanate’s 3.23 eV and GO-titanate 2.98 eV), which further expanded the range of light absorption wavelengths to improve the photocatalytic performance, as shown by the UV-Vis absorption spectra of the specimens in
Figure S7, where the absorption in the ultraviolet region for all the samples confirmed the band absorption of anatase TiO
2. Moreover, the rGO flakes, Titanate, and Titanate/rGO core–shell were further characterized from 400 nm to 1000 nm by hyper spectrometer imaging (HSI) in the visible and near-IR (NIR) wavelengths (
Figure S8), revealing the absorption of Titanate/rGO to be significantly greater more than that of Titanate NWs. This new HSI data suggests that the core–shell nanocomposite of Titanate/rGO can help to better utilize the diffusive solar energy in the photocatalysis. The increased sunlight absorption could possibly generate more electron–hole pairs, thereby leading to improved photoresponse and photocatalytic performance.
The photocurrent response of the nanocomposites under intermittent UV light is shown in
Figure 3c,d, where all the photoanodes exhibit a rapid photoresponse as the photocurrent (which is nearly negligible in the dark) increases instantly to its maximum within 0.1–0.2 s upon exposure to light. The photocurrent of rGO-titanate (2.50 μA) is about 3 and 1.3 times that of GO-titanate and titanate NWs, respectively. The reduction in the photocurrent for Titanate/GO NWs is attributed to the insulating characteristics of the GO layer, whereas the increase in the photocurrent for Titanate/rGO NWs is apparently due to the conductive properties and suppression of charge recombination by the rGO layer. These findings are consistent with the bandgap variation shown in
Figure 3b. To further understand the active photoresponse and photocatalytic behavior, the charge distribution of the NWs under light irradiation was studied using finite element analysis, providing the charge density at the cross section of the NWs under the incident light (254 and 420 nm, respectively), as illustrated in
Figure 3e,f. Intuitively, the negative charges should be confined to the naked cations on the titanate core surface, allowing the positive charges to be dissipated along the rGO shell more quickly than that along the GO shell. This could explain the photocurrent charge separation on the rGO-titanate being better than that on the GO coated NWs, which boosted the photocatalysis performance of the rGO-titanate.
To enhance our understanding of the charge transfer kinetics and physiochemical properties of the NWs, electrochemical methods were employed. The Nyquist plots of the impedance spectra in
Figure 4a fitted well with an equivalent circuit to obtain the bulk resistances and charge transfer resistances of the NWs. The bulk resistances of the GO-titanate and rGO-titanate NWs (
Figure 4b) were significantly decreased compared with those of the pure titanate NWs because of the conductivity improvement obtained from the reduction of GO. As shown in
Figure 4c, there was a progressive decrease in the charge transfer resistances from the titanate to the GO-titanate and to the rGO-titanate NWs, indicating that the rGO coating significantly enhanced the photocatalysis performance by accelerating the charge transfer rate across the interface between the solid nanowire surface and the liquid solutions.
Table 1 presents the pore size, volume, and surface area obtained from the N
2 adsorption–desorption isotherms of the specimens depicted in
Figure S9. Furthermore,
Figure S9 shows that Titanate/GO NWs had the largest specific surface area of 15.32 m
2/g, which was a 23% improvement over that of Titanate NWs and was attributed to the high specific surface area of the GO layer. However, the annealing decreased the specific surface area, presumably due to the collapse of the three-dimensional porous structure. From a chemical perspective, the weakened inter-bonding of the rGO flakes (which was much weaker than that of the GO flakes) could minimize the 3D-stacking of the NW/rGO type of 1D-nanocomposites, which matched their pore size and pore volume. Nevertheless, the surface area of Titanate/rGO NWs (14.55 m
2/g) was still larger than that of the pure Titanate NWs (12.50 m
2/g), which could provide more active sites for dye molecule absorption and photocatalytic degradation. Meanwhile, the rGO shell on the NWs provides a large surface area, with numerous defects and dangling bonds to improve the physical adsorption and kinetic mass-transfer of the dye molecules [
32] and efficiently boosting the photocatalysis kinetics. Evidently, the charge transfer energy barrier on the rGO-titanate NWs was significantly decreased by reducing the reversible potential and increasing the exchanged current density, as shown in
Figure 4d, with respect to that noted for the pure titanate and the GO-titanate NWs, as shown in the
Figure 4e,f, which further aided the charge transfer process and improved the photocatalysis efficiency.
To assess the photocatalytic activity of the specimens, the degradation of methylene blue (MB) dyes, as catalyzed by the specimens under both visible and UV light, was carried out. The intensity of the absorption band of the MB aqueous solutions continuously decreases with increased irradiation time (see
Figure S10), indicating the photocatalytic ability of all the TiO
2-based specimens.
Figure 5a shows that the logarithmic percentages of the residual dye molecules were linearly fitted with the UV illumination time, indicating that the MB degradation process was a first-order kinetic process. The rGO-titanate core–shell exhibits the most effective photocatalytic performance (
Figure 5b). Notably, compared with titanate NWs and GO-titanate NWs under visible illumination, the photocatalytic performance of the rGO-titanate core–shell NW for MB degradation under UV light was significantly improved (
Figure 5c,d). This time, the dye solution is completely bleached in ~30 min by the Titanate/rGO, in 60 min by the Titanate NWs, and in >90 min by the Titanate/GO. This confirms the superior photocatalytic activity of the NW/rGO, by design.
Mechanistically, the novel structure and well-integrated surface chemistry and physics of the design resulted in high kinetic charge transportation, a low surface energy barrier, and a large surface area for the rGO-titanate NW to enhance the sorption and mass transfer of the dye molecules to boost the photocatalytic dye degradation (
Figure S11). Evidently, the tight bonding between the conductive rGO shell and the wide bandgap titanate NW core facilitated the photo-excited charge separation, docking, and transport. The excited photoelectrons migrated to the graphene surface via the bonding between the rGO and the titanate, allowing the rGO act as an electron acceptor to effectively suppress the charge recombination. The photoelectrons could also be scavenged by O
2 to produce reactive superoxide radicals (•O
2−), while the holes can be trapped by H
2O to produce hydroxyl radicals (•OH), docking on the core (to quench the quick combination), and reacting with (or decomposing) the dye molecules, a result which should be verified using future experimental measurements in the follow-up work.
3. Materials and Methods
3.1. Materials
The chemical reagents used in this study include graphene oxide (GO, 98%, Suzhou Tanfeng Graphene Technology Co., Ltd. Suzhou, China), titanium dioxide (TiO2 in rutile, 99.5%, Shanghai Keyan Industrial Co. Ltd., Shanghai, China), Nafion solution (5%, DuPont, Wilmington, DE, USA), sodium hydroxide (NaOH, 96%, Xilong Chemical Co. Ltd., Shantou, China), and methylene blue (MB, 98.5%, Xilong Chemical Co. Ltd., Guangdong, China). The distilled water was purified to show the resistivity higher than 18.0 MΩ.cm, by means of a high-tech laboratory water purification system. All reagents were used as received, without further purification.
3.2. Nanosynthesis Process
The core–shell Titanate/GO NWs were created using a hydrothermal method at elevated temperature and pressure. Typically, 0.10 g of GO power was exfoliated in 40 mL H
2O by ultrasonic treatment for 1 h, then 1.00 g of TiO
2 powder and 16.00 g of NaOH were added and stirred for 2 h, then sealed in a Teflon-lined autoclave and heated at 200–250 °C for 2–4 days [
29,
33,
34,
35,
36], forming the new core–shell Titanate/GO NWs. For comparison, the titanate NWs were synthesized using the same process in the absence of GO. The achieved product was cleaned 7–8 times using vacuum filtration in HCl solution (0.1 M) and DI water. The as-synthesized titanate/GO NWs and the titanate NWs were thermally treated at 680–750 °C for 1–3 h with Ar gas as a protective atmosphere to crystallize the titanate NWs and to reduce the GO into rGO through pyrolysis.
3.3. Characterizations
The morphology, structure, and chemical composition of the as-synthesized samples were characterized by means of the ZEISS Sigma scanning electron microscope (SEM, Carl Zeiss AG, Oberkochen, Germany) and the Tecnai F30 high resolution transmission electron microscope (HRTEM, FEI Company, Hillsboro, OR, USA), both equipped with the energy dispersive spectroscopes (EDS), the X’Pert PRO X-ray diffractometer (XRD, PANalytical B.V., Almelo, The Netherlands) with Cu Ka radiation (λ = 1.54056 Å), and a PHI Quantum-2000 X-ray photoelectron spectroscope (XPS, Physical Electronics Inc., Eden Prairie, Chanhassen, MN, USA) with a nonmonochromatized Al Kα X-ray (1486.6 eV) as the excitation source and C 1s as the reference line. Then, the FT-IR spectra in the range of 400~4000 cm−1 were collected on the Nicolet iS50 FT-IR spectrophotometer (Thermo Fisher Scientific, Waltham, MA, USA) using pellets of the samples mixed in KBr. The resonant micro-Raman scattering spectra were collected using back-scattering geometry on a Renishaw LabRAM-HR Raman microscope (Renishaw, Gloucestershire, UK) using a 325 nm (He-Cd) laser excitation source. The diffuse reflection and absorption spectra were tested on the UV-Vis-NIR spectrophotometer (Agilent Carry-5000, Agilent Technologies, Santa Clara, CA, USA). The surface area and pore size distribution of the samples were measured using a surface area analyzer (Micromeritics ASAP2420, Micromeritics Instrument Corp., Norcross, GA, USA), and the pore-size distribution (PSD) was obtained using the density functional theory (DFT) model based on the N2 sorption isotherm.
3.4. Photoelectrochemical Measurement
The photoelectrochemical properties, including photoresponse and AC impedance, were conducted employing an electrochemical workstation (Chenhua CHI660E, Shanghai, China) using a three-electrode cell. Specifically, the prepared nanomaterials were coated on an FTO electrode as a working electrode, a Pt wire functioned as a counter electrode, and Ag/AgCl was used as a reference electrode. To prepare the working FTO-based electrode, firstly, the FTO glass slides were cleaned using a meticulous sequence involving deionized water, acetone, and anhydrous ethanol. Secondly, the synthesized NW sample was dispersed in Nafion solution ((5%, DuPont, Wilmington, DE, USA) and anhydrous ethanol via ultrasonication for uniformity. Lastly, the mixture was precisely applied onto the cleaned FTO glass and dried at 70 °C, ensuring a consistent electrode surface for measurement. For the transient photocurrent experiments, a low-power UV-LED (3 W, 365–370 nm, 4 mW/cm2, Qingdao Jason Electric Co., Ltd., Qingdao, China) was used as a light source, and a 0.1 M Na2SO4 aqueous solution was employed as the electrolyte. Frequency signals of the UV light were modulated by a function waveform generator (AFG-2225, GW Instek, New Taipei City, China) with a 0.1 Hz square wave at a fixed potential of 1 V. For the working electrodes, the prepared samples (5 and 20 g/L in 1% Nafion solution) were drop-cast smoothly on a cleaned FTO (1 × 2 cm2) glass plate surface for about 0.05 mL/cm2 and then dried at 60 °C for 30 min. The AC impedance spectra were measured in a 0.5 M Na2SO4 aqueous solution in a frequency range of 0.01~105 Hz with a bias of ~−0.4 V. For cyclic voltammetry (CV), the working electrode was glassy carbon electrode coated with 4 μg nanofibers, then scanned in a 10 mM K3Fe(CN)6 and 1 M KNO3 solution, after drying, from 0.8 V to −0.2 V vs. Ag/AgCl reference electrode, with the scanning rate of 10 mV/s, 20 mV/s, 50 mV/s, and 100 mV/s, to obtain the Tafel plot, diffusion coefficient, and exchanged current density.
The Tafel equation is an electrochemical kinetics equation relating the rate of an electrochemical reaction to the overpotential, which is used to plot the Tafel diagram. The Tafel equation can be stated as:
where a plus sign under the exponent refers to an anodic reaction, and a minus sign to a cathodic reaction, η is the overpotential (V), A is the Tafel slope (V), i is the current density (A/cm
2), and i
0 is the exchange current density (A/m
2). The exchange current density was obtained from the Tafel plot.
The Randles–Sevcik equation was used to calculate the diffusion coefficient.
where i
p is the current maximum in amps, n is the number of electrons transferred in the redox event, A is the electrode area in cm
2; D is the diffusion coefficient in cm
2/s, C is the concentration of K
3Fe(CN)
6 in mol/cm
3, and ν is the scan rate in V/s.
3.5. Photocatalytic Performance
The photocatalytic ability of the specimens was tested in a house-built photocatalytic workstation (see
Figure S1). The photoreactor was designed to operate within a dark chamber, featuring a striped light source encased in a quartz sleeve. This design ensured that the suspension, containing the nano-catalyst and an MB aqueous solution (130 mL, 10 mg/L), was uniformly exposed to the light. and 711.1 nm were used, respectively, for the irradiation. The light intensity in the solution was adjusted to reach ~138.2 mW cm
−2, which was measured using a light dynamometer (FZ-A) from Photoelectric Instrument Factory of Beijing Normal University (Beijing, China). Under light irradiation, the solution underwent magnetic stirring, and the temperature of the solution was maintained at 24 °C by circulating the water through an external cooling system. At a given time interval, a sample of the reaction solution was removed, centrifuged, and filtered out. Finally, the filtrate concentration was determined by measuring the absorbance on an Agilent Carry-5000 UV-Vis-NIR spectrophotometer (Agilent Technologies, Santa Clara, CA, USA).
3.6. Simulation
The polarized charge density of the core–shell specimens, as caused by the electromagnetic field of the incident light, was calculated using finite element analysis. The length of NWs was set to be infinite, while the size of the core and the shell was set to be the mean value of our experiment. The titanate NW’s core diameter, the GO shell thickness, and the rGO shell thickness were 70 nm, 9 nm, and 6 nm, respectively. The specimens were irradiated by the longitudinal magnetic plane wave in air. The complex refractive indices of air, titanate, GO, and rGO were obtained from the simulation solution database and the applicable literature [
10]. The periodic incident light source port was used as the boundary condition in the simulation.

 ,
, 


