Article

Dilute Alloy Catalysts for the Synthesis of Isobutanol via the Guerbet Route: A Comprehensive Study

1
Institute of Energy and Climate Research, IEK-14: Electrochemical Process Engineering, Forschungszentrum Jülich GmbH, Wilhelm-Johnen-Str. 1, 52425 Jülich, Germany
2
Chair for Fuel Cells, Faculty of Mechanical Engineering, RWTH Aachen University, 52062 Aachen, Germany
3
École Polytechnique Fédérale de Lausanne (EPFL), Institute for Chemical Sciences and Engineering, 1015 Lausanne, Switzerland
4
Faculty of Mechanical Engineering, Ruhr-Universität Bochum, Universitätsstr. 150, 44801 Bochum, Germany
*
Author to whom correspondence should be addressed.
Catalysts 2024, 14(3), 215; https://doi.org/10.3390/catal14030215
Submission received: 14 February 2024 / Revised: 4 March 2024 / Accepted: 6 March 2024 / Published: 21 March 2024

Abstract

:
This study investigates the potential of bimetallic alloy catalysts, specifically Ni99Pt1, Cu99Ni1, Cu99Fe1, Fe99Pt1, and Fe99Pd1, for the synthesis of isobutanol via the Guerbet route. The catalysts were synthesized with a doping of 1 at% Ni, Fe, Pt, and Pd in the base metals Fe, Cu, and Ni. The catalytic properties of these bimetallic alloy catalysts were explored for their potential for promoting the Guerbet reaction. The study aims to test the usability of the theoretically predicted d-band values in the synthesized bimetallic catalysts, which were prepared by means of incipient wetness impregnation, and shows that doping amounts smaller than 1 at% already significantly improved the catalytic activity of the base metals. In particular, the doping of nickel with platinum yielded an effective catalyst for the synthesis of isobutanol via the Guerbet pathway. The Ni99Pt1/C catalyst from the presented experiments had the highest Space Time Yield (STY) and is, therefore, also a promising catalyst for the hydrogen-borrowing reactions class.

1. Introduction

Bimetallic alloy catalysts have garnered considerable attention in catalysis research owing to their distinctive properties and superior catalytic performance compared to their monometallic counterparts. By incorporating two different metals, bimetallic catalysts offer the opportunity to customize their electronic and geometric structures, thereby enhancing catalytic activity, selectivity, and stability [1,2,3]. Their utilization spans various catalytic processes such as hydrogenation, dehydrogenation, oxidation, and carbon–carbon bond formation reactions [4,5,6]. The synergistic effects arising from metal–metal interactions in bimetallic catalysts significantly influence their catalytic properties, making them viable for facilitating complex chemical transformations [7,8].
The Guerbet reaction, which entails the dimerization of primary alcohols to yield higher alcohols, represents a pivotal transformation in the synthesis of valuable chemicals and fuels. Isobutanol, used in gasoline or in solvents directly or as a key intermediate for gasoline additives, can be synthesized via the Guerbet route. Efficient catalysts are crucial for the dimerization of lower alcohols in the Guerbet reaction, and bimetallic alloy catalysts have shown promise in this regard [9,10].
In our recent work, we demonstrated that the d-band model, developed by Hammer and Nørskov [11], provides a robust explanation for the reactivity trend of monometallic catalysts with d-metals [12]. Widely acknowledged in the scientific community, the d-band model correlates the d-band center with reactivity across various chemical reactions. Thus, our focus on investigating the influence of the d-band center on isobutanol synthesis aligns with the established understanding of the d-band model’s implications for catalysis and organic chemistry.
The d-band properties of bimetallic catalysts have been extensively studied both theoretically and experimentally. Density functional theory (DFT) calculations have elucidated the effects of non-Pt metals on the d-band electron level, offering insights into bimetallic catalysts’ activity [13]. Theoretical investigations have also illuminated bimetallic catalyst-catalyzed reaction mechanisms and catalytic performance [14]. Experimental studies have demonstrated the influence of surface composition on catalytic behavior, indicating that certain bimetallic catalysts exhibit stable clusters on the surface under different CO coverages [15,16]. Furthermore, theoretical investigations have provided insights into the catalytic mechanisms and energetics for various reactions on bimetallic catalysts, highlighting fundamental surface processes [3,17]. For example, a NiCu3/C catalyst exhibited outstanding performance in the oxygen evolution reaction (OER), even surpassing RuO2 as a benchmark catalyst [3]. The correlation between the surface d-band center and adsorbate binding strength enables predictions of optimal bimetallic surfaces for hydrogenation reactions [18].
Although the d-band model has shown correlations between the d-band center and catalytic activity in various chemical reactions [19], it is important to consider its limitations and challenges. Several studies indicate that the continuous dependence of the activity on the d-band center position is not universally supported [20]. Additionally, the correlation between the d-band center and catalytic activity may not be straightforward in heterogeneous catalysis. Moreover, the applicability of the d-band model to conventional heterogeneous catalysis has been questioned [21].
In this study, we aim to test bimetallic catalysts with predicted d-band centers in the range of −2.8 eV to −2 eV in the synthesis of isobutanol, since catalysts in this region showed high productivity in terms of TOF in our former experiments stated above [12]. Ruban et al. calculated the d-band centers for the materials Cu99Ni1, Cu99Fe1, Ni99Pt1, Fe99Pd1, and Fe99Pt1 in the range of −2.01 eV to −2.40 eV when the surface of the base metal (Cu, Ni, Fe) was doped with one percent of the dopant metal (Ni, Fe, Pt, or Pd). If monolayers are formed, the values for the materials fall within the range of −2.24 eV to −2.82 eV [22]. The unique electronic and structural properties of bimetallic alloy catalysts make them promising candidates for catalyzing the Guerbet reaction, offering potential improvements in selectivity and activity compared to traditional catalysts. NiPt catalysts have shown great performance in reforming reactions [23,24] and decomposition of hydrazine for hydrogen production [25,26]. CuNi catalysts have been used for the ethanol decomposition reaction [27], furfural hydrogenation [28], CO oxidation [29], the water–gas shift reaction [30], as well as CuFe-catalysts, in the higher alcohol synthesis [31]. FePt nanoparticles have been used for CO oxidation [32], hydrogenation [33], and hydrodeoxygenation [34]. Next to the usage as a hydrogen transfer catalyst [35], it can be shown that the alloying of Fe and Pd leads to a stable bimetallic catalyst with enhanced activity in the electrochemical ethanol oxidation reaction and is correlated with a shift in the d-band values of Pd [36]. We investigated the catalytic performance of bimetallic alloy catalysts Ni99Pt1, Cu99Ni1, Cu99Fe1, Fe99Pt1, and Fe99Pd1 for the synthesis of isobutanol via the Guerbet route. Incorporating Ni, Fe, Pt, and Pd in the base metals Fe, Cu, and Ni is expected to impart unique catalytic properties to the bimetallic alloy catalysts, potentially enhancing their performance in the Guerbet reaction. This study entails a wide-ranging analysis of the structure–activity relationships and catalytic behavior of bimetallic alloy catalysts, providing insights into their potential for promoting not only their usage in the Guerbet reaction, but also other reactions where hydrogen–metal interactions play a significant role.

2. Results

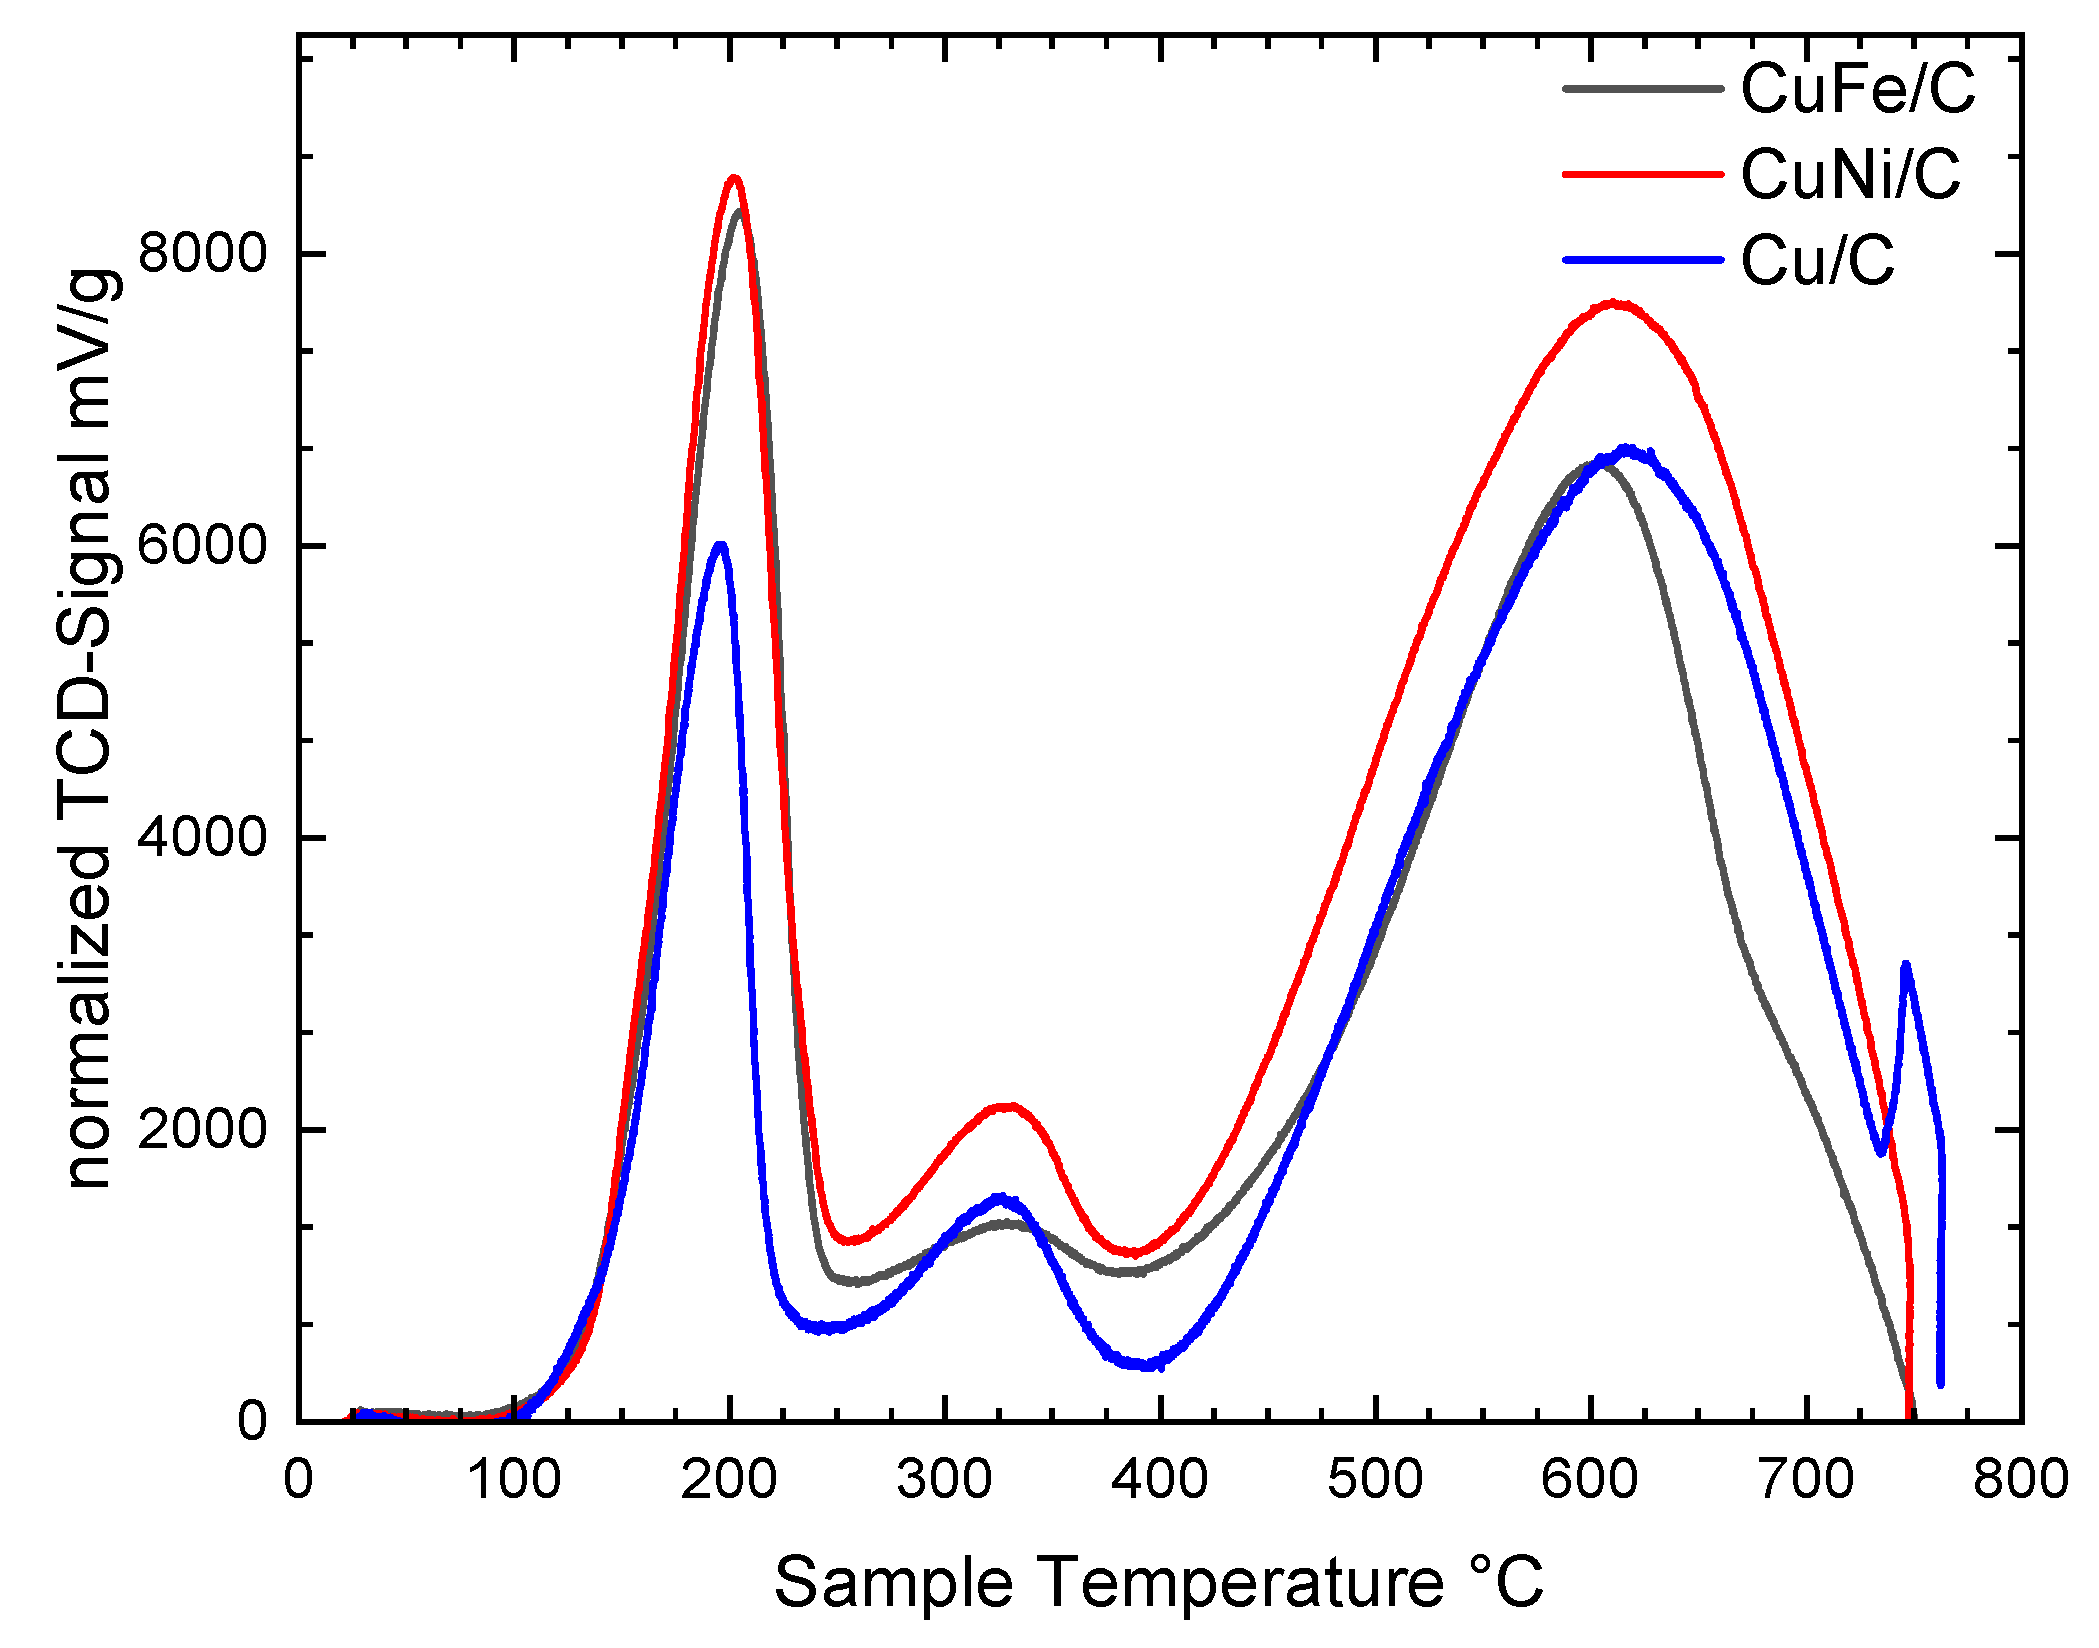
2.1. Characterization of Cu-Based Catalysts

In Figure 1, diffractograms of the copper-based catalysts are presented, covering the range from 30° to 90°.
Activated carbon served as a background for the phase analyses, shown in blue in the diagram. It exhibits no reflexes from crystalline sp3-hybridized carbon or crystalline graphitic phases, only a broad amorphous peak at 43.5° and 80°. For copper, the calculated reflexes for the crystal planes ( 111 ) , ( 200 ) , ( 220 ) , and ( 311 ) are presented [37].
The Cu/C catalyst serves as a reference material, exhibiting only Cu reflexes with positions slightly shifted to higher angles, matching literature values for pure copper powder [38,39,40]. The crystalline metal domains average (37.4 ± 1.9) nm along the 〈100〉 crystal directions, exhibiting isotropic behavior.
The phase analysis of the Cu99Fe1/C catalyst indicates a pure copper phase with no iron present, as depicted in Figure 1. The average crystallite size is (34.6 ± 0.6) nm along the 100 crystal directions, with lattice parameter a matching literature values for pure copper [38,39,40].
The Cu99Ni1/C catalyst also reveals a pure copper phase. Consideration of a NiII oxide phase for the Rietveld refinement suggests its presence in small amounts, with a phase fraction between 2% and 6%. The determined chemical composition of the crystalline material is 93.70% copper, 1.29% nickel, and 1.11% oxygen.
The calcination of the catalysts at 500 °C results in the decomposition of nitrates, forming oxides, which are subsequently reduced with activated carbon. Despite reducing conditions, the presence of the nickel(II) oxide phase is attributed to the partial oxidation of metals during calcination, with copper oxide segregating to the surface of Cu–Ni particles [41].
The summarized results of the phase analysis for Cu catalysts are presented in Table 1.
The proportion of reducible compounds in the catalyst materials Cu/C, Cu99Fe1/C, and Cu99Ni1/C after calcination was investigated using TPR measurements. Reduction curves for these copper-based catalyst materials are depicted in Figure 2.
Three prominent reduction peaks at 180 °C, 320 °C, and 600 °C were observed for all three materials. The graphs with the fit parameters for the Gaussian functions are provided in the Supplementary Materials in Figures S3–S5.
Literature uncertainties persist regarding the evaluation of TPR measurements of copper oxides supported on various materials. The support material, dispersion, and reduction conditions significantly influence the reduction processes, necessitating assumptions for data interpretation. For instance, the oxidation of elemental copper progresses stepwise from elemental copper through copper(I) to copper(II) [42]. However, the reduction of copper(II) may occur directly from Cu2+ to Cu0 or via the less stable compound Cu2O, depending on the reaction parameters. During reduction with hydrogen, metastable suboxides (CuO1−x  0 < x < 0.5 ) may form, transitioning to copper(I) oxide if sufficient time and energy for rearrangement are available [43].
The Cu/C catalyst exhibits reduction peaks at 188 °C, 313 °C, and 607 °C, the first two corresponding to the conversion of larger and smaller CuO particles to elemental copper, while the third corresponds to the reduction of Cu2O [44]. The amount of reducible copper is highest as copper(I) oxide after calcination, but the origin of copper(I) oxide remains unclear from the existing literature [43]. The sum of the reduction peaks yields a mass fraction of copper of 4.42%.
For doped catalyst materials, the first reduction peak shifts to higher values by 9 K for Cu99Ni/C and by 10 K for Cu99Fe/C. Additionally, the percentage area of the peak for doped catalysts increases, indicating enhanced reducibility. The obtained peak positions, areas, and calculated hydrogen consumption are listed in Table 2.
The obtained copper mass fractions align closely with the targeted loading of 5%, corroborated by measurements from ICP–OES (see Table S4).
Figure 3a,b present representative scanning transmission electron microscopy (TEM) images of the copper-based catalyst materials following calcination and reduction in the tube furnace.
For the Cu99Ni1/C catalyst, a wide particle size distribution is observed, ranging from 9.76 nm to 94.39 nm, with 50% of particles having diameters in the range of 18.83 nm to 43.03 nm. The median particle diameter is 26.31 nm. In Figure 3a, metal particles are heterogeneously distributed on the carbon support, with those below 30 nm exhibiting a homogeneous distribution. Close examination (Figure 3a(d)) reveals particles with a 20 nm diameter lacking crystalline domains, but having a dense core surrounded by a less dense shell, which may be indicative of an oxide layer formed upon air exposure. STEM–EDX measurements showed no signals for nickel, suggesting a homogeneous alloy of nickel and copper.
Similarly, the Cu99Fe1/C catalyst exhibits a broad particle size distribution (3.77 nm to 117.33 nm), with half of the particles falling within 15.08 nm and 31.76 nm and a median diameter of 22.30 nm. In Figure 3b, metal particles display a more homogeneous distribution over the support surface compared to the Cu99Ni1/C catalyst. Close inspection (Figure 3b(b,c)) reveals particles with an inhomogeneous pattern, likely indicating partial oxidation, with the core protected. STEM–EDX measurements also showed no signals for iron, suggesting the presence of a homogeneous alloy of the two metals.
In summary, the XRD analysis (Figure 1) confirmed the successful and homogeneous doping of copper, as only Cu reflections were observed. Although a small nickel oxide phase was detected in the Cu99Ni1/C catalyst, STEM–EDX measurements suggested alloy formation without segregation or enrichment. The particle dispersion of the Cu99Ni1/C catalyst is slightly lower than that of the Cu99Fe1/C catalyst, with the latter exhibiting particles that are more tightly dispersed within a smaller range.

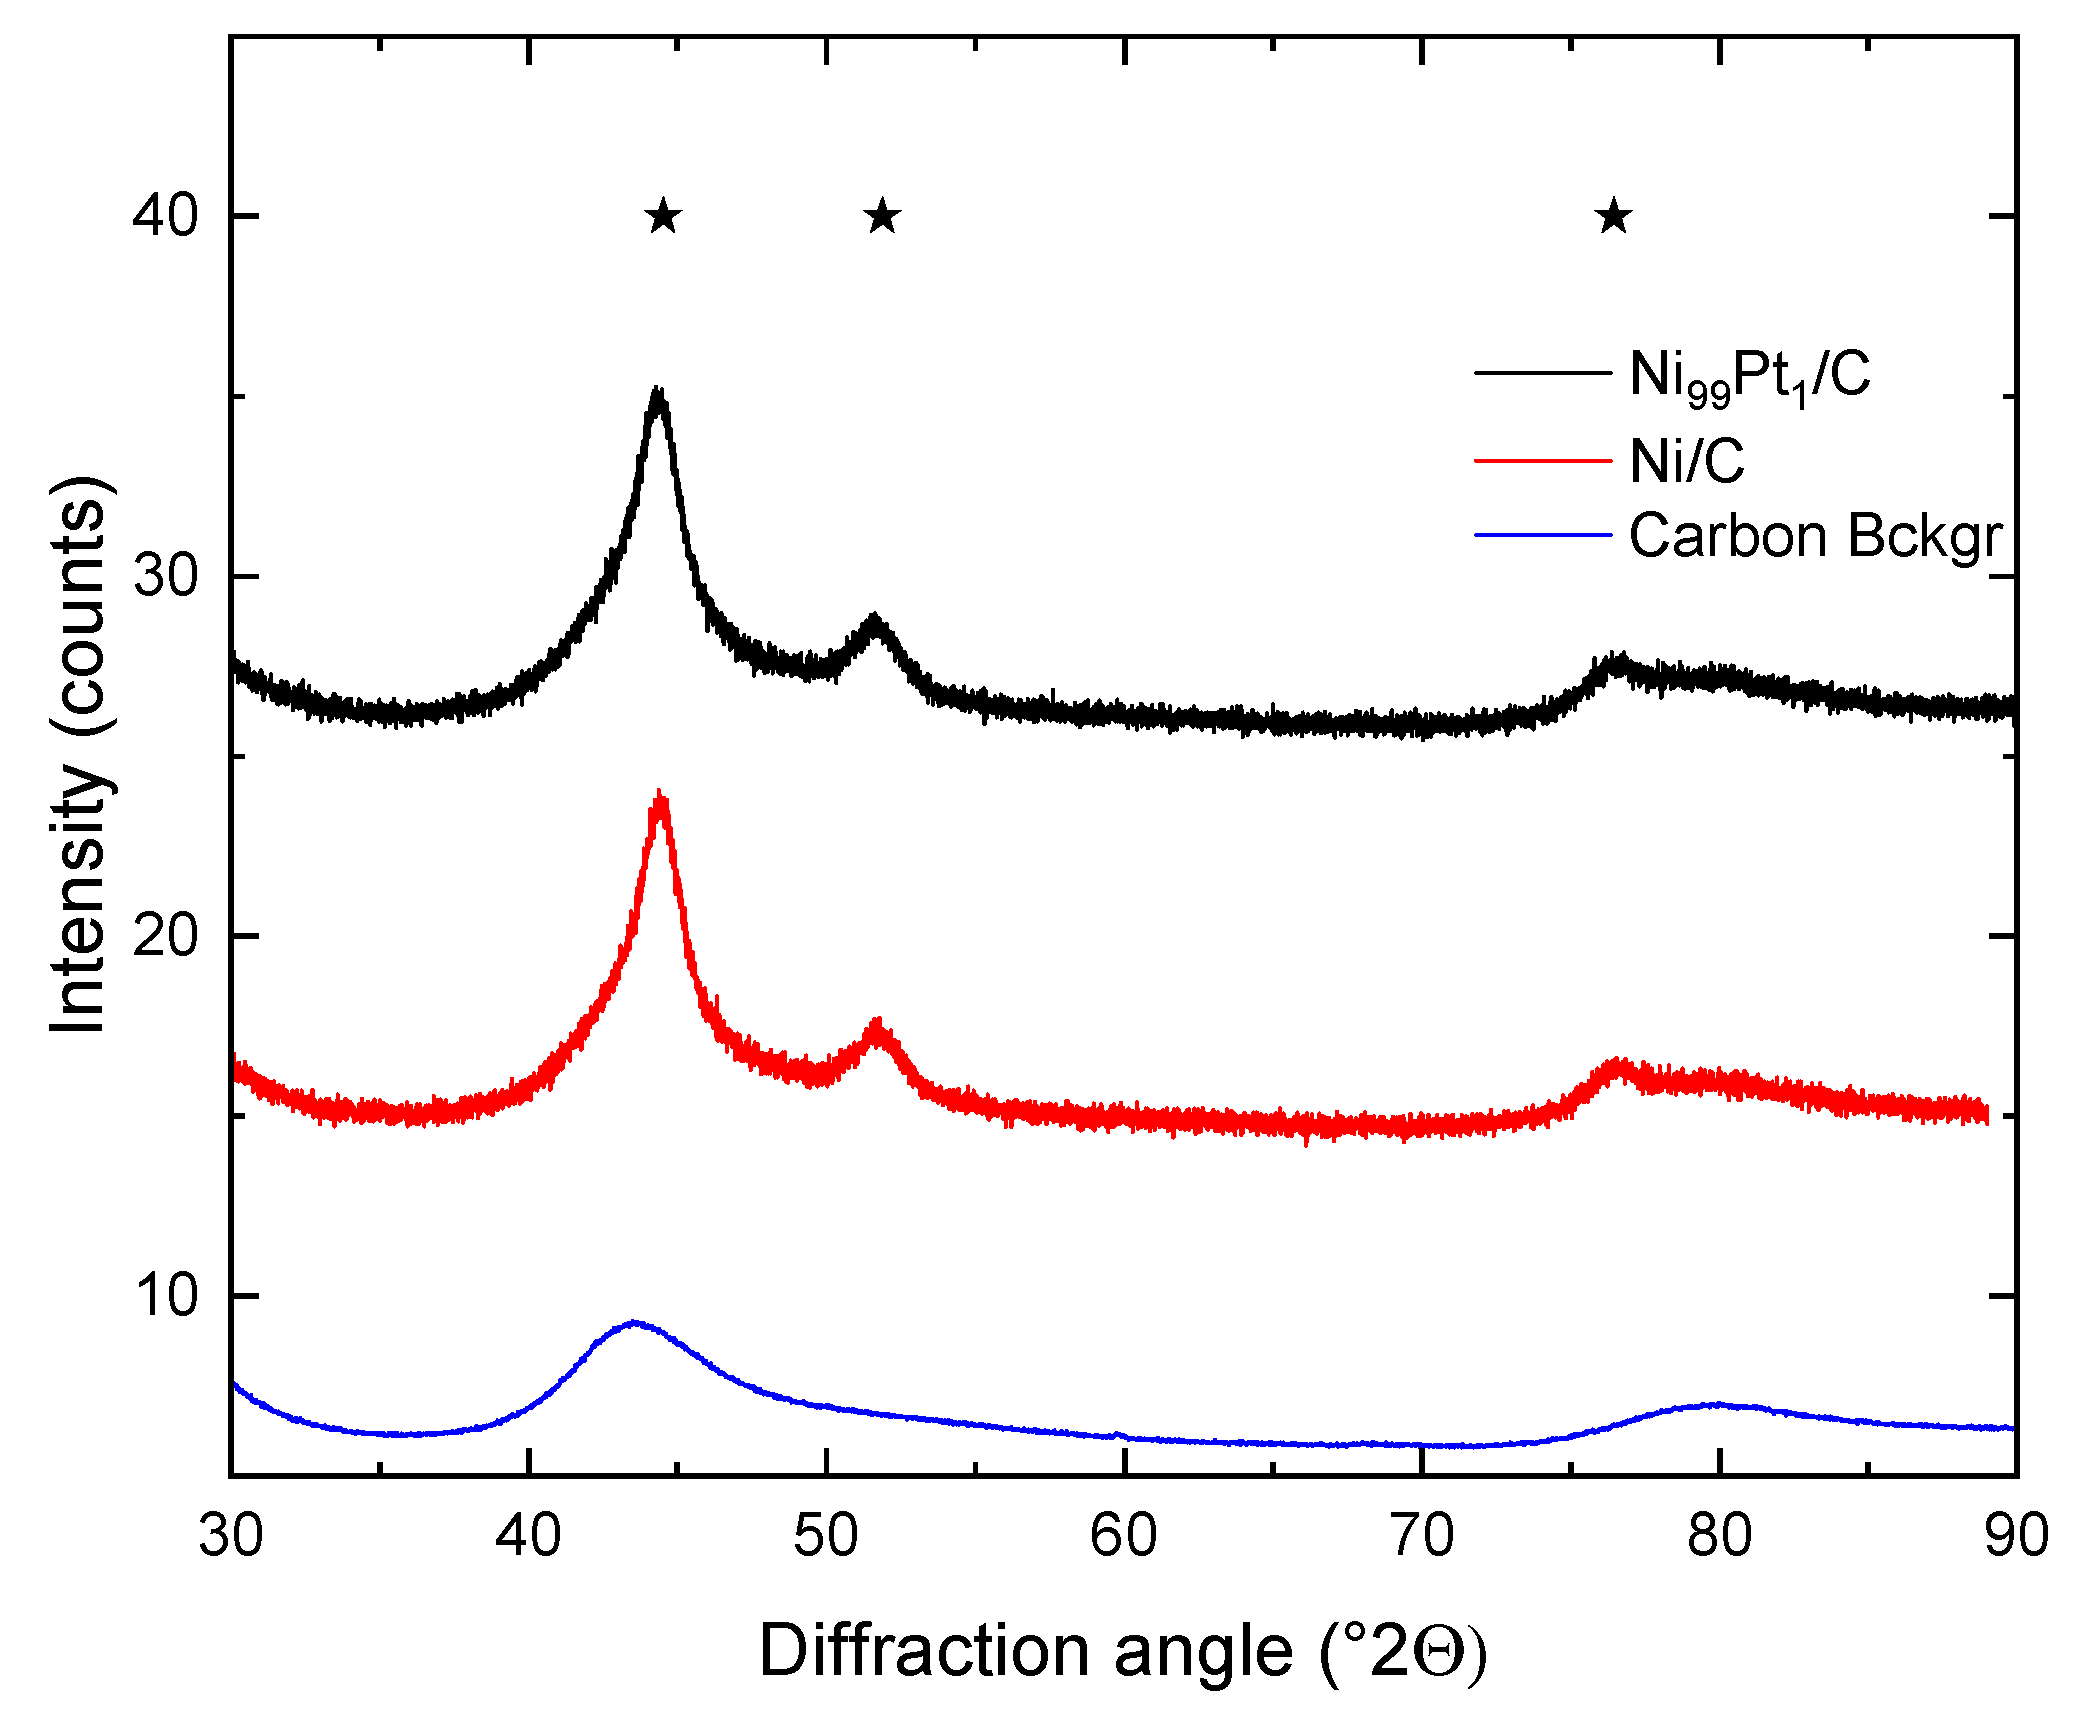
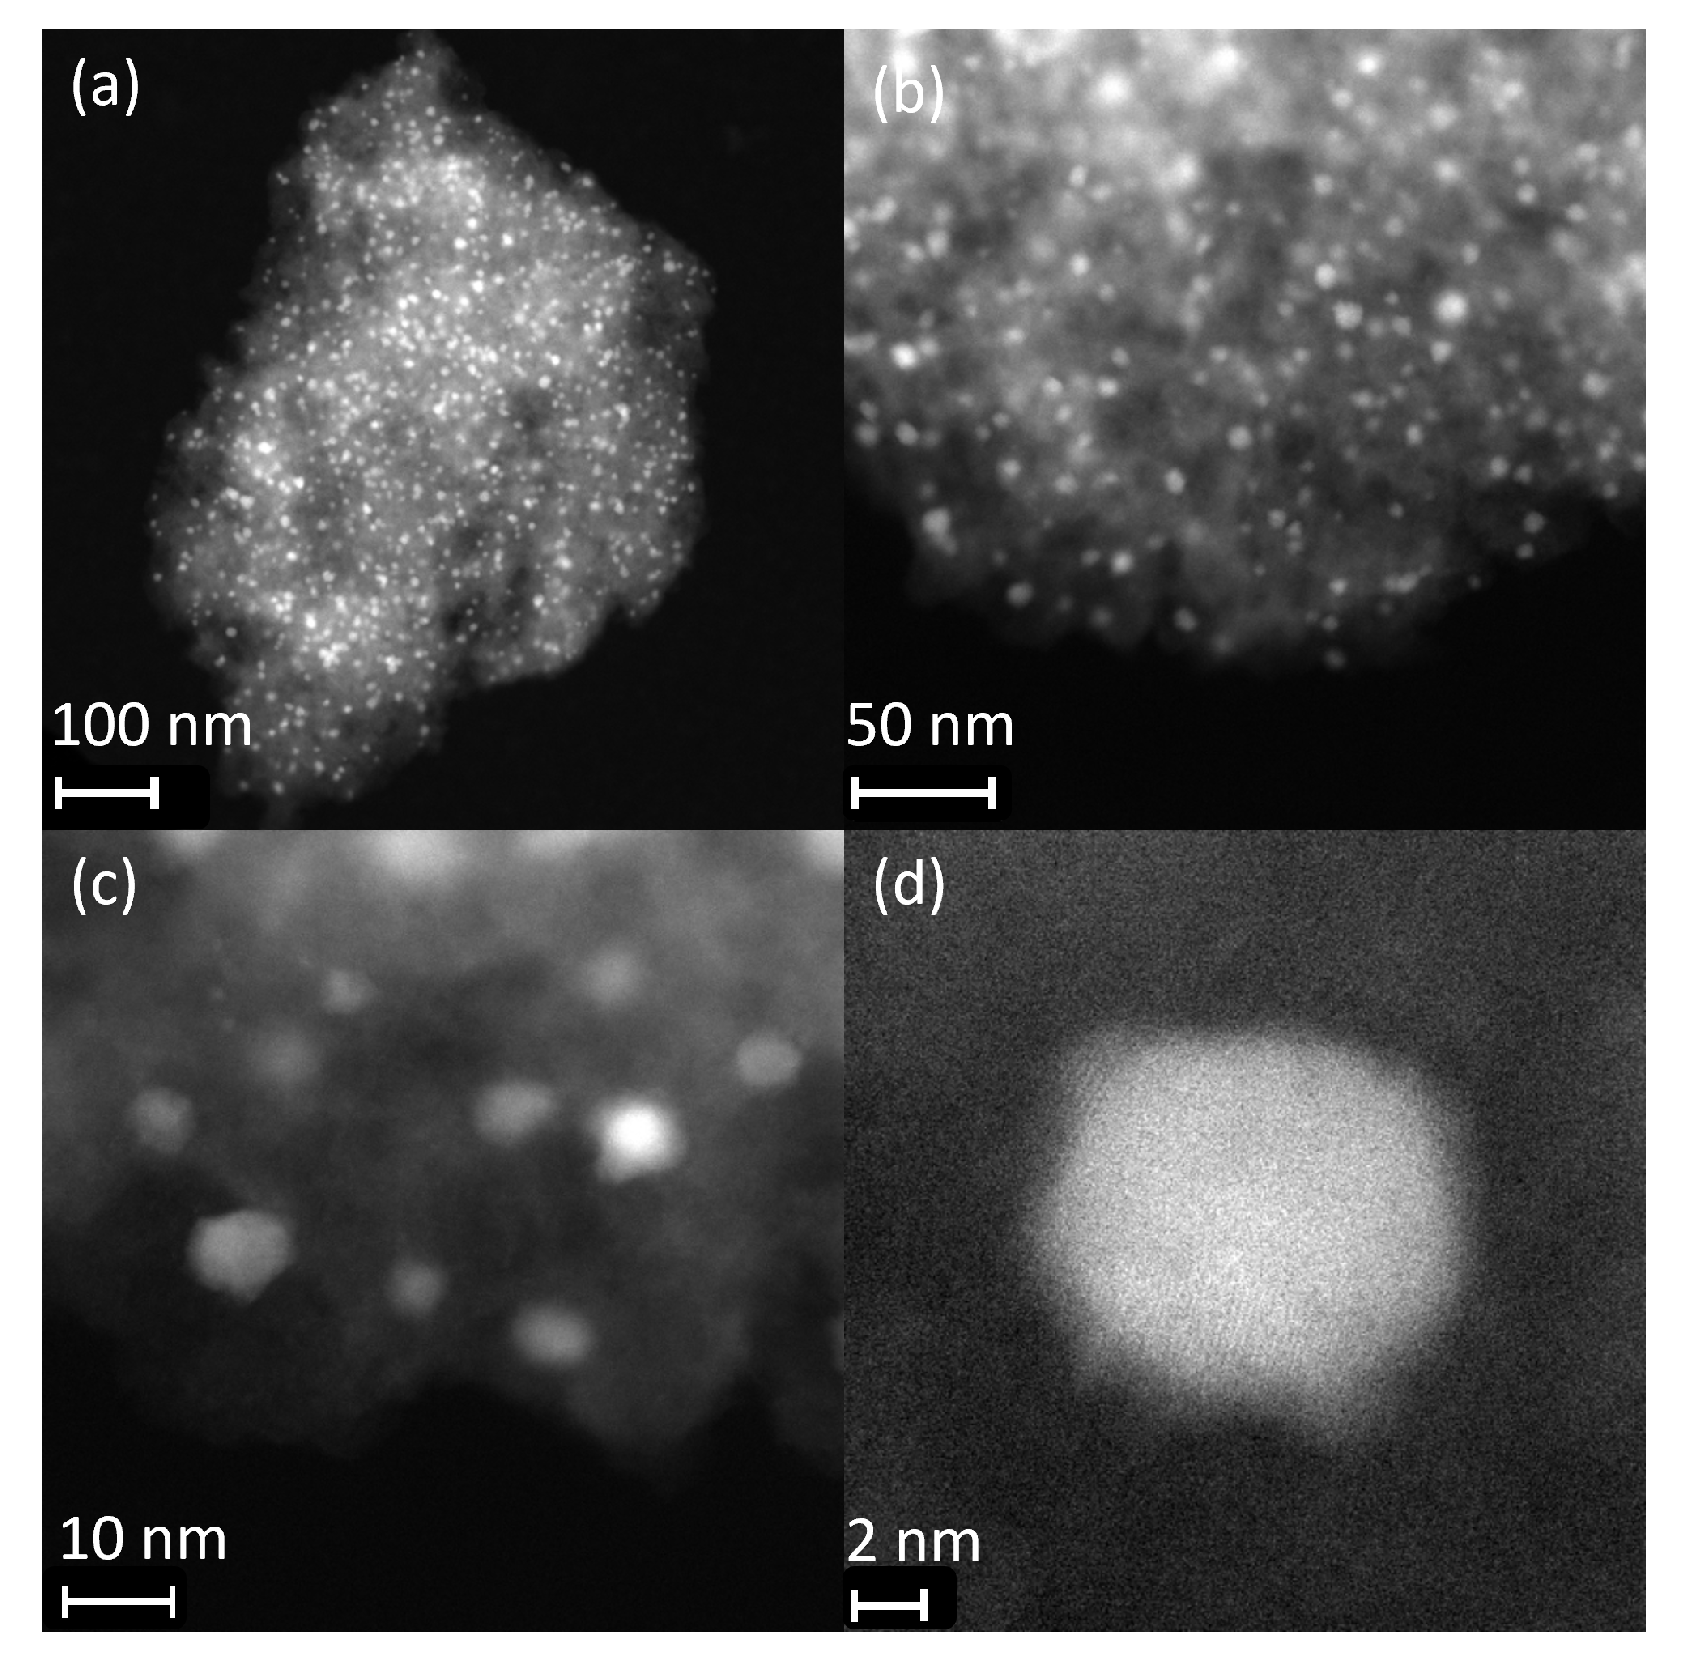
2.2. Characterization of the Ni Catalyst

In Figure 4, we present the diffraction patterns for the calcined and reduced catalyst materials 5% Ni/C (Ni/C) and 5% Ni99Pt1/C (NiPt/C).
The activated carbon support exhibits broad peaks at 44.8° and 80°, attributed to amorphous components, as previously described. However, no discernible crystalline reflections for graphite or diamond were observed. Loading the activated carbon with 5 wt% nickel reveals distinct nickel reflections at (111) 44.52°, (200) 51.88°, and (220) 76.43°. The calculated lattice parameters, indicative of an face centered cuboid (fcc) structure for elemental nickel, yield (0.3522 ± 0.0016) nm. No crystalline phases of nickel oxides or carbides were detected, with the broad reflections suggesting small crystalline domains. Particle sizes, calculated from these reflections, exhibit anisotropic characteristics, with crystalline domains measuring (5.3 ± 0.5) nm.
The Ni99Pt1/C catalyst, prepared with one atomic percent platinum, displays identical reflections to the Ni/C one in the diffraction pattern, indicating the absence of crystalline platinum phases. Instead, the reflections correspond to a pure nickel phase, suggesting a crystallographically pure nickel phase despite the intended addition of platinum. The composition of the Ni1−xPtx phase was calculated with x = 0 , crystallographically affirming the presence of a pure nickel phase. The isotropic crystalline domains exhibit similar sizes ((5.1 ± 0.7) nm) to those in the Ni/C catalyst.
Consistent with the literature, only fcc phases were detected. The desired molar ratio Ni:Pt = 99:1 aims for a disordered fcc phase, consistent with theoretical predictions [45]. The observed bimodal particle size distribution suggests heterogeneous particle growth influenced by the synthesis method’s thermodynamic factors and interaction with the support surface, rather than by the selective ligand-mediated crystallization typical of monodisperse particle synthesis methods [46]. Particle geometry anisotropy is consistent with stability calculations, favoring dodecahedra over cubic particles at the applied calcination temperature [47,48]. Lattice parameters for Ni/C and Ni99Pt1/C remain unchanged within measurement uncertainties, indicating no plane broadening due to stresses or intercalation of foreign atoms. Surface segregation likely enriches Pt atoms at particle surfaces while depleting them in the core [46,48,49].
The reducible fraction of metal compounds present was characterized using TPR measurements. Figure 5 displays the mass-normalized TCD signals for the nickel catalysts 5 wt% Ni/C and 5 wt% Ni99Pt1/C produced by impregnation. The measurement curves underwent analysis via peak decomposition using Gaussian functions. The resulting graphs are depicted in Figure 5.
The 5 wt% Ni/C serves as the reference for the un-doped material. The reduction curve was decomposed into four Gaussian functions through nonlinear curve fitting (see Figure S6). The calculated data are listed in Table 3. At 238 °C, the first peak consumes 0.190 mmol/g of hydrogen, attributed to the reduction of Ni2O3 → Ni. The narrow width indicates a narrow particle size distribution. Peaks at 278 °C and 448 °C correspond to the reduction of larger and smaller NiO particles. The fourth peak at 650 °C partially reduces activated carbon, evidenced by the hydrogenation of carbon functionalities. The total mass fraction of nickel calculated from hydrogen consumption is 6.65%, slightly exceeding the targeted concentration.
In contrast to the Ni/C catalyst, the doped Ni99Pt1/C catalyst exhibits a distinct reduction curve (Figure 5). The total reduction area is smaller, approximated by only three Gaussian functions. The first peak at 76 °C, consuming 0.190 mmol/g of hydrogen, shows high symmetry and indicates a narrow particle size distribution, possibly due to the addition of platinum. The second peak at 420 °C, with a broader width, coincides with reduction peak III of the Ni/C catalyst, but at 28 K lower temperatures. The reducible metal content is 3.06%.
Figure 6 presents a selection of representative TEM images of the fresh Ni99Pt1/C catalyst. Panel a depicts a carbon particle (470 nm × 700 nm) showing a homogeneous metal particle distribution. Metal particles exhibit a narrow size distribution, with diameters ranging from 0.69 nm to 12.94 nm (see Figure S1). Here, 50% of the metal particle diameters lie within 3.36 nm to 7.13 nm. Occasionally, individual particles show crystalline domains (Figure 6d), visible through contrast changes at the particle edges. STEM–EDX measurements found platinum content below the detection limit of one mass percent, indicating minimal platinum presence in the particles. Platinum enrichments at specific nanoparticle positions were undetectable.
While a monodisperse particle distribution was not expected, the impregnation synthesis method achieved very narrow particle size distributions. This is attributed in part to strong nickel–carbon interaction and surface functionalities [42].

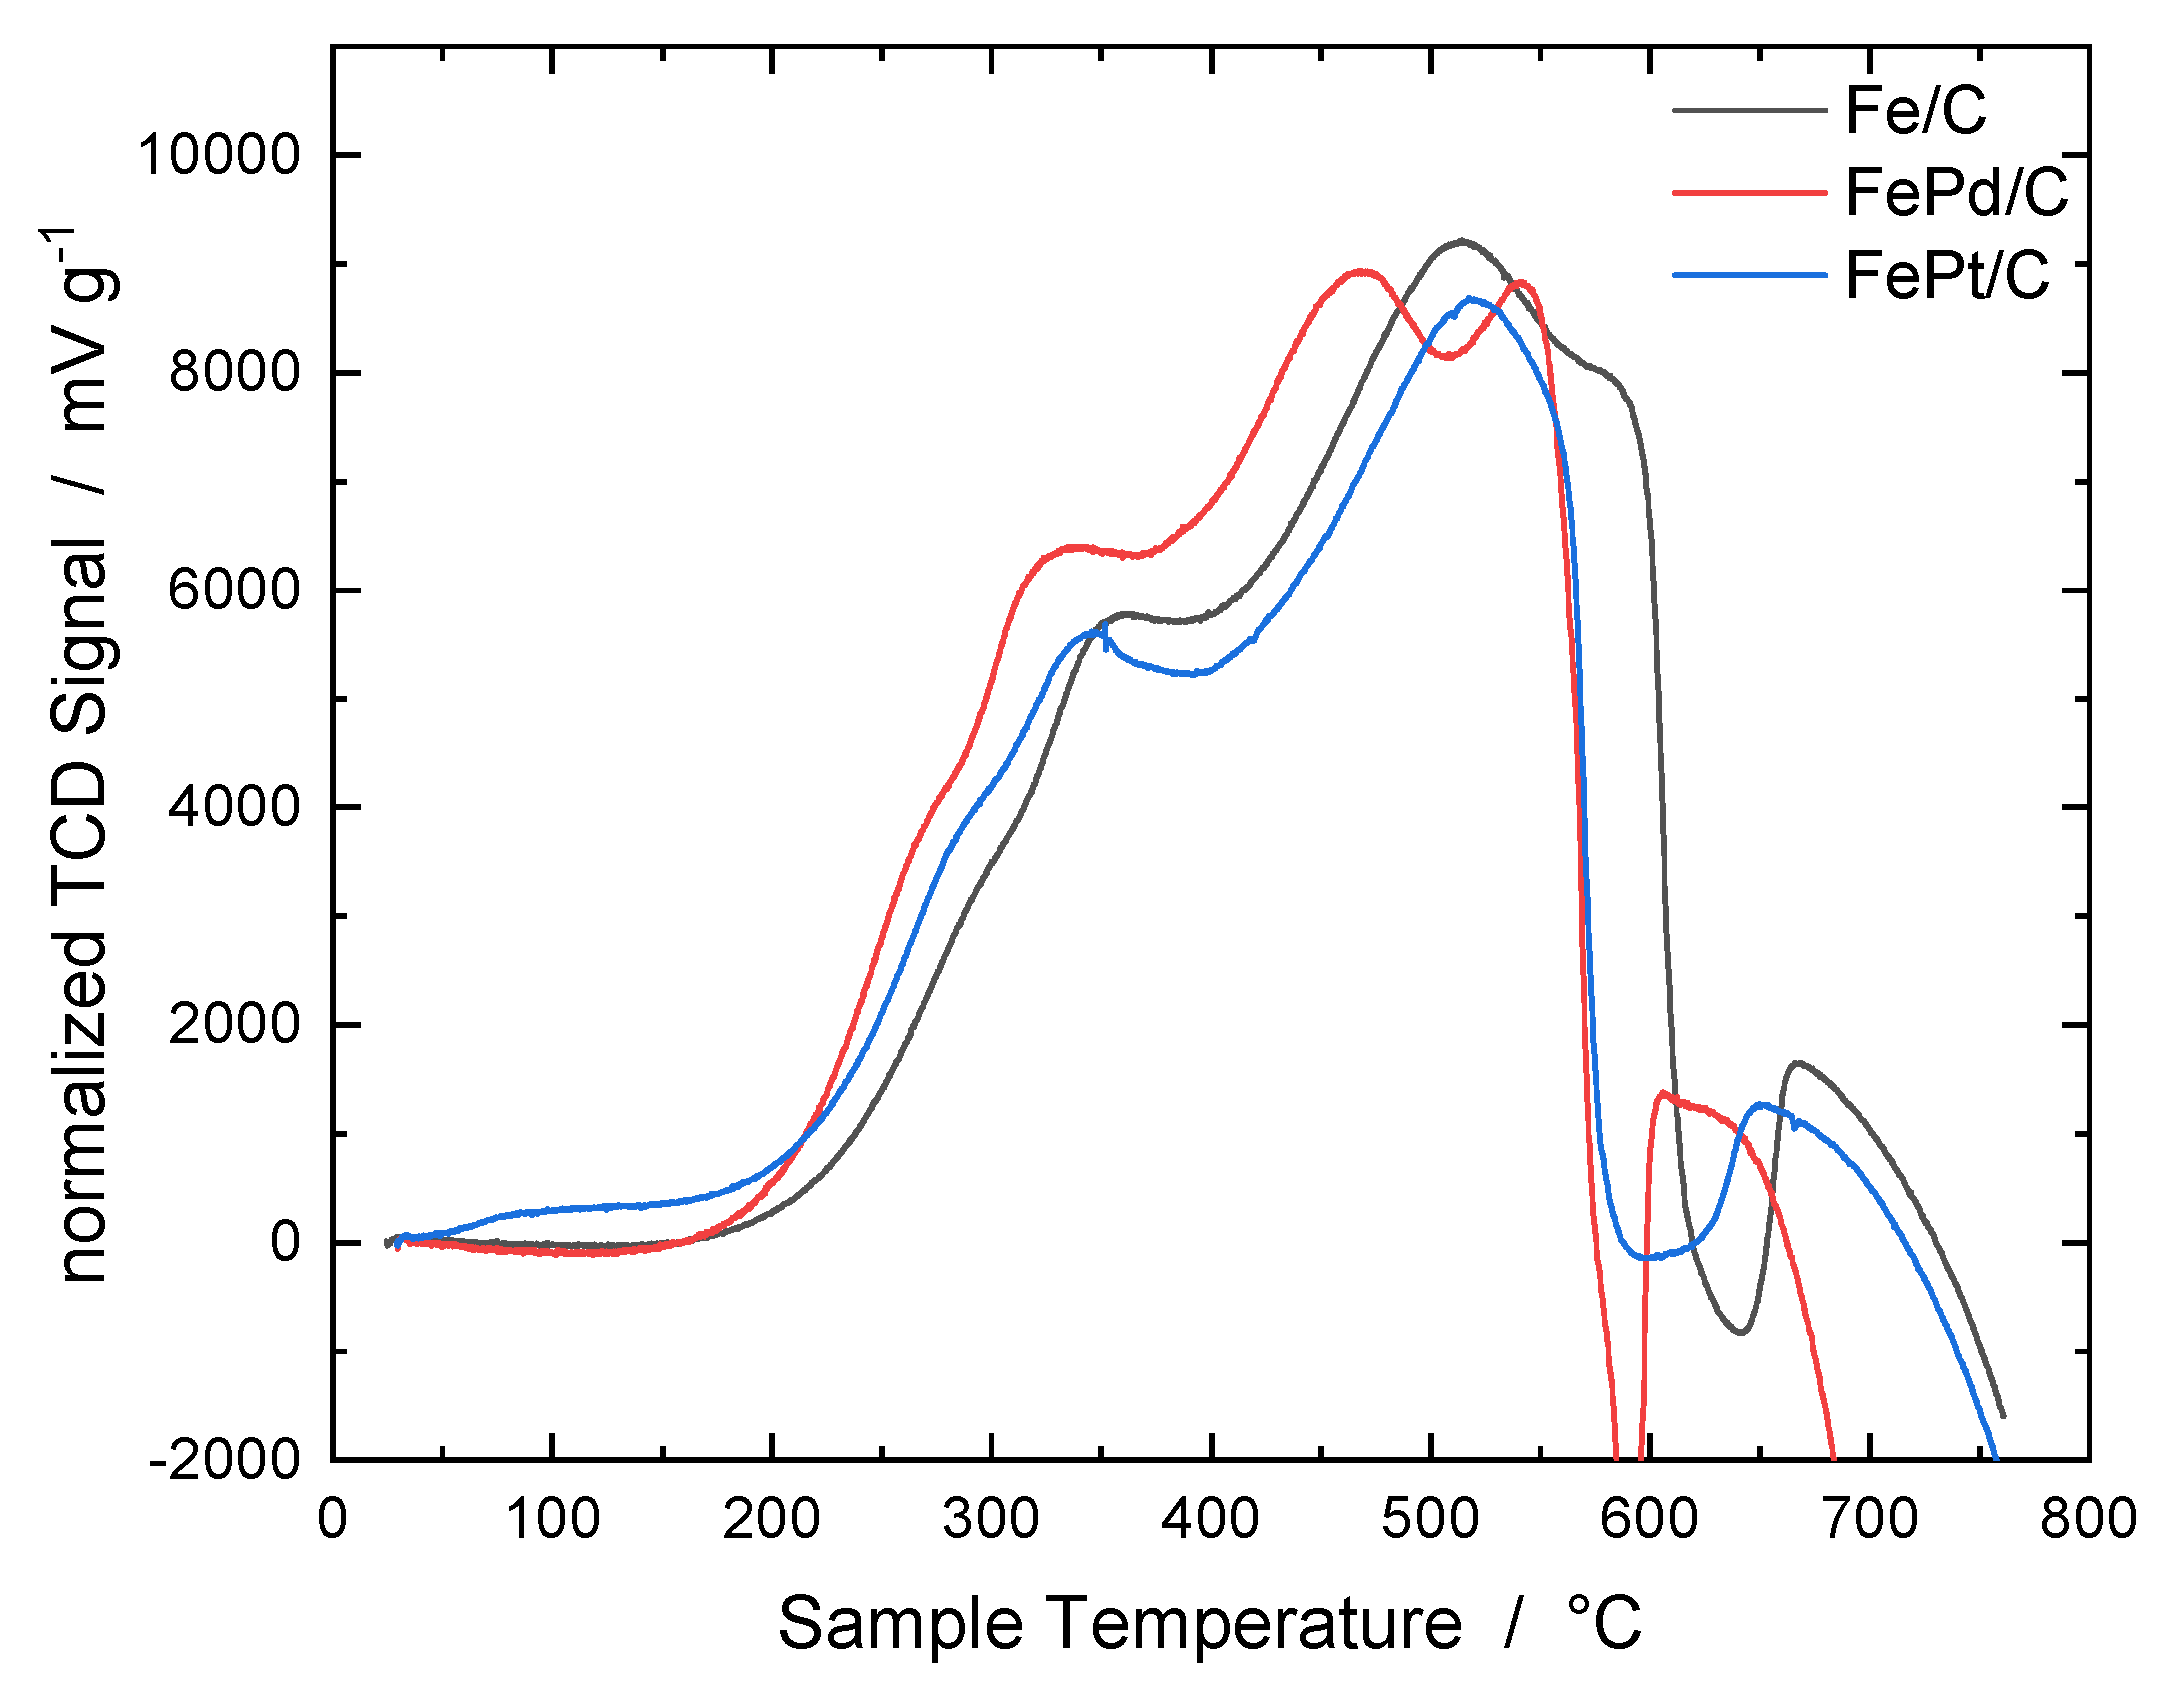
2.3. Characterization of the Fe Catalysts

The XRD measurements in Figure 7 display diffractograms for the materials Fe/C in gray, Fe99Pt1/C in black, and Fe99Pd1/C in red within the range of 30° to 90°. Activated carbon, measured as the background, is depicted in blue in the diagram.
Fe/C serves as the reference for the un-doped catalyst material. The diffractograms exhibit broad, weakly pronounced reflections at 35.80°, 43.52°, and 63.23°. These are attributed to a magnetite phase, with reflections (311) at 35.80°, (400) at 43.52°, and (440) at 63.23° [50]. A phase for α-Fe could not be determined. It cannot be ruled out that a small proportion of iron particles is present in a reduced form, as the reflection positions overlap with the magnetite phase [51]. For the Fe99Pt1/C catalyst, a similar diffractogram to the Fe/C reference was obtained. Reflections occur at positions 35.80°, 43.52°, 57.34°, and 63.23°, which are also assigned to the magnetite phase [50]. The Fe99Pd1/C catalyst exhibits the same diffractogram as the previously described materials.
The reducible fraction of metal compounds present was characterized through TPR measurements. In Figure 8, the mass-normalized TCD signals for iron catalysts produced by impregnation, namely 5 wt% Fe/C, 5 wt% Fe99Pd1/C, and 5 wt% Fe99Pt1/C, are displayed. The measurement curves underwent peak decomposition using Gaussian functions. The resulting graphs are elaborated in Figures S8–S10.
The reference case is the Fe/C catalyst (black curve), depicted in Figure 8 as a function of the TCD signal against the sample temperature. The curve displays a steep increase above 200 °C, forming a shoulder around 325 °C. The maximum is reached at 500 °C, followed by another shoulder at 600 °C, before the detector signal drops steeply and briefly reaches a local maximum below the zero line at 700 °C. Peak decomposition of the reduction profile reproduced it very well with five Gaussian functions. Three functions with positive areas and two with negative ones were used. The T max for the first peak is at 338 °C, accounting for 20.11% of the positive functional area. The second peak at 523 °C holds the largest share of reducible species at 77.36%. This is followed by a heavily overlapping peak at 595 °C with an area share of only 2.53%. At 626 °C, a negative Gaussian function with a hydrogen equivalent of −0.0158 mmol/g was calculated. This is followed by another broad Gaussian function with a hydrogen equivalent of −0.0298 mmol/g. As is shown in Table 4, these negative effects were attributed to the activated carbon, as explained in detail later.
The doped materials Fe99Pd1/C and Fe99Pt1/C follow a similar course. Especially for the Fe99Pd1/C catalyst, a steeper increase in the reduction profile was observed at 200 °C compared to the pure iron catalyst. Additionally, the local maxima in the reduction profile are more pronounced and occur at significantly lower temperatures. The T max for this catalyst for the first peak is 312 °C with a 4.8% higher area share than the Fe/C catalyst. The second peak occurs 47 K earlier with a six percent reduced area share of the positive peaks. The maximum of the third reduction peak was found at 548 °C with an area share of 4.01%. At 586 °C, the negative Gaussian peak occurs 40 K earlier compared to the Fe/C catalyst. However, the reduction profile drops more steeply compared to the Fe/C catalyst and reaches negative detector values of −266 mV at 600 °C and −837 mV shortly before the temperature was held constant at 800 °C.
Similar shifts to lower temperature maxima for the individual reduction peaks apply to the Fe99Pt/C catalyst, although the shifts here are not as pronounced, and the similarity to the Fe/C catalyst is greater. The first peak occurs at 342 °C, almost identical to that of the Fe/C catalyst, but accounting for 32.9% of the reduction area. The second peak also occurs at a temperature very similar to the Fe/C catalyst at 529 °C, but with a 64.13% reduced share of the reduction peak area compared to the Fe/C material. At a 43 K lower temperature than in the Fe/C material, the third peak was found to have a similarly low share of 2.94%.
In good agreement with the study by Jozwiak et al., the first peak of reduction from hematite (Fe2O3) to magnetite (Fe3O4) was assigned around 380 °C [52]. The reaction Equations (1)–(4) simplifies the individual processes:
3 F e 2 O 3 + H 2 2 F e 3 O 4 + H 2 O
F e 3 O 4 + H 2 3 F e O + H 2 O
4 F e O F e 3 O 4 + F e
F e O + H 2 F e + H 2 O
As reduction parameters like the flow rate, heating rate, and amount of reducible material influence peak position, height, and resolution, an identical reduction profile with literature data for bulk iron oxides is not expected. However, the complex reduction profile can be approximated very well with five Gaussian functions. These Gaussian functions of peaks I to III can be assigned to the phase transformation Equations (1), (2) and (4). Quantitative calculation of the amount of oxidized iron present was not possible due to multiple effects and partial cancellations. As wüstite transforms into magnetite and elemental iron above 570 °C according to Equation (3) without consuming hydrogen, no signal for this process was found in the reduction profile [52]. Gaussian functions with negative areas represent processes where hydrogen or other gaseous molecules with high thermal conductivity are released from the catalyst support. This can occur, for example, through dehydrogenation of the surface functionalities or decarbonylation reactions, as well as dehydrogenation of aliphatic systems and condensation of aromatic systems to polyaromatic ones. This portion of released hydrogen overlaps with the amount of hydrogen consumed in the reduction of magnetite and wüstite. Additionally, the carbon support itself can act as a reducing agent for the iron oxides at high temperatures, making quantitative evaluation impossible without detailed elucidation of the relationships.
Of particular note is the influence of dopant metals on the reducibility of catalyst materials. Easily reducible metals like palladium and platinum shift the reduction profiles to lower temperatures even at targeted concentrations of 1 at%. This shift is explained in the literature by facilitated reduction of the oxide due to facilitated dissociation of hydrogen on the dopant metals and subsequent hydrogen spillover or by the formation of oxygen vacancies. Studies by Hensley et al. show that, by adding palladium to Fe2O3, electron density is transferred from the dopant metal to the iron oxide, weakening the oxygen–iron bond and enabling reduction at lower temperatures [53]. Additionally, the reduced bond strength of oxygen on the iron surface acts as protection against surface poisoning by oxygen [53]. Doping iron with platinum and palladium shifts the negative Gaussian functions, attributed to the dehydrogenation of the support material, to lower values because weakened oxygen–iron bonds require lower activation energy for dissociation.
Doping Fe2O3 with 0.001 wt% to 1 wt% platinum, Fröhlich and Sachtler showed that the earlier reduction is attributable to the electronic contribution of platinum, with only a negligible contribution from hydrogen spillover. The iron oxide is sensitive to the presence of platinum atoms, leading to reduction at lower temperatures [54].
Representative STEM images of the Fe99Pt1/C catalyst are shown in Figure 9a. The metal particles in this material are not well isolated. It is only possible to distinguish between individual particles at higher magnifications. The particles exhibit very weak contrasts compared to the activated carbon and are evenly distributed in high concentrations on the support. However, the approximately round particles largely overlap. Counting the particles yielded a range of particle diameters from 0.29 nm to 15.26 nm. Half of the particle diameters are in the range of 3.42 nm to 7.03 nm, with a median of 4.95 nm. In Figure 9a(d), an isolated, 4 nm particle is shown, which was examined in detail as an example to analyze the crystal plane distances. However, it was found that this particle was rapidly damaged by the electron beam, such that no crystal planes could be recognized. The EDX mapping yielded only iron and oxygen signals, but no signals for platinum. It was, therefore, assumed that the platinum content is evenly distributed in the particles and that there are no local segregations of the alloy components.
For the Fe99Pd1/C catalyst, the STEM images are shown in Figure 9b and Figure 10. Here, too, it is clear from Figure 9b that the particles are locally present on the carbon support in high concentrations, which are poorly resolved. However, it is also evident that locally isolated particles are present, which exhibit high contrast and have an approximately round geometry with consistently high contrast.
The particle size distribution reveals a very narrow distribution of particle diameters in a range from 1.56 nm to 8.41 nm. Half of the particle diameters lie within the very narrow range of 4.75 nm to 5.53 nm, with a median of 4.75 nm. The narrow distribution is due to the poor resolution of the individual particles. As a result, only particles that could be resolved at high magnifications were counted. Large particles are, therefore, underrepresented in the statistics. STEM–EDX measurements for discrete particles showed the elements iron and palladium with different concentrations. Figure 10 shows a 4 nm particle with element mapping. Figure 10a shows the dark field contrast image. The particle has a round geometry and exhibits pronounced crystallinity, allowing the individual atomic layers to be resolved. The distances between the individual atomic layers have a distance of 0.2162 nm and correspond to a slightly expanded distance of the ( 100 ) and ( 200 ) planes of the Fe3Pd crystal, which crystallizes in the AuCu3-type [55]. In Figure 10c,d, the mappings of the metals iron and palladium are shown separately, whereas in Figure 10b, an overlay of the individual metals throughout the particle is shown. For iron, the element distribution is mainly restricted to the particle itself, with high concentrations of iron also found in the immediate vicinity. This may be due to an iron oxide particle, which is barely visible in the contrast image due to its lower electron density. The signal for palladium also has a baseline noise over the entire image area, but the highest density for the palladium signal is concentrated in the area occupied by the metal particle in the contrast image. The overlay of the element signals again shows that the main concentration of palladium is concentrated on the metal particle and largely coincides with the iron signal. The mass fraction of iron is 67%, and that of palladium is 33%. This concentration is far from the targeted concentration of 99:1 atomic percent (Fe = 98.11 wt%, Pd = 1.89 wt%).
This enrichment of palladium in individual particles indicates that, locally, high concentration differences exist for the alloying components, and accordingly, palladium-free areas must be present. Due to the enrichment/depletion of palladium at different positions, a completely different chemical composition of the particles was obtained for different particles. In summary, these results show that the doping of iron with platinum and palladium was successful, which is evidenced by the fact that the reduction temperatures for the doped materials could be reduced compared to pure Fe/C. However, it is also evident that the iron oxide phases found in the XRD are mostly present as magnetite, with only a small amount of elemental iron present after reduction at 250 °C.

2.4. Catalytic Experiments

Table 5 lists the yields and selectivities of these experiments for the previously described catalyst materials.
Cu/C serves as the reference catalyst for the copper-based catalysts. This is characterized by complete inactivity under reaction conditions. The Cu99Ni1/C catalyst reached a i-butanol concentration of 3.01 mmol/L at the end of the reaction time, making it the highest concentration of the desired product for the copper catalysts. The ethanol conversion was calculated to be 0.35%. The selectivity for i-butanol, at 53.62%, is the highest for the formed products. 31.09% is accounted for by 2-methylbutan-1-ol and 7.6% each for the products acetone and 1-propanol. The maximum pressure stabilized at a constant value of 12.9 bar during the reaction time. At the end of this, a pink precipitate of copper was found on the fittings and the reactor wall in the autoclave, indicating that this catalyst exhibited dissolution and deposition processes under the reaction conditions.
The Cu99Fe1/C catalyst forms only 1.60 mmol/L of i-butanol over the same reaction period, representing only 53% of the i-butanol concentration in the Cu99Ni1/C catalyst. Ethanol conversion, however, is slightly higher, at 0.41%, compared to the previous experiment. However, the selectivities are distributed to 7.96% for acetaldehyde, 5.39% for acetone, and only 24.40% for i-butanol. The product with the highest selectivity here is 2-methylbutan-1-ol at 62.25%. The pressure increased by half a bar to a constant maximum of 13.4 bar during the reaction time.
The Ni/C catalyst generated 0.21 mmol/L of i-butanol over the reaction duration. The conversion is very low, at 0.07%. With a selectivity of 57.53%, acetaldehyde is formed as the main product. 1-propanol is also formed with a selectivity of 23.57%, whereas 1-butanol cannot be detected after four hours of reaction time. However, i-butanol is formed with a selectivity of 18.90%. The reactor pressure stabilizes at 12.8 bar. In contrast, the doped catalyst Ni99Pt1/C shows a conversion of 0.60% and a final concentration of 5.12 mmol/L i-butanol. Here, no acetaldehyde is found at the end of the reaction time, and 1-propanol is only formed with a selectivity of 4.37%. i-butanol is the main product, formed with a selectivity of 52.95%. 1-butanol ( S = 5.90%) evidently reacts to the higher products 2-methylbutan-1-ol ( S = 21.74%) and 2-ethylbutan-1-ol ( S = 15.03%). The pressure that stabilizes over the course of the reaction is constant at 13.3 bar. The pure nickel catalyst is, thus, transformed into a potent one by doping with one atomic percent of platinum. Product selectivity shifts from the strongly preferred dehydrogenation where acetaldehyde is the main product to the aldol condensation and rehydrogenation of the reaction products. This is evident from the higher selectivity of the higher alcohols 1-butanol, 2-methylbutan-1-ol, and 2-ethylbutan-1-ol.
Amongst the iron-based catalysts, the Fe/C catalyst shows no ethanol conversion. The Fe99Pd1/C catalyst reached a final concentration of i-butanol of 0.40 mmol/L and an ethanol conversion of 0.08%. The highest selectivity was for acetaldehyde, at 70.02%. i-butanol represents the only other product with a selectivity of 29.98%. 1-propanol and higher alcohols could not be detected. With a slightly higher conversion of 0.09%, the Fe99Pt1/C catalyst had a final concentration for i-butanol of 0.29 mmol/L. The selectivity here was 20.18%. In addition to acetaldehyde ( S = 41.36%), 1-propanol ( S = 20.85%) was also detected at the end of the reaction time. For all catalysts, the product concentration increased linearly over the reaction time, within the experimental error. Their respective composition established by means of ICP–OES, the single-point surface area and the median of the particle diameter are tabulated in Table 6.

3. Discussion

As previously outlined, detailed data characterizing bimetallic materials are available. To verify whether doping leads to an increase in the turnover frequency (turnover frequency (TOF)), this parameter was calculated based on the concentration of i-butanol. For this purpose, the following calculation approach, derived and explained in Supplementary Materials S2, was chosen. The different results for T O F XRD and T O F TEM arise from the different particle diameters d P a r t i c l e determined by the TEM and X-ray diffraction (XRD) measurements, respectively. Since the linear increase of the product concentration over the reaction time suggests no change in the average activity of the catalysts’ metal surface, catalyst restructuring has not been taken into account for our calculations. The results of these calculations are given in Table 7.
The copper-based catalysts Cu99Ni1/C and Cu99Fe1/C exhibit a comparatively high final concentration of i-butanol at 3.01 mmol/L and 1.60 mmol/L. Due to the large metal particles ranging from 22.30 nm to 28.40 nm, these catalysts yield the highest values for the TOF in each calculation method. For the Cu99Ni1/C catalyst, depending on the calculation method used, a value of between 5.20/h and 6.59/h is obtained. However, the Cu99Fe1/C catalyst only produces 1.60 mmol/L over the reaction time and achieves TOFs of 2.78/h to 3.65/h. Due to the comparatively large metal particles, there is a lower number of metal atoms available for the reaction, resulting in TOFs that are higher than those for the Ni99Pt1/C catalyst, despite the lower final concentration of i-butanol. The Ni99Pt1/C catalyst exhibits a very narrow particle size distribution and achieves a final i-butanol concentration of 5.12 mmol/L, with particles ranging from 5.10 nm to 5.31 nm. This represents the highest achieved value of i-butanol at the end of the reaction in this experimental group. The TOF is lower due to the smaller particles, ranging from 2.16/h to 2.24/h, compared to the copper-based catalysts.
The iron-based catalysts Fe99Pd1/C and Fe99Pt1/C have small particle sizes and very low i-butanol concentrations. Consequently, the TOF for Fe99Pd1/C ranges from 0.11/h to 0.14/h and for Fe99Pt1/C from 0.10/h to 0.11/h. Although a significant portion of the catalyst exists as a magnetite phase, alloy particles containing active centers in the reaction were found in STEM measurements. However, the proportion of metallic particles could not be quantified, thus making no conclusive statement about their specific TOF possible.
Figure 11 presents these results in relation to the experiments for monometallic catalysts. The calculated TOFs of the catalysts are plotted against the d-band centers calculated by Ruban et al. Figure 11a shows the plot for the calculated d-band centers in the case of catalysts having a monolayer of the dopant metal on the particle surface.
The monometallic catalysts previously investigated in [12] exhibit a volcano plot and are depicted as stars. The TOF was calculated based on the atoms actually available for adsorption processes. For the bimetallic catalysts, it was observed that their TOFs partially lag behind the expected TOF. In particular, the iron-based catalysts deviate significantly from this behavior. This is likely attributed, at least in part, to their local chemical composition and inadequate reduction during the manufacturing processes.
The Cu99Fe1/C catalyst also falls below an expected TOF of approximately 12/h, which would be expected if the catalyst had a monolayer of iron on the surface and maintained a simple relationship between the TOF and d-band center. The Cu99Ni1/C catalyst, however, fits well into this picture, with TOFs ranging from 5.20/h to 6.59/h, as expected based on the hypothesis that the TOF of Cu/C over Cu99Ni1/C to Pt/C follows a linear relationship with the calculated d-band center, and a monolayer of nickel is formed on the metal particles. Similarly, the Ni99Pt1/C catalyst fits well into this picture and lies within the expected range of the TOF.
Figure 11b shows the plot of the calculated TOFs for a case where the metal particles on the catalyst materials have a uniformly statistical distribution of dopant metal atoms in the core and on the surface of the metal particle.
Here, all monometallic catalysts are again plotted at the same position with an unchanged d-band center. The bimetallic catalysts now undergo a shift to higher d-band centers due to the altered chemical structure without changing their vertical position. They thereby move further into the middle of the volcano curve. The difference between the d-band centers for the Cu99Ni1/C catalyst is minimal. Its d-band center was now calculated to be −2.40 eV, instead of −2.49 eV for the monolayer of nickel on the particle surfaces. Consequently, this catalyst still lies within the expected TOF range for this position of the d-band center. The Cu99Fe1/C catalyst, now theoretically coinciding with an iridium d-band center, should, therefore, exhibit the same TOF, but remains behind the iridium with a maximum of 3.65/h. Iridium on a carbon support has a TOF of 9.58/h [12]. Similarly, the Ni99Pt1/C catalyst, with a d-band center of −2.09 eV, only reaches a maximum TOF value of 2.24/h, while it should have a value in the range of 10/h to 12/h.

4. Materials and Methods

4.1. Catalyst Synthesis

For the production of 5 g catalysts, 5 g of activated charcoal Merck KGaA, Darmstadt, He, Germany was weighed into a Schott flask as a support material and impregnated with the precursor solution. The volume of the precursor solution was determined based on the water absorption capacity of the activated charcoal. For impregnation, approximately 2mL of precursor solution was prepared and added in smaller portions. The wetted activated charcoal was homogenized by shaking. After impregnation, drying was carried out using a rotary evaporator at 40 mbar and a 40 °C water bath temperature for one hour at 6 rpm. Subsequently, it was calcined in portions of 1 g to 2 g in quartz glass crucibles in a tube furnace under a N2 flow of 0.5 g/min at 500 °C for 4 h. The calcination was followed by a reduction of the catalysts in 2% H2 in N2 for 1 h at 250 °C. The catalysts obtained in this manner are listed in Table S3 and were tested and analyzed according to the procedure described in [12].

4.2. TEM

Images were captured according to [12]. Powder samples were fixed on a copper sample holder (Cu-TEM Grid). For capturing the high-angle annular dark field (HAADF) and energy-dispersive X-ray analysis (EDX) images, an aberration-corrected FEI Titan G2 80 to 200 TEM field emission electron microscope was used in conjunction with a Super-X EDX system at 200 eV [56]. For lower resolutions, an FEG TEM Hitachi HF5000 (Hitachi Europe GmbH, Düsseldorf, Germany) with an acceleration voltage of 200 eV was employed.

4.3. XRD

Samples deposited on Si single-crystal carriers were measured using the D8 Advance diffractometer from Bruker ( K α 1 ( Cu ) , λ = 1.5406 Å), and Ni as the K β ( ( Cu ) filter) in Bragg–Brentano geometry. The angle range from 20° to 90° was imaged with a step size of 0.008° to 0.02° and an integration time of 1 h to 4 h. The Profex software version 5.0.1 was used for phase analysis incorporating Rietveld refinement [57]. The standard LaB6 from LGC Standards was used to calibrate the device-specific line-broadening.

4.4. ICP–OES

Two aliquots of 50 mg per sample were treated with 4 mL aqua regia at 80 °C for 18 h. The solutions were diluted to 50 mL, and the sample solutions, along with a blank sample, were measured using an inductively coupled plasma (ICP)–optical emission spectrometry (OES) device calibrated with multiple standards from Thermo Fisher Scientific by ZEA-3 (Forschungszentrum Jülich GmbH, Jülich, Germany) personnel. For the measurements, two parallel dilutions of the samples (2000-fold, 1000-fold, 100-fold, and 10-fold) were prepared and measured.

4.5. Determination of the BET Surface Area

The BET surface area was determined using the Gemini VII instrument from Micromeritics (Norcross, GA, USA) with N2 at 77 K . Approximately 100 mg of the sample was transferred into a tared measurement cell and degassed at 150 °C under a pressure of 10 × 10−3 mbar until a constant mass was achieved. Subsequently, the degassed sample was weighed, and the adsorption and desorption isotherms were recorded with 18 data points each in the range of 0.04 p p 0 to 0.90 p p 0 . The evaluation of the measurement data was performed using the MicroActive Version 4.06 software from Micromeritics.

4.6. Temperature-Programmed Reduction

The temperature-programmed methods were carried out using the TPDRO1100 instrument from Fisher Scientific, Waltham, MA, USA), equipped with a thermal conductivity detector (TCD), which was calibrated as per Supplementary Materials S1. Temperature measurements were taken in the sample bed. For the temperature-programmed reduction (TPR) measurement, 80 mg of the sample material was weighed into the TPDRO1100 reactor. For drying, the sample was heated in an argon flow (30 mL/min) at 150 °C for 60 min. Then, the sample was cooled under an argon atmosphere and heated from 35 °C to 800 °C at a heating rate of β = 10 K/min in gas flow (1.99 Vol% H2 in argon, 30 mL/min) and maintained for 30 min .

4.7. Calculation of Turnover Frequencies

The calculations were based on the particle sizes determined in the TEM and XRD measurements. The TOF is defined as:
T O F = N i - ButOH N surface   atoms · t reaction
where N i - ButOH represents the number of molecules of i-butanol in the reaction mixture, N surface   atoms is the number of surface atoms on the amount of the catalyst used, and t reaction is the reaction time of 4 h . The number of product molecules was calculated from the molar concentration of i-butanol at the end of the reaction c t R i - ButOH , the reaction volume V R , and the Avogadro constant N A .
N i - ButOH = c t R i - ButOH · V R · N A
As TOF refers to the number of surface atoms in the reaction, various assumptions can be made regarding their calculation. T O F X R D and T O F T E M represent the TOF calculated based on the assumption that the particles are spherical. In this case, only the outermost atomic layer of the particles was considered, and the core atoms of the particle were considered inactive. Equation (7) is the calculation formula for this case (for the derivation, see Supplementary Materials S2.
T O F = c t R i - ButOH · V R m Cat · w ICP M particle · 1 d particle 4 r atom 3 d particle 3 · t reaction

5. Summary

The catalytic experiments of the catalysts showed that the final concentration of i-butanol for the catalyst materials significantly deviated from the undoped catalyst metals, and doping had an effect on the final concentration. The Cu99Ni1/C catalyst achieved the highest concentration of i-butanol with a good selectivity of 53.62%. However, the catalyst was subject to dissolution/deposition processes, which rendered it unusable. In contrast, the iron-doped copper catalyst was inconspicuous in this regard, but only produced half of the i-butanol concentration. The determined turnover frequencies (TOFs) for the doped copper catalysts were 5.20/h to 6.59/h (Cu99Ni1/C) and 2.78/h to 3.65/h (Cu99Fe1/C) due to the large metal particles, despite the lower final concentration of i-butanol, which was higher than the TOF of the Ni99Pt1/C catalyst. The iron-based catalysts showed extremely low activity in the reaction. The characterization of the catalysts initially indicated that it cannot be assumed for any of the doping catalysts that a monolayer of the dopant metal was formed through synthesis. Only in the case of the Fe99Pd1/C catalyst could an enrichment of palladium in some iron particles be detected. However, for the other catalyst materials, the dopant metal was not detectable by EDX measurement. However, under the reaction conditions, these materials underwent dynamic rearrangement processes, such as the enrichment of nickel on the surface from the copper–nickel phase when reducing conditions prevailed [41,58]. As these conditions are also fulfilled by the reaction mechanism of the hydrogen-borrowing reaction in the Guerbet reaction, it can be assumed that the surfaces of the Cu99Ni1/C catalyst underwent nickel enrichment under the reaction conditions. For the surface of the Cu99Fe1/C catalyst, predicting the active catalyst surface under the reaction conditions is even more difficult. Although the iron content was low and, therefore, led to a thermodynamically stable alloy [59], the iron as a dopant metal already causes surface restructuring at room temperature and may possibly exist in the form of Fe4 clusters on the surface [60,61,62]. The d-band calculations by Ruban et al. did not take these phenomena into account [22]. Although an enrichment of platinum on the corners and edges of the produced metal particles has regularly been found in the literature for the Ni99Pt1/C catalyst [46,47,48], these properties could not be detected in our experiments. As a result, it must be assumed that the catalysts’ surface was enriched with an atomic percentage of the dopant metals, although only in situ measurements of the actual existing d-band using ultraviolet photon scattering (UPS) and X-ray photoelectron spectroscopy scattering (XPS) investigations can provide insight into the real surface properties.
The iron-based catalysts cannot be conclusively evaluated due to their poor oxidation stability, as the majority of the metal exists as magnetite. The composition of the remaining metal particles showed particularly high local enrichments of palladium in the iron particles, especially in the Fe99Pd1/C catalyst. From Figure 11a,b, it becomes clear that the relationship between the d-band center and catalytic activity cannot be confirmed for bimetallic systems. It should be noted that, typically, volcano curves are created for diatomic test molecules, and often, good correlations are obtained. In the present work, a complex reaction was deliberately chosen to test the robustness of the d-band approach for selecting promising catalysts. In further work, the key steps of the reaction should, therefore, be examined in more detail to determine the adsorption energies of the individual adsorbates and correlate them with experimentally established d-band center values. The Ni99Pt1/C catalyst from the experiments presented had the highest STY and is, therefore, a promising catalyst for reactions of the hydrogen-borrowing reactions class.

6. Patents

The following patent resulted from the work presented in this publication. Häusler, J.; Pasel, J.; Peters, R.; Woltmann, F. (2022). Catalyst system and method for producing higher alcohols from methanol and ethanol (WO2023213568A 1) German Patent and Trade Mark Office.

Supplementary Materials

The following supporting information can be downloaded at: https://www.mdpi.com/article/10.3390/catal14030215/s1, Supplementary S1: Calibration Procedure for TCD, Supplementary S2. Calculation of C f for the TPDRO measurements; Table S1: Experimental data for determining the calibration factor C f ; Table S2: Tabulated values for the crystallographic lattice parameters; Table S3: Tabular listing of the feed for bimetallic catalysts prepared by impregnation; Table S4: ICP–OES-determined stoichiometric ratios of the impregnation catalysts; Figure S1: Box plot of the particle distribution from the STEM images for the catalysts Ni99Pt1/C, Cu99Ni1/C, Cu99Fe1/C, Fe99Pt1/C, and Fe99Pd1/C; Figure S2: Box plot of the particle distribution from the STEM images for the catalysts Ni99Pt1/C, Fe99Pt1/C, and Fe99Pd1/C; Figure S3: TPR profile of the Cu/C catalyst with peak decomposition; Figure S4: TPR profile of the CuNi/C catalyst with peak decomposition; Figure S5: TPR profile of the CuFe/C catalyst with peak decomposition; Figure S6: TPR profile of the Ni/C catalyst with peak deconvolution; Figure S7: TPR profile of the NiPt/C catalyst with peak deconvolution; Figure S8: TPR profile of the Fe/C catalyst with peak deconvolution; Figure S9: TPR profile of the FePd/C catalyst with peak deconvolution; Figure S10: TPR profile of the FePt/C catalyst with peak deconvolution. References [37,63,64,65,66,67,68] are cited in the Supplementary Materials.

Author Contributions

Conceptualization, J.H. and J.P.; methodology, J.H.; validation, J.H.; formal analysis, J.H.; investigation, J.H. and C.W.; writing—original draft preparation, J.H.; writing—review and editing, J.H., J.P., R.P., D.S. and C.W.; visualization, J.H.; supervision, D.S.; project administration, R.P.; funding acquisition, J.P. All authors have read and agreed to the published version of the manuscript.

Funding

This work was funded by the German Federal Ministry of Economic Affairs and Energy (BMWi), funding number: 19I18006P.

Data Availability Statement

The data presented in this study are available.

Acknowledgments

J.H. would like to thank Meital Shviro for performing the STEM–EDX measurements.

Conflicts of Interest

The authors have no conflicts of interest to declare.

References

  1. Zhong, W.; Liu, Y.; Zhang, D. Theoretical Study of Methanol Oxidation on the PtAu(111) Bimetallic Surface: CO Pathway vs. Non-Co Pathway. J. Phys. Chem. 2012, 116, 2994–3000. [Google Scholar] [CrossRef]
  2. Nguyen, L.; Zhang, S.; Wang, L.; Li, Y.; Yoshida, H.; Patlolla, A.; Takeda, S.; Frenkel, A.I.; Tao, F.F. Reduction of Nitric Oxide With Hydrogen on Catalysts of Singly Dispersed Bimetallic Sites Pt1Com and Pd1Con. ACS Catal. 2016, 6, 840–850. [Google Scholar] [CrossRef]
  3. Ouyang, M.; Papanikolaou, K.G.; Boubnov, A.; Hoffman, A.S.; Giannakakis, G.; Bare, S.R.; Stamatakis, M.; Flytzani-Stephanopoulos, M.; H. Sykes, E.C. Directing Reaction Pathways via in Situ Control of Active Site Geometries in PdAu Single-Atom Alloy Catalysts. Nat. Commun. 2021, 12, 1549. [Google Scholar] [CrossRef]
  4. Li, L.; Lu, Z.; Ould-Chikh, S.; Anjum, D.H.; Kanoun, M.B.; Scaranto, J.; Hedhili, M.N.; Khalid, S.; Laveille, P.; D’Souza, L.; et al. Controlled Surface Segregation Leads to Efficient Coke-Resistant Nickel/Platinum Bimetallic Catalysts for the Dry Reforming of Methane. Chemcatchem 2015, 7, 819–829. [Google Scholar] [CrossRef]
  5. Mankad, N.P. Selectivity Effects in Bimetallic Catalysis. Chem. Eur. J. 2016, 22, 5822–5829. [Google Scholar] [CrossRef]
  6. Fu, Q.; Meng, Y.; Fang, Z.; Hu, Q.; Xu, L.; Gao, W.; Huang, X.C.; Xue, Q.; Sun, Y.P.; Lu, F. Boron Nitride Nanosheet-Anchored Pd–Fe Core–Shell Nanoparticles as Highly Efficient Catalysts for Suzuki–Miyaura Coupling Reactions. ACS Appl. Mater. Interfaces 2017, 9, 2469–2476. [Google Scholar] [CrossRef]
  7. Yu, H.; Tang, W.; Li, K.; Yin, H.; Zhou, S. Enhanced Catalytic Performance for Hydrogenation of Substituted Nitroaromatics Over Ir-Based Bimetallic Nanocatalysts. ACS Appl. Mater. Interfaces 2019, 11, 6958–6969. [Google Scholar] [CrossRef] [PubMed]
  8. Iqbal, B.; Saleem, M.; Arshad, S.; Rashid, J.; Hussain, N.; Zaheer, M. One-Pot Synthesis of Heterobimetallic Metal–Organic Frameworks (MOFs) for Multifunctional Catalysis. Chem. Eur. J. 2019, 25, 10490–10498. [Google Scholar] [CrossRef] [PubMed]
  9. Sonal; Pant, K.K.; Upadhyayula, S. Efficient Utilization of Bimetallic Catalyst in Low H2/CO Environment Syngas for Liquid Fuel Production. J. Chem. Sci. 2017, 129, 1747–1754. [Google Scholar] [CrossRef]
  10. Cai, Z.; Yamada, I.; Yagi, S. ZIF-Derived Co9–xNixS8 Nanoparticles Immobilized on N-Doped Carbons as Efficient Catalysts for High-Performance Zinc–Air Batteries. ACS Appl. Mater. Interfaces 2020, 12, 5847–5856. [Google Scholar] [CrossRef] [PubMed]
  11. Hammer, B.; Nørskov, J.K. Electronic factors determining the reactivity of metal surfaces. Surf. Sci. 1995, 343, 211–220. [Google Scholar] [CrossRef]
  12. Häusler, J.; Pasel, J.; Woltmann, F.; Everwand, A.; Meledina, M.; Valencia, H.; Lipinska-Chwalek, M.; Mayer, J.; Peters, R. Elucidating the Influence of the D-Band Center on the Synthesis of Isobutanol. Catalysts 2021, 11, 406. [Google Scholar] [CrossRef]
  13. Wu, J.; Yang, H. Platinum-Based Oxygen Reduction Electrocatalysts. Accounts Chem. Res. 2013, 46, 1848–1857. [Google Scholar] [CrossRef]
  14. Wu, X.; Sun, Y.; Zeng, Y.; Li, X. Mechanistic Insights Into Oxazolone Synthesis by Bimetallic Au–Pd-Catalyzed Catalysis and Catalyst Design: DFT Investigations. J. Org. Chem. 2023, 88, 10693–10700. [Google Scholar] [CrossRef] [PubMed]
  15. Han, B.; Feng, X.; Ling, L.; Fan, M.; Liu, P.; Zhang, R.; Wang, Q. CO Oxidative Coupling to Dimethyl Oxalate Over Pd–Me (Me = Cu, Al) Catalysts: A Combined DFT and Kinetic Study. Phys. Chem. Chem. Phys. 2018, 20, 7317–7332. [Google Scholar] [CrossRef] [PubMed]
  16. Kitchin, J.R.; Nørskov, J.K.; Barteau, M.A.; Chen, J.G. Modification of the Surface Electronic and Chemical Properties of Pt(111) by Subsurface 3d Transition Metals. J. Chem. Phys. 2004, 120, 10240–10246. [Google Scholar] [CrossRef]
  17. Ahsan, A.; Puente Santiago, A.R.; Hong, Y.; Zhang, N.; Cano, M.; Rodriguez-Castellón, E.; Echegoyen, L.; Sreeprasad, T.S.; Noveron, J.C. Tuning of Trifunctional NiCu Bimetallic Nanoparticles Confined in a Porous Carbon Network with Surface Composition and Local Structural Distortions for the Electrocatalytic Oxygen Reduction, Oxygen and Hydrogen Evolution Reactions. J. Am. Chem. Soc. 2020, 142, 14688–14701. [Google Scholar] [CrossRef]
  18. Gao, Y.; Huo, X.; Li, T.; Jiang, R.; Zhu, Q.; Ren, H. Mechanisms and Energetics of Complete Ethylene Oxidation on a PdAu Bimetallic Catalyst From a Theoretical Perspective. J. Phys. Chem. 2022, 126, 9361–9370. [Google Scholar] [CrossRef]
  19. Gorzkowski, M.T.; Lewera, A. Probing the Limits of d-Band Center Theory: Electronic and Electrocatalytic Properties of Pd-Shell–Pt-Core Nanoparticles. J. Phys. Chem. 2015, 119, 18389–18395. [Google Scholar] [CrossRef]
  20. Hofmann, T.; Yu, T.H.; Folse, M.; Weinhardt, L.; Bär, M.; Zhang, Y.; Merinov, B.V.; Myers, D.J.; Goddard, W.A.; Heske, C. Using Photoelectron Spectroscopy and Quantum Mechanics to Determine d-Band Energies of Metals for Catalytic Applications. J. Phys. Chem. 2012, 116, 24016–24026. [Google Scholar] [CrossRef]
  21. Nikolla, E.; Schwank, J.W.; Linic, S. Measuring and Relating the Electronic Structures of Nonmodel Supported Catalytic Materials to Their Performance. J. Am. Chem. Soc. 2009, 131, 2747–2754. [Google Scholar] [CrossRef]
  22. Ruban, A.; Hammer, B.; Stoltze, P.; Skriver, H.; Nørskov, J. Surface electronic structure and reactivity of transition and noble metals: Communication presented at the First Francqui Colloquium, Brussels, 19–20 February 1996. J. Mol. Catal. Chem. 1997, 115, 421–429. [Google Scholar] [CrossRef]
  23. Tupy, S.A.; Karim, A.M.; Bagia, C.; Deng, W.; Huang, Y.; Vlachos, D.G.; Chen, J.G. Correlating Ethylene Glycol Reforming Activity with In Situ EXAFS Detection of Ni Segregation in Supported NiPt Bimetallic Catalysts. ACS Catal. 2012, 2, 2290–2296. [Google Scholar] [CrossRef]
  24. Li, L.; Zhao, G.; Lv, Z.; An, P.; Ao, J.; Song, M.; Zhao, J.; Liu, G. Optimizing Coordination Environment in Bimetallic Nipt Catalysts Boosts N-Dodecane Steam Reforming. Chem. Eng. J. 2023, 474, 145647. [Google Scholar] [CrossRef]
  25. Qiu, Y.P.; Shi, Q.; Zhou, L.L.; Chen, M.H.; Chen, C.; Tang, P.P.; Walker, G.S.; Wang, P. NiPt Nanoparticles Anchored onto Hierarchical Nanoporous N-Doped Carbon as an Efficient Catalyst for Hydrogen Generation from Hydrazine Monohydrate. ACS Appl. Mater. Interfaces 2020, 12, 18617–18624. [Google Scholar] [CrossRef]
  26. Zhong, Y.J.; Dai, H.B.; Zhu, M.; Wang, P. Catalytic decomposition of hydrous hydrazine over NiPt/La2O3 catalyst: A high-performance hydrogen storage system. Int. J. Hydrogen Energy 2016, 41, 11042–11049. [Google Scholar] [CrossRef]
  27. Kumar, A.; Ashok, A.; Bhosale, R.R.; Saleh, M.A.H.; Almomani, F.A.; Al-Marri, M.; Khader, M.M.; Tarlochan, F. In situ DRIFTS Studies on Cu, Ni and CuNi catalysts for Ethanol Decomposition Reaction. Catal. Lett. 2016, 146, 778–787. [Google Scholar] [CrossRef]
  28. Fang, W.; Liu, S.; Steffensen, A.K.; Schill, L.; Kastlunger, G.; Riisager, A. On the Role of Cu+ and CuNi Alloy Phases in Mesoporous CuNi Catalyst for Furfural Hydrogenation. ACS Catal. 2023, 13, 8437–8444. [Google Scholar] [CrossRef]
  29. Khort, A.; Romanovski, V.; Leybo, D.; Moskovskikh, D. CO oxidation and organic dyes degradation over graphene-Cu and graphene-CuNi catalysts obtained by solution combustion synthesis. Sci. Rep. 2020, 10, 16104. [Google Scholar] [CrossRef] [PubMed]
  30. Li, W.; Ding, J.; Chen, X.; Wang, Y.; Song, X.; Zhang, S. A 3D-printed CuNi alloy catalyst with a triply periodic minimal surface for the reverse water-gas shift reaction. J. Mater. Chem. 2023, 12, 314–320. [Google Scholar] [CrossRef]
  31. Xiao, K.; Qi, X.; Bao, Z.; Wang, X.; Zhong, L.; Fang, K.; Lin, M.; Sun, Y. CuFe, CuCo and CuNi nanoparticles as catalysts for higher alcohol synthesis from syngas: A comparative study. Catal. Sci. Technol. 2013, 3, 1591. [Google Scholar] [CrossRef]
  32. Wang, D.Y.; Chen, C.H.; Yen, H.C.; Lin, Y.L.; Huang, P.Y.; Hwang, B.J.; Chen, C.C. Chemical transformation from FePt to Fe1−xPtMx (M = Ru, Ni, Sn) nanocrystals by a cation redox reaction: X-ray absorption spectroscopic studies. J. Am. Chem. Soc. 2007, 129, 1538–1540. [Google Scholar] [CrossRef] [PubMed]
  33. Gupta, G.; Patel, M.N.; Ferrer, D.; Heitsch, A.T.; Korgel, B.A.; Jose-Yacaman, M.; Johnston, K.P. Stable Ordered FePt Mesoporous Silica Catalysts with High Loadings. Chem. Mater. 2008, 20, 5005–5015. [Google Scholar] [CrossRef]
  34. Marchenko, N.; Lacroix, L.M.; Ratel-Ramond, N.; Leitner, W.; Bordet, A.; Tricard, S. Bimetallic FexPt100–x Nanoparticles Immobilized on Supported Ionic Liquid Phases as Hydrogenation and Hydrodeoxygenation Catalysts: Influence of the Metal Content on Activity and Selectivity. ACS Appl. Nano Mater. 2023, 6, 20231–20239. [Google Scholar] [CrossRef]
  35. Metin, Ö.; Mendoza-Garcia, A.; Dalmızrak, D.; Gültekin, M.S.; Sun, S. FePd alloy nanoparticles assembled on reduced graphene oxide as a catalyst for selective transfer hydrogenation of nitroarenes to anilines using ammonia borane as a hydrogen source. Catal. Sci. Technol. 2016, 6, 6137–6143. [Google Scholar] [CrossRef]
  36. Wang, Y.; He, Q.; Guo, J.; Wang, J.; Luo, Z.; Shen, T.D.; Ding, K.; Khasanov, A.; Wei, S.; Guo, Z. Ultrafine FePd Nanoalloys Decorated Multiwalled Cabon Nanotubes toward Enhanced Ethanol Oxidation Reaction. ACS Appl. Mater. Interfaces 2015, 7, 23920–23931. [Google Scholar] [CrossRef]
  37. Shkvarina, E.G.; Titov, A.A.; Shkvarin, A.S.; Plaisier, J.R.; Gigli, L.; Titov, A.N. Thermal stability of the layered modification of Cu0.5ZrTe2 in the temperature range 25–900 °C. Acta Crystallogr. Sect. Struct. Chem. 2018, 74, 1020–1025. [Google Scholar] [CrossRef]
  38. Lihl, F.; Ebel, H.; Baumgartner, W. Röntgenographische Untersuchungen zur Vegardschen Regel/X-Ray Investigations Concerning Vegard’s Law. Int. J. Mater. Res. 1971, 62, 42–45. [Google Scholar] [CrossRef]
  39. Ng, S.C.; Brockhouse, B.N.; Hallman, E.D. Characterization of large alloy single crystals by neutron diffraction. Mater. Res. Bull. 1967, 2, 69–73. [Google Scholar] [CrossRef]
  40. Otte, H.M. Lattice Parameter Determinations with an X–Ray Spectrogoniometer by the Debye–Scherrer Method and the Effect of Specimen Condition. J. Appl. Phys. 1961, 32, 1536–1546. [Google Scholar] [CrossRef]
  41. Janvelyan, N.; van Spronsen, M.A.; Wu, C.H.; Qi, Z.; Montemore, M.M.; Shan, J.; Zakharov, D.N.; Xu, F.; Boscoboinik, J.A.; Salmeron, M.B.; et al. Stabilization of a nanoporous NiCu dilute alloy catalyst for non-oxidative ethanol dehydrogenation. Catal. Sci. Technol. 2020, 10, 5207–5217. [Google Scholar] [CrossRef]
  42. Dandekar, A.; Baker, R.; Vannice, M.A. Characterization of activated carbon, graphitized carbon fibers and synthetic diamond powder using TPD and DRIFTS. Carbon 1998, 36, 1821–1831. [Google Scholar] [CrossRef]
  43. Kim, J.Y.; Rodriguez, J.A.; Hanson, J.C.; Frenkel, A.I.; Lee, P.L. Reduction of CuO and Cu2O with H2: H embedding and kinetic effects in the formation of suboxides. J. Am. Chem. Soc. 2003, 125, 10684–10692. [Google Scholar] [CrossRef] [PubMed]
  44. Choukroun, D.; Daems, N.; Kenis, T.; van Everbroeck, T.; Hereijgers, J.; Altantzis, T.; Bals, S.; Cool, P.; Breugelmans, T. Bifunctional Nickel–Nitrogen-Doped-Carbon-Supported Copper Electrocatalyst for CO2 Reduction. J. Phys. Chem. 2020, 124, 1369–1381. [Google Scholar] [CrossRef]
  45. Popov, A.A.; Varygin, A.D.; Plyusnin, P.E.; Sharafutdinov, M.R.; Korenev, S.V.; Serkova, A.N.; Shubin, Y.V. X-ray diffraction reinvestigation of the Ni-Pt phase diagram. J. Alloys Compd. 2022, 891, 161974. [Google Scholar] [CrossRef]
  46. Taniguchi, K.; Shinoda, K.; Cuya Huaman, J.L.; Yokoyama, S.; Uchikoshi, M.; Matsumoto, T.; Suzuki, K.; Miyamura, H.; Jeyadevan, B. Designed synthesis of highly catalytic Ni–Pt nanoparticles for fuel cell applications. SN Appl. Sci. 2019, 1, 124. [Google Scholar] [CrossRef]
  47. Guisbiers, G.; Mendoza-Pérez, R.; Bazán-Díaz, L.; Mendoza-Cruz, R.; Velázquez-Salazar, J.J.; José-Yacamán, M. Size and Shape Effects on the Phase Diagrams of Nickel-Based Bimetallic Nanoalloys. J. Phys. Chem. 2017, 121, 6930–6939. [Google Scholar] [CrossRef]
  48. Leteba, G.M.; Mitchell, D.R.G.; Levecque, P.B.J.; Macheli, L.; van Steen, E.; Lang, C.I. High-Index Core–Shell Ni–Pt Nanoparticles as Oxygen Reduction Electrocatalysts. ACS Appl. Nano Mater. 2020, 3, 5718–5731. [Google Scholar] [CrossRef]
  49. Wang, G.; van Hove, M.A.; Ross, P.N.; Baskes, M.I. Monte Carlo simulations of segregation in Pt-Ni catalyst nanoparticles. J. Chem. Phys. 2005, 122, 024706. [Google Scholar] [CrossRef]
  50. Iizumi, M.; Koetzle, T.F.; Shirane, G.; Chikazumi, S.; Matsui, M.; Todo, S. Structure of magnetite (Fe3O4) below the Verwey transition temperature. Acta Crystallogr. Sect. Struct. Crystallogr. Cryst. Chem. 1982, 38, 2121–2133. [Google Scholar] [CrossRef]
  51. Zwell, L.; Speich, G.R.; Leslie, W.C. Effects of Co, Cr, Ir, Pt, Re, Rh, and Ru on the lattice parameter and density of alpha iron. Metall. Trans. 1973, 4, 1990–1992. [Google Scholar] [CrossRef]
  52. Jozwiak, W.K.; Kaczmarek, E.; Maniecki, T.P.; Ignaczak, W.; Maniukiewicz, W. Reduction behavior of iron oxides in hydrogen and carbon monoxide atmospheres. Appl. Catal. A Gen. 2007, 326, 17–27. [Google Scholar] [CrossRef]
  53. Hensley, A.J.R.; Hong, Y.; Zhang, R.; Zhang, H.; Sun, J.; Wang, Y.; McEwen, J.S. Enhanced Fe2O3 Reducibility via Surface Modification with Pd: Characterizing the Synergy within Pd/Fe Catalysts for Hydrodeoxygenation Reactions. ACS Catal. 2014, 4, 3381–3392. [Google Scholar] [CrossRef]
  54. Fröhlich, G.; Sachtler, W.M.H. Reduction enhancement of Fe2O3 in physical mixtures with Pt/mordenite via Pt migration or ‘hydrogen spillover’. J. Chem. Soc. Faraday Trans. 1998, 94, 1339–1346. [Google Scholar] [CrossRef]
  55. Buschow, K.; van Engen, P.G.; Jongebreur, R. Magneto-optical properties of metallic ferromagnetic materials. J. Magn. Magn. Mater. 1983, 38, 1–22. [Google Scholar] [CrossRef]
  56. Kovács, A.; Schierholz, R.; Tillmann, K. FEI Titan G2 80-200 CREWLEY. J. Large Scale Res. Facil. 2016, 2, A43. [Google Scholar] [CrossRef]
  57. Doebelin, N.; Kleeberg, R. Profex: A graphical user interface for the Rietveld refinement program BGMN. J. Appl. Crystallogr. 2015, 48, 1573–1580. [Google Scholar] [CrossRef]
  58. Pielsticker, L.; Zegkinoglou, I.; Divins, N.J.; Mistry, H.; Chen, Y.T.; Kostka, A.; Boscoboinik, J.A.; Cuenya, B.R. Segregation Phenomena in Size-Selected Bimetallic CuNi Nanoparticle Catalysts. J. Phys. Chem. B 2018, 122, 919–926. [Google Scholar] [CrossRef]
  59. Crespo, P.; Hernando, A.; Yavari, R.; Drbohlav, O.; García Escorial, A.; Barandiarán, J.M.; Orúe, I. Magnetic behavior of metastable fcc Fe-Cu after thermal treatments. Phys. Rev. Condens. Matter 1993, 48, 7134–7139. [Google Scholar] [CrossRef]
  60. Delage, S.; Legrand, B.; Soisson, F.; Saúl, A. Dissolution modes of Fe/Cu and Cu/Fe deposits. Phys. Rev. Condens. Matter 1998, 58, 15810–15820. [Google Scholar] [CrossRef]
  61. Dulot, F.; Kierren, B.; Malterre, D. Influence of the initial step density on the growth mechanisms of the Fe/Cu(100) interface. Surf. Sci. 2001, 494, 229–237. [Google Scholar] [CrossRef]
  62. Shim, Y.; Amar, J.G. Step instabilities in Fe/Cu(100) growth. Phys. Rev. Mater. 2017, 1, 043403. [Google Scholar] [CrossRef]
  63. Cardarelli, F. Materials Handbook: A Concise Desktop Reference, 3rd ed.; Springer eBook Collection; Springer International Publishing: Cham, Switzerland, 2018. [Google Scholar] [CrossRef]
  64. Wiberg, E.; Wiberg, N.; Fischer, G. Lehrbuch der Anorganischen Chemie, 102., stark umgearbeitete und verbesserte auflage ed.; Walter de Gruyter: Berlin, Germany; New York, NY, USA, 2007. [Google Scholar]
  65. Jette, E.R.; Foote, F. Precision Determination of Lattice Constants. J. Chem. Phys. 1935, 3, 605–616. [Google Scholar] [CrossRef]
  66. Zenou, V.Y.; Fowler, D.E.; Gautier, R.; Barnett, S.A.; Poeppelmeier, K.R.; Marks, L.D. Redox and phase behavior of Pd-substituted (La,Sr)CrO3 perovskite solid oxide fuel cell anodes. Solid State Ionics 2016, 296, 90–105. [Google Scholar] [CrossRef]
  67. Hong, K.H.; McNally, G.M.; Coduri, M.; Attfield, J.P. Synthesis, Crystal Structure, and Magnetic Properties of MnFe3O5. Z. Anorg. Allg. Chem. 2016, 642, 1355–1358. [Google Scholar] [CrossRef]
  68. Didier, C.; Pang, W.K.; Guo, Z.; Schmid, S.; Peterson, V.K. Phase Evolution and Intermittent Disorder in Electrochemically Lithiated Graphite Determined Using in Operando Neutron Diffraction. Chem. Mater. 2020, 32, 2518–2531. [Google Scholar] [CrossRef]
Figure 1. Diffractogram of copper-based catalyst materials obtained by impregnation after calcination at 500 °C. The measurements were taken in the range of 10° to 90° 2Θ with Cu α radiation. Shown from top to bottom are: Cu99Ni1/C in black, Cu99Fe1/C in red, and Cu/C in gray with activated carbon (blue) as a background. The indices represent the desired chemical composition in atomic percent. The background is not subtracted in the graphs. Cu reflexes are indexed as stars.
Catalysts 14 00215 g001
Figure 2. TPR measurements of impregnation-prepared copper catalysts Cu/C, Cu99Fe1/C, and Cu99Ni1/C. Displayed is the mass-normalized signal of the TCD. Measurement conditions: 2% H2 in argon, V ˙ = 30 mL/min, and β = 10 K/min.
Catalysts 14 00215 g002
Figure 3. STEM images for the Cu99Ni1/C and Cu99Fe1/C catalysts.
Catalysts 14 00215 g003
Figure 4. Diffraction patterns of the nickel-containing catalyst materials after calcination at 500 °C for four hours in a nitrogen stream. Measurement range: from 10° to 90° 2Θ with Cu-Kα radiation λ = 0.15406 nm. From top to bottom: Ni99Pt1/C in black, Ni/C in red, and activated carbon as the background in blue. Nickel reflections are marked with stars.
Catalysts 14 00215 g004
Figure 5. TPR measurements of the nickel catalysts Ni/C and NiPt/C produced by impregnation. The mass-normalized signal of the TCD is shown. Measurement conditions: 2%H2 in argon, V ˙ = 30 mL/min, and β = 10 K/min.
Catalysts 14 00215 g005
Figure 6. TEM images of the Ni99Pt1/C catalyst at various magnifications in dark field. Catalyst particles with dispersed nanoparticles (a), enlarged sections of the catalyst particle (b,c) and an isolated nanoparticle (d) are shown.
Catalysts 14 00215 g006
Figure 7. Diffractogram of the iron-containing catalyst materials after calcination at 500 °C for four hours in a nitrogen stream. Measurement range: from 10° to 90° 2Θ with Cu–K α 1 radiation λ = 0.15406 nm. From top to bottom: Fe99Pt1/C in black, Fe99Pd1/C in red, Fe/C in gray, and activated carbon as the background in blue. Reflections for Fe3O4 are indicated with stars.
Catalysts 14 00215 g007
Figure 8. TPR measurements of the iron catalysts Fe/C, Fe99Pd1/C, and Fe99Pt1/C produced by impregnation. The mass-normalized signal of the TCD is shown. Measurement conditions: 2%H2 in argon, V ˙ = 30 mL/min, and β = 10 K/min.
Catalysts 14 00215 g008
Figure 9. STEM images of the iron-based catalysts.
Catalysts 14 00215 g009
Figure 10. STEM–EDX images of the Fe99Pd1/C catalyst, displaying the STEM image in dark field (a), the overlay of the EDX mappings of Fe and Pd (b), as well as the element mappings for the signals of Fe (c) and Pd (d).
Catalysts 14 00215 g010
Figure 11. Representation of the calculated TOF for the bimetallic impregnation catalysts against the theoretically predicted d-band center ϵ d . The XRD and TEM indices describe the method for calculating the particle sizes. (Compare Supplementary Materials S2). The calculated TOFs from this work are shown in red and green boxes. Stars mark the TOFs from previous publications [12].
Catalysts 14 00215 g011
Table 1. Phase analysis results of XRD measurements for copper catalysts.
MaterialPhase a = b = c (nm)w(Phase) 1
%
d(Crystallite)
(nm)
Cu/CCu0.36165 ± 0.0001210037.4 ± 1.9
Cu99Ni/CNiO2–642.44 ± 0.26
Cu100Ni00.36157 ± 0.0002994 ± 428.4 ± 2.6
Cu99Fe/CCu0.361570 ± 0.00001410034.6 ± 0.6
1 w(Phase) denotes the mass fraction of a phase in the crystalline portion of the catalyst material.
Table 2. Peak positions for the TPR measurements of copper catalysts, obtained by decomposition using Gaussian functions. Calibration factor f TCD = 9.192 09 × 10−8 mmol s/mV determined with CuO 99.9995% purity.
MaterialPeak T max
°C
H2 Consumption
mmol/g
A i / A ges
%
Cu
mmol/g
Cu
wt%
Cu/CI1880.16314.64CuO → Cu0.16274.42
II3130.0746.67CuO → Cu0.074
III6070.87578.69Cu2O → Cu0.437
Cu99Ni/CI1970.282818.44CuO → Cu0.28286.32
II3180.1127.30CuO → Cu0.112
III6021.13974.25Cu2O → Cu0.570
Cu99Fe/CI1980.262823.34CuO → Cu0.26284.93
II3280.11710.37CuO → Cu0.117
III5900.74666.29Cu2O → Cu0.373
Table 3. Detected peak positions for the TPR measurements of the nickel catalysts, obtained by decomposition using Gaussian functions. The calibration factor f TCD = 9.192 × 10⁻⁸ mmol s/mV was determined with CuO at 99.9995 % purity.
MaterialPeak T max
°C
H2 Consumption
mmol/g
Metal
mmol/g
w ( Metal )
wt%
Ni/CI2380.190Ni2O3 → Ni0.1276.65
II2780.308NiO → Ni0.308
III4480.699NiO → Ni0.700
IV6500.100Activated carbon
Ni99Pt/CI760.071Ni2O3(Pt) → Ni0.0473.06
II4200.474NiO → Ni0.474
III5830.089Activated carbon
Table 4. Identified peak positions for the TPR measurements of the iron catalysts, obtained by decomposition using Gaussian functions [52]. The calibration factor f TCD = 9.19209 × 10⁻⁸ mmol s/mV was determined with CuO at 99.9995% purity.
MaterialPeak T max
°C
H2 Consumption
mmol/g
A i / A tot
%
n(Fe)
mmol/g
Fe/CI3380.028020.11Fe2O3 → Fe3O41.8765
II5230.107577.36Fe3O4 → FeO3.6087
III5950.00352.53FeO → Fe0.0393
IV626−0.0158 Activated carbon
V −0.0298
Fe99Pd/CI3120.020224.98Fe2O3 → Fe3O42.2381
II4760.057471.01Fe3O4 → FeO3.1808
III5480.00324.01FeO → Fe0.0599
IV586−0.0060 Activated carbon
V −0.1034
Fe99Pt/CI3420.038332.93Fe2O3 → Fe3O42.8071
II5290.074564.13Fe3O4 → FeO2.7334
III5580.00342.94FeO → Fe0.0418
IV590−0.0227 Activated carbon
V −0.0130
Table 5. Tabular listing of the yields and selectivities of the main products from the catalytic experiments for the impregnation-produced bimetallic catalysts. Reaction conditions: t R = 4 h, c EtOH = 1600 mmol/L, c NaOH = 450 mmol/L, c n-Decan = 15 mmol/L, T = 150 °C.
No.Catalyst X EtOH Selectivity (Yield) in %
%Acetaldehyde1-Propanoli-Butanol2-Methylbutan-1-ol
1Cu/C
2Cu99Ni1/C 10.357.64 (0.03)53.62 (0.19)31.09 (0.11)
3Cu99Fe1/C 20.417.96 (0.03)24.40 (0.10)62.25 (0.25)
4Ni/C0.0757.53 (0.04)23.57 (0.02)18.90 (0.01)
5Ni99Pt1/C 30.604.37 (0.03)52.95 (0.32)21.74 (0.13)
6Fe/C
7Fe99Pd1/C0.0870.02 (0.06)29.98 (0.03)
8Fe99Pt1/C 40.0941.36 (0.04)20.85 (0.02)20.18 (0.02)
1 Acetone: S = 7.65%, Y = 0.03%. 2 Acetone: S = 5.39%, Y = 0.02%. 3 2-Ethylbutan-1-ol: S = 15.03%, Y = 0.09%, 1-Butanol: S = 5.90%, Y = 0.04%. 4 Ethyl formate: S = 17.61%, Y = 0.02%.
Table 6. Tabulated values for ICP–OES-determined catalyst composition and single-point BET areas. The BET areas were measured at p / p 0 = 0.249 and T = 77 K.
No.CompositionA(BET)
m 2 g
13.6%Ni99.77Pt0.23/C725.64
23.9%Cu99.97Ni0.03/C732.78
34.5%Cu99.94Fe0.06/C734.94
44.1%Fe99.62Pd0.38/C744.10
53.5%Fe99.59Pt0.41/C761.84
Table 7. TOFs for the bimetallic impregnation catalysts.
No.Catalyst ϵ d  1 ϵ d  2 d XRD d TEM  3ci-ButOHTOF in 1/h
eVeVnmnmmmol/LXRDTEM
1CuNi/C−2.40−2.4928.4022.303.016.595.20
2CuFe/C−2.11−2.4234.6426.311.603.652.78
3NiPt/C−2.09−2.825.105.315.122.162.24
4FePd/C−2.16−2.243.984.950.400.110.14
5FePt/C−2.01−2.403.974.750.300.100.11
1 Calculation from [22] for the case of a 1% surface doping. 2 Calculation from [22] for the case of a monolayer of foreign metal on the particle surface. 3 Median.
Disclaimer/Publisher’s Note: The statements, opinions and data contained in all publications are solely those of the individual author(s) and contributor(s) and not of MDPI and/or the editor(s). MDPI and/or the editor(s) disclaim responsibility for any injury to people or property resulting from any ideas, methods, instructions or products referred to in the content.

