Article

Estimating the Anti-Viral Performance of Photocatalytic Materials: The Correlation between Air Purification Efficiency and Severe Acute Respiratory Syndrome Coronavirus 2 Inactivation

1
Kawasaki Technical Support Department, Local Independent Administrative Agency Kanagawa Institute of Industrial Science and Technology (KISTEC), Ground Floor East Wing, Innovation Center Building, KSP, 3-2-1 Sakado, Takatsu-ku, Kawasaki 213-0012, Kanagawa, Japan
2
Research and Development Department, KISTEC, 3-25-13 Tonomachi, Kawasaki 210-0821, Kanagawa, Japan
*
Author to whom correspondence should be addressed.
Catalysts 2024, 14(3), 163; https://doi.org/10.3390/catal14030163
Submission received: 30 December 2023 / Revised: 17 February 2024 / Accepted: 18 February 2024 / Published: 23 February 2024
(This article belongs to the Special Issue Surface Microstructure Design for Advanced Catalysts)

Abstract

:
The coronavirus disease 2019 pandemic has increased the demand for anti-viral products. Photocatalytic materials are used to develop coatings and air purifiers that inactivate severe acute respiratory syndrome coronavirus 2. However, the methods for evaluating the anti-viral performance of photocatalytic materials are time-consuming. To address this problem, herein, we propose a screening test for the anti-viral performance of photocatalytic materials based on the ‘acetaldehyde decomposition test’—an air purification efficiency test used to evaluate the decomposition performance of photocatalytic materials. This test is suitable for screening multiple samples and conditions in a short period. The temporal variation in the acetaldehyde concentration was approximated using an exponential function, similar to the temporal variation in the viral infection values. Thereafter, the slope of the regression line for the acetaldehyde concentration over time was used as an indicator in the screening tests. When the anti-viral performance and acetaldehyde decomposition tests were conducted on the same photocatalytic material, a correlation was observed between the slopes of the regression lines. Overall, the proposed screening test shows good potential for evaluating the anti-viral performance of photocatalytic materials.

Graphical Abstract

1. Introduction

The World Health Organization declared the coronavirus disease 2019 (COVID-19) outbreak a pandemic on 11 March 2020 and announced the end of the Public Health Emergency of International Concern on 5 May 2023 [1]. However, this announcement does not imply that the pandemic is over. As of 7 December 2023, the number of confirmed cases of COVID-19 and associated deaths has been reported daily [2]. In the era of ‘living with COVID-19′, there are still various situations where infection control measures are required. Accordingly, researchers are continuing to evaluate the effectiveness of these public health measures [3].
Photocatalysts have a strong oxidising potential [4,5], and their anti-bacterial and anti-viral effects have been well established [6]. The research has indicated the effectiveness of photocatalytic coatings and air purifiers in combatting COVID-19 [7,8]. However, evaluating the anti-viral performance of photocatalytic materials is a time-consuming and labour-intensive process [9,10]. In particular, evaluating various materials under different manufacturing conditions or conducting demonstration tests under various product usage conditions can be impractical. If researchers were to evaluate each material and/or condition, the time required for product development would substantially exceed the schedule targets; thus, there are many cases where researchers decide to forego anti-viral performance testing. A screening test for anti-viral performance could enable researchers to conduct simple tests on a variety of samples and under a range of conditions in a short period and then request detailed anti-viral performance testing for samples that exhibit good results. This ‘selection and concentration’ approach can accelerate research and development.
In this study, we comprehensively analysed the decomposition performance of substances used in Japanese Industrial Standards (JIS)/International Organization for Standardization (ISO) tests for photocatalysts and evaluated their suitability as screening tests. Our findings provide a basis for the application of a modified acetaldehyde decomposition performance test for preliminary evaluations of the anti-viral performance of candidate photocatalytic materials.

2. Results

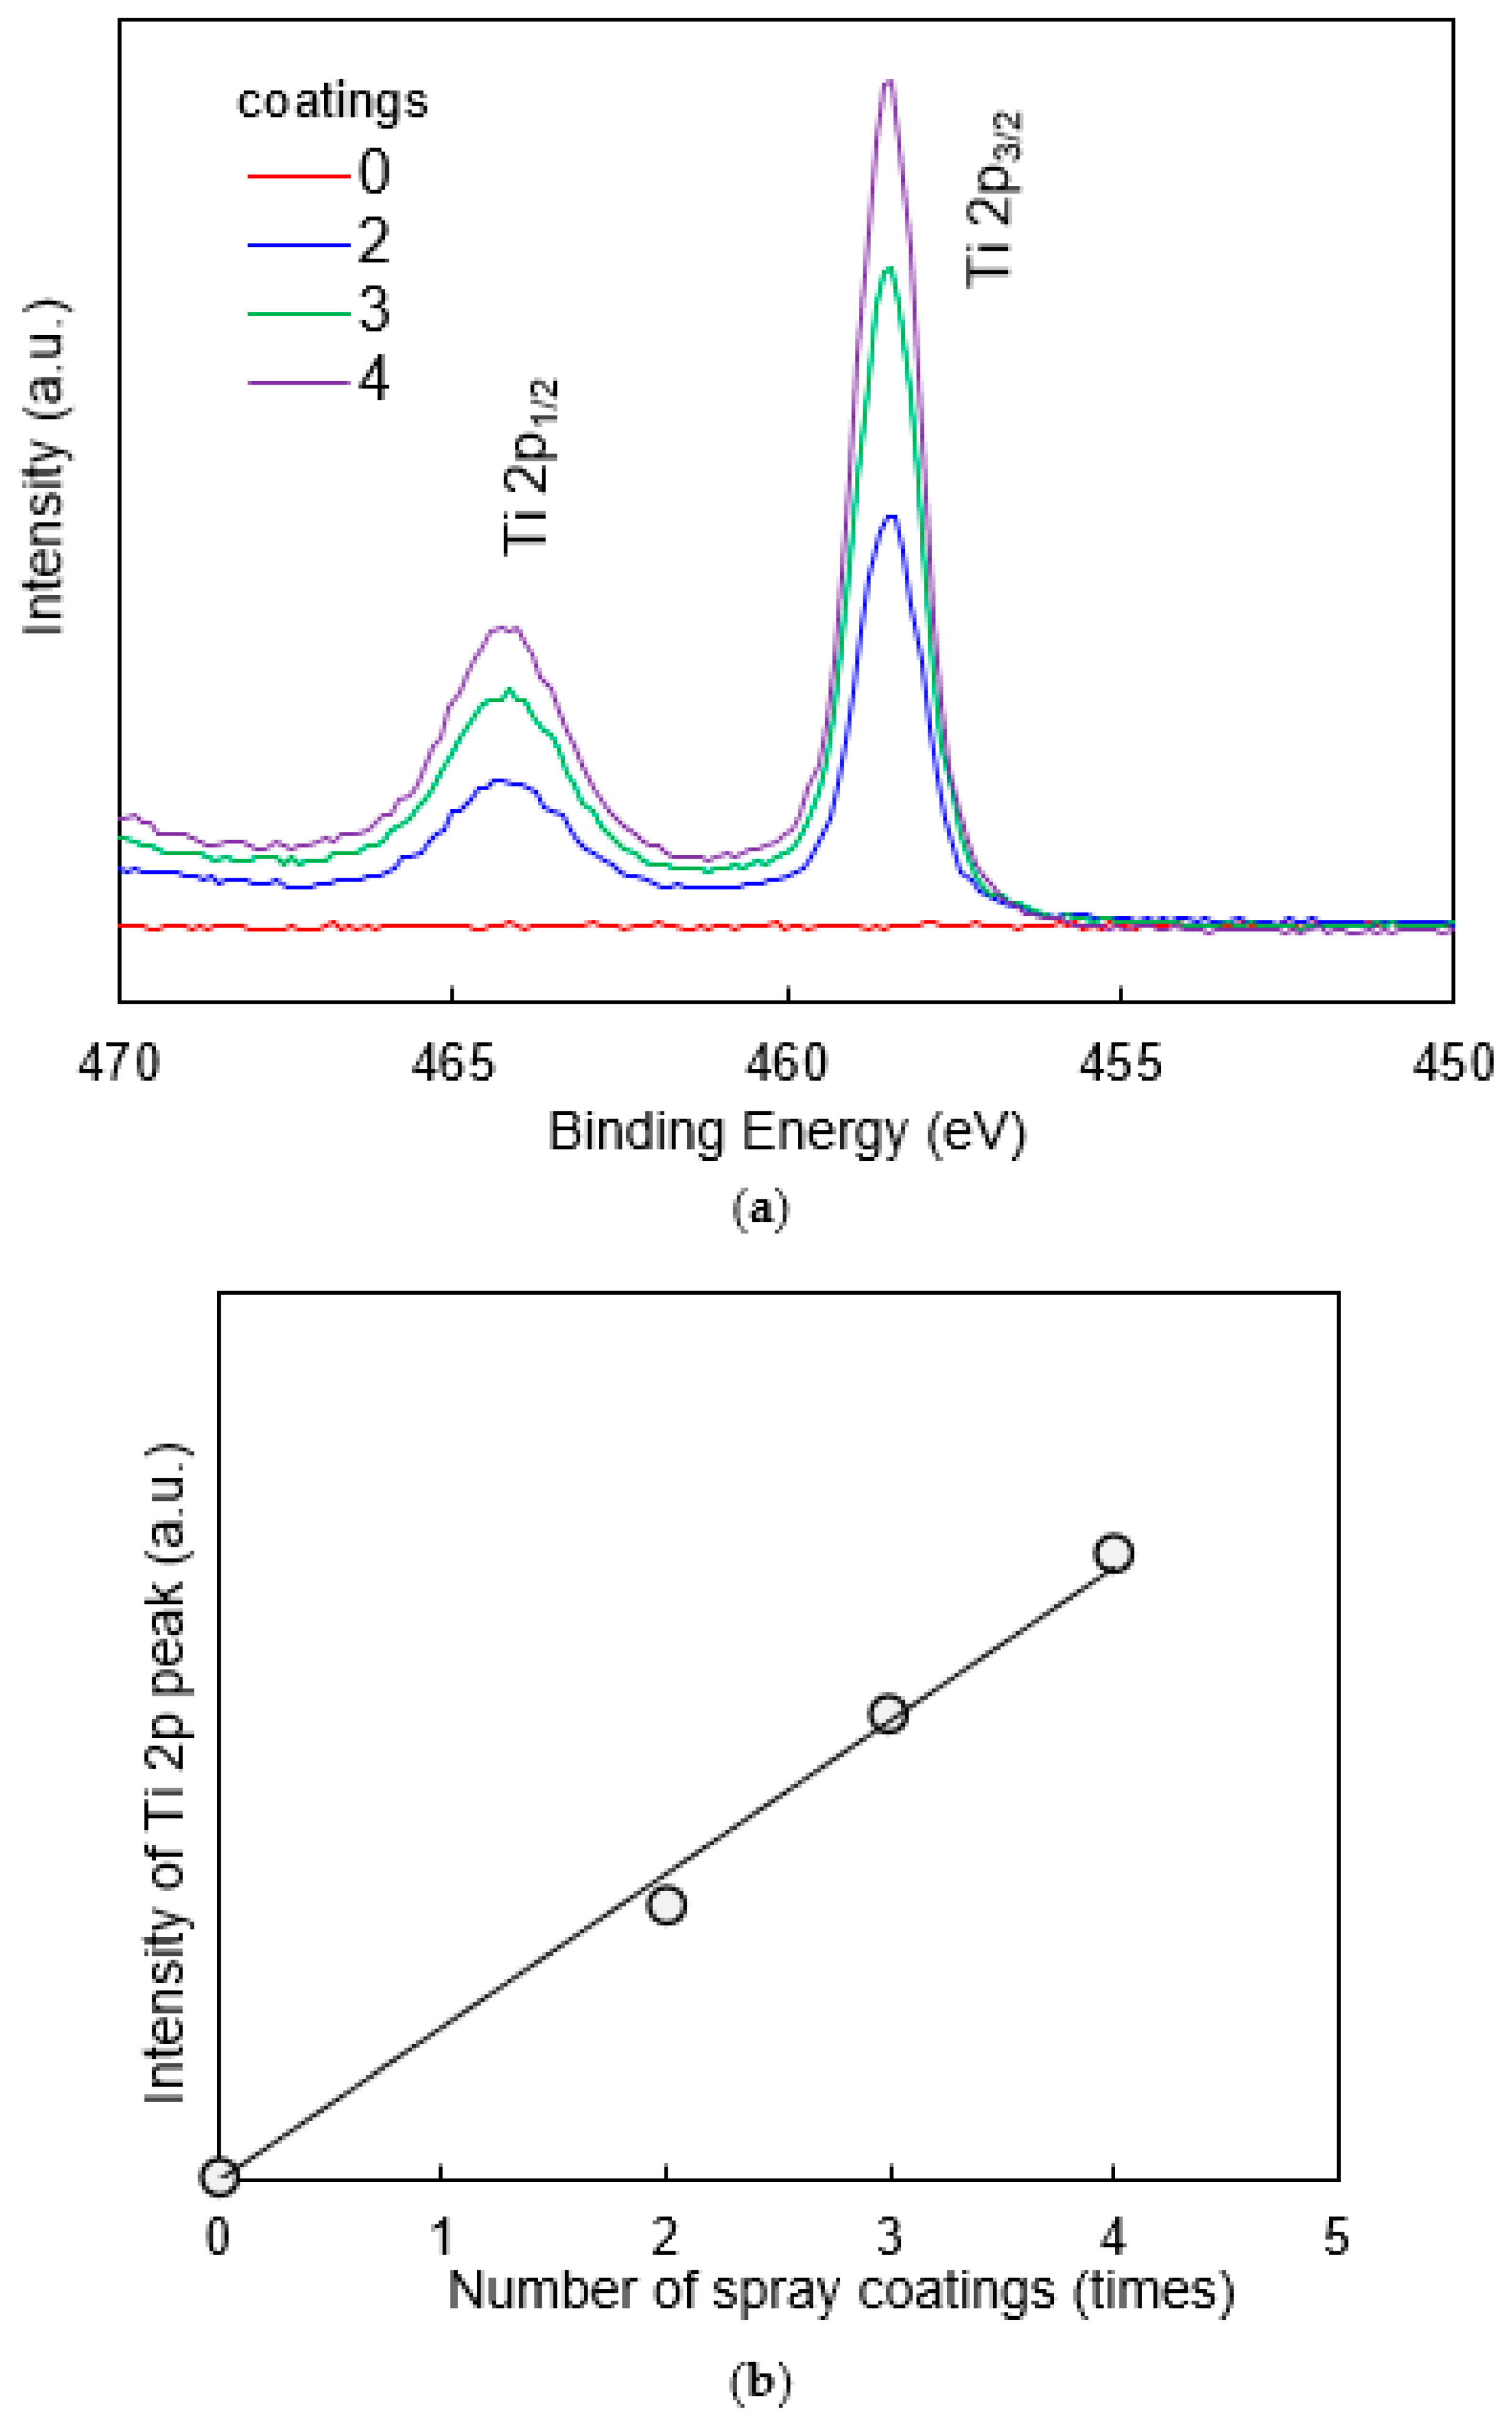
2.1. Analysis of the Surface Microstructure of the Samples

Scanning electron microscopy (SEM) images of the sample surfaces with different numbers of spray coatings of the photocatalyst solution (i.e., two, three, four, and eight) are shown in Figure 1. The droplets of the photocatalyst solution sprayed onto the glass dried, and the photocatalyst particles were scattered in an agglomerated state on the surface. The shapes of the photocatalyst-coated area were observed in the SEM images based on a higher brightness than that of the background. The size of the photocatalyst-coated area increased as the number of spray coatings increased (Figure 1a–c). Moreover, the glass surface was completely covered with the photocatalyst in the sample with eight spray coatings, and several cracks were detected on the surface (Figure 1d).
The SEM images in Figure 1 show that the surface coverage of the photocatalyst on the glass substrate increased from zero to four coats and the glass substrate was completely covered with the photocatalyst by eight coats. Therefore, a surface analysis using X-ray photoelectron spectroscopy (XPS) was performed on the samples with zero to four coats. Figure 2a shows the XPS Ti 2p spectra of the sample surfaces with different numbers of spray coatings of the photocatalyst solution. At more than two coatings, Ti 2p peaks were detected, and the peak intensity increased as the number of spray coatings increased. Moreover, a linear correlation was observed between the number of spray coatings and the intensity of the Ti 2p peaks (Figure 2b). The ratio of elements present on the sample surface was estimated from the major peaks detected, Ti 2p, Si 2p, and O 1s (Figure 3). The ratio of the Ti elements increased and that of the Si elements decreased with the number of applications. This result is reasonable and consistent with the appearance of the sample surface shown in Figure 1. On the contrary, no significant change was observed in the ratio of the oxygen elements. As both glass (SiO2) and the photocatalyst (TiO2) are oxides with the same stoichiometric ratio, this finding suggests that the ratio of oxygen elements did not change, despite the change in the distribution of the two oxides on the sample surface.

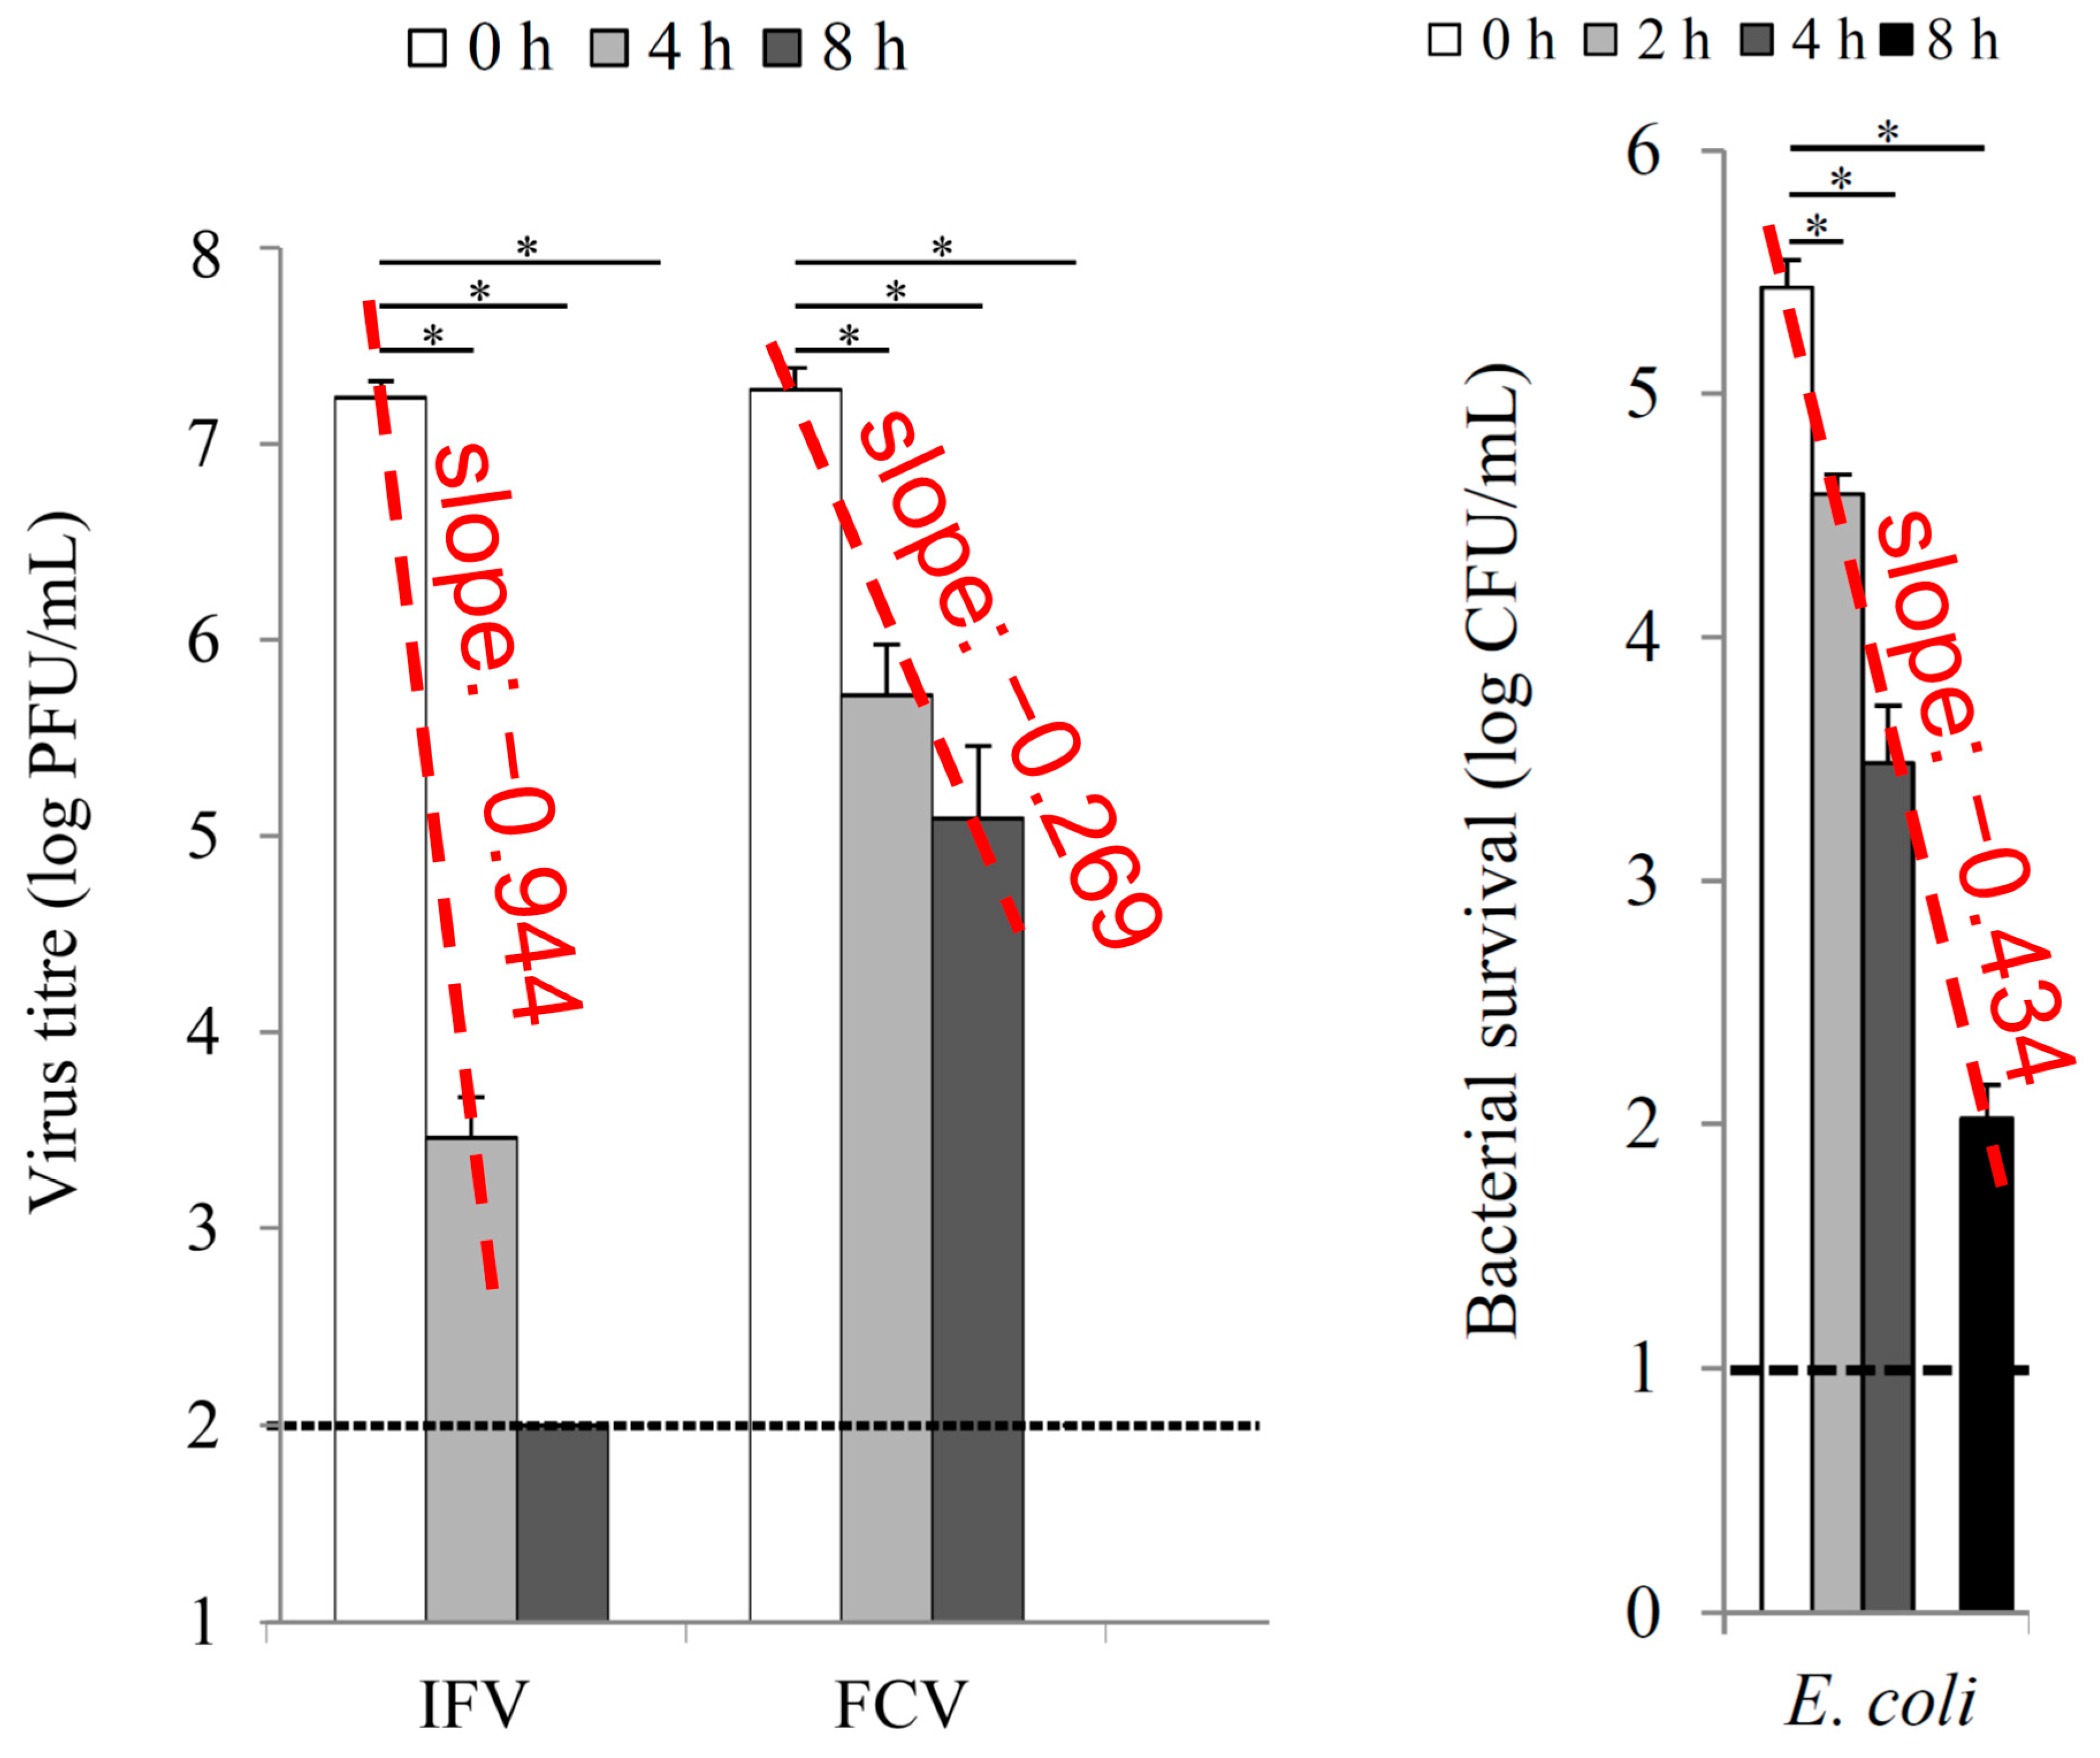
2.2. Analysis of Severe Acute Respiratory Syndrome Coronavirus 2 (SARS-CoV-2) Inactivation Test Results

Figure 4 is an example of the SARS-CoV-2 inactivation test results obtained using the experimental method described in Section 4. The titre of SARS-CoV-2, which is a measure of the virus concentration in the sample, is plotted on the vertical axis against the ultraviolet (UV) irradiation time of the sample, which is plotted on the horizontal axis. The viral titre decreased exponentially, with the dotted line in Figure 4 representing an approximation of this exponential function. This exponential behaviour has been reported previously [11]. A steeper slope of this exponential function corresponds to a better anti-viral performance. Therefore, the screening test which we aimed to develop in this study must be simple enough to estimate the slope of this exponential function.

2.3. Comparative Analysis of Various JIS/ISO Test Results

Figure 5 is an example of the results of various JIS tests. We compared the results with the exponential decay behaviour of the novel SARS-CoV-2 described in the previous section. The results of the JIS R1701-2 [12]/ISO 22197-2 [13] acetaldehyde removal test are shown in Figure 5a; this test involves passing the reactants through a reactor, resulting in a rectangular-shaped graph. According to the removal amount that can be determined from this graph, the photocatalytic performance can be quantified; however, the exponential decay behaviour of the novel SARS-CoV-2 is fundamentally different from that of the chemical engineering reaction mechanism, making it difficult to analyse the correlation with the observed exponential decay behaviour. The results of the JIS R1703-1 [14]/ISO 27448 [15] test are shown in Figure 5b; this test was used to quantify the decomposition of oleic acid on the surface and the subsequent super-hydrophilisation behaviour based on the water contact angle. The method is similar to that of the inactivation test applied to the novel SARS-CoV-2, and, similar to the inactivation test, the graphical representation of the results exhibits an exponential relationship between the decomposition behaviour and time. However, the numerical values are affected by super-hydrophilisation, which has a surface reaction principle different from that of organic matter decomposition, making it difficult to interpret the correlation. In addition, the test generally takes a long time, making it unsuitable for screening in practical applications. The JIS R1703-2 [16]/ISO 10678 [17] test, whose results are shown in Figure 5c, is classified as a self-cleaning performance test; however, it essentially involves monitoring the decolourisation of methylene blue in an aqueous solution, making it similar to the water purification test that will be explained next. The decolourisation of methylene blue does not involve simple decomposition but is potentially influenced by electron transfer, in which case the resulting graph is linear, making it difficult to discuss the correlation. Finally, the JIS R1704 [18]/ISO 10676 [19] test, whose results are shown in Figure 5d, involves observing the decomposition of dimethyl sulfoxide (DMSO) in aqueous solutions; this test showed the highest correlation. However, the size of the sample required for the test is 10 cm × 10 cm, which is four times that in the anti-viral performance test; therefore, the volume and capacity of the reactor and DMSO aqueous solution are increased. Furthermore, it is necessary to analyse the decomposition of DMSO and the generation of methane sulphonic acid using gas and ion chromatography at each step, making it less suitable for simple screening tests.

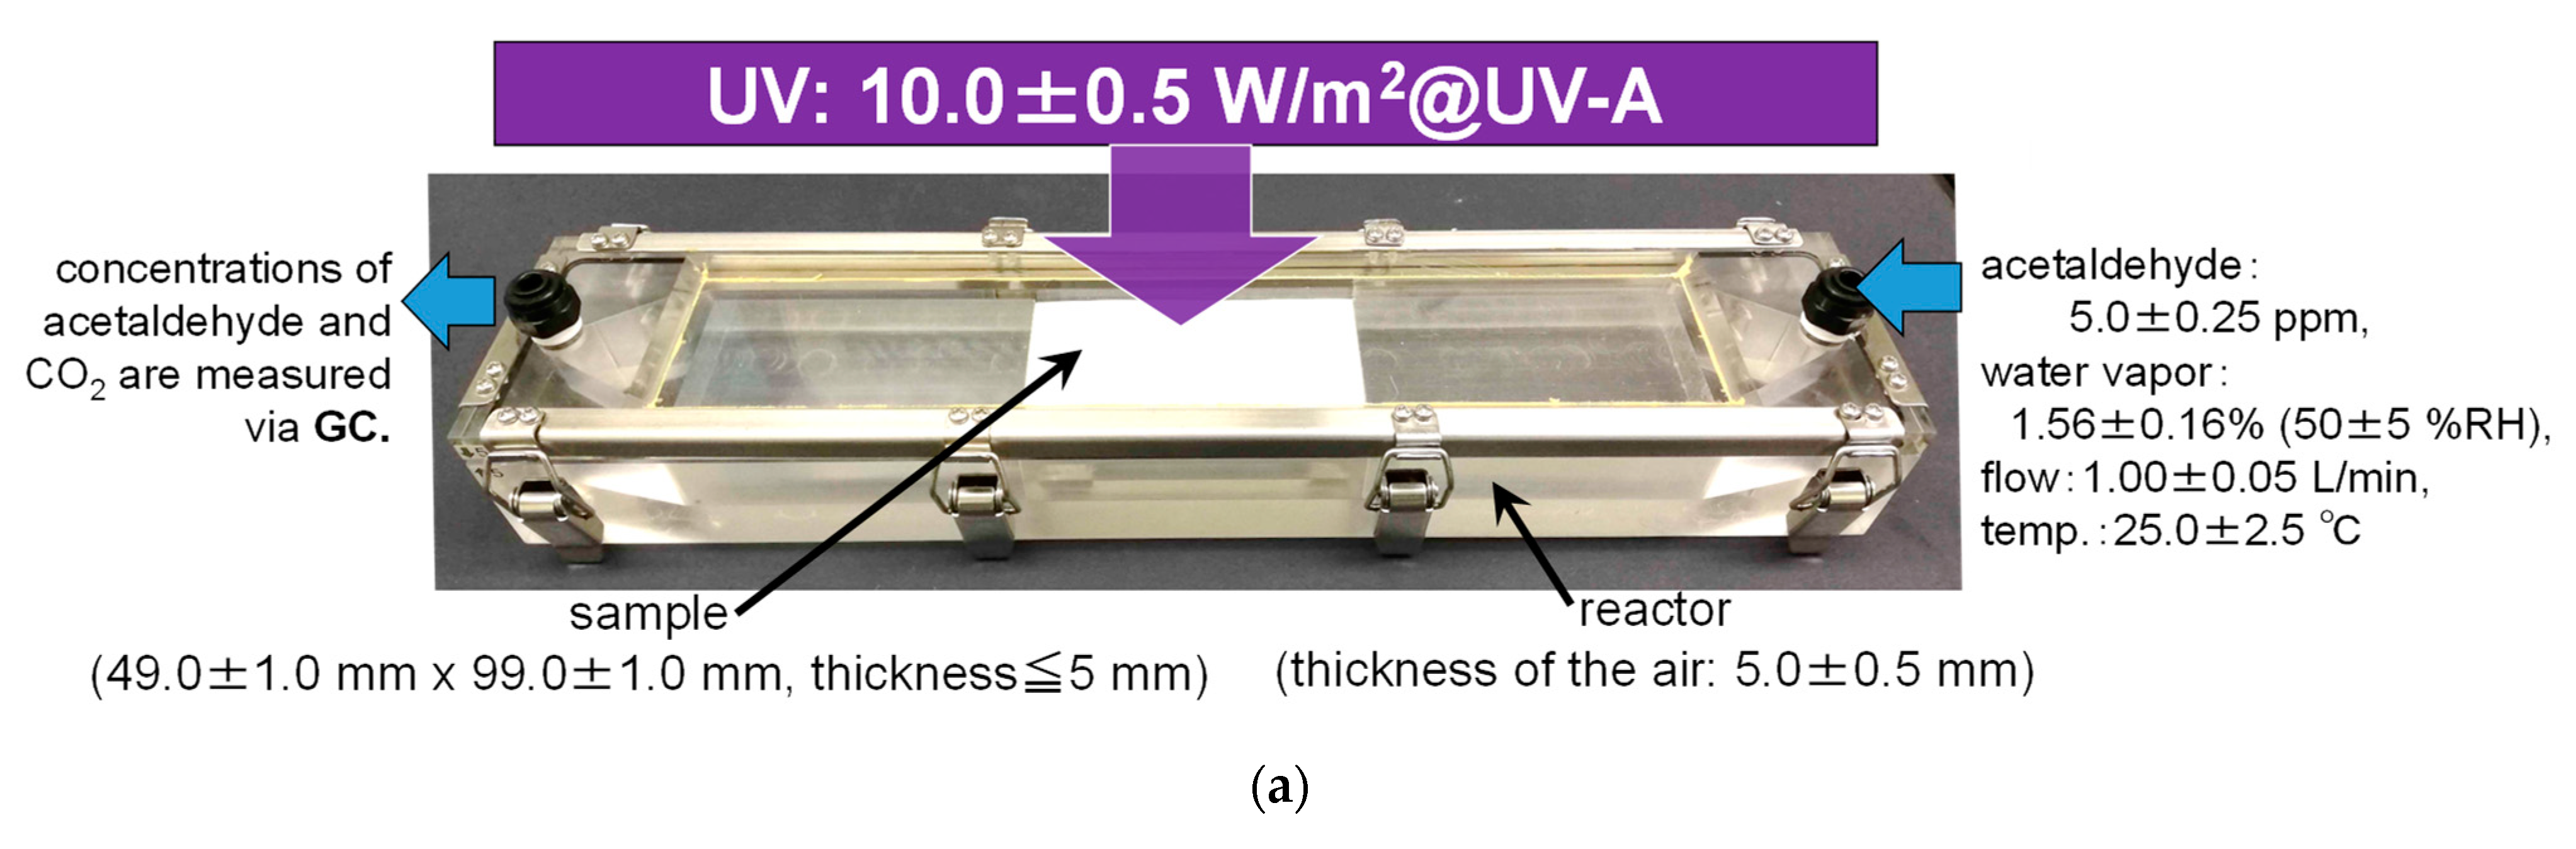
2.4. Modification of the Acetaldehyde Decomposition Test (JIS R1757/ISO 19652)

Based on the aforementioned findings, the acetaldehyde decomposition test (JIS R1757 [20]/ISO 19652 [21]) was selected as a candidate screening test. However, this test involves applying powdered samples uniformly in a dish with an inner diameter of 60 mm and exposing them to visible light (10,000 lx). The sample handling is difficult, and the test requires several tens of hours owing to the slow reaction under visible light irradiation. Consequently, it is not suitable for simple screening. Therefore, we modified the test method as follows: the powdered samples were replaced with 50 mm × 50 mm square flat samples (the same sample size used in the SARS-CoV-2 inactivation test), and visible light at 10,000 lx was replaced with UV light at 1.0 mW/cm2. An example of the results obtained using the modified test is shown in Figure 6. Similar to the viral titre shown in Figure 4 (based on the SARS-CoV-2 inactivation test), the concentration of acetaldehyde decreased exponentially. This exponential behaviour of acetaldehyde is consistent with previous study results [22]. A steeper slope of this exponential function corresponds to a better acetaldehyde decomposition performance. Furthermore, these modifications allowed us to shorten the time required to complete the decomposition to approximately 1–2 h (if only the slope of the exponential function needed to be calculated, a few tens of minutes would be sufficient). In addition, as this is a non-destructive test, the samples tested can be used directly for anti-viral performance testing.

2.5. Comparative Analysis of the Acetaldehyde Decomposition Test and SARS-CoV-2 Inactivation Test Results for Various Samples

The anti-viral performance test and acetaldehyde decomposition test using the new SARS-CoV-2 were used to evaluate samples with four photocatalyst amounts; the results are shown in Figure 7. Points shown in the same colour for both tests indicate the test results for samples with the same amount of photocatalyst. The sample whose results are shown in red, which had the smallest photocatalyst amount, had the worst ‘anti-viral performance’ and ‘acetaldehyde decomposition performance’ against the new SARS-CoV-2 among the four samples (the numbers with a minus sign from the slope approximated using an exponential function are small). As the photocatalyst amount increased (from yellow to green and then to blue), the numbers with a minus sign from the slope—approximated using an exponential function—increased. This finding suggests that there is a correlation between the ‘anti-viral performance’ and ‘acetaldehyde decomposition performance’ against the new SARS-CoV-2.

3. Discussion

The numbers with a minus sign from the slopes calculated in Figure 7 represent the reaction rate constants for the decrease in both the SARS-CoV-2 titre and acetaldehyde concentration, assuming first-order reactions. Figure 8 shows a graph with the ‘rate constant’ for SARS-CoV-2 on the vertical axis and the corresponding value for the acetaldehyde concentration on the horizontal axis. For the anti-viral performance test, all the tests were conducted 3 times, and for the acetaldehyde decomposition performance test, 10 tests were conducted, and the average and standard deviation were calculated. In this analysis, we observed a strong correlation with R2 = 0.943.
Photocatalytic reactions have been studied for their ability to reduce viral infectivity and decompose air pollutants. This is the first study to demonstrate a correlation between these two outcomes using the same sample. Although the novel SARS-CoV-2 was used in this study, the methodology can be applied to other viruses and pathogens. In a previous study, we compared the effects of photocatalysis on various pathogens and viruses [23]. The results indicated that although there were slight differences in the reduction in infectivity and colony numbers depending on whether the bacteria were Gram-negative or Gram-positive and whether the viruses had an envelope, photocatalysis was effective against all types of bacteria and viruses (Figure 9). The novel SARS-CoV-2 targeted in this study is classified as an enveloped virus, similar to the influenza virus; therefore, it is considered to have the same photocatalytic inactivation behaviour as that of the influenza virus. Hence, by combining the results of this study with the corresponding results for different species of bacteria or viruses, it may be possible to estimate the effects of photocatalytic materials on various pathogens and viruses.
As a representative, the graphs of infectious flacherie virus (IFV), feline calicivirus (FCV), and Escherichia coli were extracted from Figure 9 and analysed, as shown in Figure 10. Although it is a preliminary calculation, the slope was determined to be −0.944 from the two bar graphs (0–4 h) of IFV. On the contrary, the slope obtained from three FCV bars (0–8 h) was −0.269. Similarly, the slope obtained from four E. coli bars (0–8 h) was −0.434. In other words, the order of ease of inactivation is IFV > E. coli > FCV, and it was determined that inactivating IFV was 3.5 times easier than inactivating FCV. Therefore, if the results of the FCV inactivation test and acetaldehyde decomposition test were plotted as shown in Figure 8, the slope would be 3.5 times lower than the slope in Figure 8.
The advantages of this approach are as follows: (1) it can reduce the time and cost of anti-viral performance testing, (2) it can screen materials with a low anti-viral performance, and (3) it provides a quantitative indicator of the anti-viral performance of photocatalytic materials. This method can contribute to the development and evaluation of photocatalytic products for preventing the spread of SARS-CoV-2 and other viral infections. The results of this study support the usefulness of the acetaldehyde decomposition performance test as a screening method for evaluating the anti-viral performance of photocatalytic materials.

4. Materials and Methods

4.1. Photocatalyst Sample Preparation

Soda-lime glass plates (50 mm × 50 mm × 2 mm; TOSHIN RIKO Co., Ltd., Tokyo, Japan) were coated with a photocatalyst coating solution. Surface modification of the glasses with commercialised photocatalytic TiO2 (NRC 350A and 360C; Nippon Soda Co., Ltd., Tokyo, Japan) was performed using a sol-gel thin-film spray-coating method and using a spray gun and related equipment (spray gun for photocatalyst applications: F110-G10T with 4G-TA, MEIJI AIR COMPRESSOR MFG., Co., Ltd., Osaka, Japan; air compressor: TR-303EC, IRII CORPORATION, Osaka, Japan) according to the manufacturers’ instructions. First, NRC 350A was coated onto a glass surface. After coating, the samples were dried at room temperature for 48 h. NRC 360C was then coated and dried in a similar manner. By increasing or decreasing the number of times the NRC 360C solution was sprayed (two, three, four, and eight), the amount of photocatalyst on the surface was increased or decreased, respectively, and four types of samples with different organic matter decomposition performances were prepared.

4.2. Analysis of the Surface Microstructure of the Samples

The four types of samples prepared as described in Section 4.1 were analysed in terms of their surface structure and elements using SEM and XPS. The structure of the sample surface was investigated using SEM with a Scios DualBeam (FEI Company Ltd., DriveHillsboro, OR, USA) operated at an accelerating voltage of 5 kV. The elements on the sample surface were investigated using XPS with a PHI Quantera SXM™ (ULVAC-PHI, Inc., Kanagawa, Japan) with a monochromatic Al-Kα X-ray source (1486.6 eV). An Al Kα excitation source was used at a pass energy of 69.0 eV, and the energy resolution was 0.125 eV. Narrow spectra of Ti, O, and Si were obtained from an analytical area of 200 μm × 200 μm. The XPS spectra were analysed using Multipak version 9.5.0.8, calibrated by setting the C 1s carbon peak assigned to the sp3 carbon at 284.80 eV.

4.3. SARS-CoV-2 Inactivation Test

The SARS-CoV-2 strain used in this study was SARS-CoV-2/Hu/KngFJ/232RD5 (distributed by the Kanagawa Prefectural Institute of Public Health, Tokyo, Japan), and the host cells were Vero cells (CCL-81; ATCC, Manassas, VA, USA). First, to prepare the test viral suspension, the Vero cells were cultured in Eagle’s minimum essential medium (FUJIFILM Wako Pure Chemical Corporation, Osaka, Japan) supplemented with 10% foetal bovine serum (Nichirei Foods Inc., Tokyo, Japan) until they reached 90–100% confluence. After changing the medium to a serum-free medium, the cells were inoculated with SARS-CoV-2 and cultured for 4 d at 34 °C under 5% CO2 in a humid atmosphere. After confirming the cytopathic effect, the samples were centrifuged to collect the culture supernatant, which was diluted by a factor of 10 with sterile water and used as the test viral suspension. The viral infectivity titre of the test viral suspension was approximately 2.0 × 10⁶ plaque-forming units (PFU)/mL.
To conduct an anti-viral test, a test piece was set up, as shown in Figure 11, and 0.15 mL of the test viral suspension was inoculated. After being covered with a film, the viral suspension and test piece were brought into close contact. Under the light conditions, UV rays from black-light bulb (FL20S・BLB, TOSHIBA Corporation, Tokyo, Japan) were irradiated at an intensity of 0.1 mW/cm2. At different time periods, the virus was collected from the test piece using 0.9 mL of soya casein digest lecithin polysorbate medium (Eiken Chemical Co., Ltd., Tokyo, Japan). After 10-fold serial dilution of the collected solution, 0.1 mL of each diluted solution was inoculated into the host cells cultured in a six-well plate (AGC Techno Glass Co., Ltd., Shizuoka, Japan). After 1 h of culturing, an agar medium was overlaid, and after medium solidification, the cells were cultured for 5 d at 34 °C under 5% CO2 in a humid atmosphere. After fixation with formalin (FUJIFILM Wako Pure Chemical Corporation, Osaka, Japan), staining was performed with methylene blue, and the plaques were counted. The infectious titre per test piece was determined from the number of plaques and the dilution factor. The limit of detection for viral infectivity was 102 PFU/sample. All of the tests were conducted in facilities and laboratory environments equipped to detect SARS-CoV-2.

4.4. JIS/ISO Tests

Various JIS tests were conducted according to the respective protocols to evaluate the performance of the photocatalytic materials. The following tests were performed.

4.4.1. JIS R1701-2 [12]/ISO 22197-2 [13] Acetaldehyde Removal Test

This test measures the ability of photocatalytic materials to decompose acetaldehyde—a volatile organic compound that causes indoor air pollution and health problems. The test was conducted as shown in Figure 12a, using a closed chamber with a constant airflow and UV irradiation. The initial concentration of acetaldehyde was set at 5.0 ± 0.25 ppm, and the changes in concentration and CO2 generation were monitored using systematic gas chromatography (gas chromatograph system, GC-2014, Shimadzu Corporation, Kyoto, Japan; precision humidity generator, SRG-1R-1L, Daiichi Kagaku Inc., Tokyo, Japan; gas blender, GB-2C, KOFLOC Corp., Kyoto, Japan). The acetaldehyde removal rate was calculated as the ratio of the difference between the initial and final concentrations and the initial concentration.

4.4.2. JIS R1703-1 [14]/ISO 27448 [15] Self-Cleaning (Water Contact Angle) Test

This test evaluates the self-cleaning property of photocatalytic materials, which is their ability to decompose adhered organic substances on a surface, converting it into a super-hydrophilic surface under UV light. The test was conducted as shown in Figure 12b, using oleic acid as the model organic substance. The test pieces were prepared by cutting out a 100 mm ± 2 mm square flat piece of the product as a standard-size test piece. If it was not possible to cut a product into 100 mm ± 2 mm square pieces, the test piece was cut into different shapes or sizes, as long as its shape and size allowed the measurement of the contact angle at five different points. Five test pieces were prepared. Oleic acid (FUJIFILM Wako Pure Chemical Corporation, Osaka, Japan) was applied to the photocatalyst-coated surface either manually or by dipping it using a dip coater (DT-0001-S2, SDI Company Co., Ltd., Kyoto, Japan). When the initial contact angle was <20°, the test was considered invalid because it was difficult to determine whether the contact angle decreased. The coefficient of the variation in the contact angle after UV irradiation was obtained for three consecutive measurements on each test piece. If the value was ≤10%, the measurement was stopped.

4.4.3. JIS R1703-2 [16]/ISO 10678 [17] Self-Cleaning (Methylene Blue Decolourisation) Test

This test measures the ability of photocatalytic materials to decompose methylene blue (FUJIFILM Wako Pure Chemical Corporation, Osaka, Japan), a dye that can be used as an indicator of organic pollution in water. The test was conducted as shown in Figure 12c, using a fixed cylinder with a photocatalyst-coated surface and methylene blue solution. For the fixed cylinder, the total volume of the test solution was typically 35 mL, with a covered area of a 40 mm diameter. After the adsorption process using methylene blue solution (20 ± 2 μmol/L) for 12–24 h, the initial concentration of methylene blue was set at 10 ± 1 μmol/L, and the change in concentration was monitored using a spectrophotometer (UV-1800, Shimadzu Corporation, Kyoto, Japan). The methylene blue decolourisation rate was calculated as the ratio of the difference between the initial and final concentrations and the initial concentration.

4.4.4. JIS R1704 [18]/ISO 10676 [19] Water Purification and DMSO Removal Test

This test evaluates the ability of photocatalytic materials to decompose DMSO (FUJIFILM Wako Pure Chemical Corporation, Osaka, Japan)—a solvent that can be used as a model compound for sulphur-containing organic pollutants in water. The test was conducted as shown in Figure 12d, using an open chamber with a photocatalyst and DMSO solution. The initial DMSO concentration was set at 10 ppm, and the change in concentration was monitored using gas chromatography (GC-8A, Shimadzu Corporation, Kyoto, Japan). The DMSO removal rate was calculated as the ratio of the difference between the initial and final DMSO concentrations to the initial concentration.

4.5. Modified Acetaldehyde Decomposition Test (JIS R1757/ISO 19652)

The original acetaldehyde decomposition test specified in JIS R1757 [20]/ISO 19652 [21] is a test method for the complete decomposition performance of visible-light-responsive photocatalytic materials under visible light at 10,000 lx in a 0.5 L reactor, using acetaldehyde as the target gas. The concentrations of acetaldehyde and generated carbon dioxide are measured using gas chromatography. This method applies mainly to powdered photocatalytic materials composed of metal oxide semiconductors such as titanium dioxide, tungsten trioxide, and other ceramic materials. This method does not apply to film-like, plate-like, or other sheet-like photocatalytic materials.
For establishing the screening test in the present study, this method was modified as follows based on a previous report [22]: powdered samples were replaced with 50 mm square flat samples (the same sample size used in the SARS-CoV-2 inactivation test), and visible light at 10,000 lx was replaced with UV light at 1.0 mW/cm2. The samples were tested in a 0.5 L reactor; a photograph of the setup is shown in Figure 13.

Author Contributions

Conceptualisation of ideas, experimental methodology, data curation, writing—original draft, T.O., T.N., K.H., T.T. and H.I.; investigation and validation, T.O., T.N., K.H., T.T. and D.A.; writing—review and editing, K.S. All authors have read and agreed to the published version of the manuscript.

Funding

This study received no external funding.

Data Availability Statement

Data are contained within the article.

Conflicts of Interest

The authors declare no conflicts of interest.

References

  1. Coronavirus Disease (COVID-19) Pandemic. Available online: https://www.who.int/europe/emergencies/situations/covid-19 (accessed on 7 December 2023).
  2. Coronavirus (COVID-19) Dashboard. Available online: https://covid19.who.int/ (accessed on 7 December 2023).
  3. Talic, S.; Shah, S.; Wild, H.; Gasevic, D.; Maharaj, A.; Ademi, Z.; Li, X.; Xu, W.; Mesa-Eguiagaray, I.; Rostron, J.; et al. Effectiveness of public health measures in reducing the incidence of COVID-19, SARS-CoV-2 transmission, and COVID-19 mortality: Systematic review and meta-analysis. BMJ 2021, 375, e068302. [Google Scholar] [CrossRef] [PubMed]
  4. Fujishima, A.; Honda, K. Electrochemical Photolysis of Water at a Semiconductor Electrode. Nature 1972, 238, 37–38. [Google Scholar] [CrossRef] [PubMed]
  5. Chiu, Y.-H.; Chang, T.-F.M.; Chen, C.-Y.; Sone, M.; Hsu, Y.-J. Mechanistic insights into photodegradation of organic dyes using heterostructure photocatalysts. Catalysts 2019, 9, 430. [Google Scholar] [CrossRef]
  6. Fujishima, A.; Zhang, X.; Tryk, D.A. TiO2 photocatalysis and related surface phenomena. Surf. Sci. Rep. 2008, 63, 515–582. [Google Scholar] [CrossRef]
  7. Mathur, G. COVID killing air purifier based on UV & titanium dioxide based photocatalysis system. SAE Int. J. Adv. Curr. Pract. Mobil. 2021, 4, 143–150. [Google Scholar] [CrossRef]
  8. Matsuura, R.; Lo, C.-W.; Wada, S.; Somei, J.; Ochiai, H.; Murakami, T.; Saito, N.; Ogawa, T.; Shinjo, A.; Benno, Y.; et al. SARS-CoV-2 Disinfection of Air and Surface Contamination by TiO2 Photocatalyst-Mediated Damage to Viral Morphology, RNA, and Protein. Viruses 2021, 13, 942. [Google Scholar] [CrossRef] [PubMed]
  9. ISO 18061:2014; Fine Ceramics (Advanced Ceramics, Advanced Technical Ceramics), Determination of Antiviral Activity of Semiconducting Photocatalytic Materials, Test Method Using Bacteriophage Q-Beta. International Organization for Standardization: Geneva, Switzerland, 2014.
  10. ISO 27447:2019; Fine Ceramics (Advanced Ceramics, Advanced Technical Ceramics), Test Method for Antibacterial Activity of Semiconducting Photocatalytic Materials. International Organization for Standardization: Geneva, Switzerland, 2019.
  11. Israel, A.; Shenhar, Y.; Green, I.; Merzon, E.; Golan-Cohen, A.; Schäffer, A.A.; Ruppin, E.; Vinker, S.; Magen, E. Large-Scale Study of antibody titer decay following BNT162b2 mRNA vaccine or SARS-CoV-2 infection. Vaccines 2022, 10, 64. [Google Scholar] [CrossRef] [PubMed]
  12. JIS R 1701-2:2016; Fine Ceramics (Advanced Ceramics, Advanced Technical Ceramics)—Test Method for Air Purification Performance of Photocatalytic Materials—Part 2: Removal of Acetaldehyde. Japanese Standards Association: Tokyo, Japan, 2016.
  13. ISO 22197-2:2019; Fine Ceramics (Advanced Ceramics, Advanced Technical Ceramics)—Test Method for Air-Purification Performance of Semiconducting Photocatalytic Materials—Part 2: Removal of Acetaldehyde. International Organization for Standardization: Geneva, Switzerland, 2019.
  14. JIS R 1703-1:2020; Fine Ceramics (Advanced Ceramics, Advanced Technical Ceramics)—Test Method for Self-Cleaning Performance of Photocatalytic Materials—Part 1: Measurement of Water Contact Angle. Japanese Standards Association: Tokyo, Japan, 2020.
  15. ISO 27448:2009; Fine Ceramics (Advanced Ceramics, Advanced Technical Ceramics)—Test Method for Self-Cleaning Performance of Semiconducting Photocatalytic Materials—Measurement of Water Contact Angle. International Organization for Standardization: Geneva, Switzerland, 2009.
  16. JIS R 1703-2:2014; Fine Ceramics (Advanced Ceramics, Advanced Technical Ceramics)—Test Method for Self-Cleaning Performance of Photocatalytic Materials—Part 2: Decomposition of Wet Methylene Blue. Japanese Standards Association: Tokyo, Japan, 2014.
  17. ISO 10678:2010; Fine Ceramics (Advanced Ceramics, Advanced Technical Ceramics)—Determination of Photocatalytic Activity of Surfaces in an Aqueous Medium by Degradation of Methylene Blue. International Organization for Standardization: Geneva, Switzerland, 2010.
  18. JIS R 1704:2007; Fine Ceramics (Advanced Ceramics, Advanced Technical Ceramics)—Test Method for Water-Purification Performance of Photocatalytic Materials by Measurement of Forming Ability of Active Oxygen. Japanese Standards Association: Tokyo, Japan, 2007.
  19. ISO 10676:2010; Fine Ceramics (Advanced Ceramics, Advanced Technical Ceramics)—Test Method for Water Purification Performance of Semiconducting Photocatalytic Materials by Measurement of Forming Ability of Active Oxygen. International Organization for Standardization: Geneva, Switzerland, 2010.
  20. JIS R 1757:2020; Fine Ceramics (Advanced Ceramics, Advanced Technical Ceramics)—Test Method of Complete Decomposition by Photocatalytic Materials under Indoor Lighting Environment-Decomposition of Acetaldehyde. Japanese Standards Association: Tokyo, Japan, 2020.
  21. ISO 19652:2018; Fine Ceramics (Advanced Ceramics, Advanced Technical Ceramics), Test Method for Complete Decomposition Performance of Semiconducting Photocatalytic Materials under Indoor Lighting Environment, Decomposition of Acetaldehyde. International Organization for Standardization: Geneva, Switzerland, 2018.
  22. Honda, M.; Ochiai, T.; Listiani, P.; Yamaguchi, Y.; Ichikawa, Y. Low-temperature synthesis of Cu-doped anatase TiO2 nanostructures via liquid phase deposition method for enhanced photocatalysis. Materials 2023, 16, 639. [Google Scholar] [CrossRef] [PubMed]
  23. Nakano, R.; Hara, M.; Ishiguro, H.; Yao, Y.; Ochiai, T.; Nakata, K.; Murakami, T.; Kajioka, J.; Sunada, K.; Hashimoto, K.; et al. Broad spectrum microbicidal activity of photocatalysis by TiO2. Catalysts 2013, 3, 310–323. [Google Scholar] [CrossRef]
Figure 1. SEM images of sample surfaces with different numbers of spray coatings of the photocatalyst solution: (a) two coatings; (b) three coatings; (c) four coatings; (d) eight coatings. SEM was performed at an accelerating voltage of 5 kV.
Catalysts 14 00163 g001aCatalysts 14 00163 g001b
Figure 2. (a) XPS Ti 2p spectra of sample surfaces with different numbers of spray coatings with the photocatalyst solution: (red) one, (blue) two, (green) three, and (purple) four. (b) Relationship between the number of spray coatings and intensity of Ti 2p peaks on sample surfaces.
Catalysts 14 00163 g002
Figure 3. Relationship between the number of spray coatings and ratio of each element on sample surfaces: (blue) Ti, (red) Si, and (black) O.
Catalysts 14 00163 g003
Figure 4. Example of SARS-CoV-2 inactivation test results. SARS-CoV-2, severe acute respiratory syndrome coronavirus 2; PFU, plaque-forming units.
Catalysts 14 00163 g004
Figure 5. Typical dataset of Japanese Industrial Standards (JIS)/International Organization for Standardization (ISO) test results: (a) JIS R1701-2, acetaldehyde removal; (b) JIS R1703-1, self-cleaning (water contact angle); (c) JIS R1703-2, self-cleaning (methylene blue decolourisation); (d) JIS R1704, water purification and DMSO removal. UV, ultraviolet; DMSO, dimethyl sulfoxide.
Catalysts 14 00163 g005aCatalysts 14 00163 g005b
Figure 6. Example of modified acetaldehyde decomposition test results.
Catalysts 14 00163 g006
Figure 7. Comparative analysis between the (a) SARS-CoV-2 inactivation test and (b) acetaldehyde decomposition test results for four types of samples with different amounts of photocatalyst. SARS-CoV-2, severe acute respiratory syndrome coronavirus 2; PFU, plaque-forming units.
Catalysts 14 00163 g007
Figure 8. Comparative analysis of the acetaldehyde decomposition test and SARS-CoV-2 inactivation test results for various samples. SARS-CoV-2, severe acute respiratory syndrome coronavirus 2.
Catalysts 14 00163 g008
Figure 9. Photocatalytic inactivation of different bacteria (upper) and viruses (lower) with TiO2-coated glass under black light illumination (ultraviolet A light intensity of 0.1 mW/cm2). Processed from Catalysts 2013, 3, 310–323 [23]. CFU, colony-forming units; PFU, plaque-forming units; E. coli, Escherichia coli; MDRP, multi-drug resistant Pseudomonas aeruginosa; MDRA, multi-drug-resistant Acinetobacter; NDM1, New Delhi metallo-ß-lactamase-1; MRSA, methicillin-resistant Staphylococcus aureus; VRE, vancomycin-resistant Enterococcus; PRSP, penicillin-resistant Streptococcus pneumoniae; IFV, infectious flacherie virus; FCV, feline calicivirus; * p < 0.001.
Catalysts 14 00163 g009
Figure 10. Comparative analysis among the IFV, FCV, and E. coli inactivation test results with TiO2-coated glass under black light illumination (ultraviolet A light intensity of 0.1 mW/cm2). Processed from Figure 9. CFU, colony-forming unit; PFU, plaque-forming unit; E. coli, Escherichia coli; IFV, infectious flacherie virus; FCV, feline calicivirus; * p < 0.001.
Catalysts 14 00163 g010
Figure 11. Illustration of the severe acute respiratory syndrome coronavirus 2 inactivation test. The vertical arrow indicates the setting direction.
Catalysts 14 00163 g011
Figure 12. Japanese Industrial Standards (JIS)/International Organization for Standardization (ISO) tests: (a) JIS R1701-2 for acetaldehyde removal; (b) JIS R1703-1, self-cleaning (water contact angle); (c) JIS R1703-2, self-cleaning (methylene blue decolourisation); (d) JIS R1704, water purification and dimethyl sulfoxide removal. UV, ultraviolet; GC, gas chromatography.
Catalysts 14 00163 g012aCatalysts 14 00163 g012b
Figure 13. Photograph of the modified acetaldehyde decomposition test.
Catalysts 14 00163 g013
Disclaimer/Publisher’s Note: The statements, opinions and data contained in all publications are solely those of the individual author(s) and contributor(s) and not of MDPI and/or the editor(s). MDPI and/or the editor(s) disclaim responsibility for any injury to people or property resulting from any ideas, methods, instructions or products referred to in the content.

