
Preparation and Property Characterization of Eu2SmSbO7/ZnBiEuO4 Heterojunction Photocatalysts and Photocatalytic Degradation of Chlorpyrifos under Visible Light Irradiation


Abstract
:
1. Introduction
2. Result and Discussion
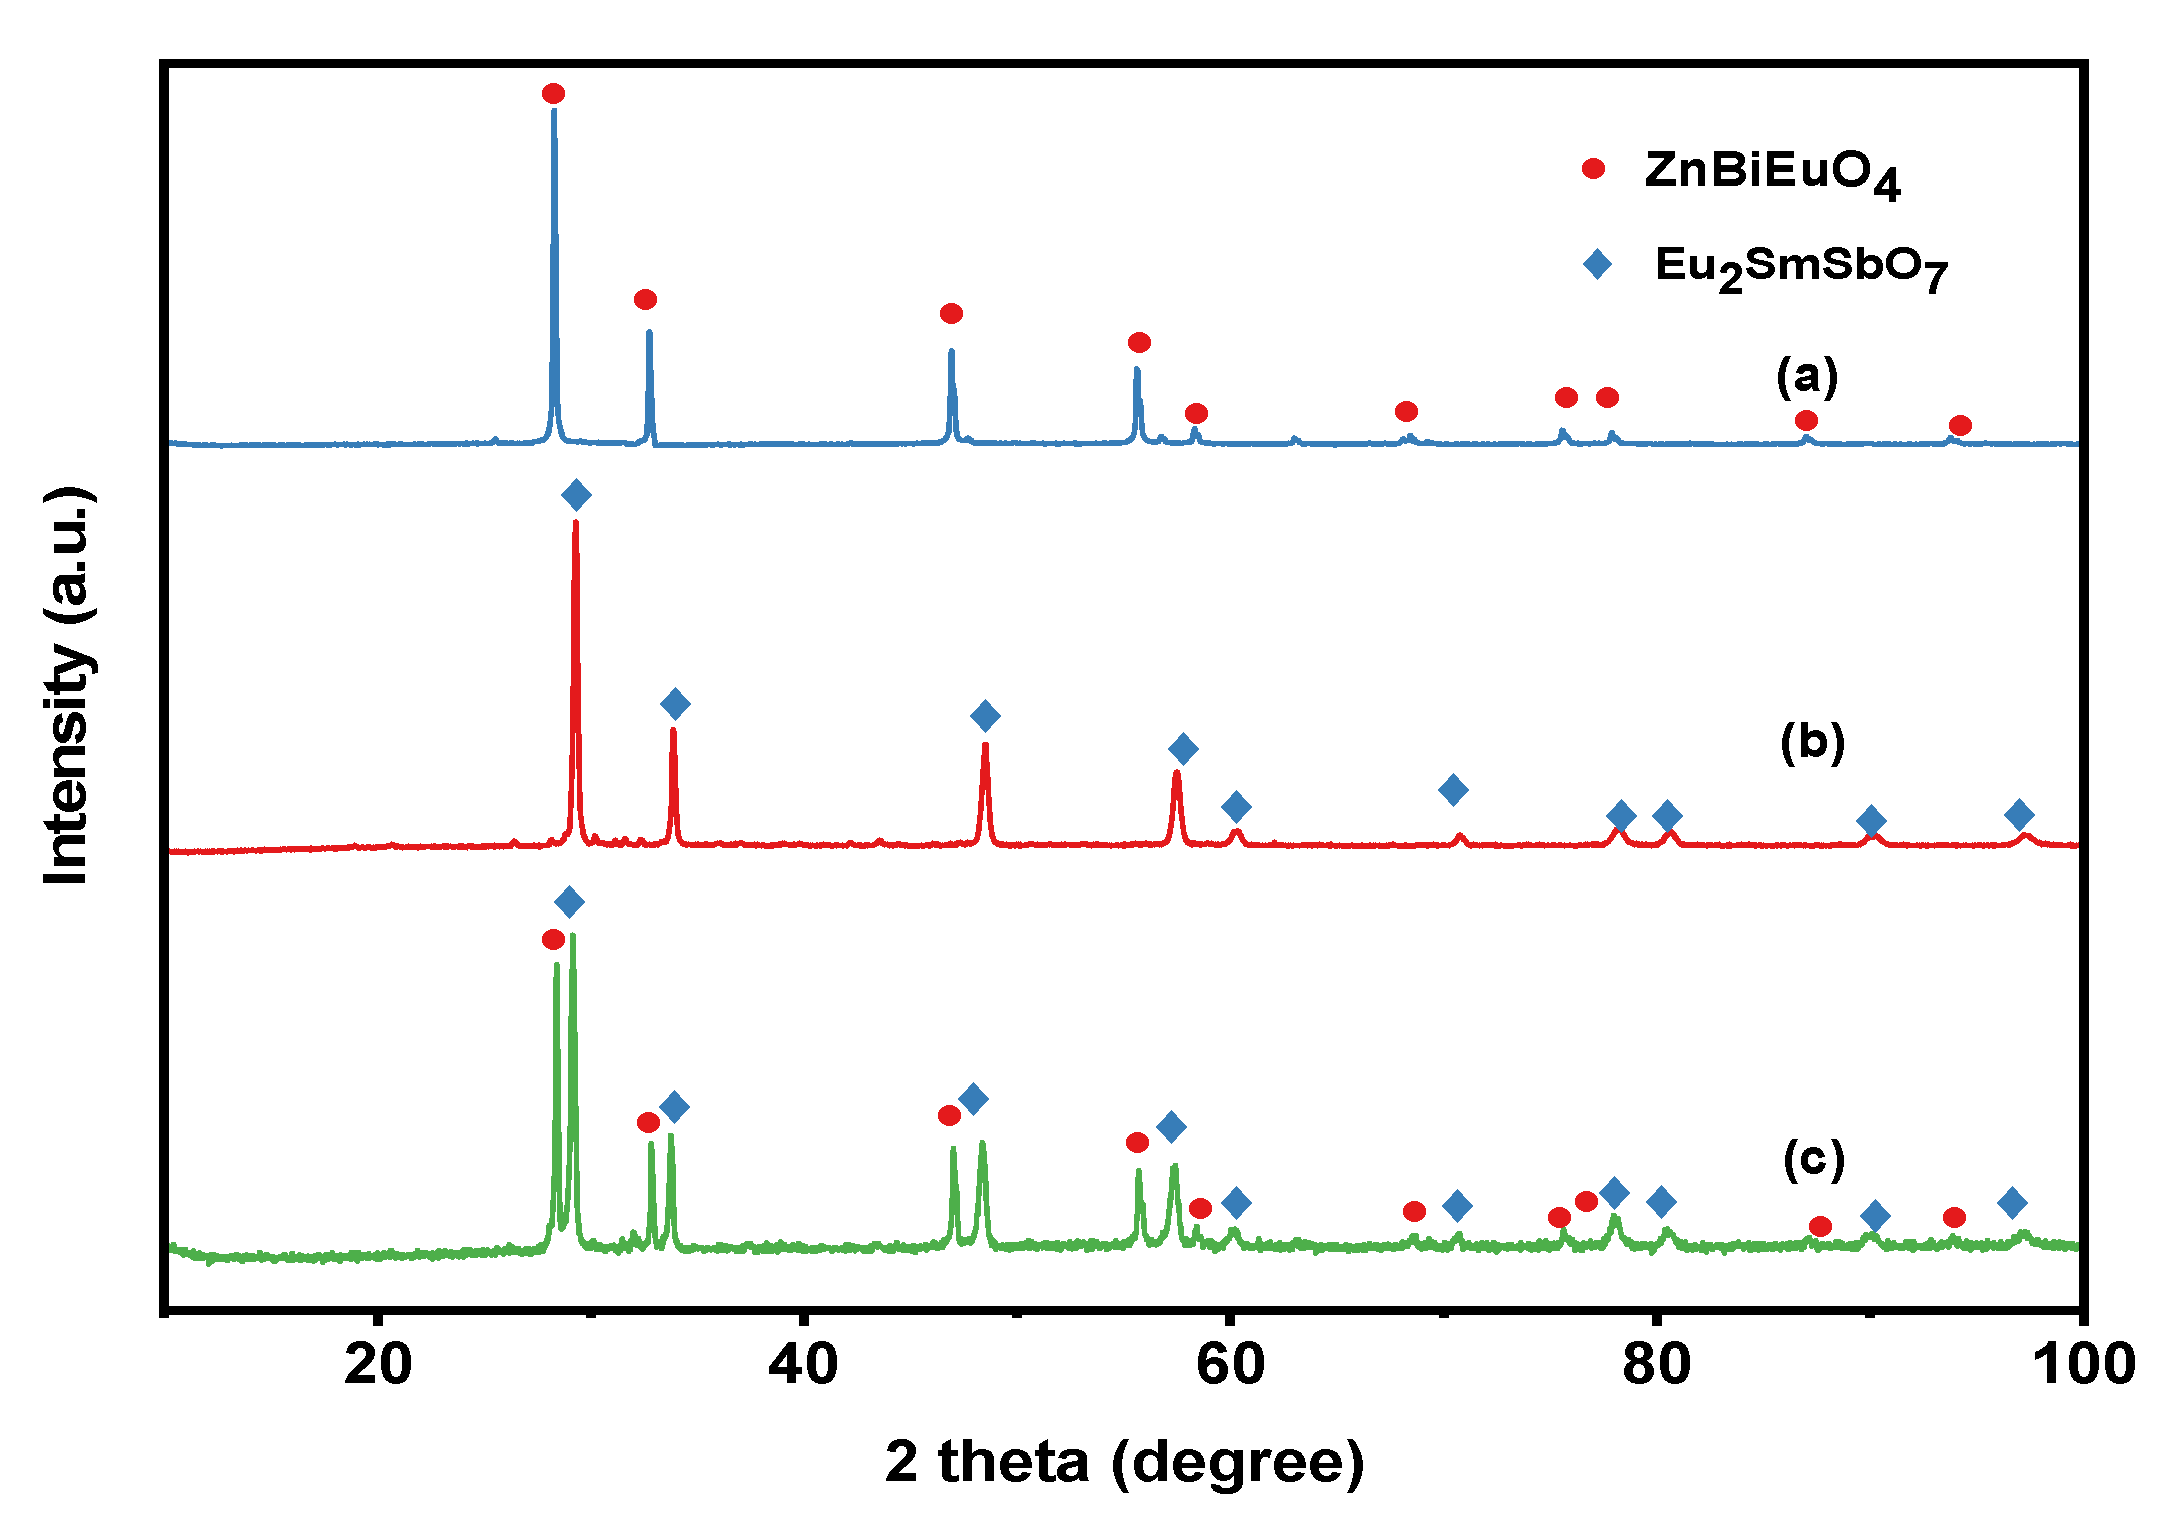
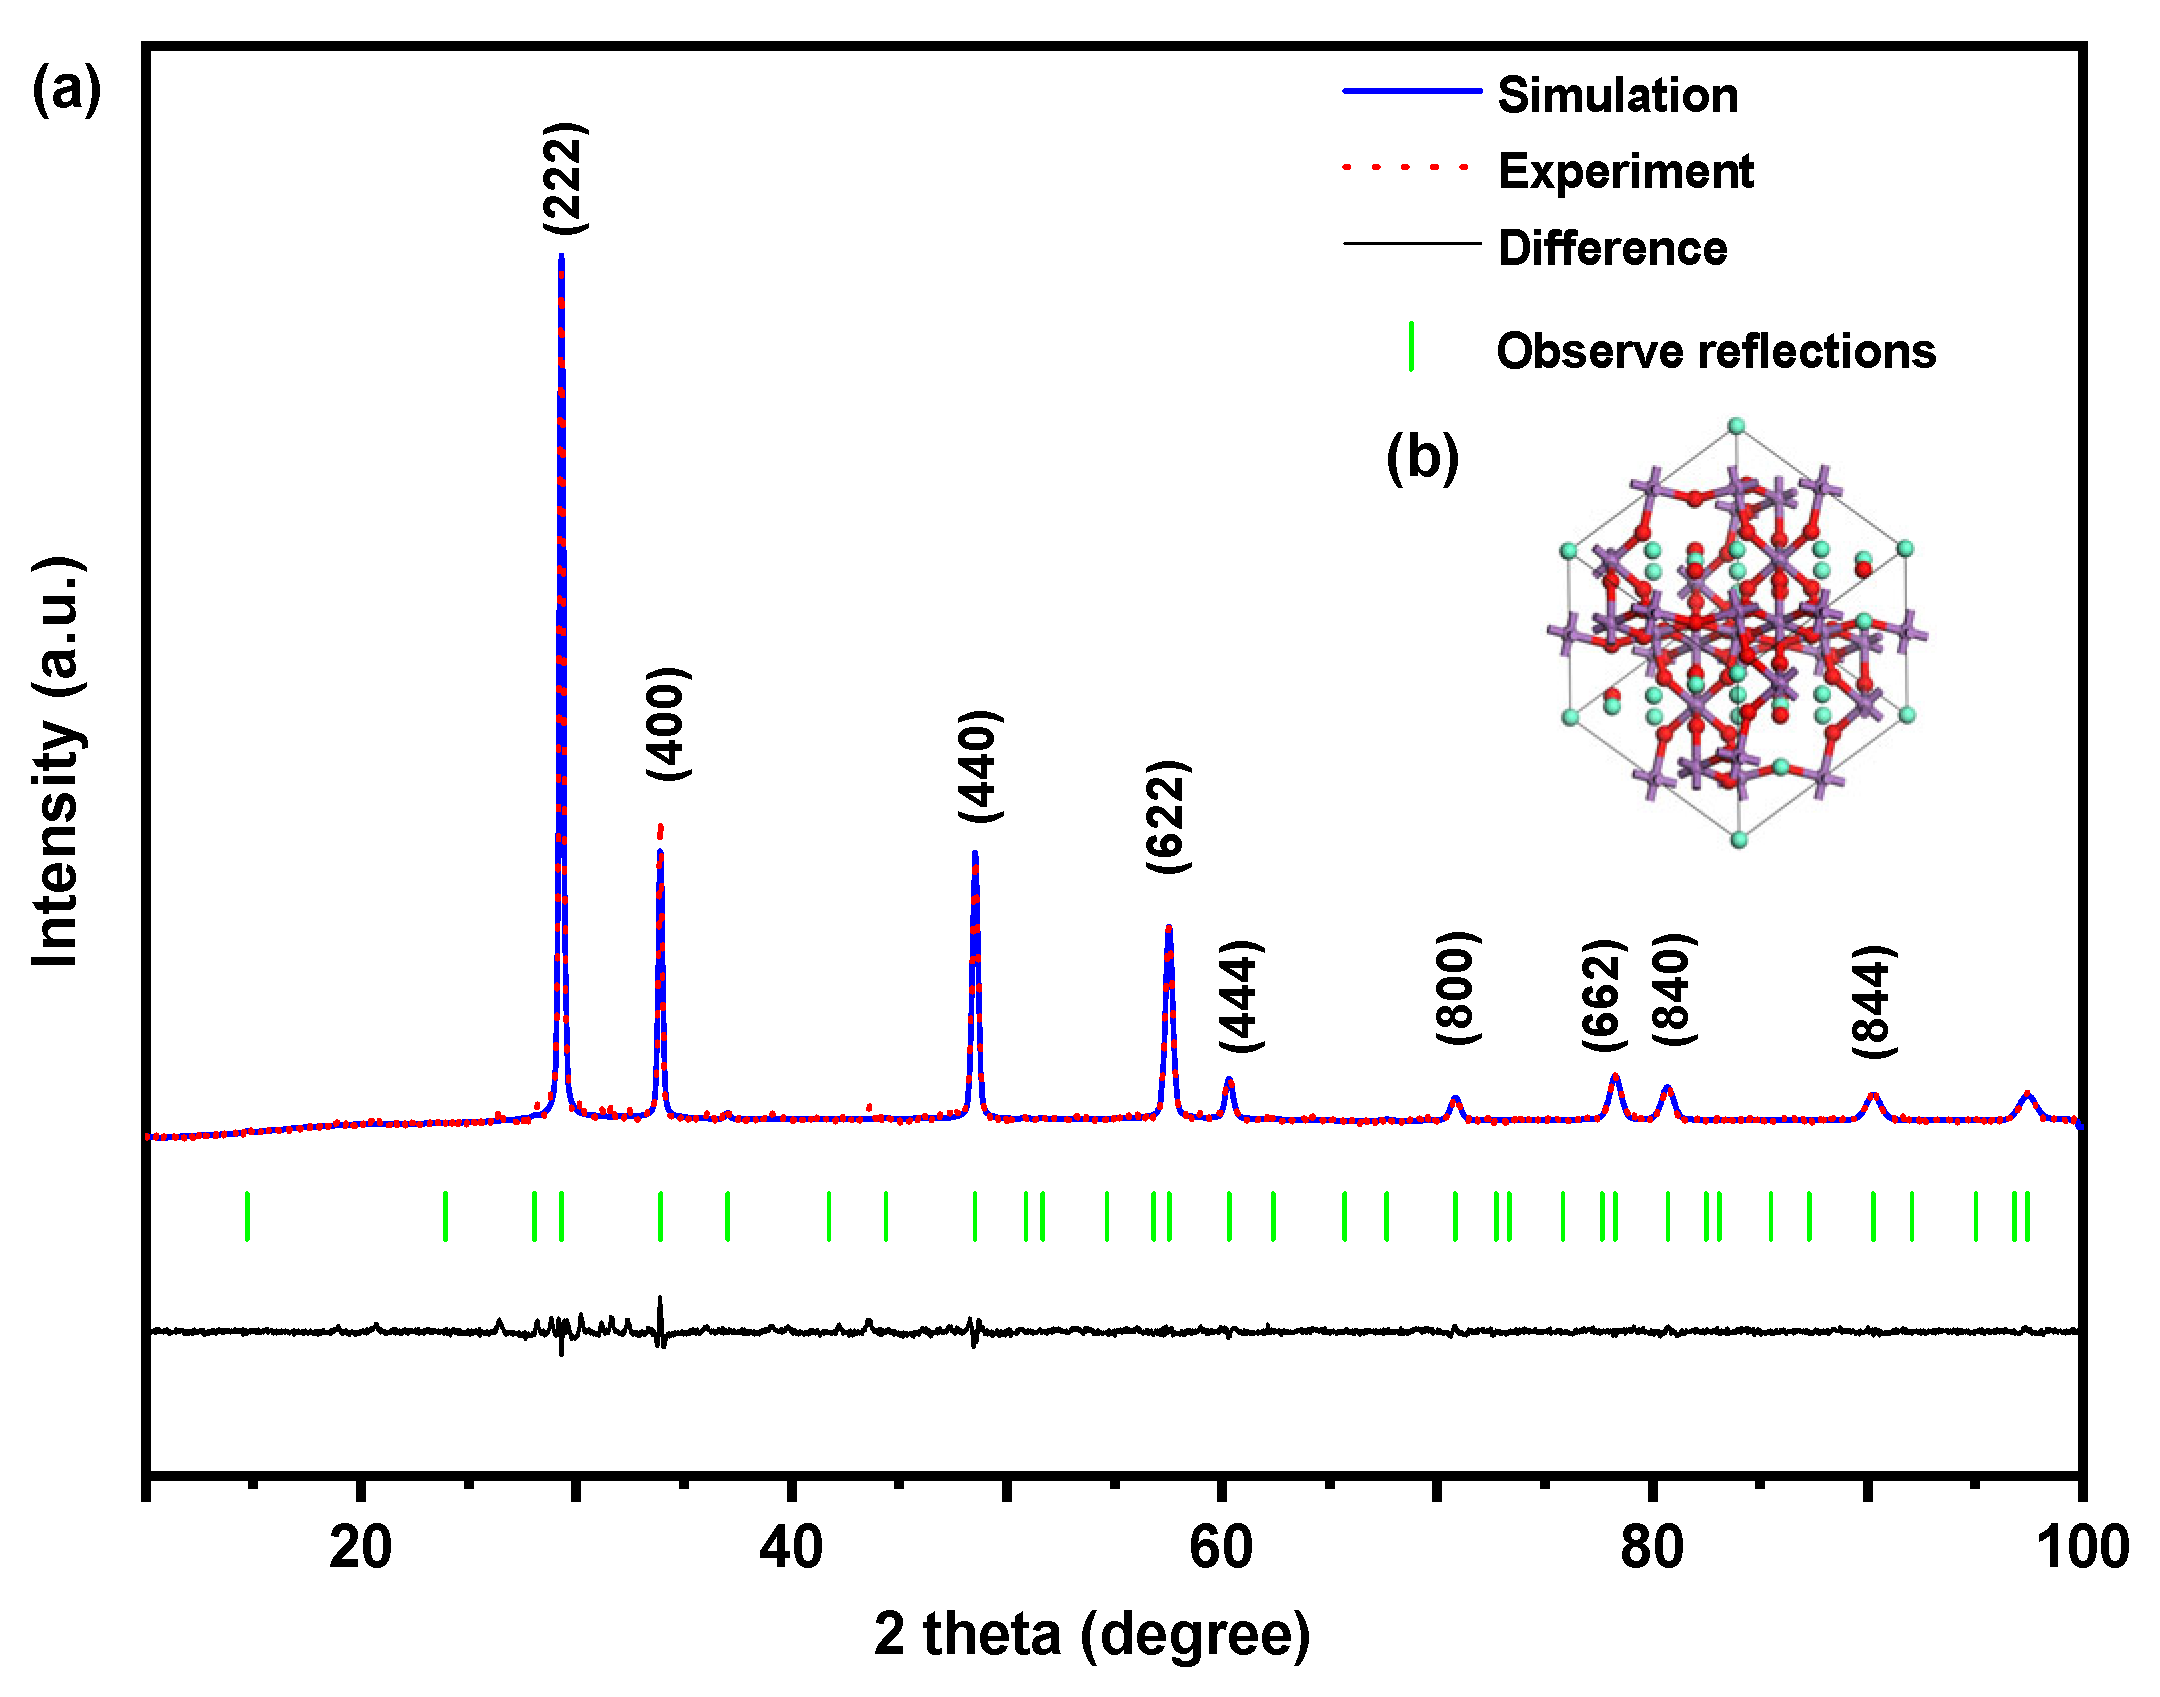
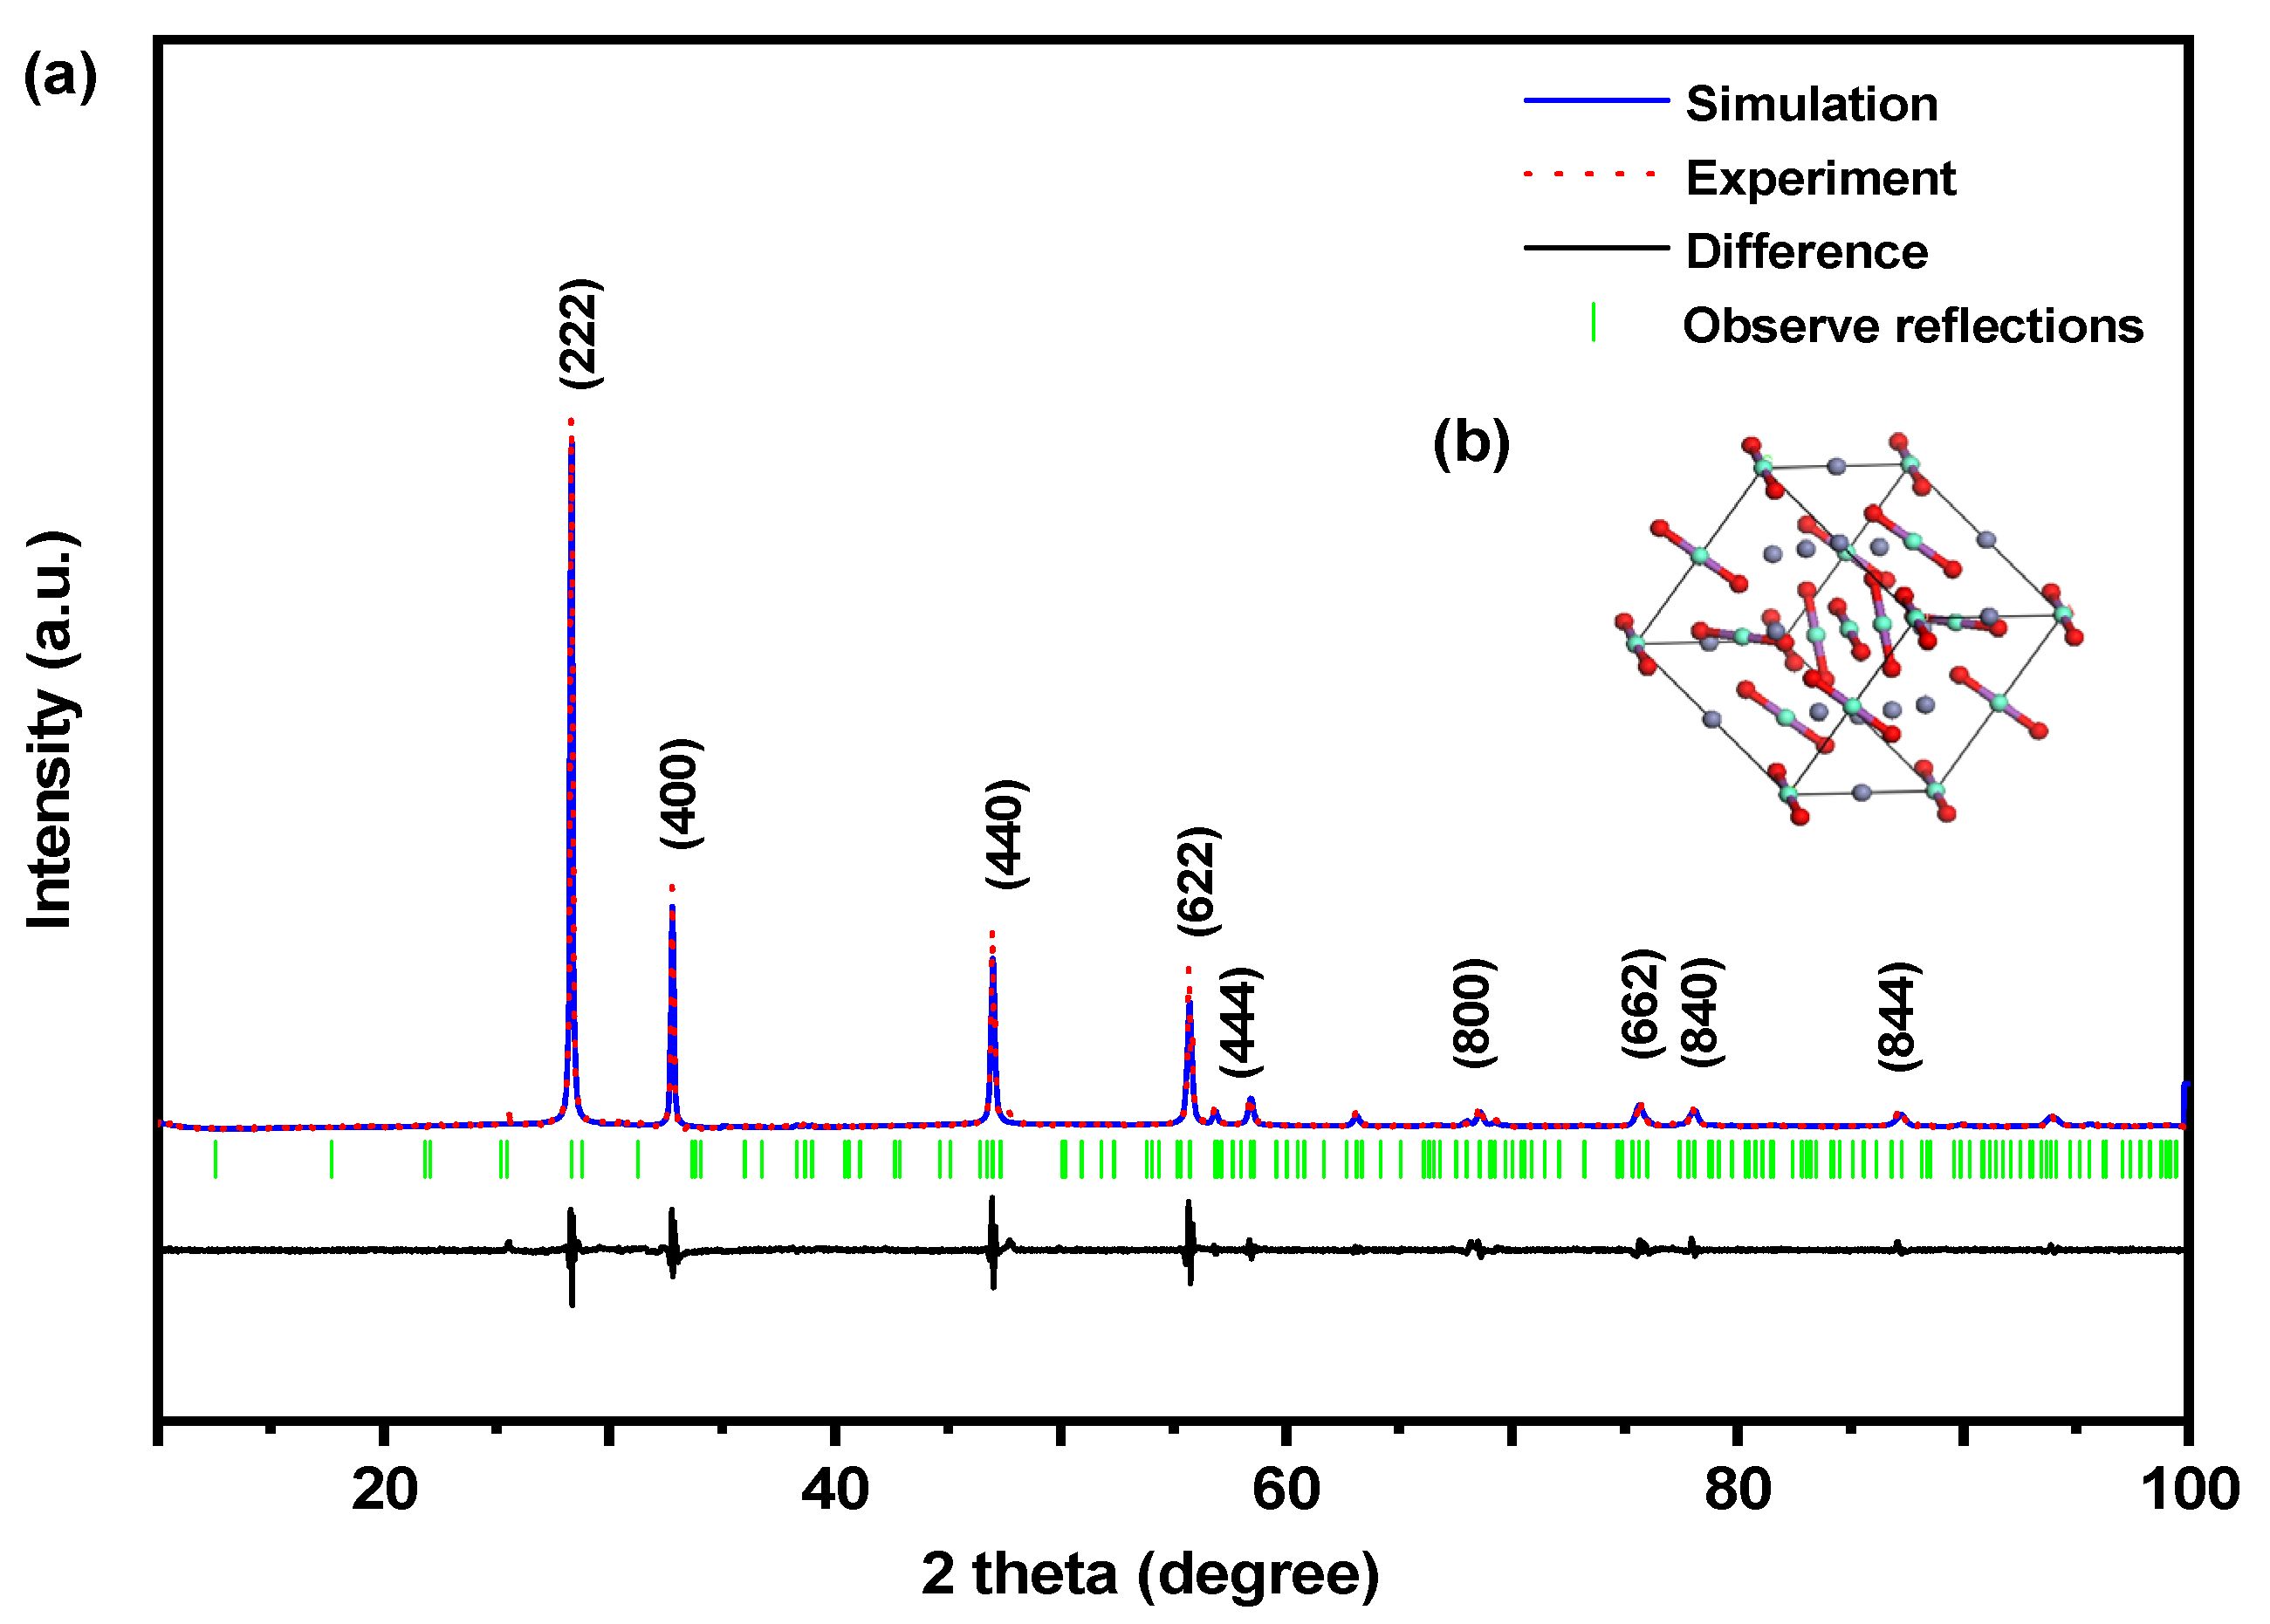
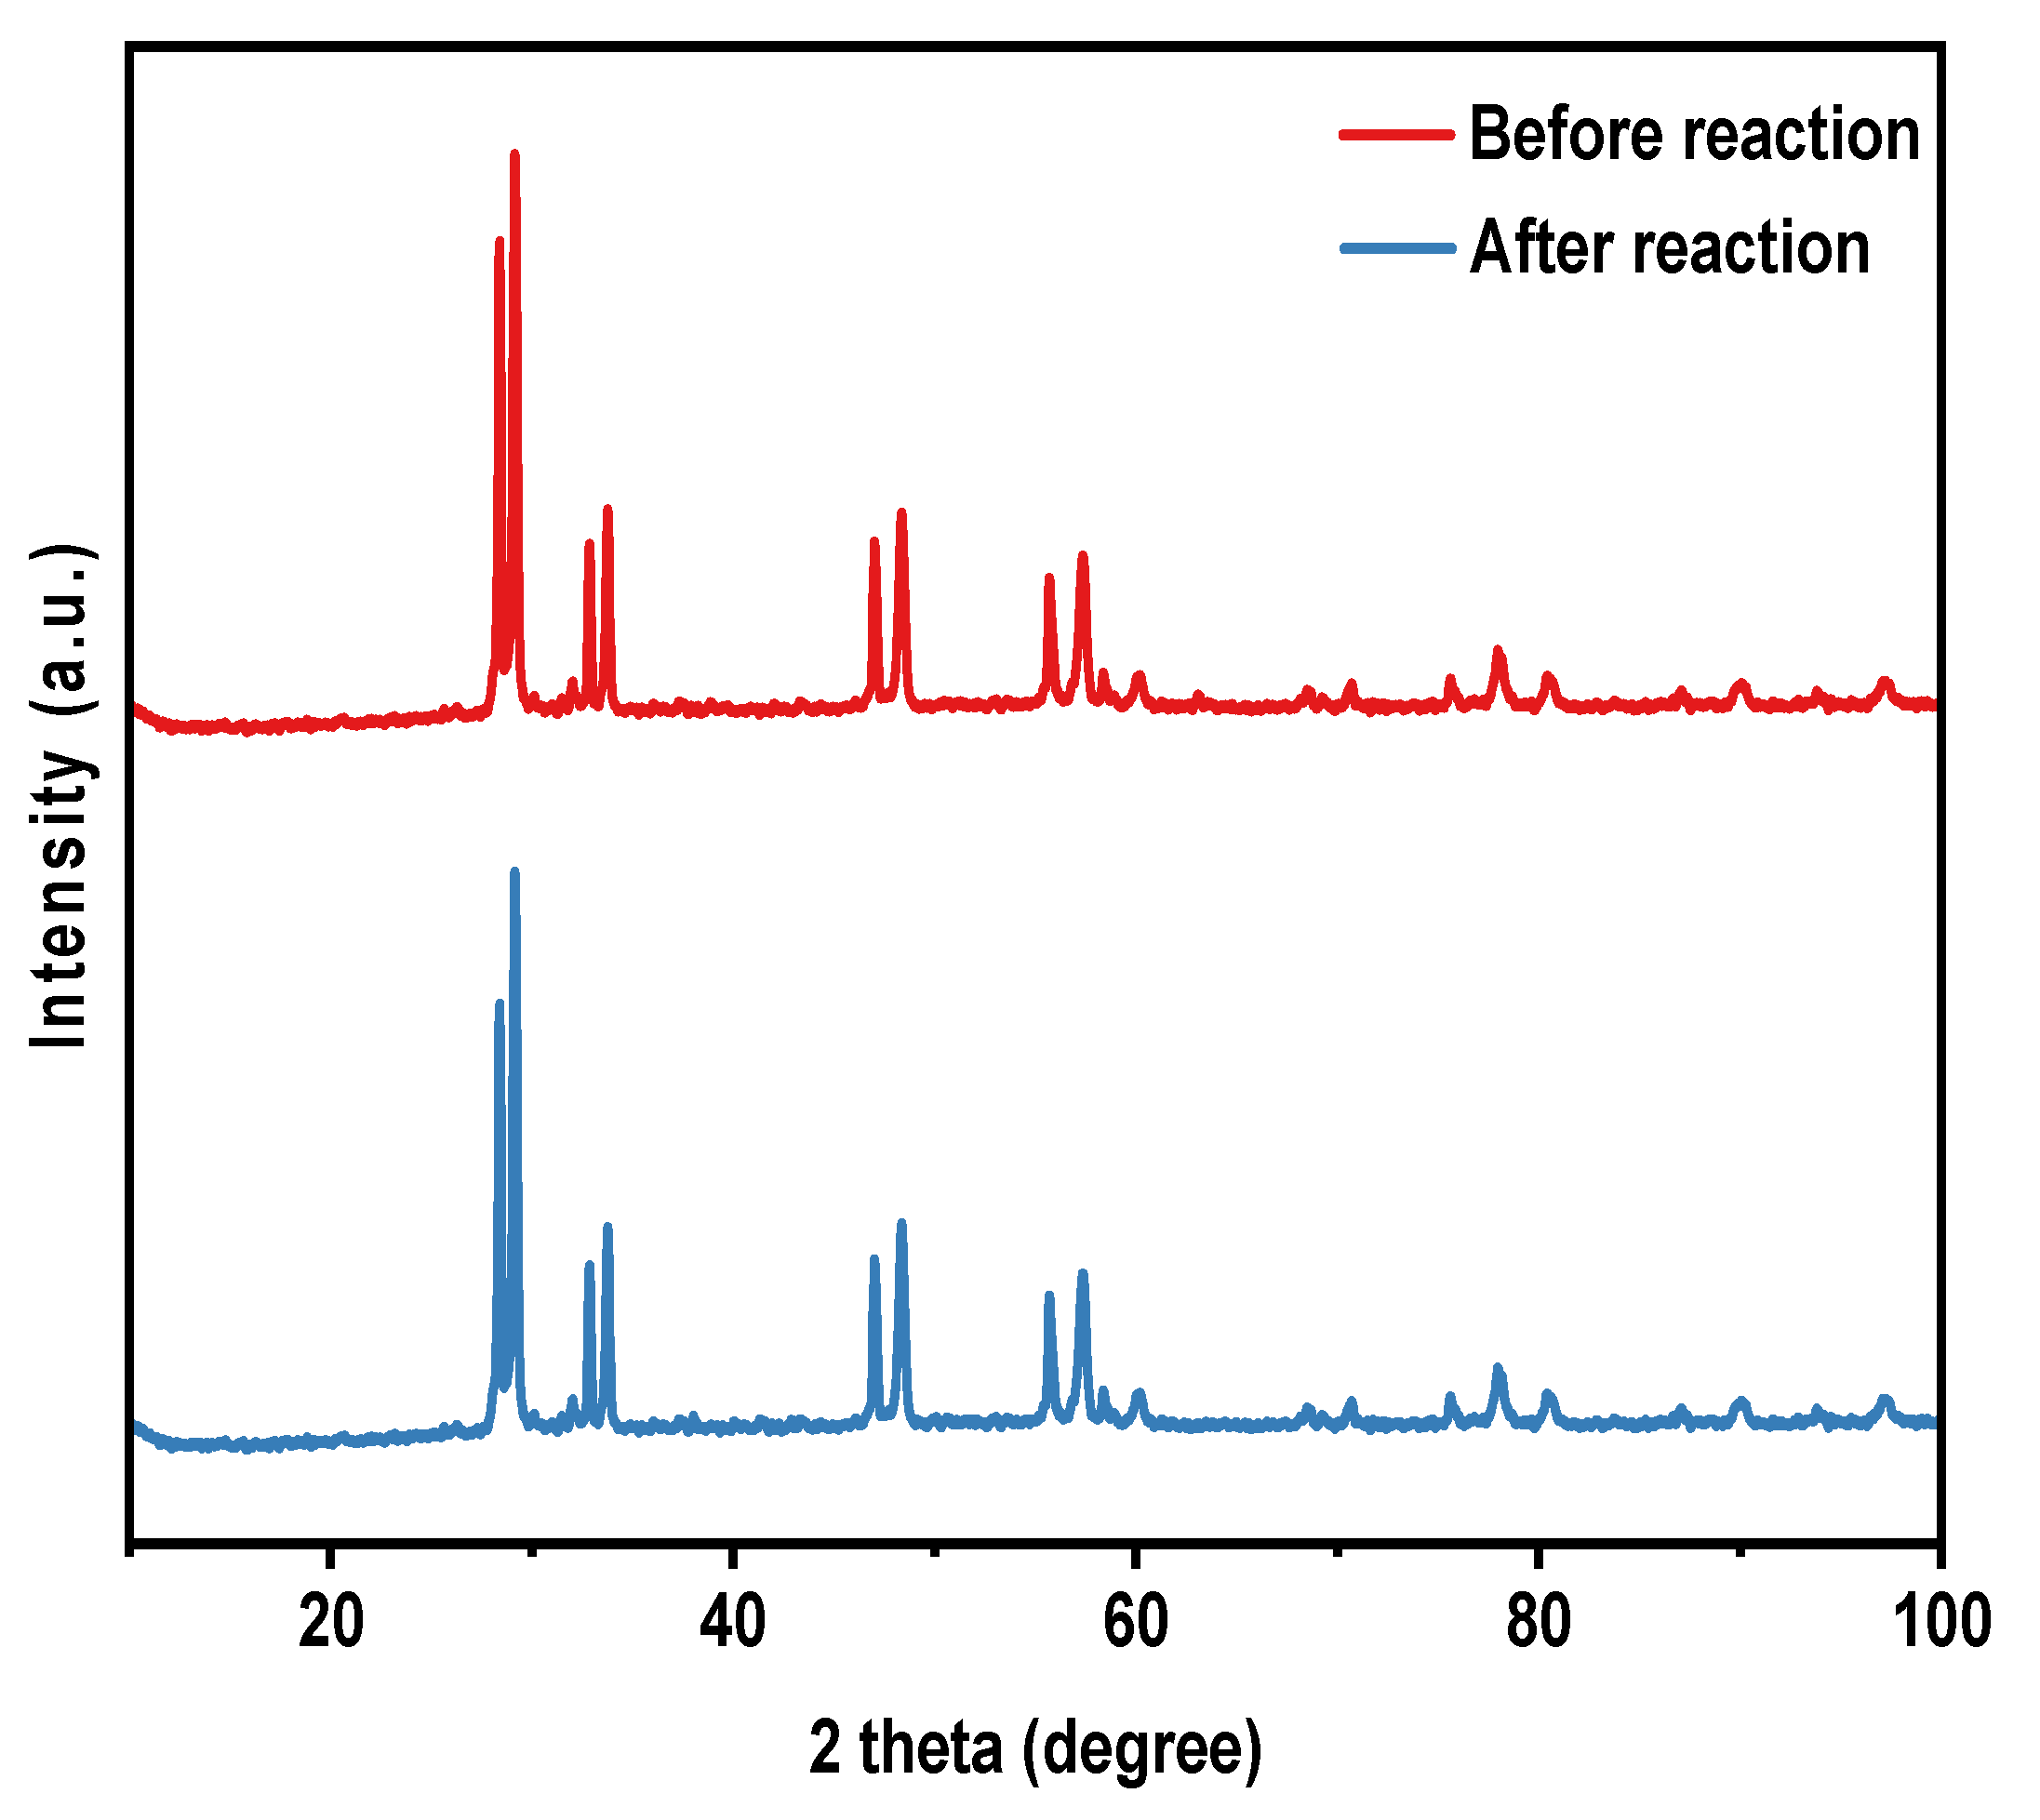
2.1. XRD Analysis
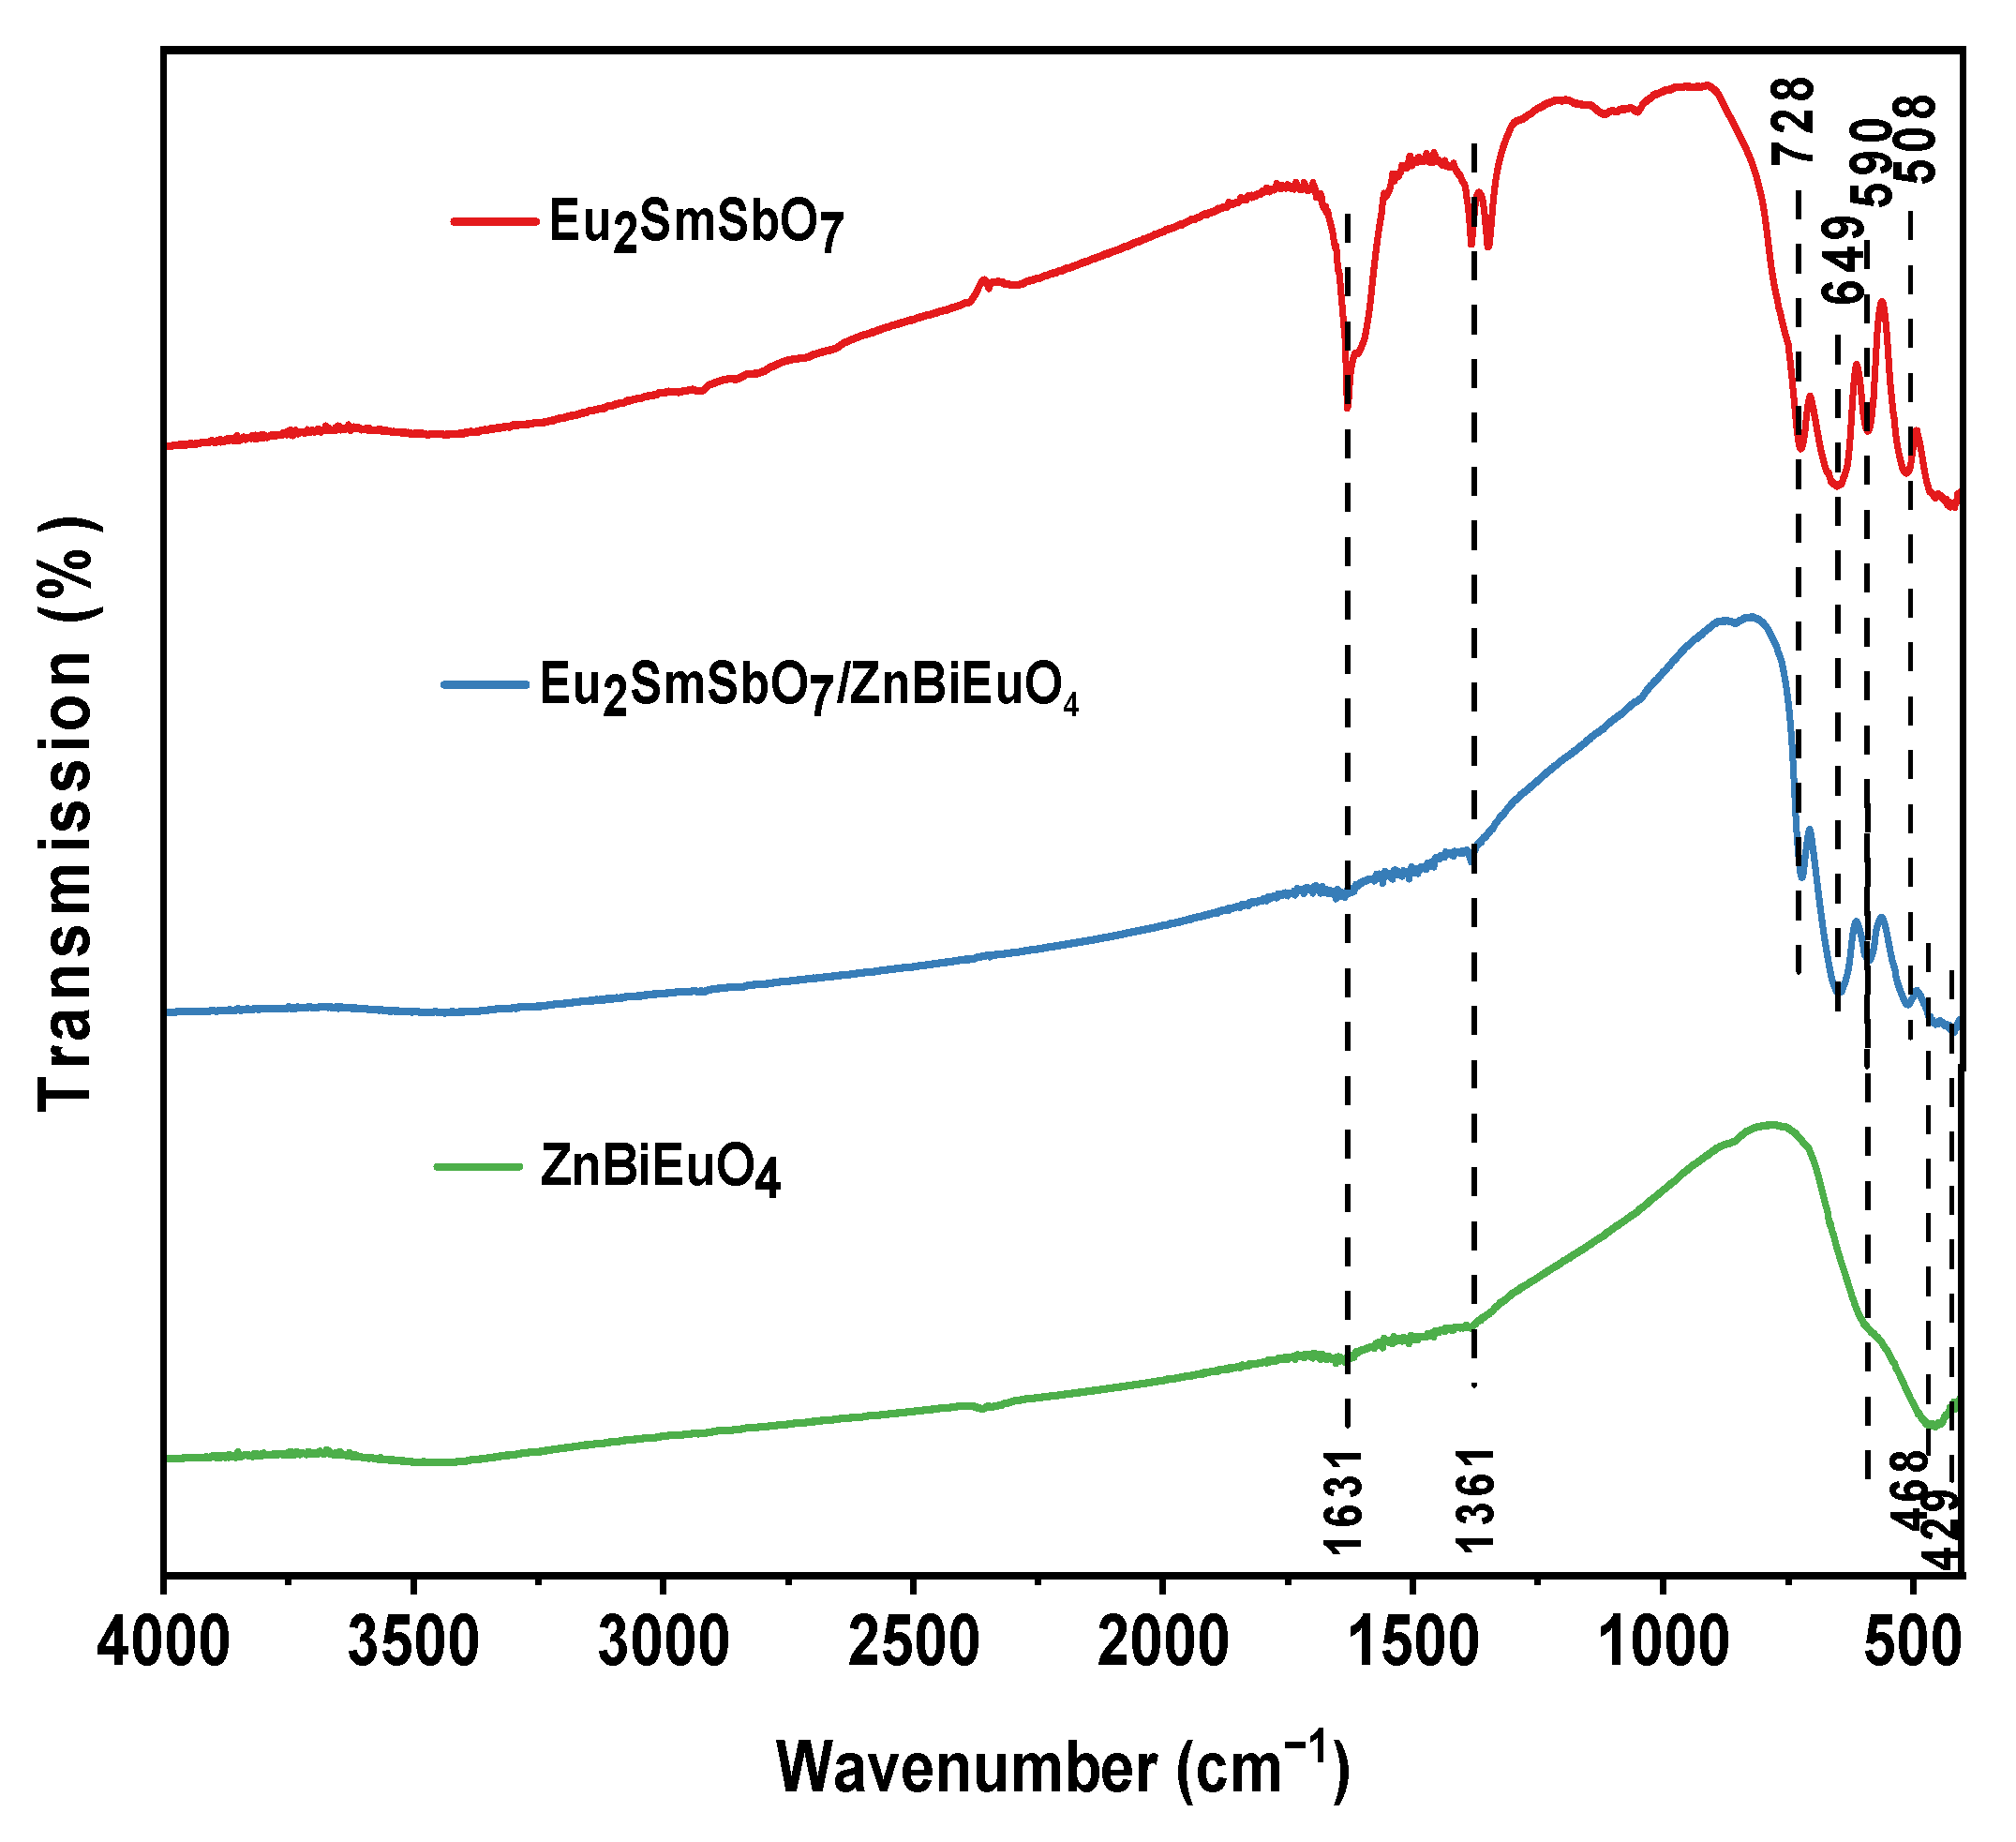
2.2. FTIR Analysis
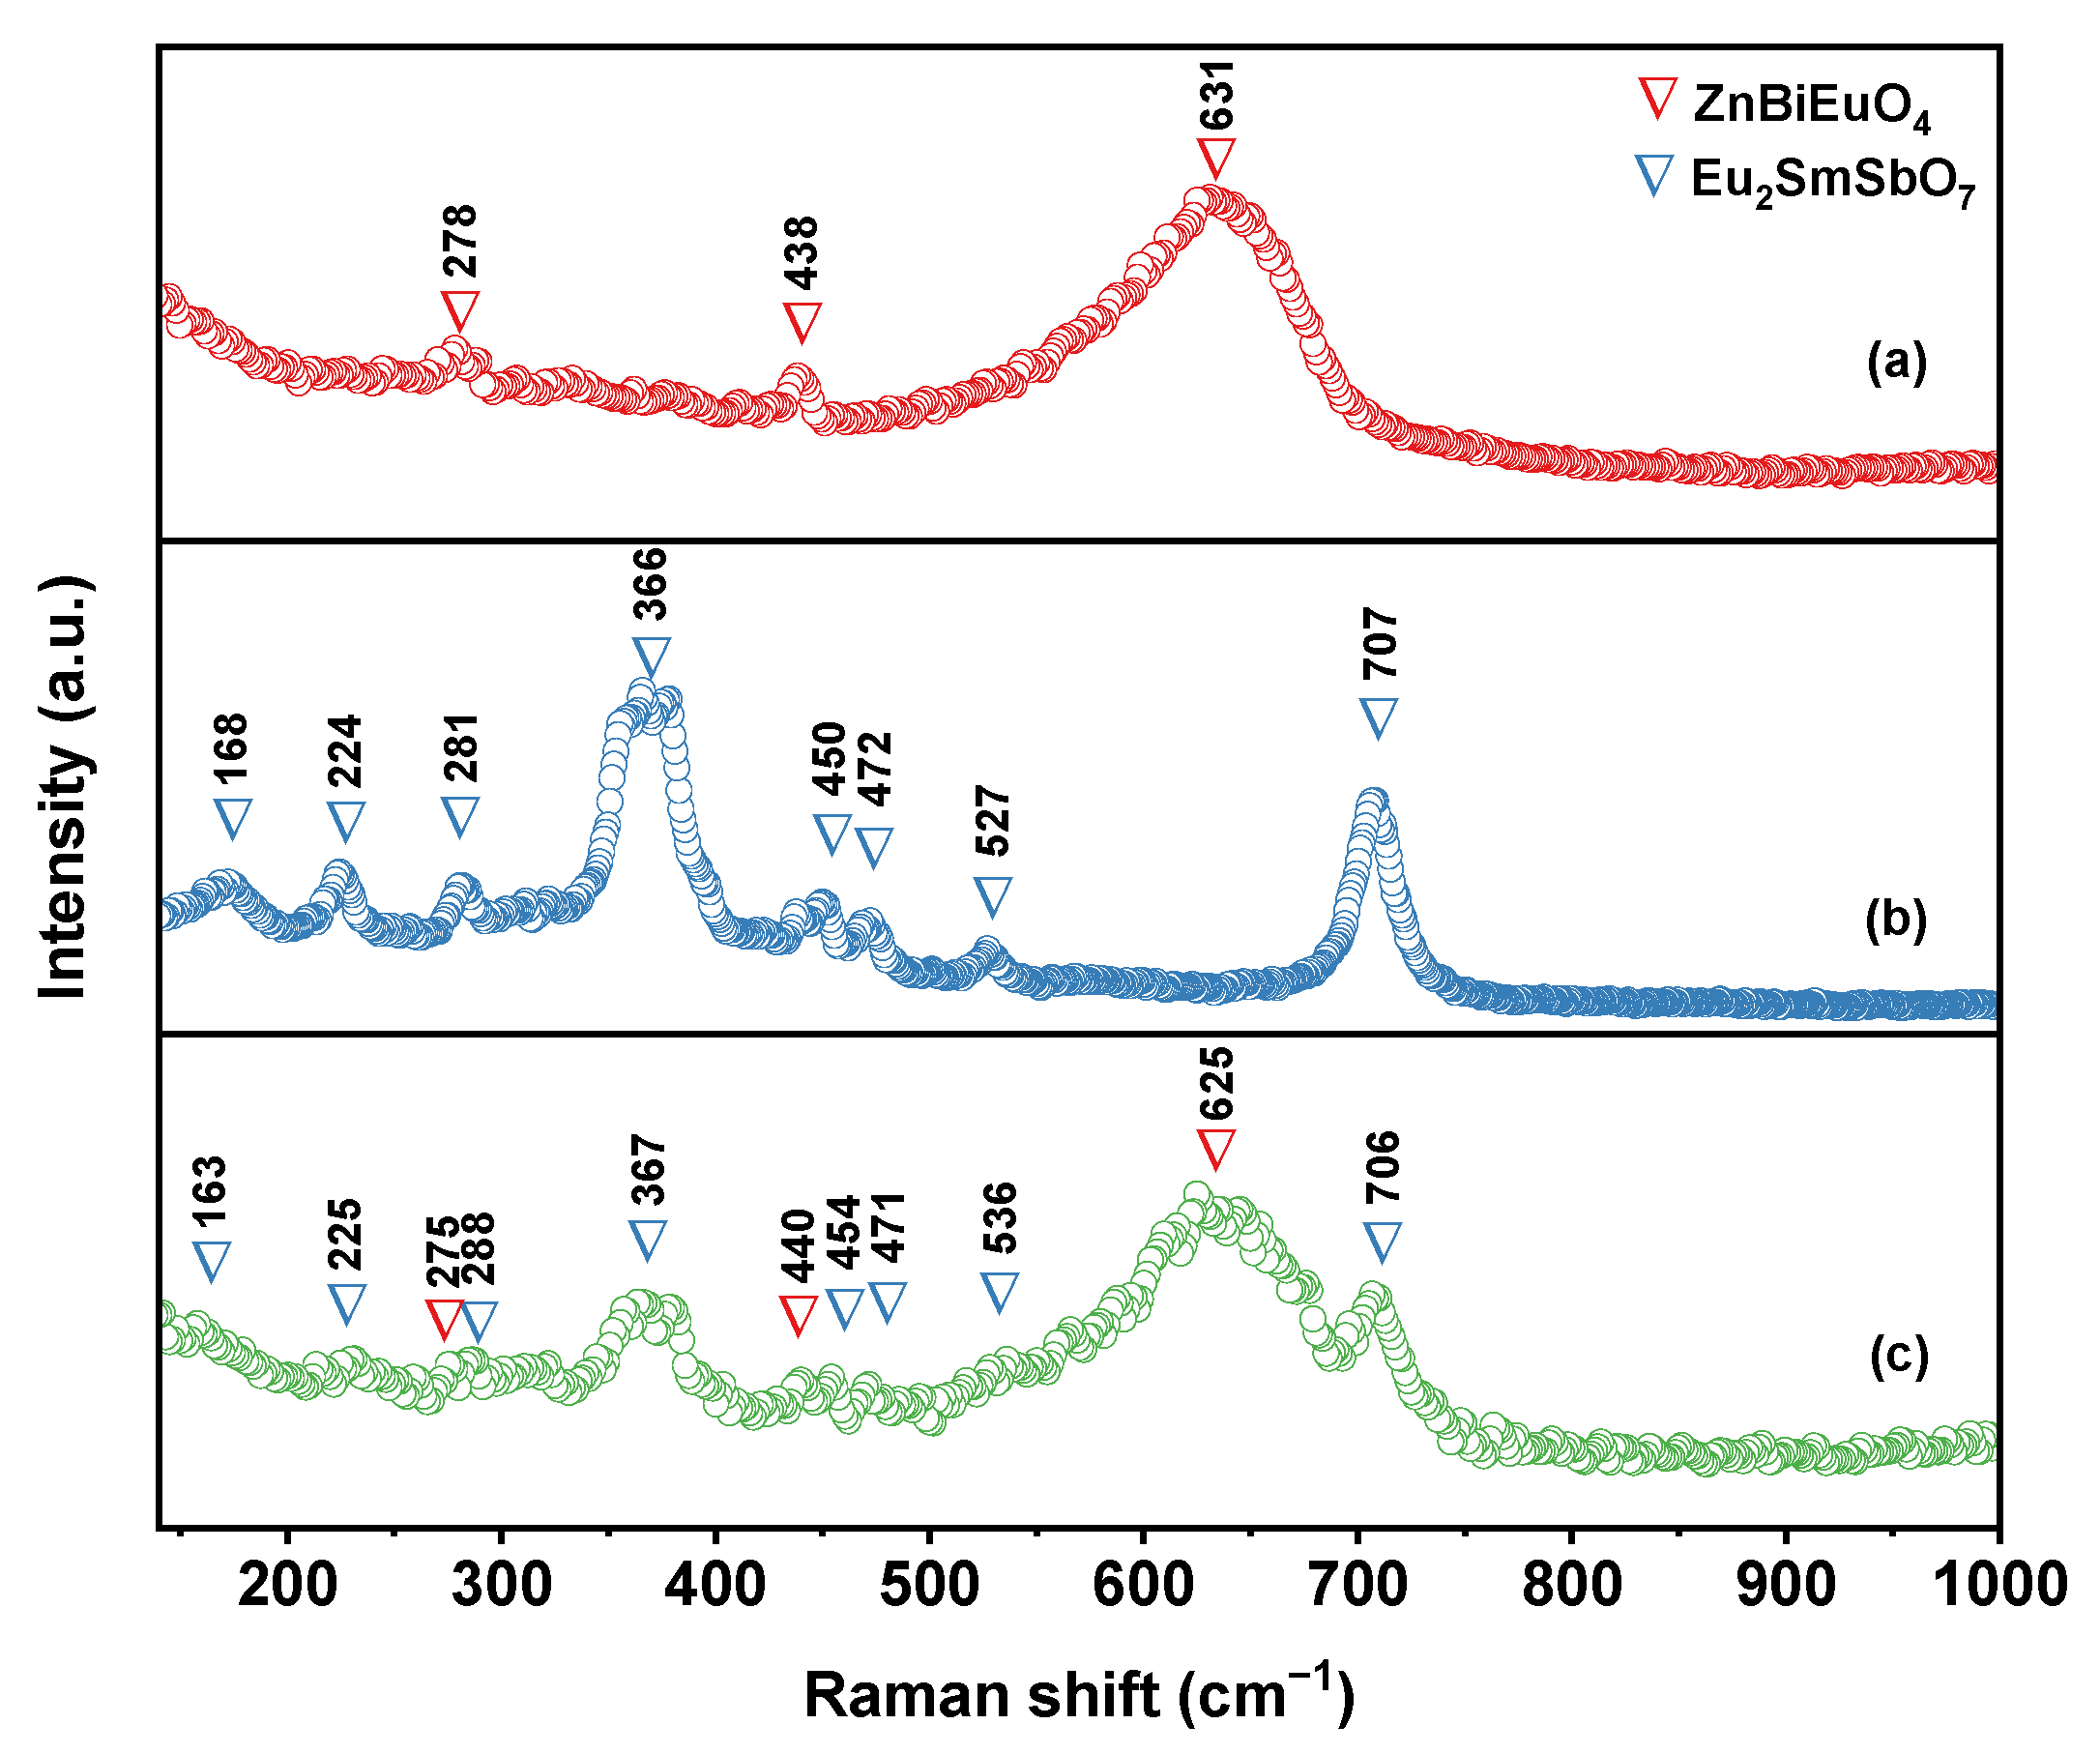
2.3. Raman Analysis
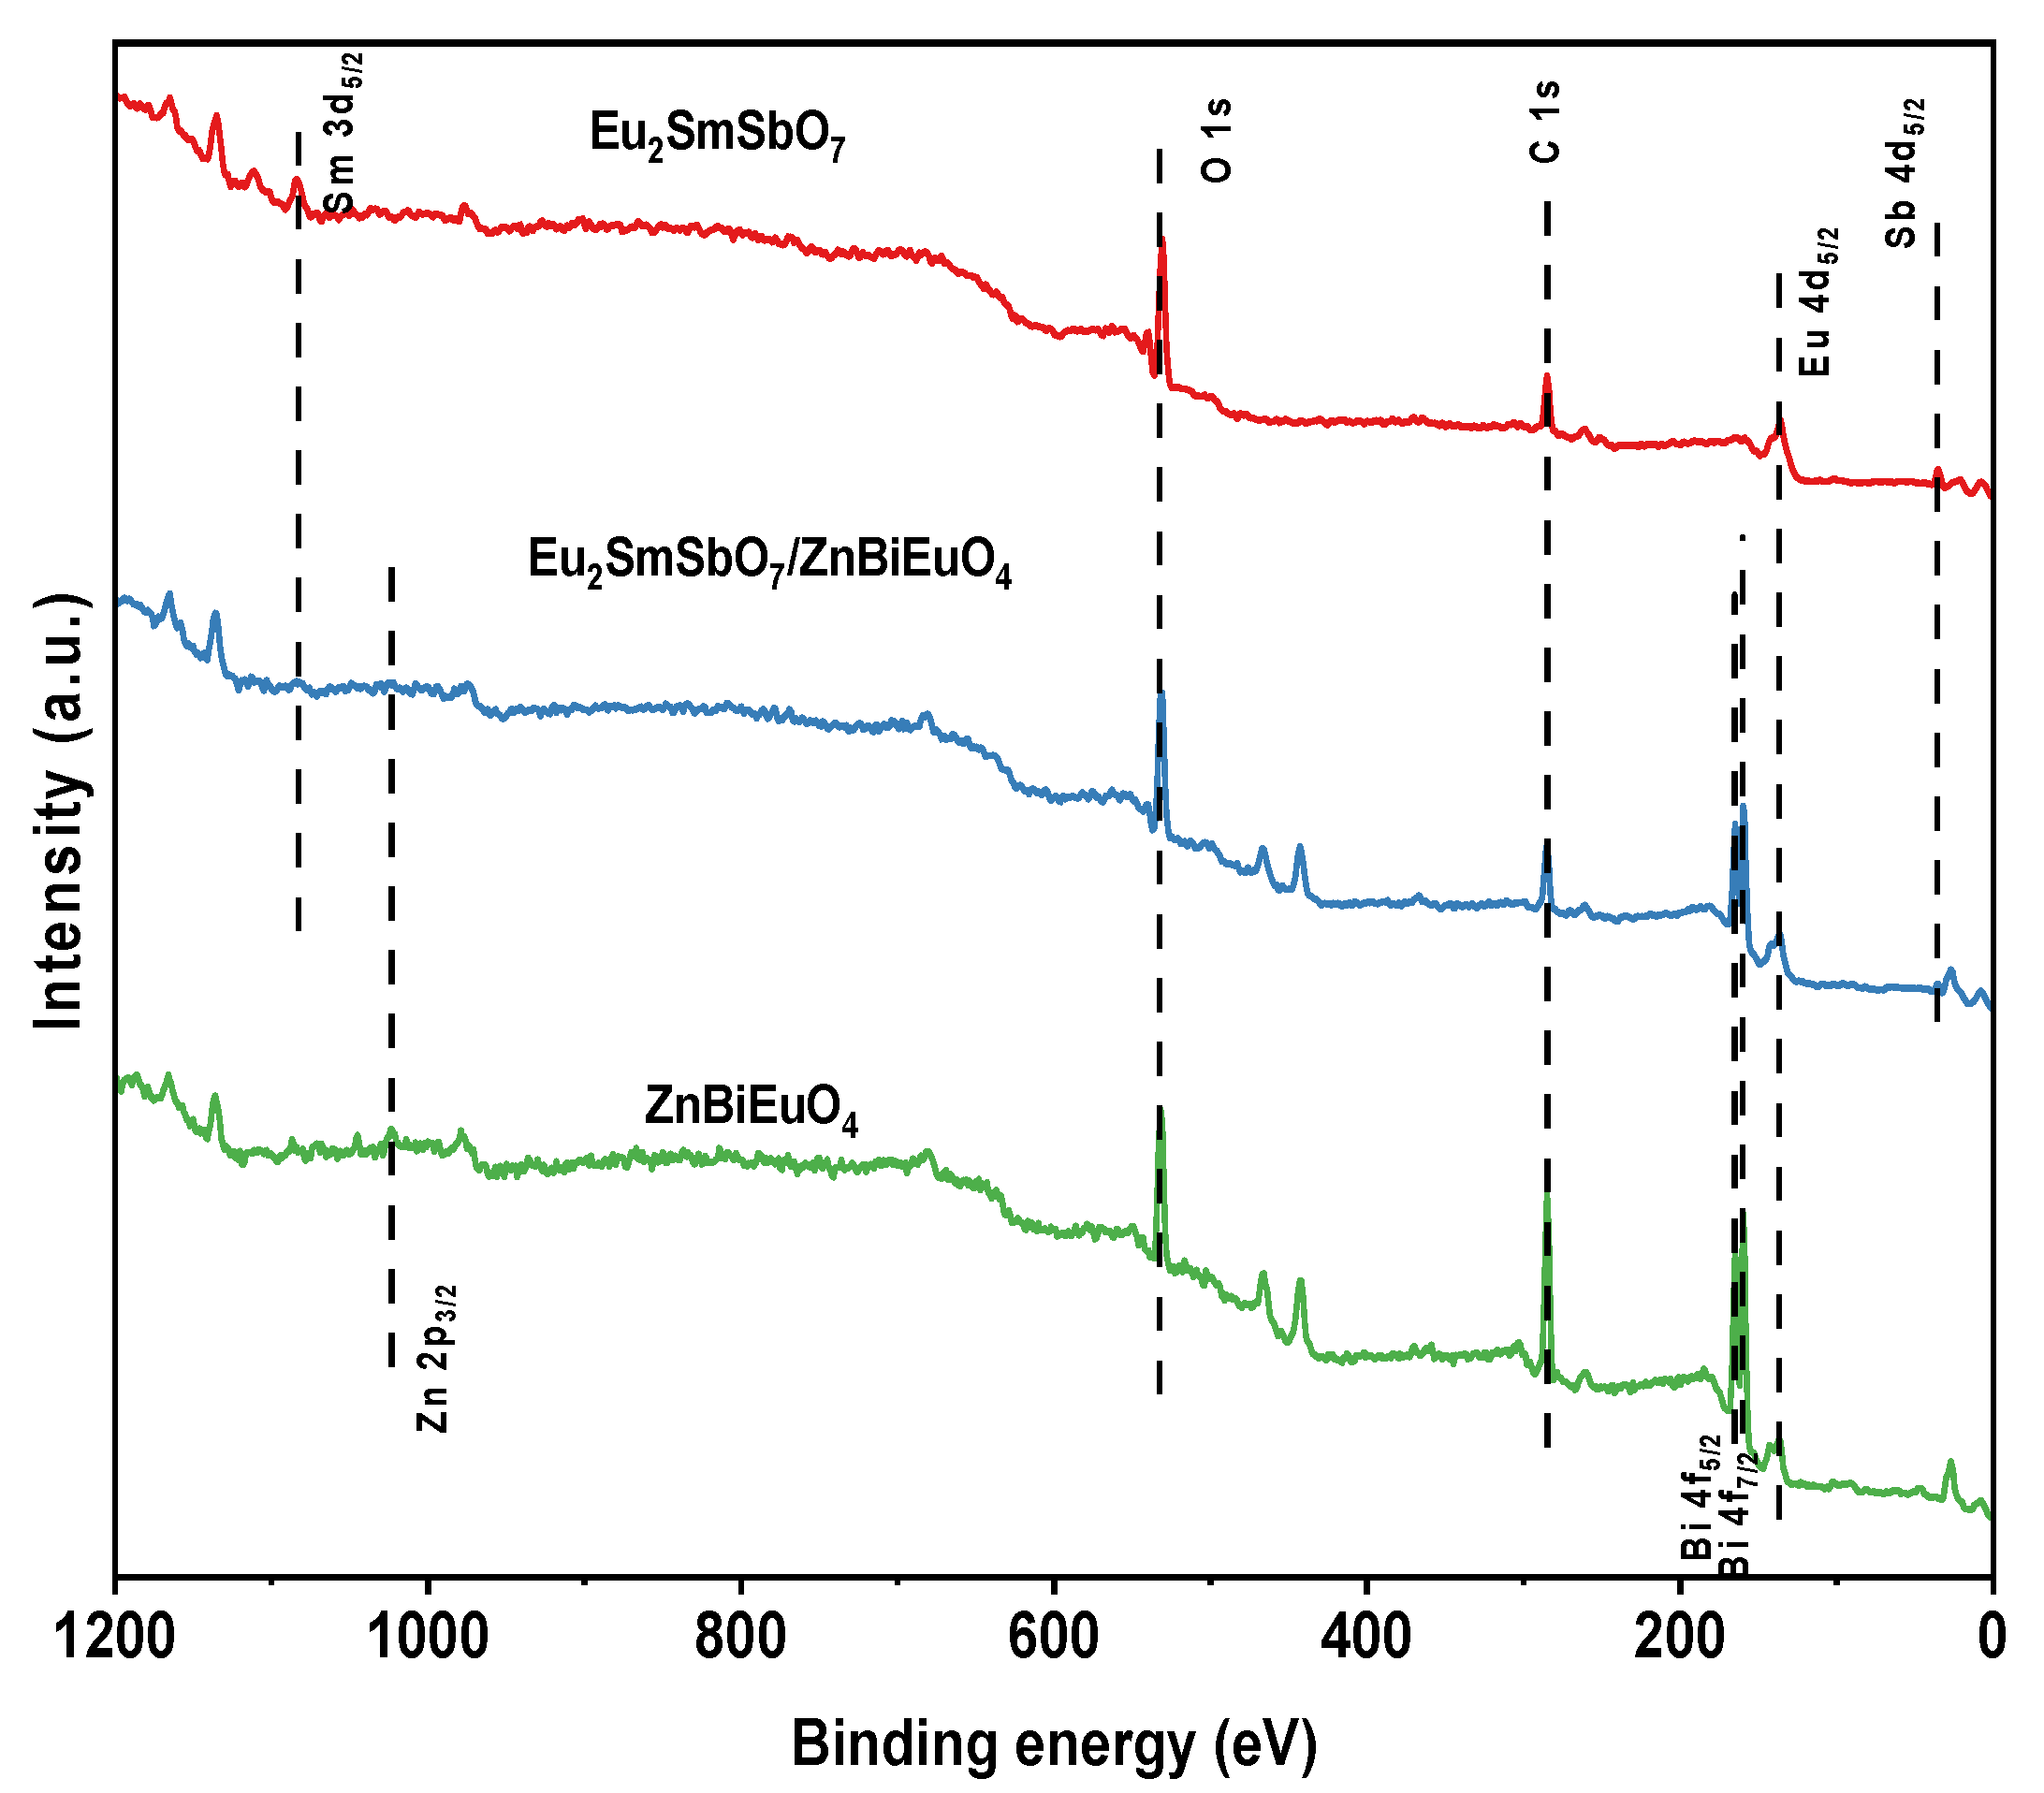
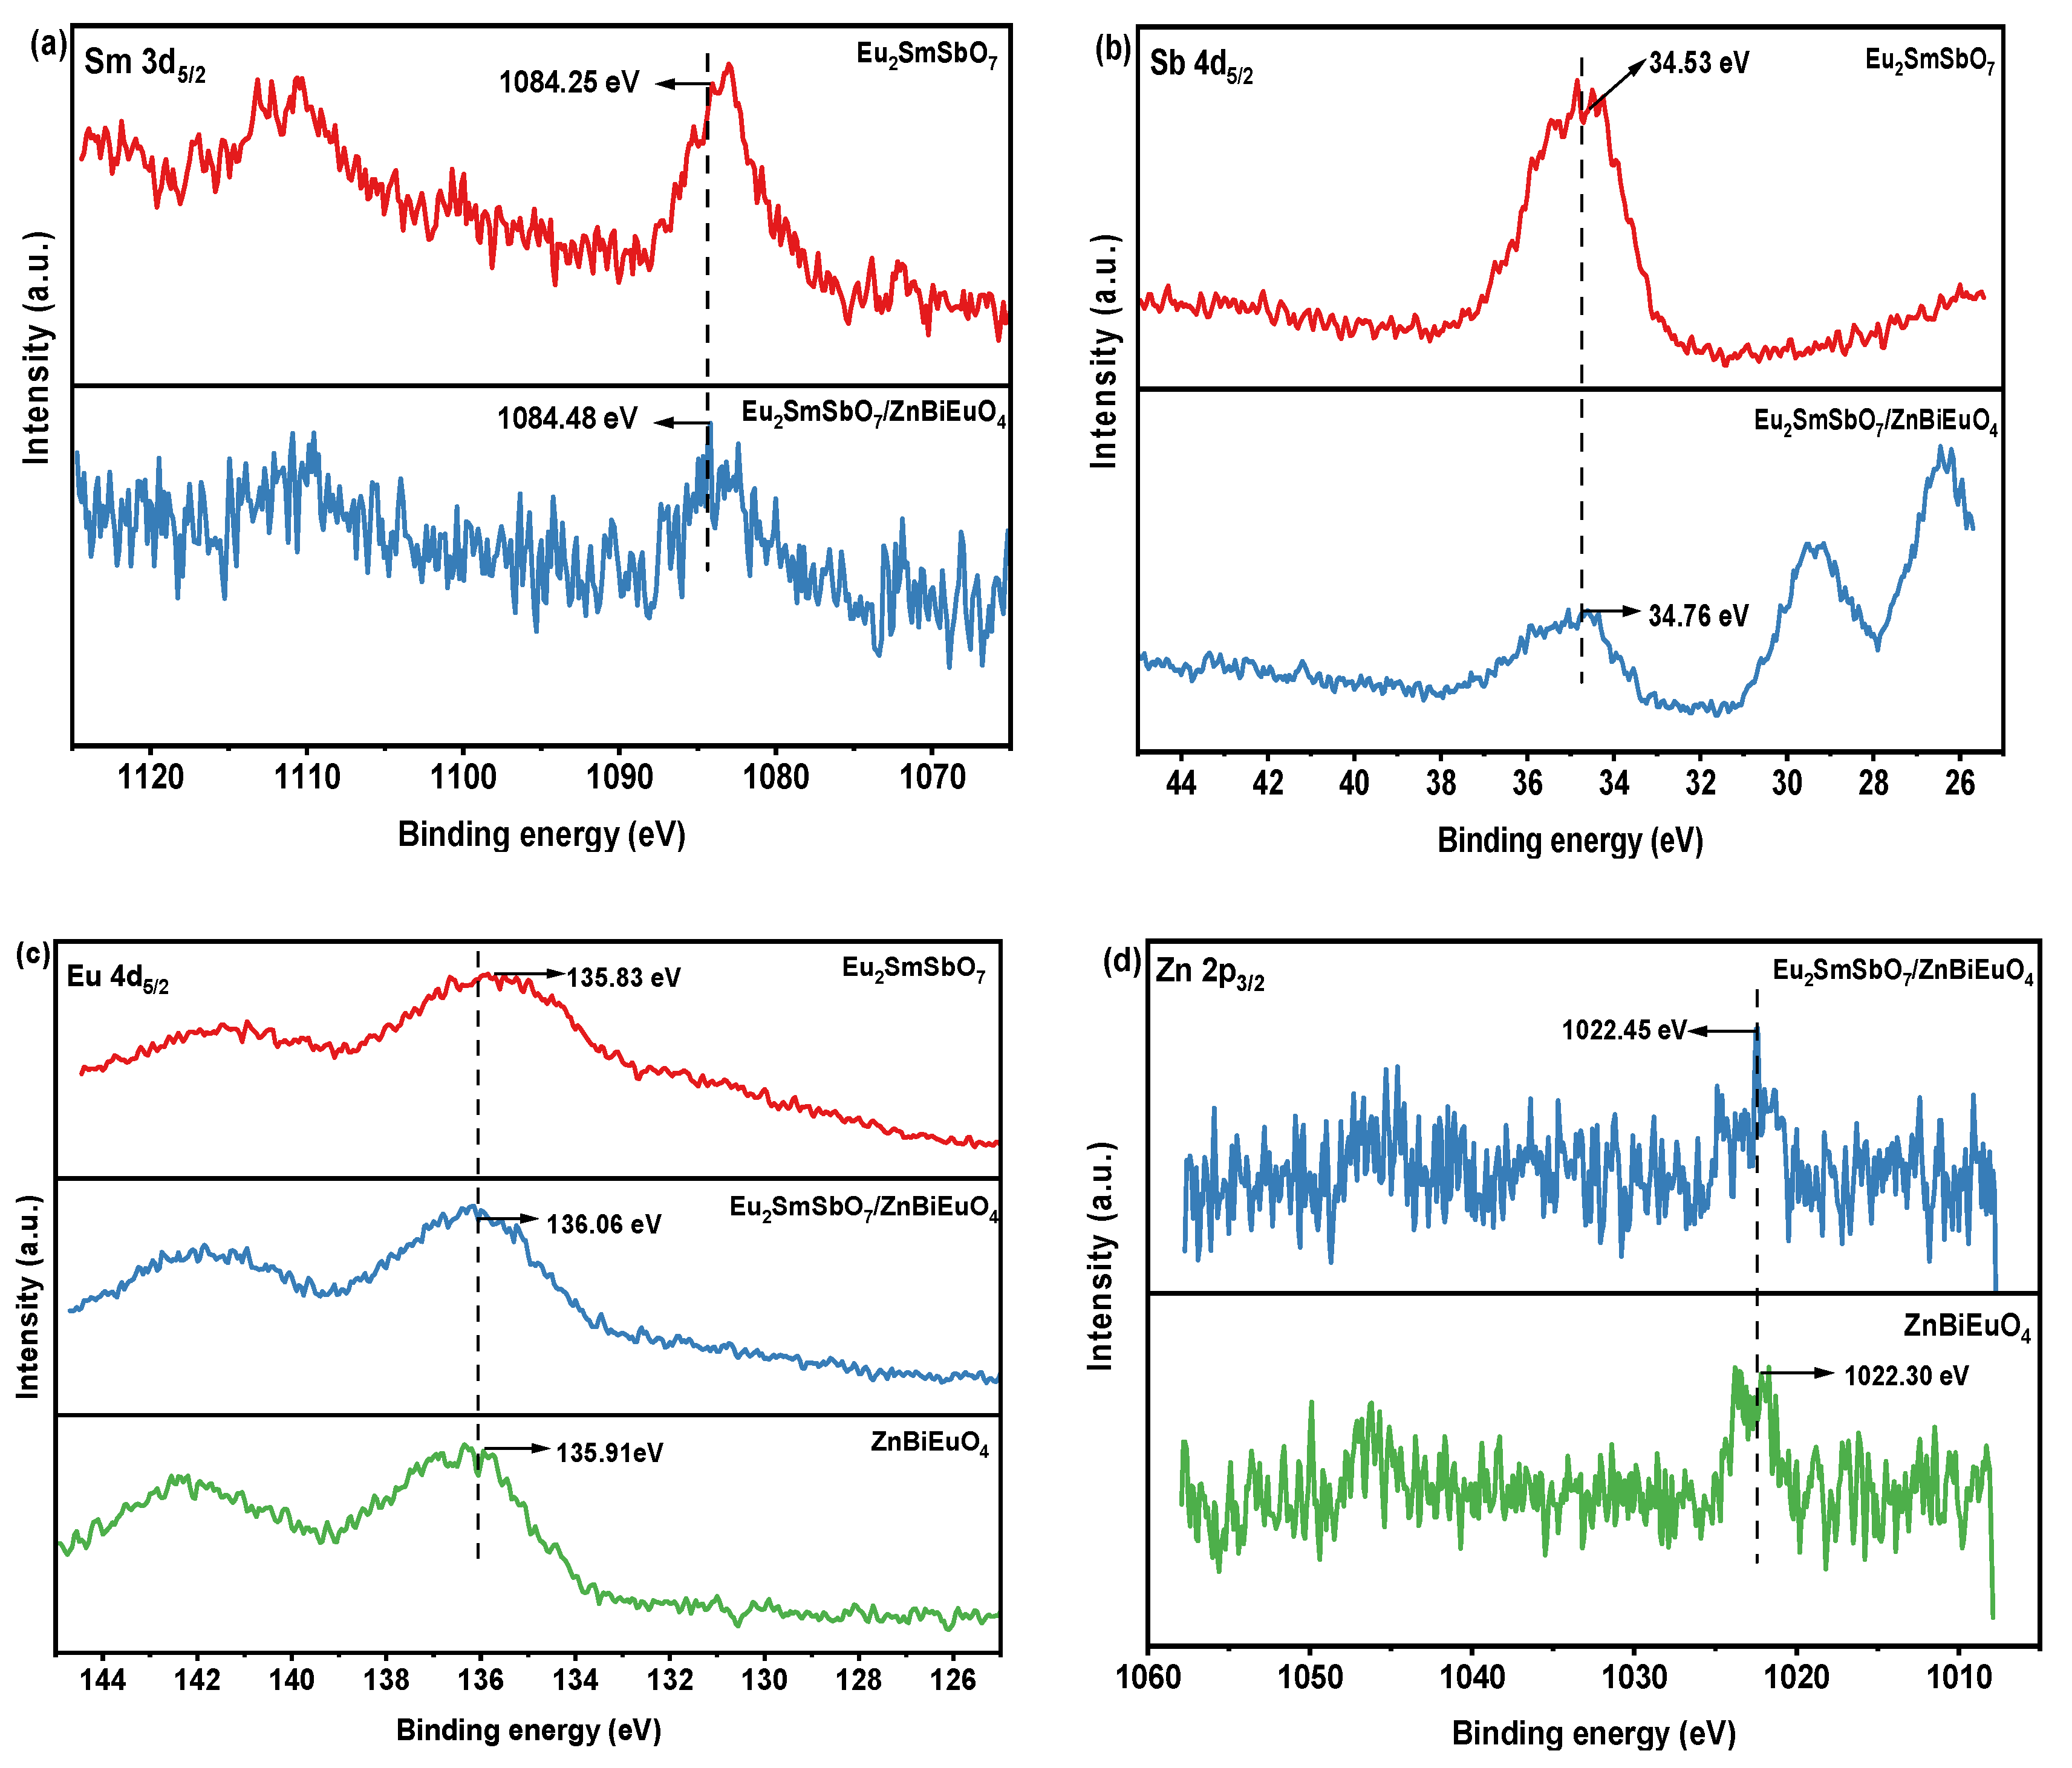
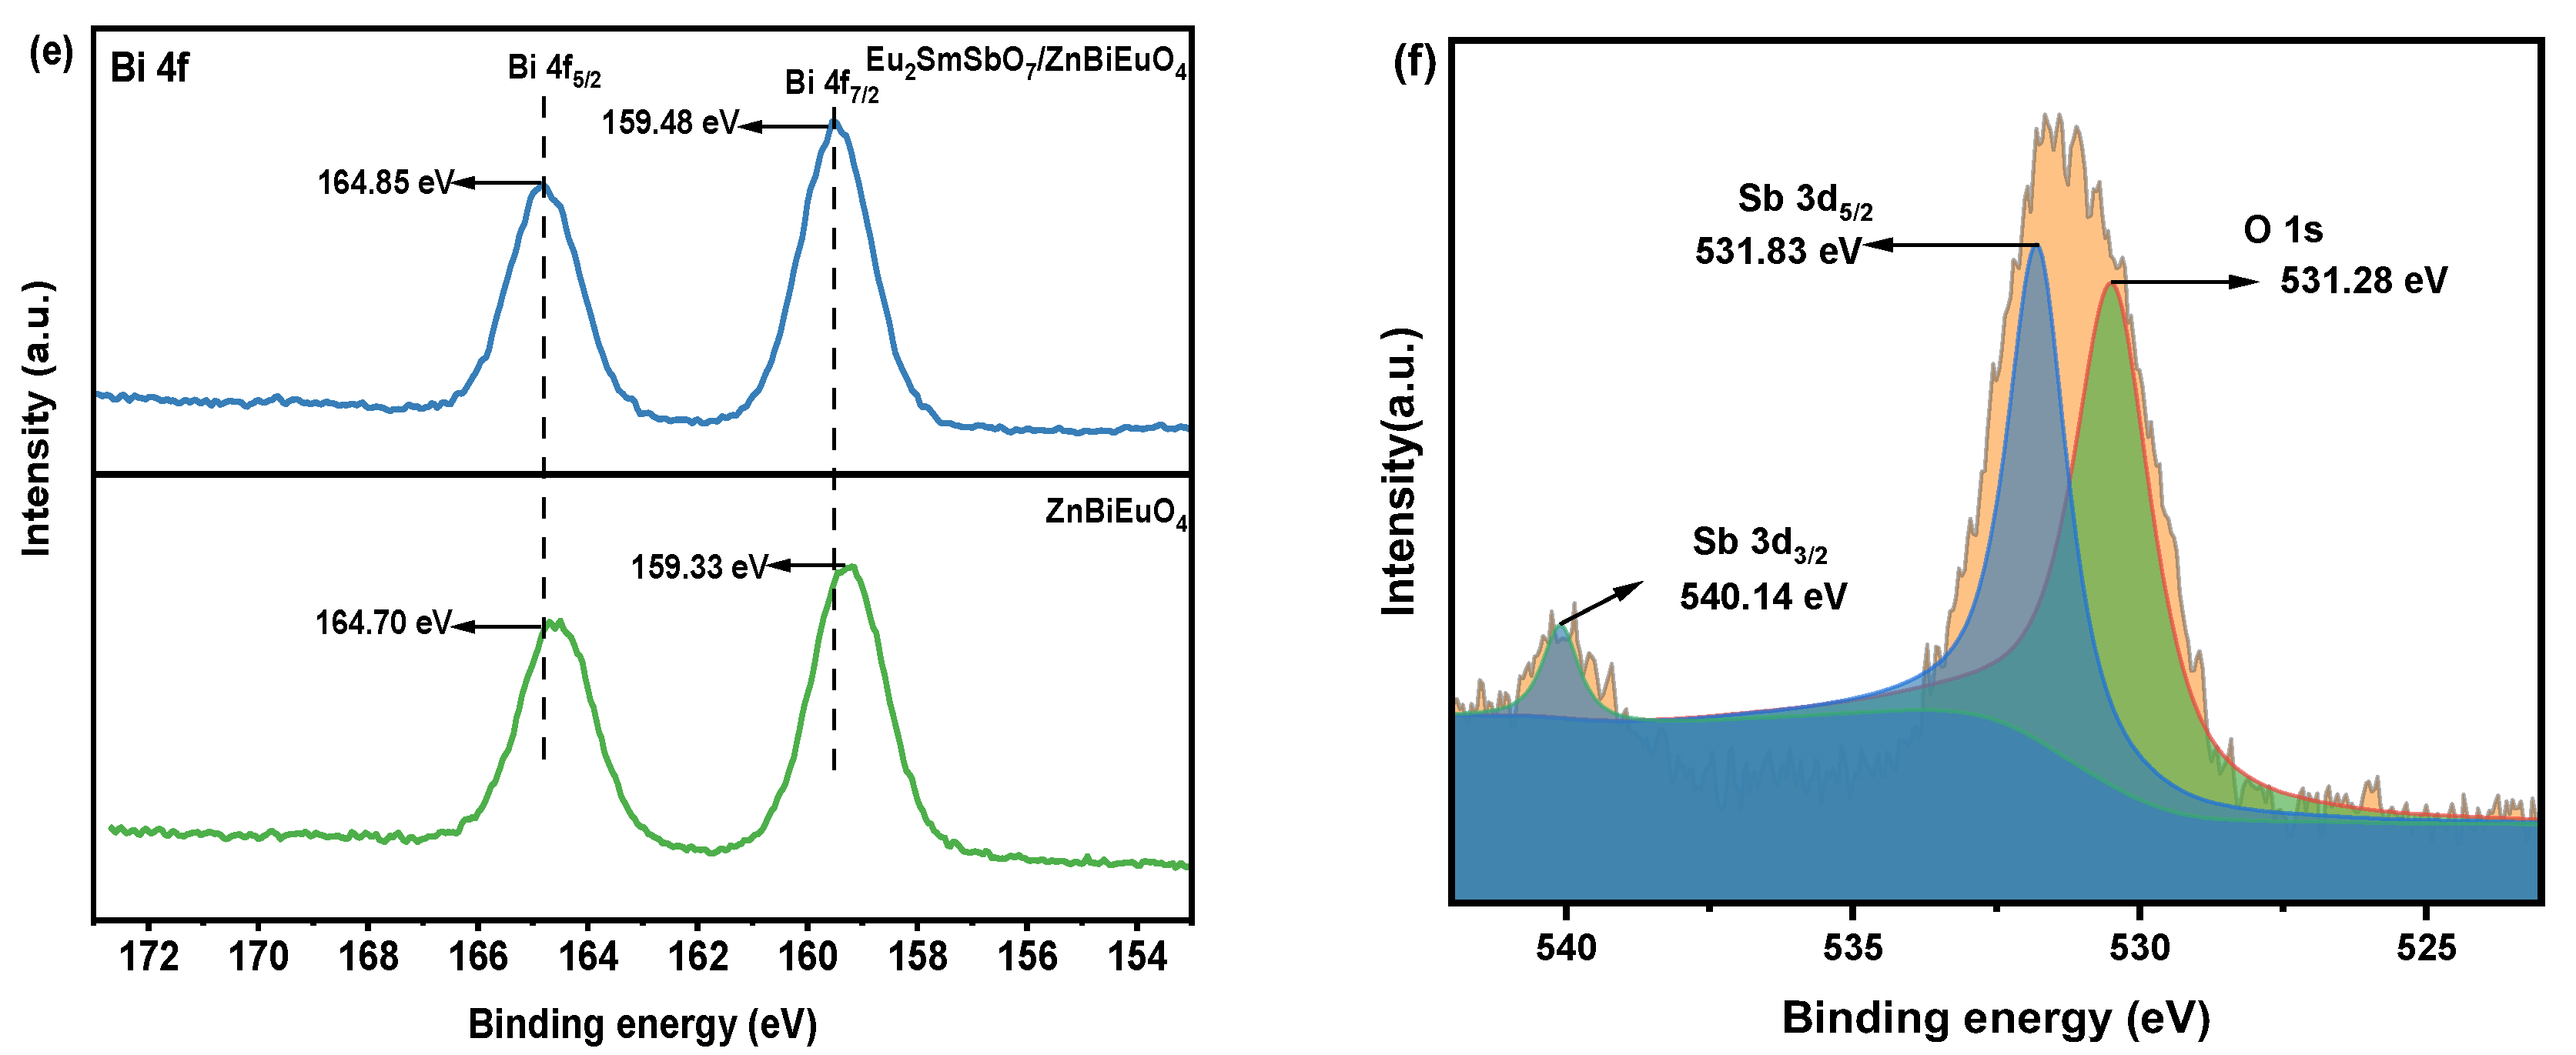
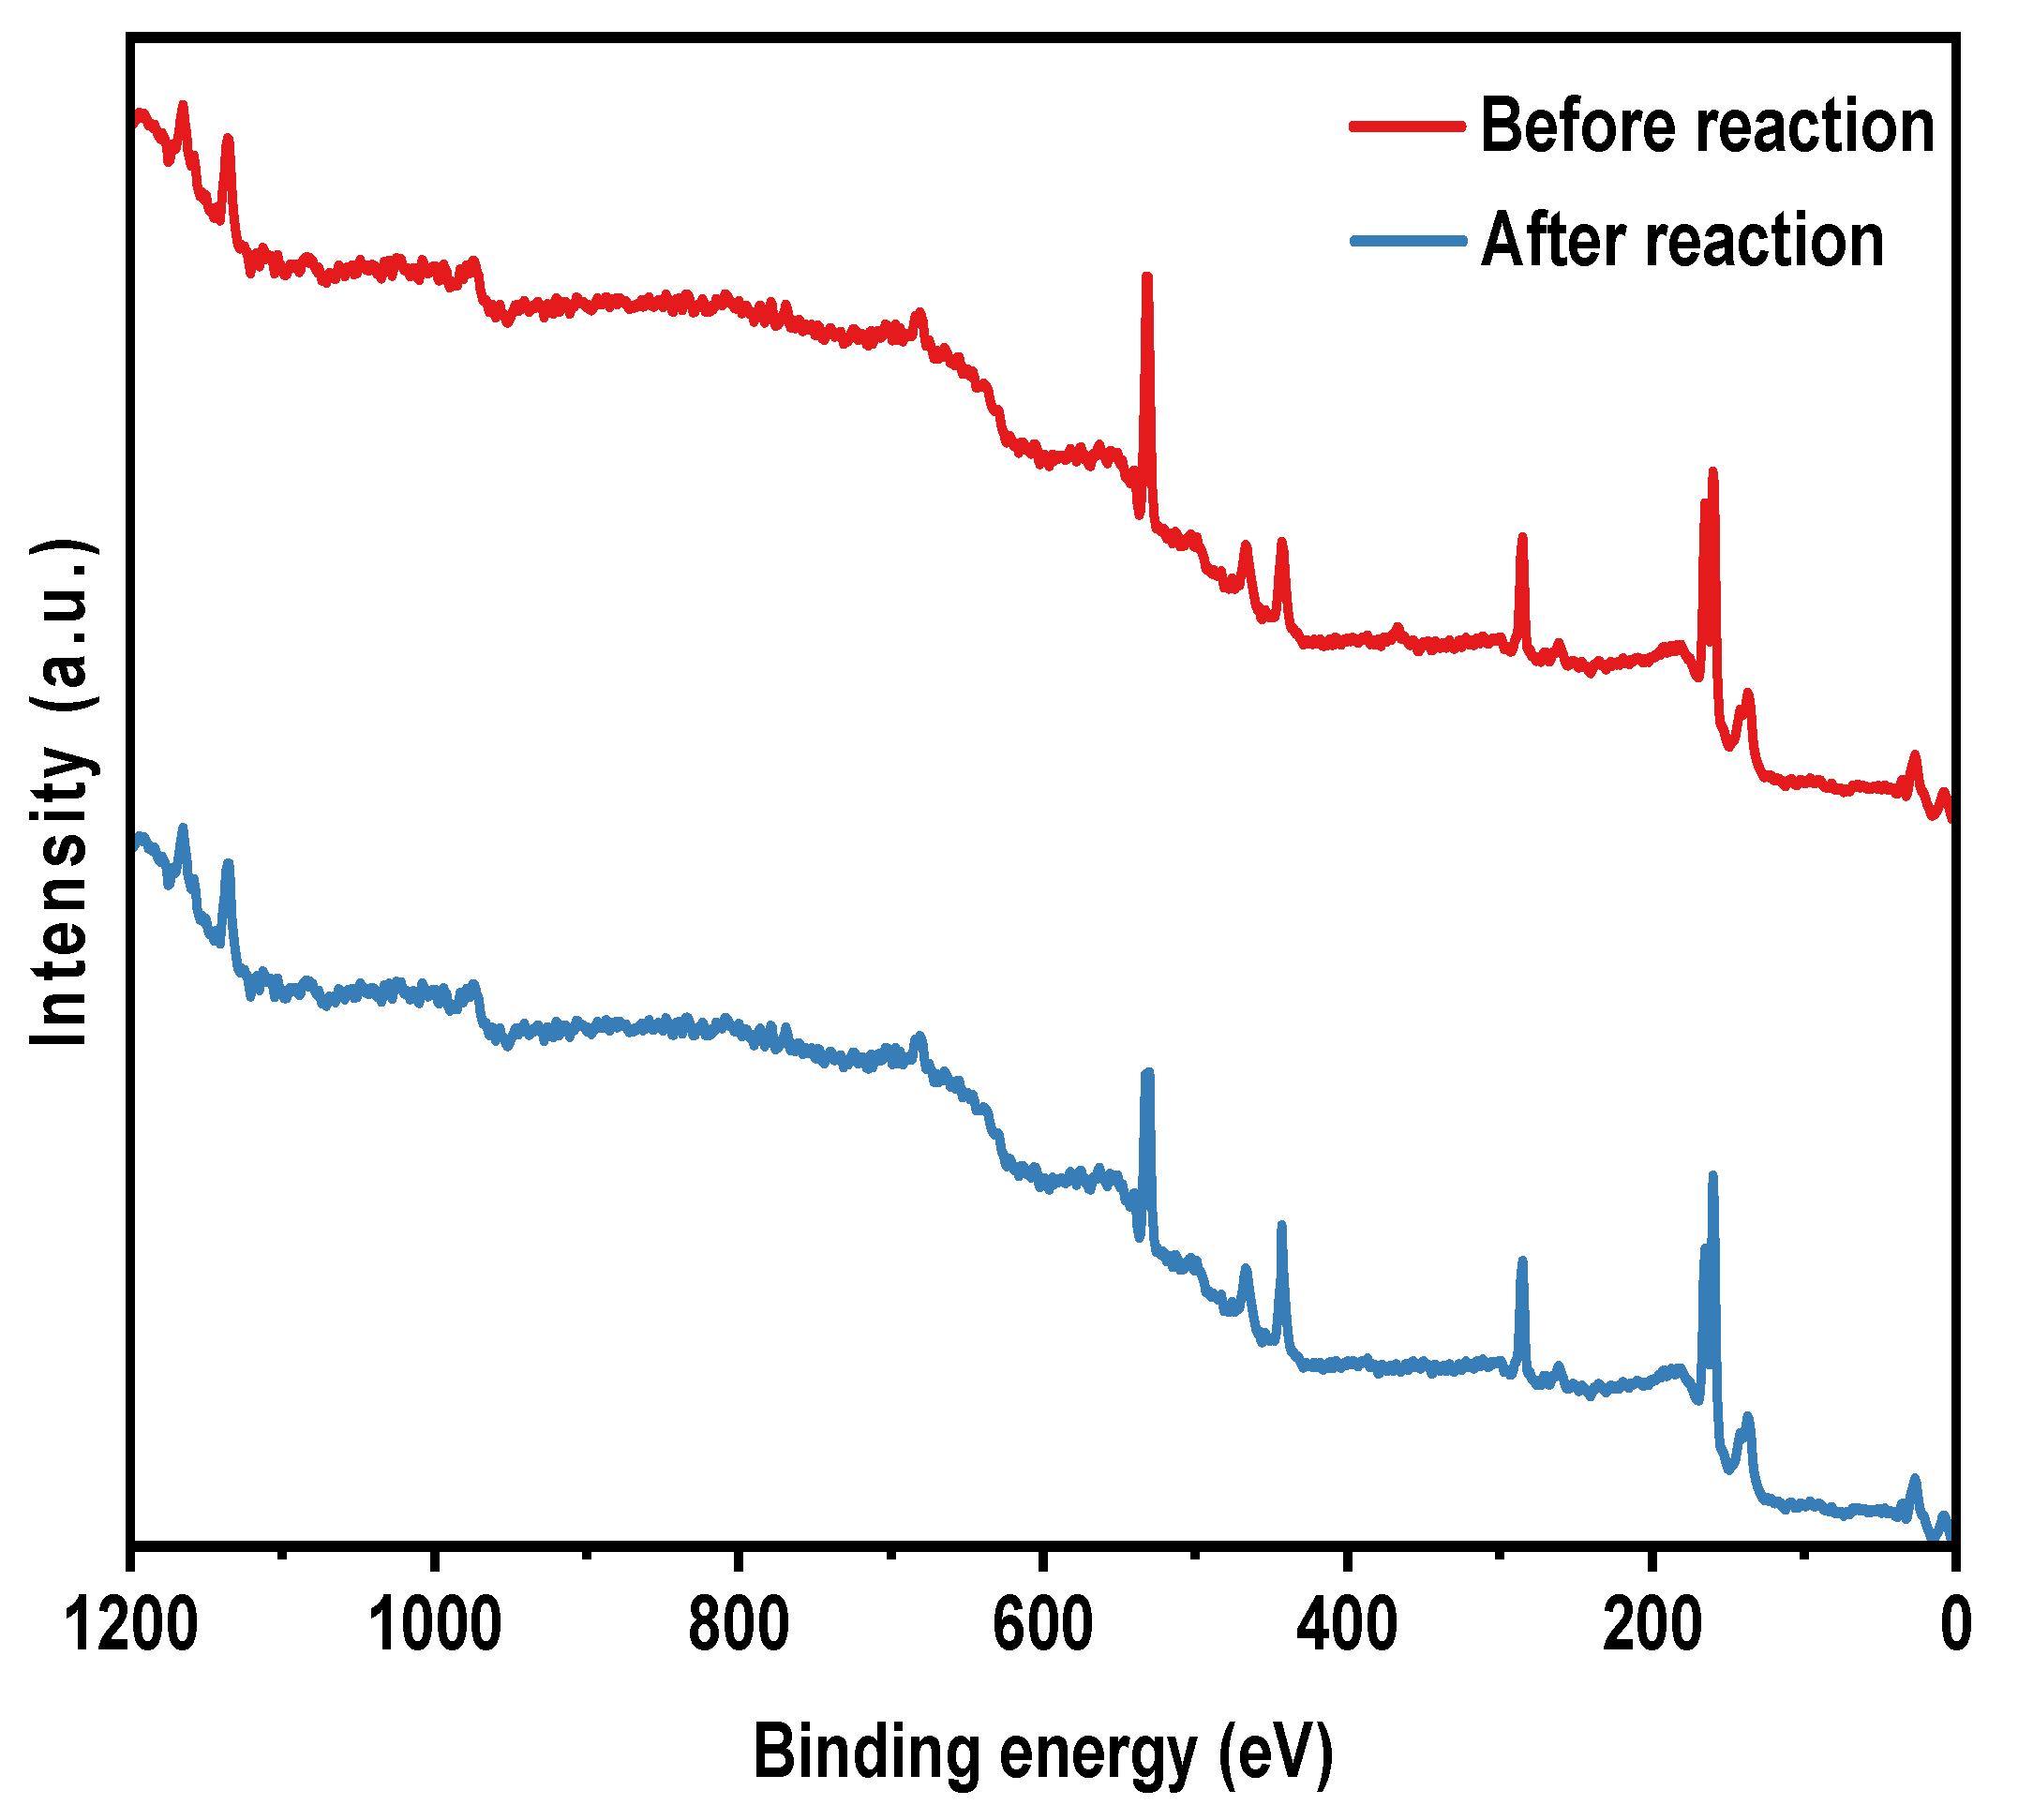
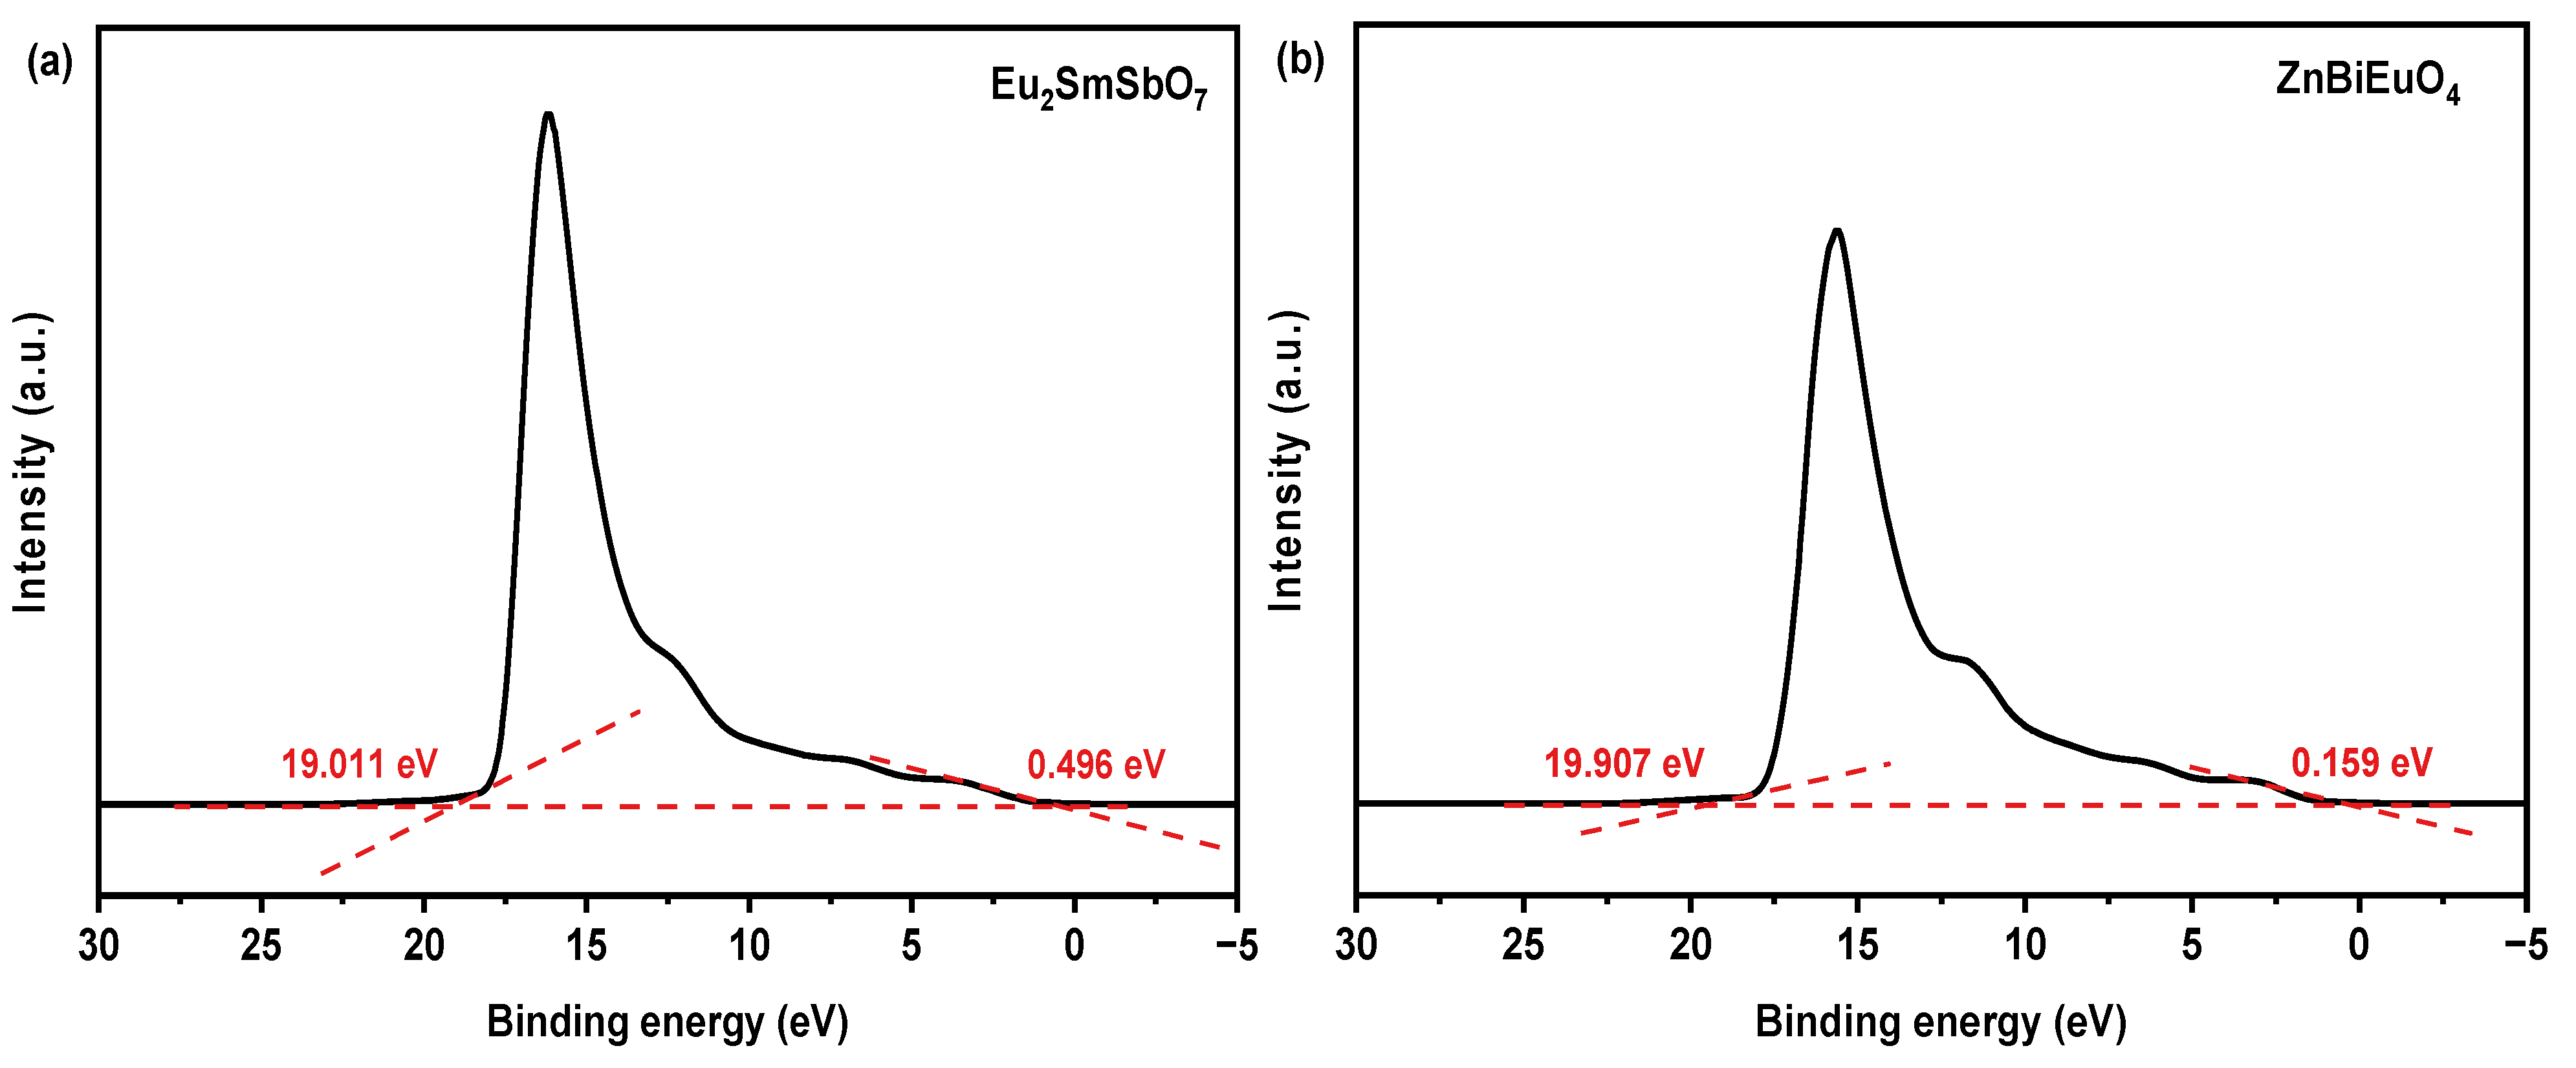
2.4. XPS Analysis
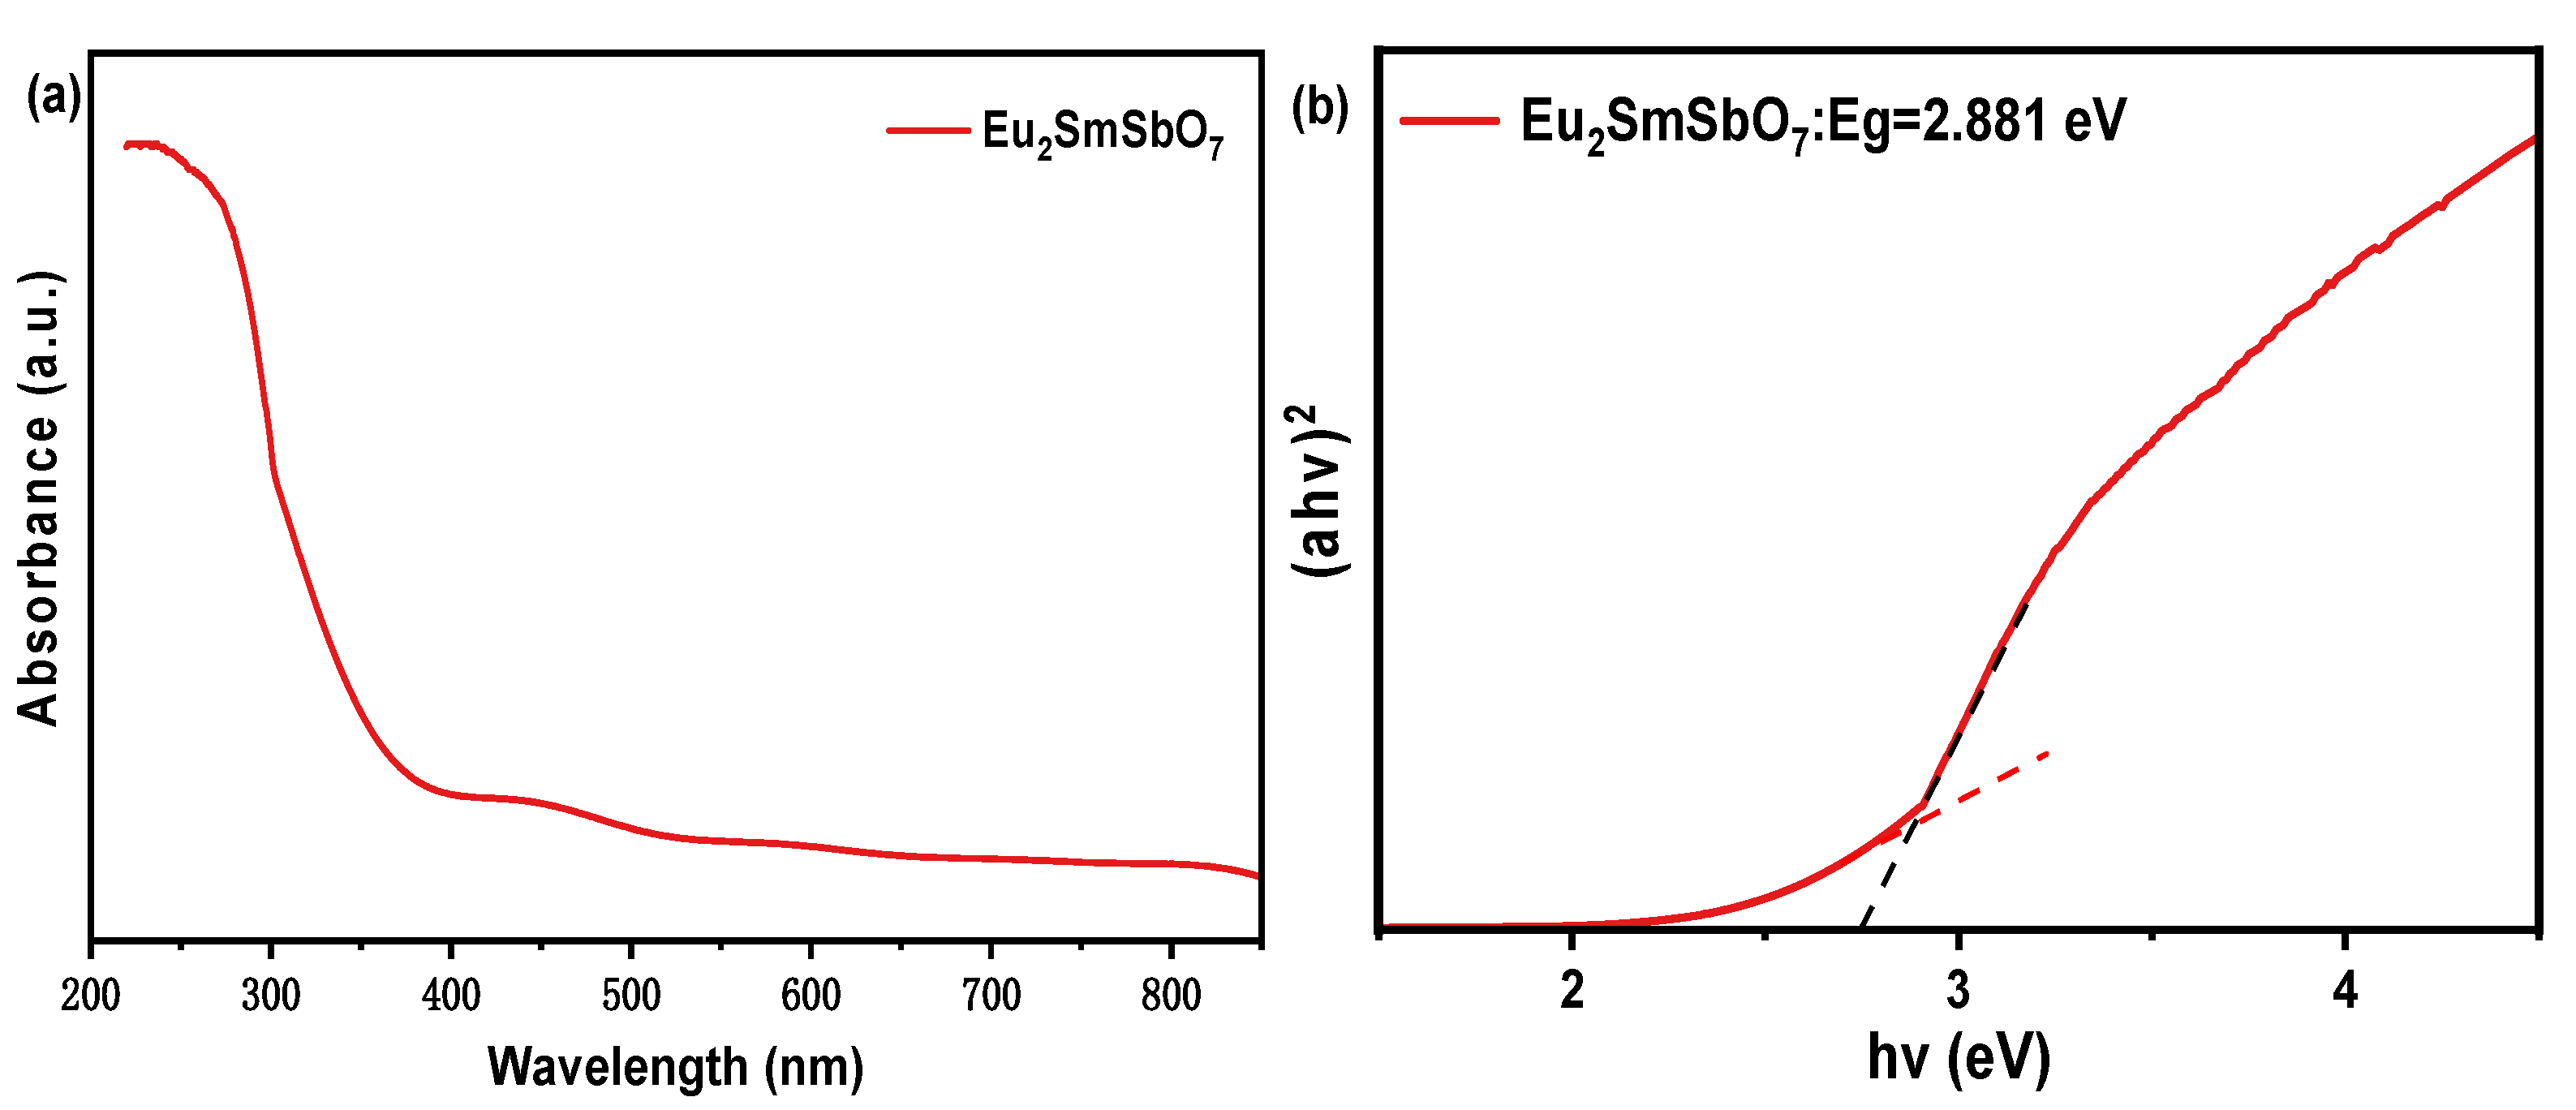
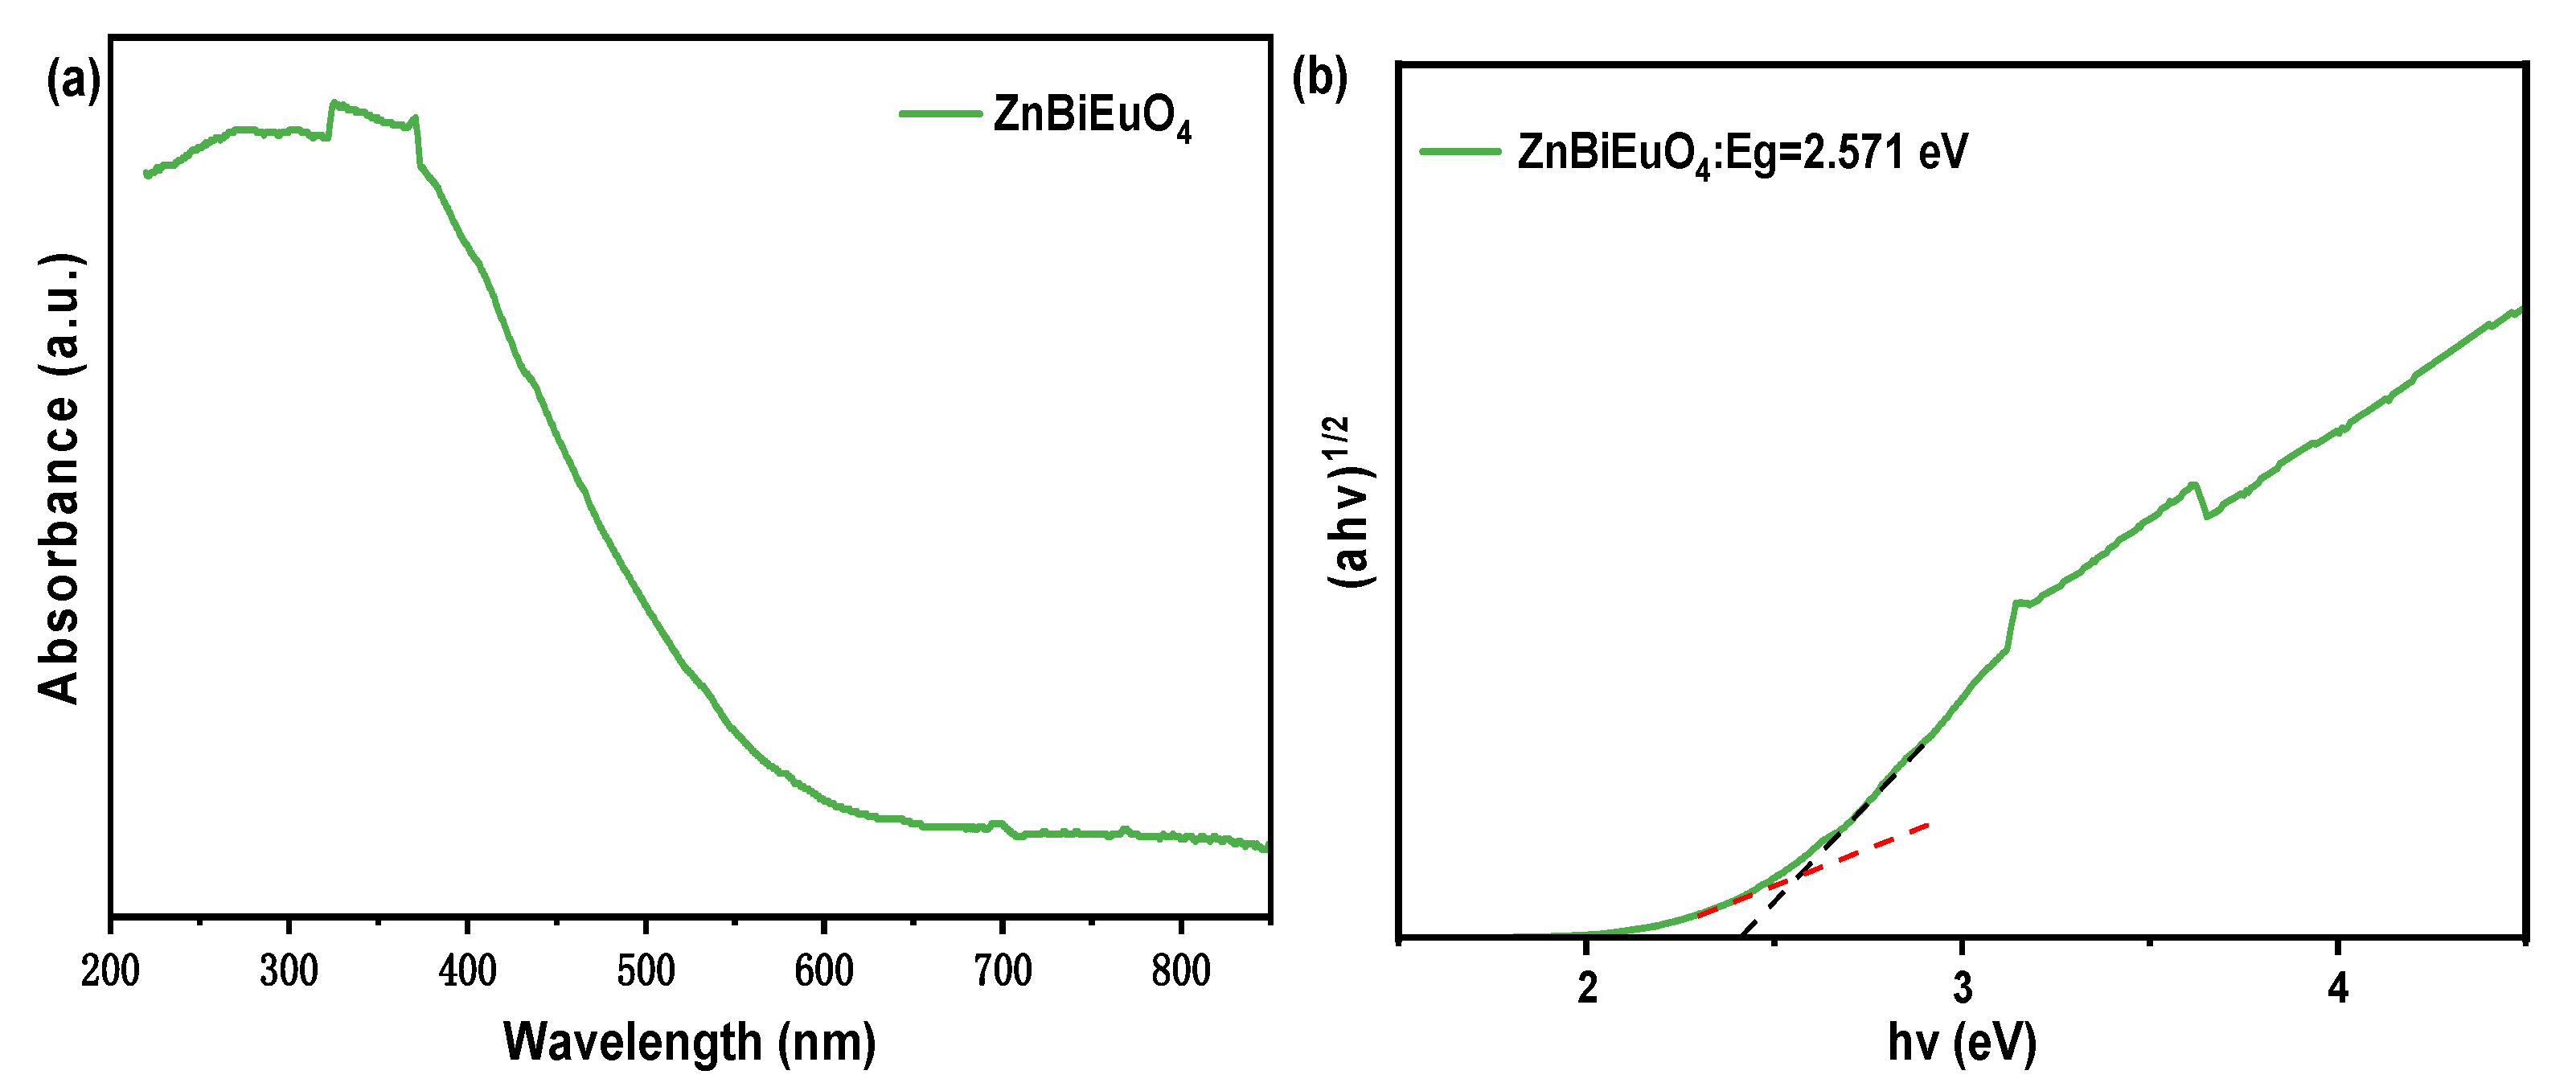
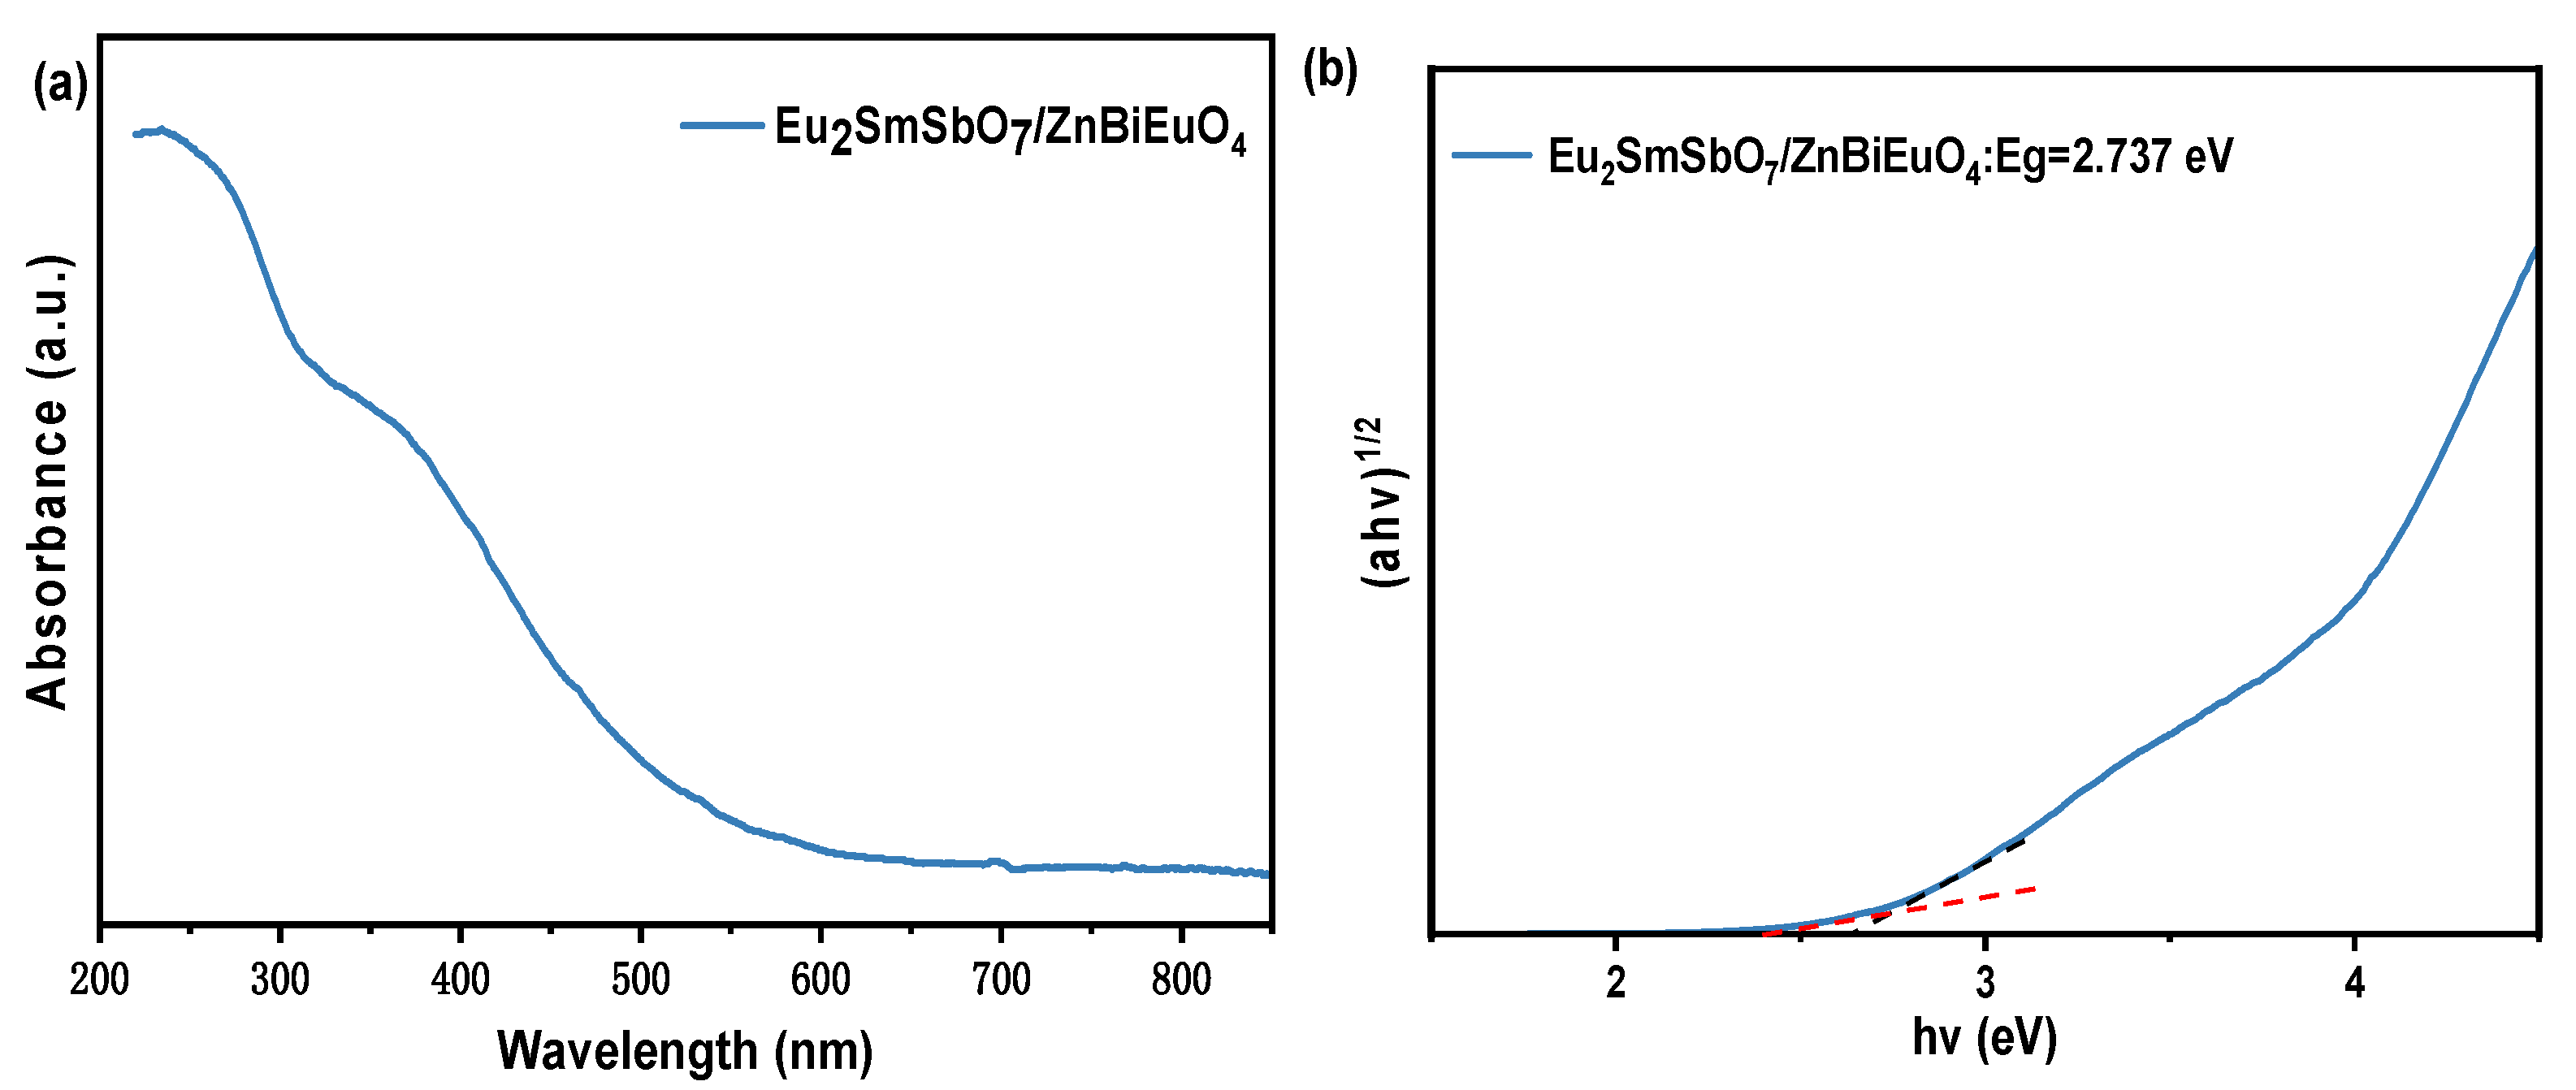
2.5. UV-Vis Diffuse Reflectance Spectra
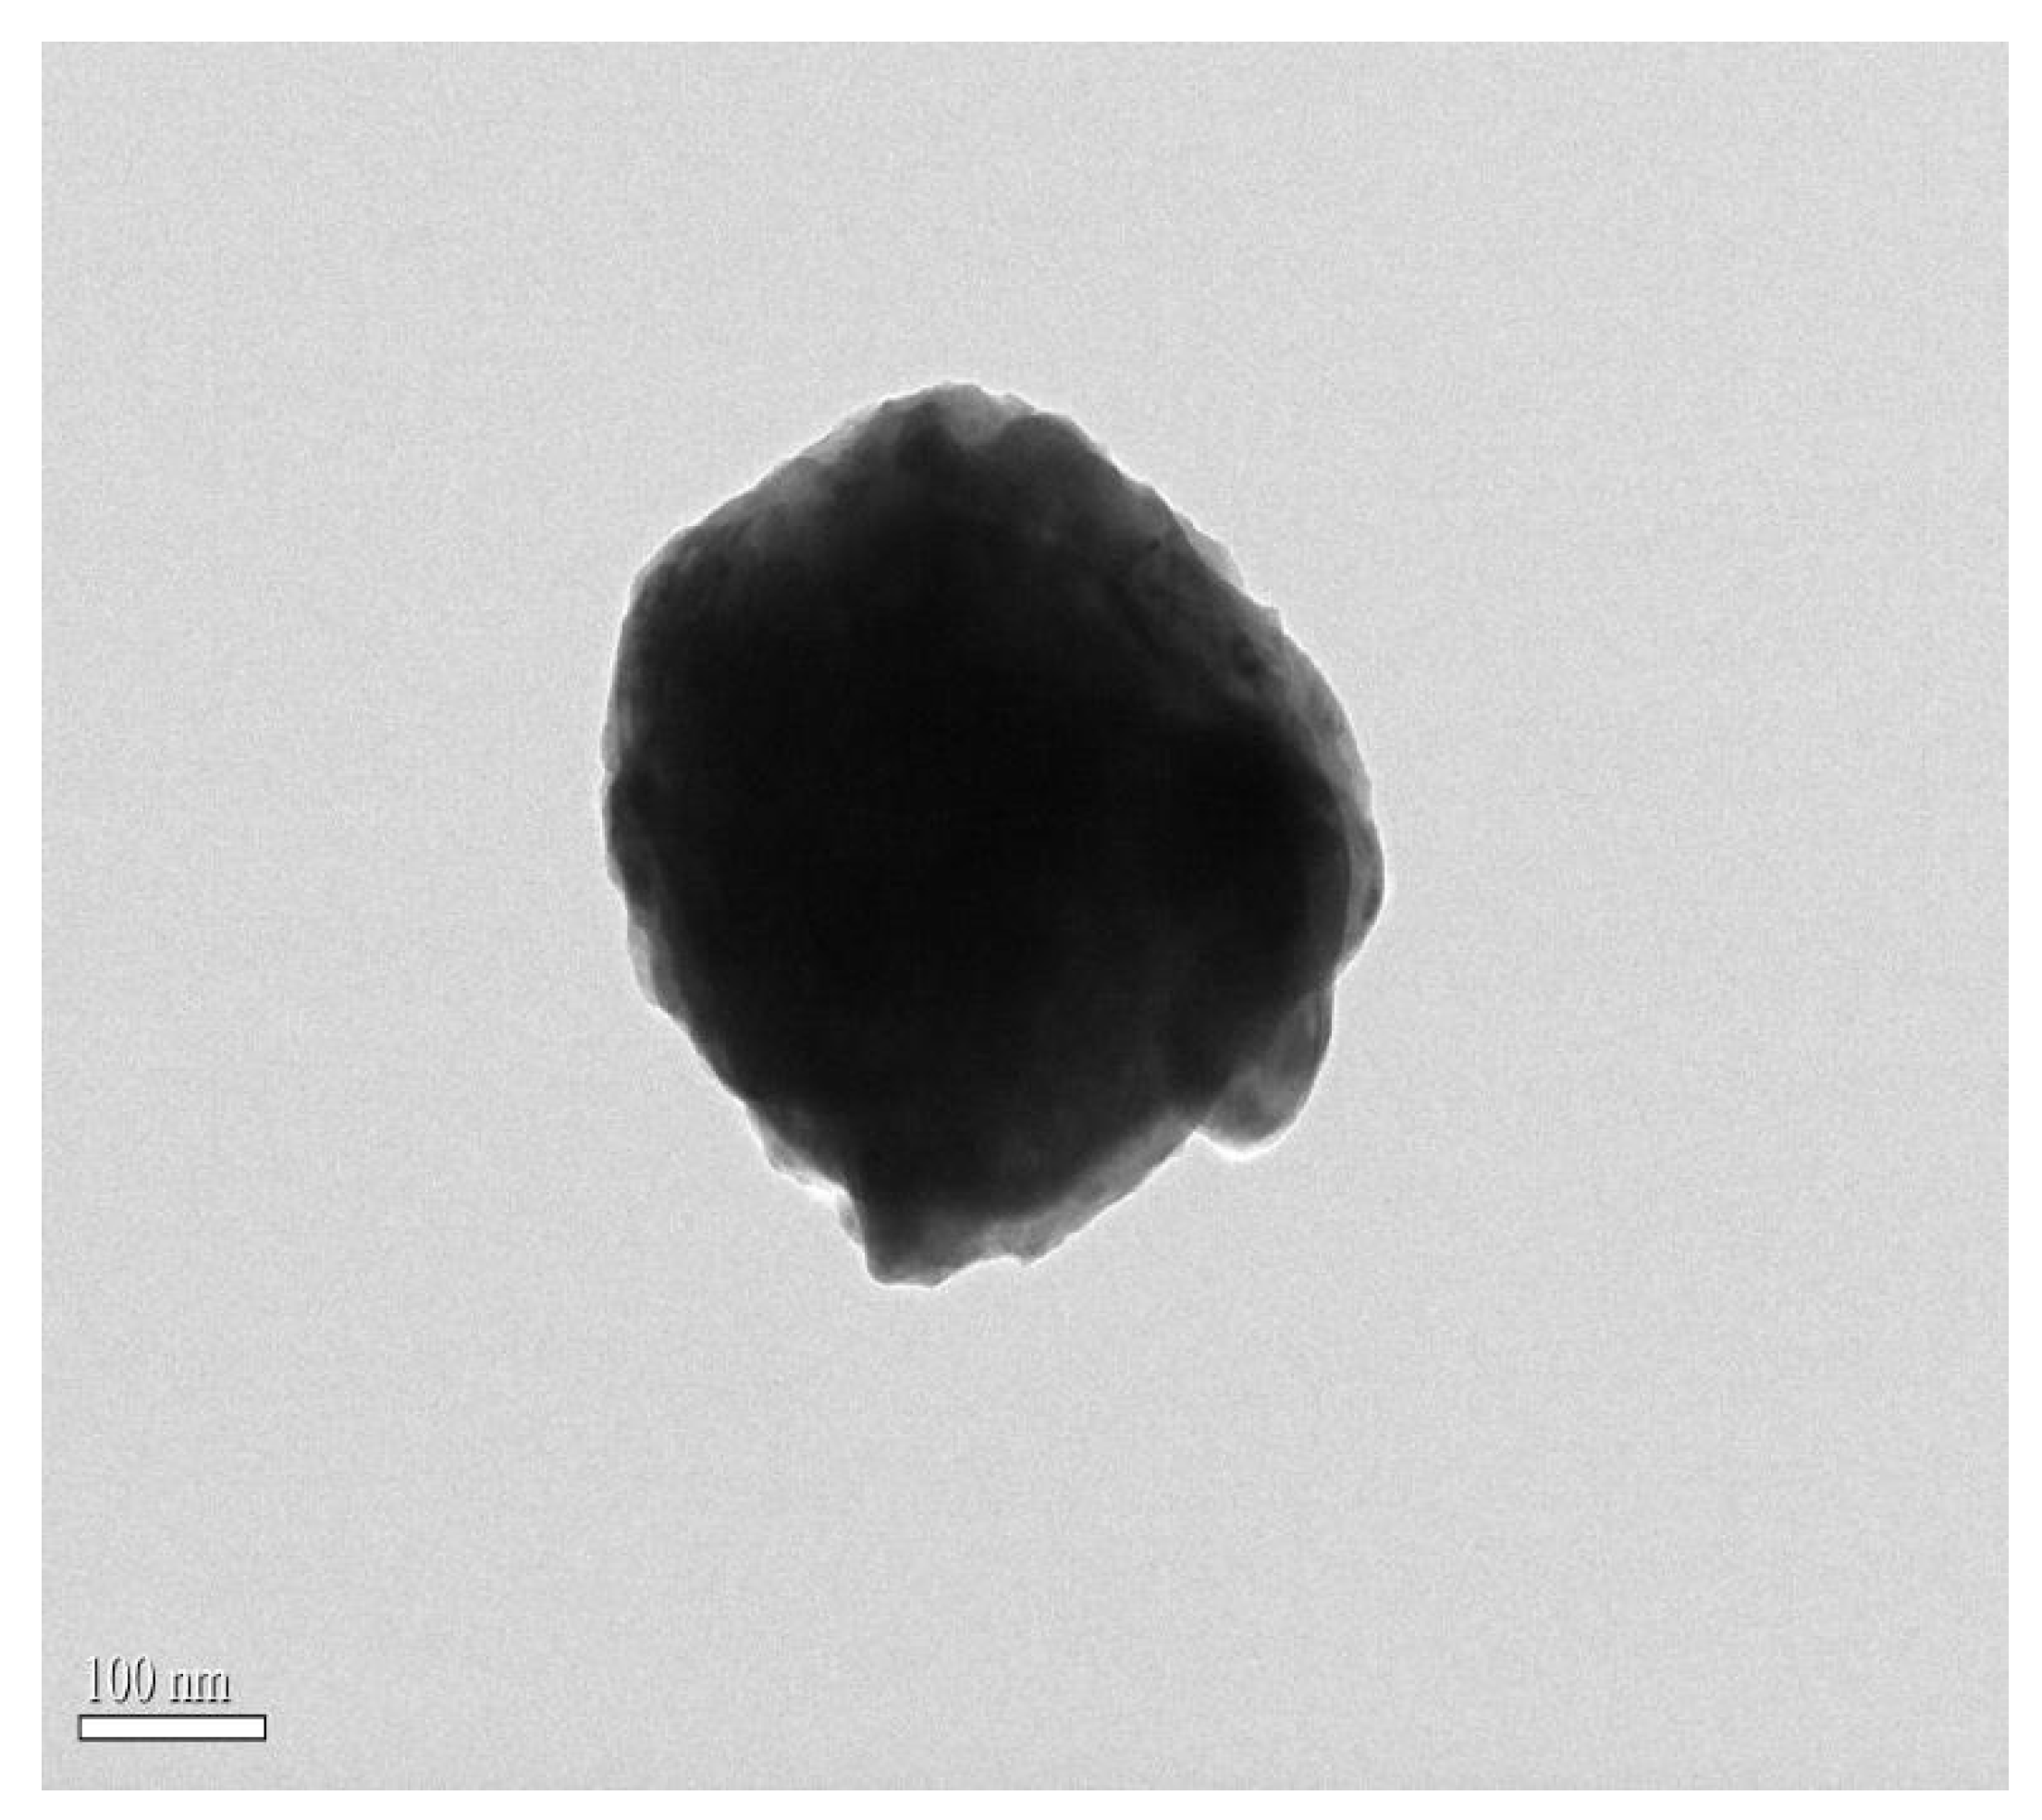
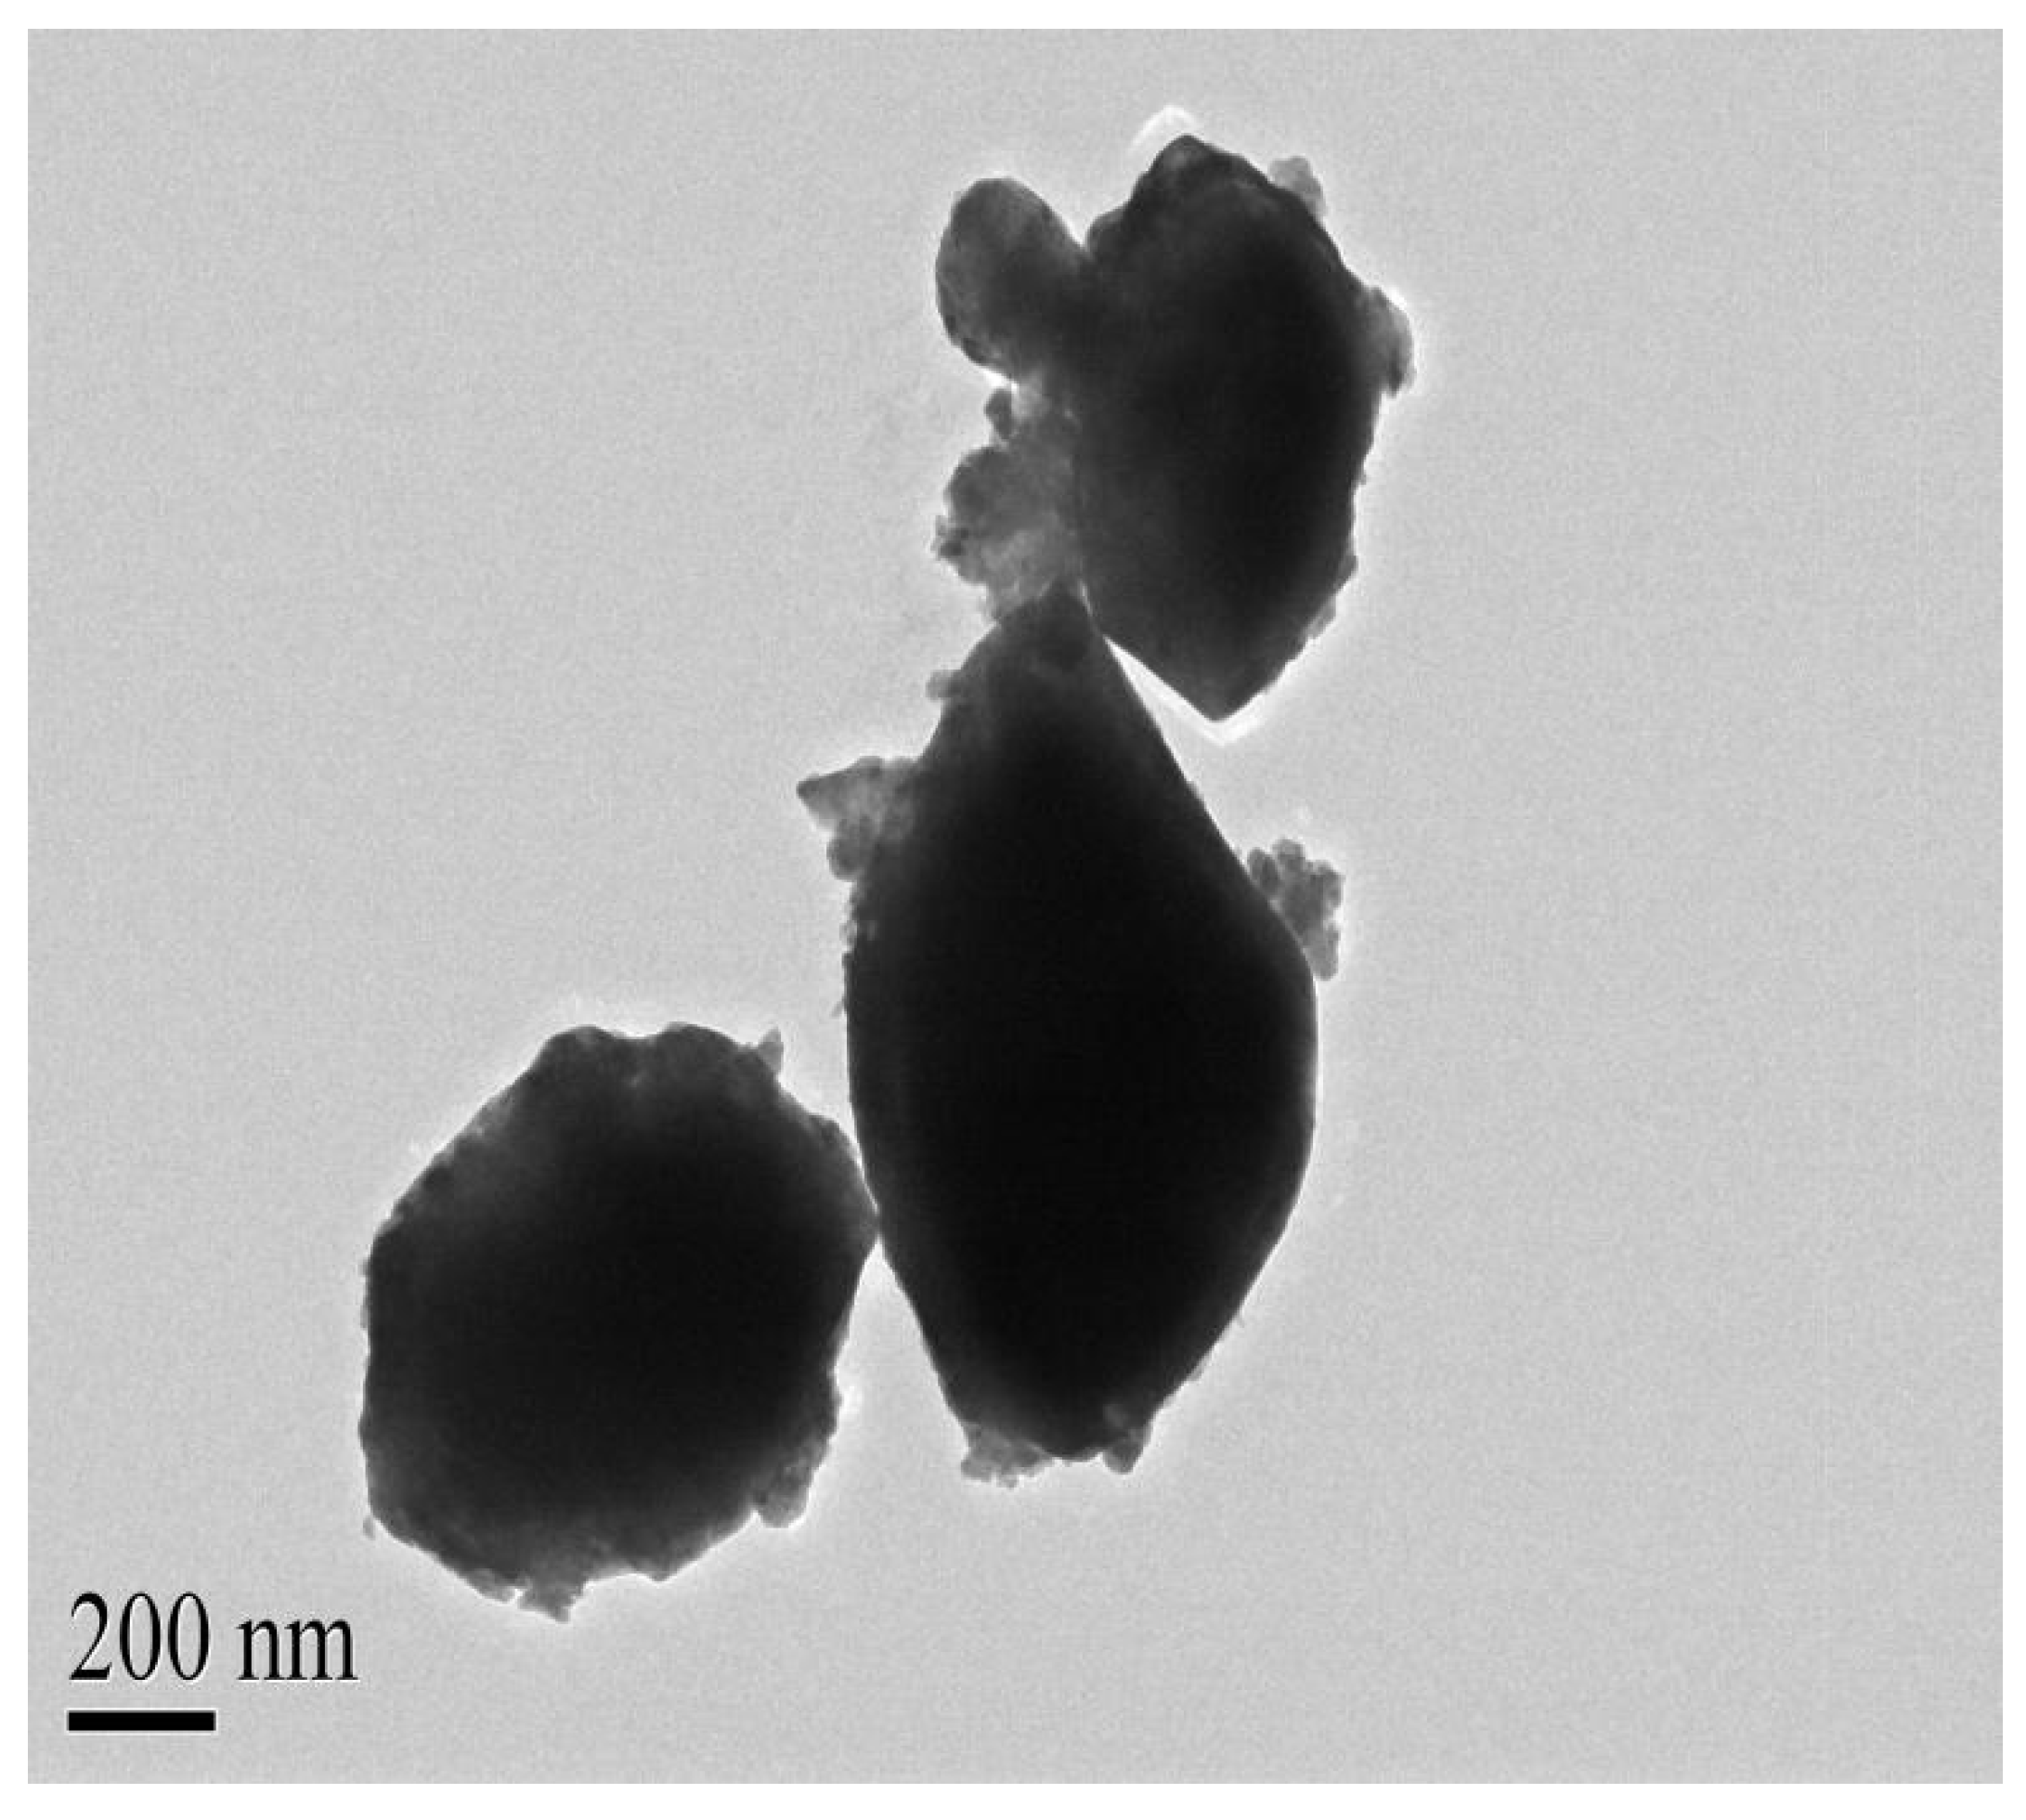
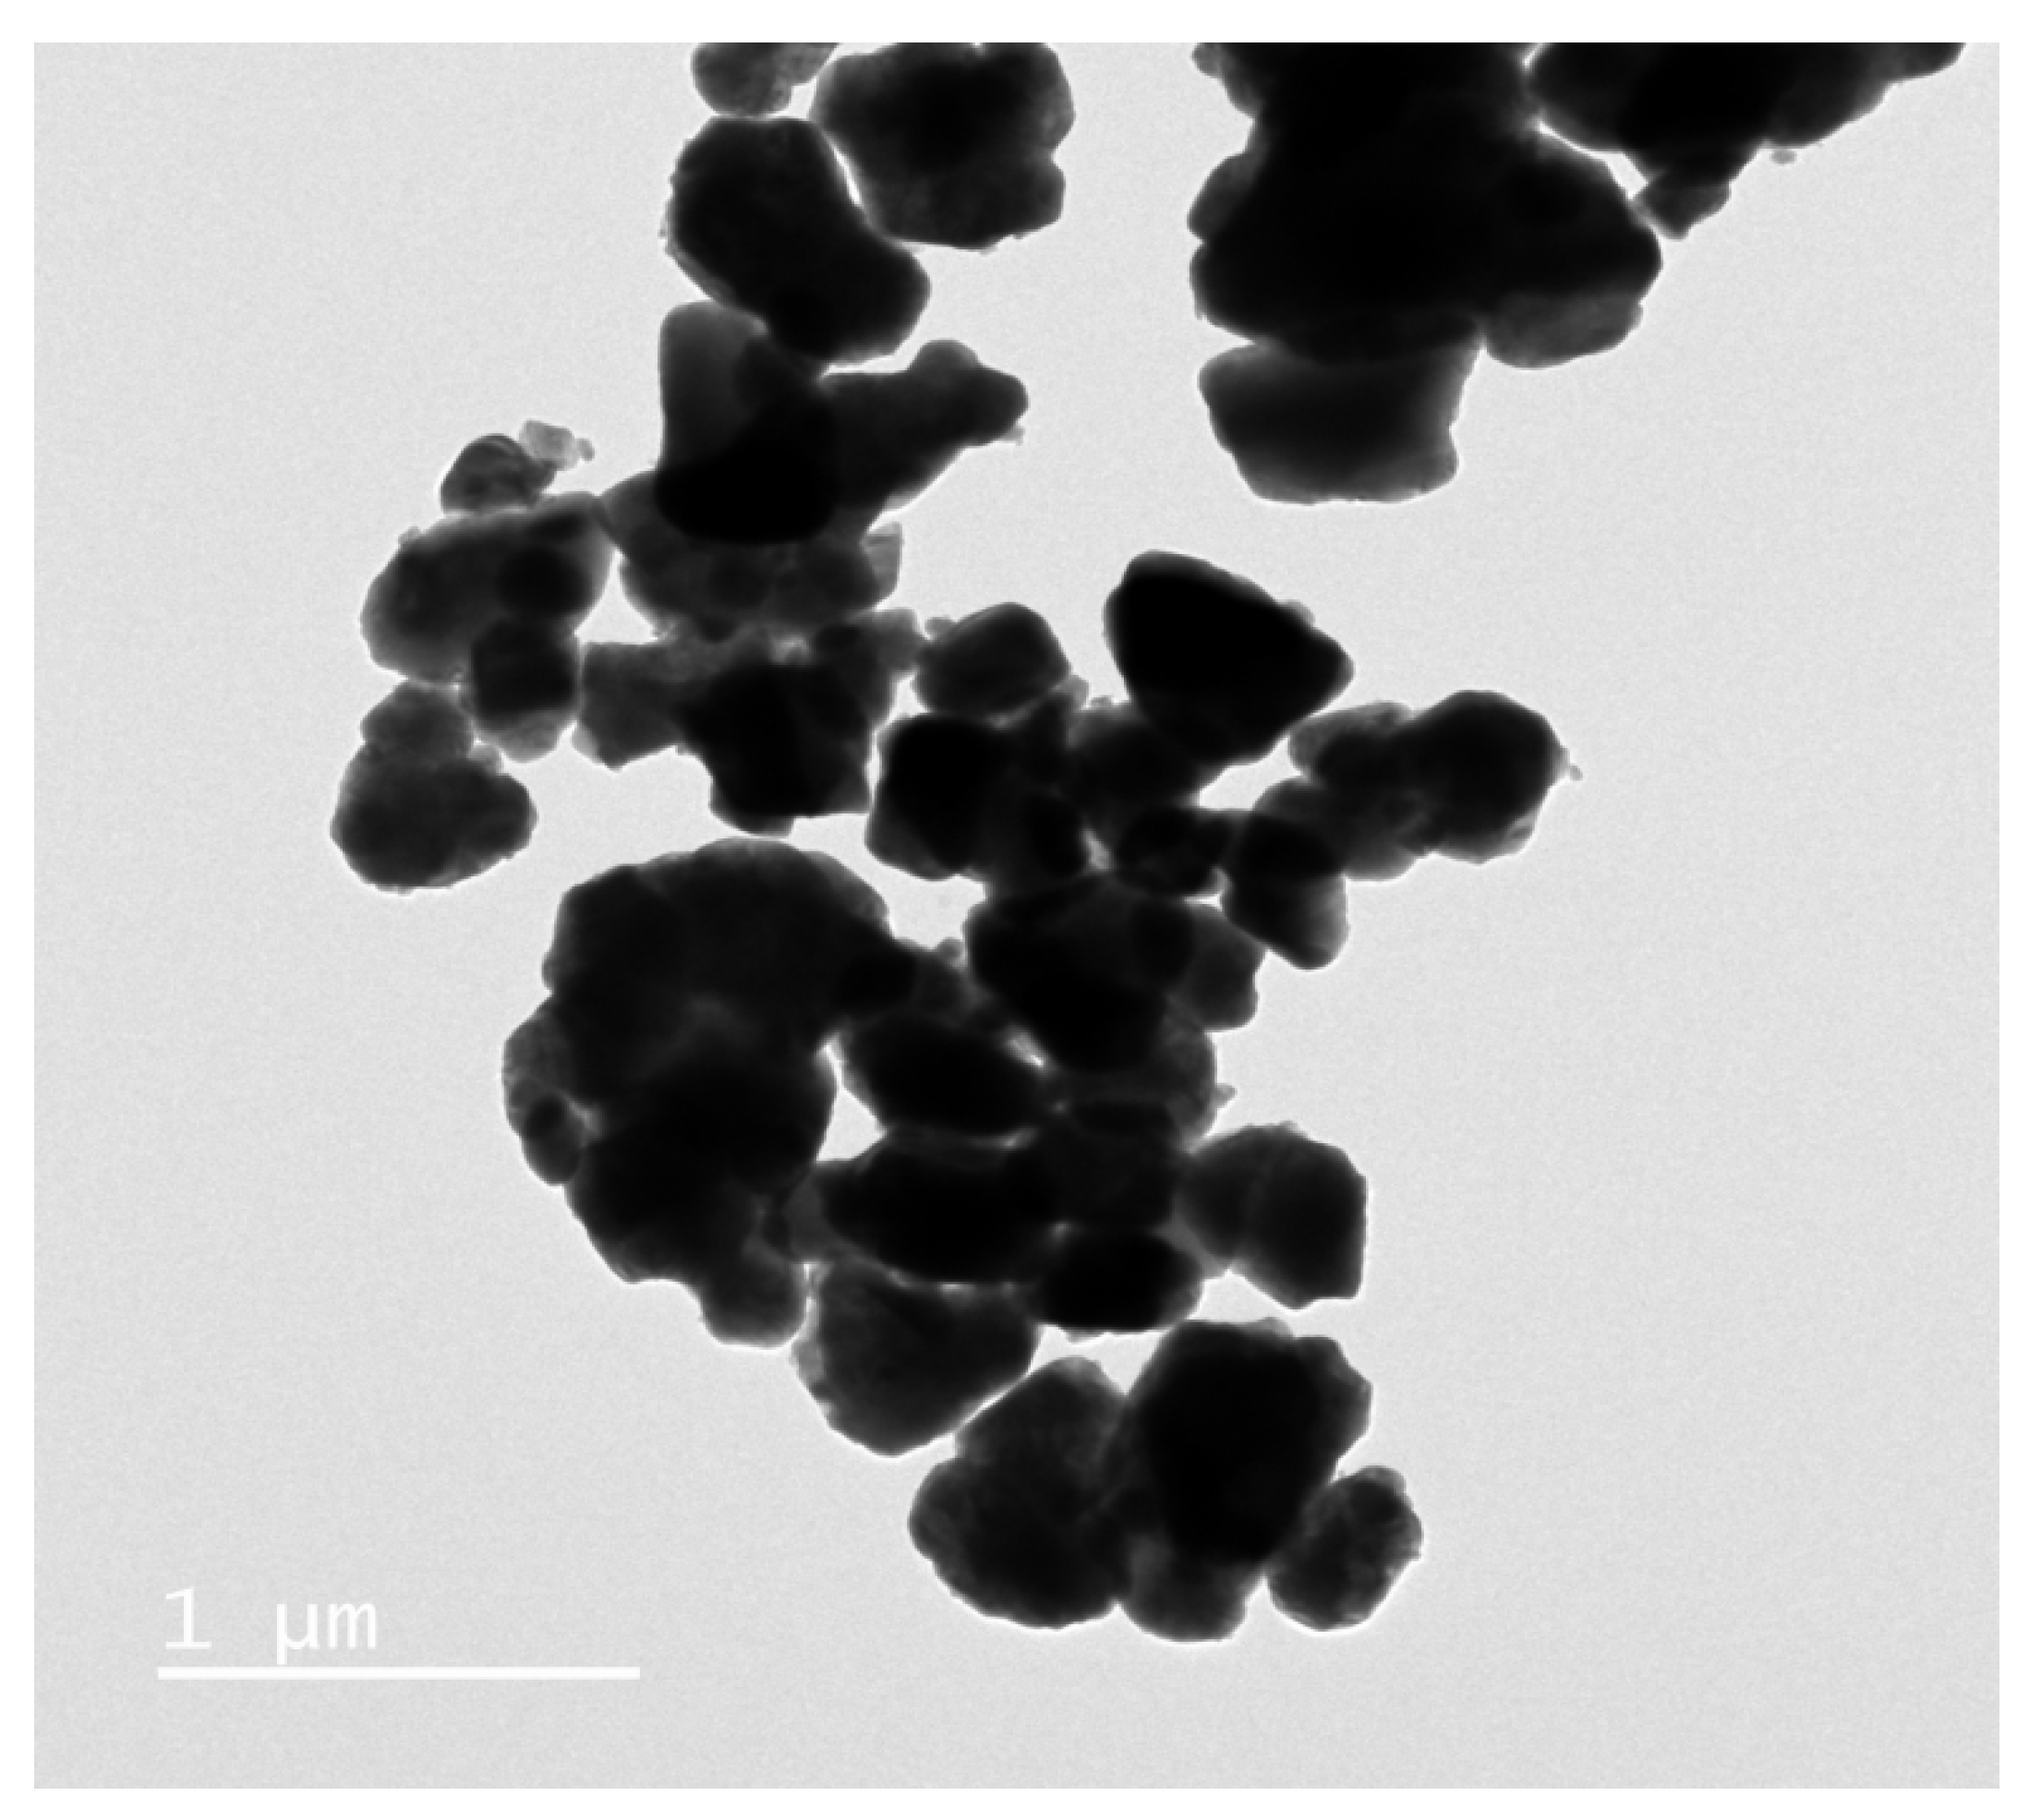
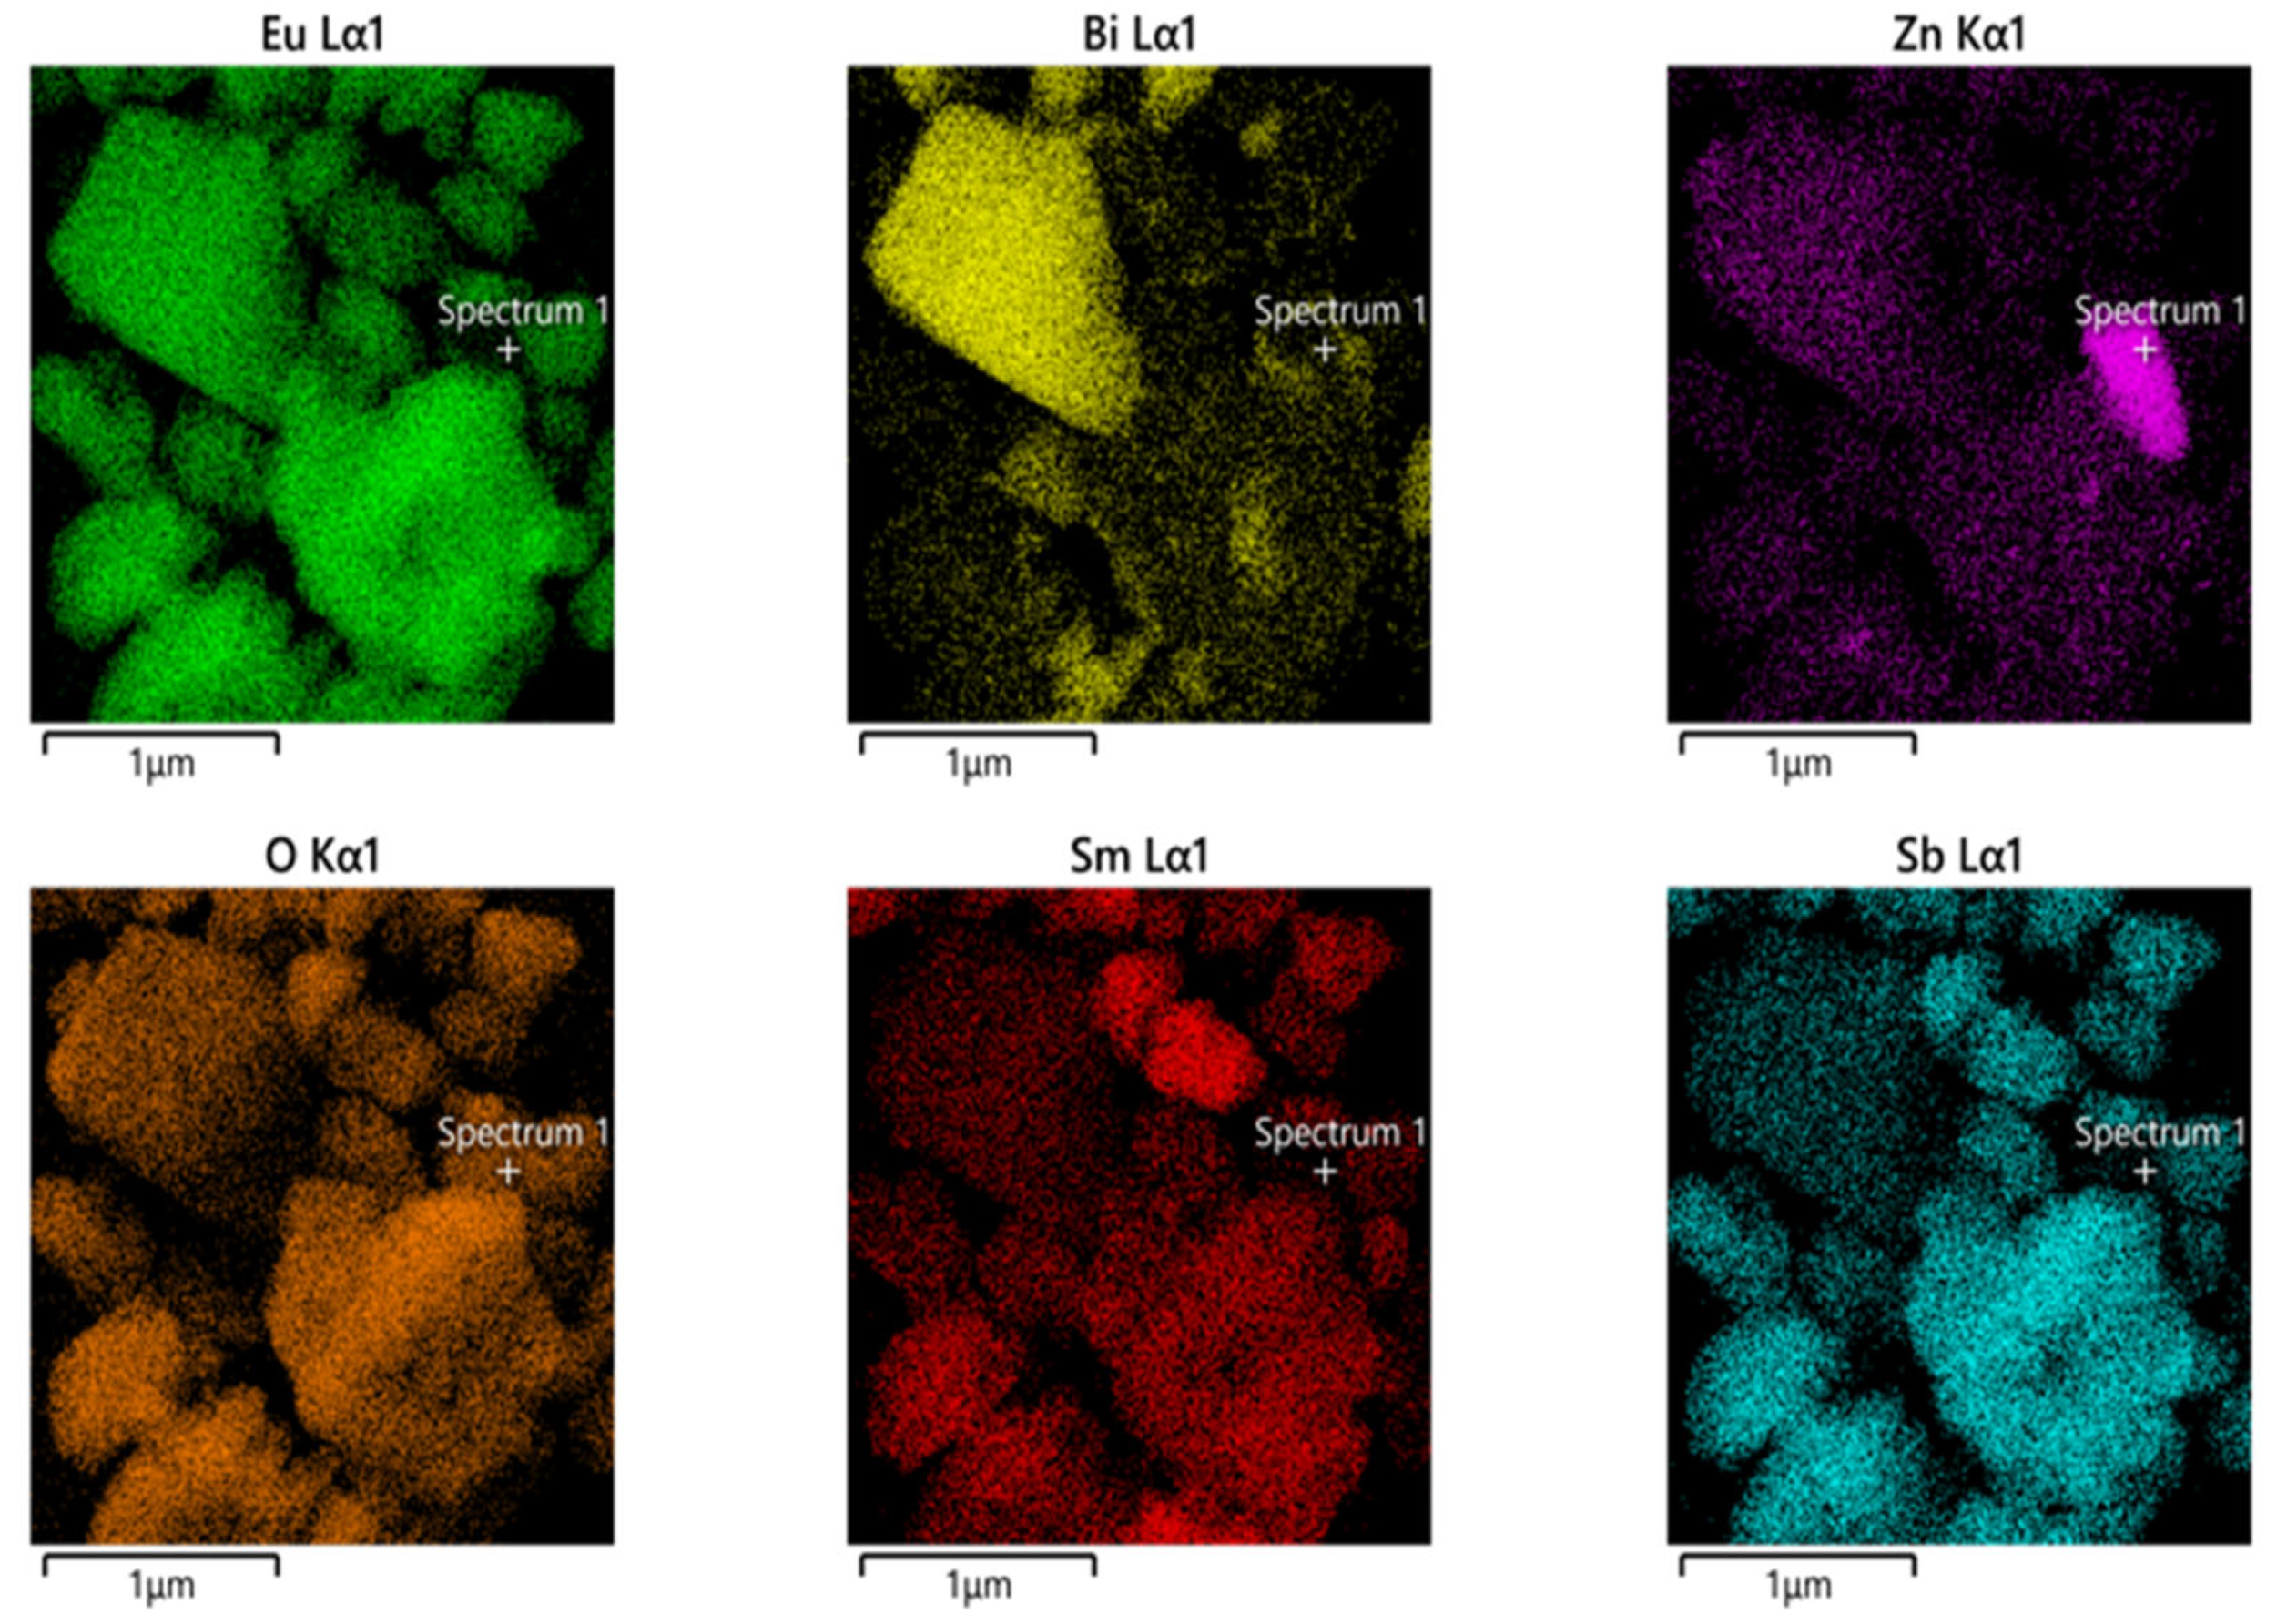
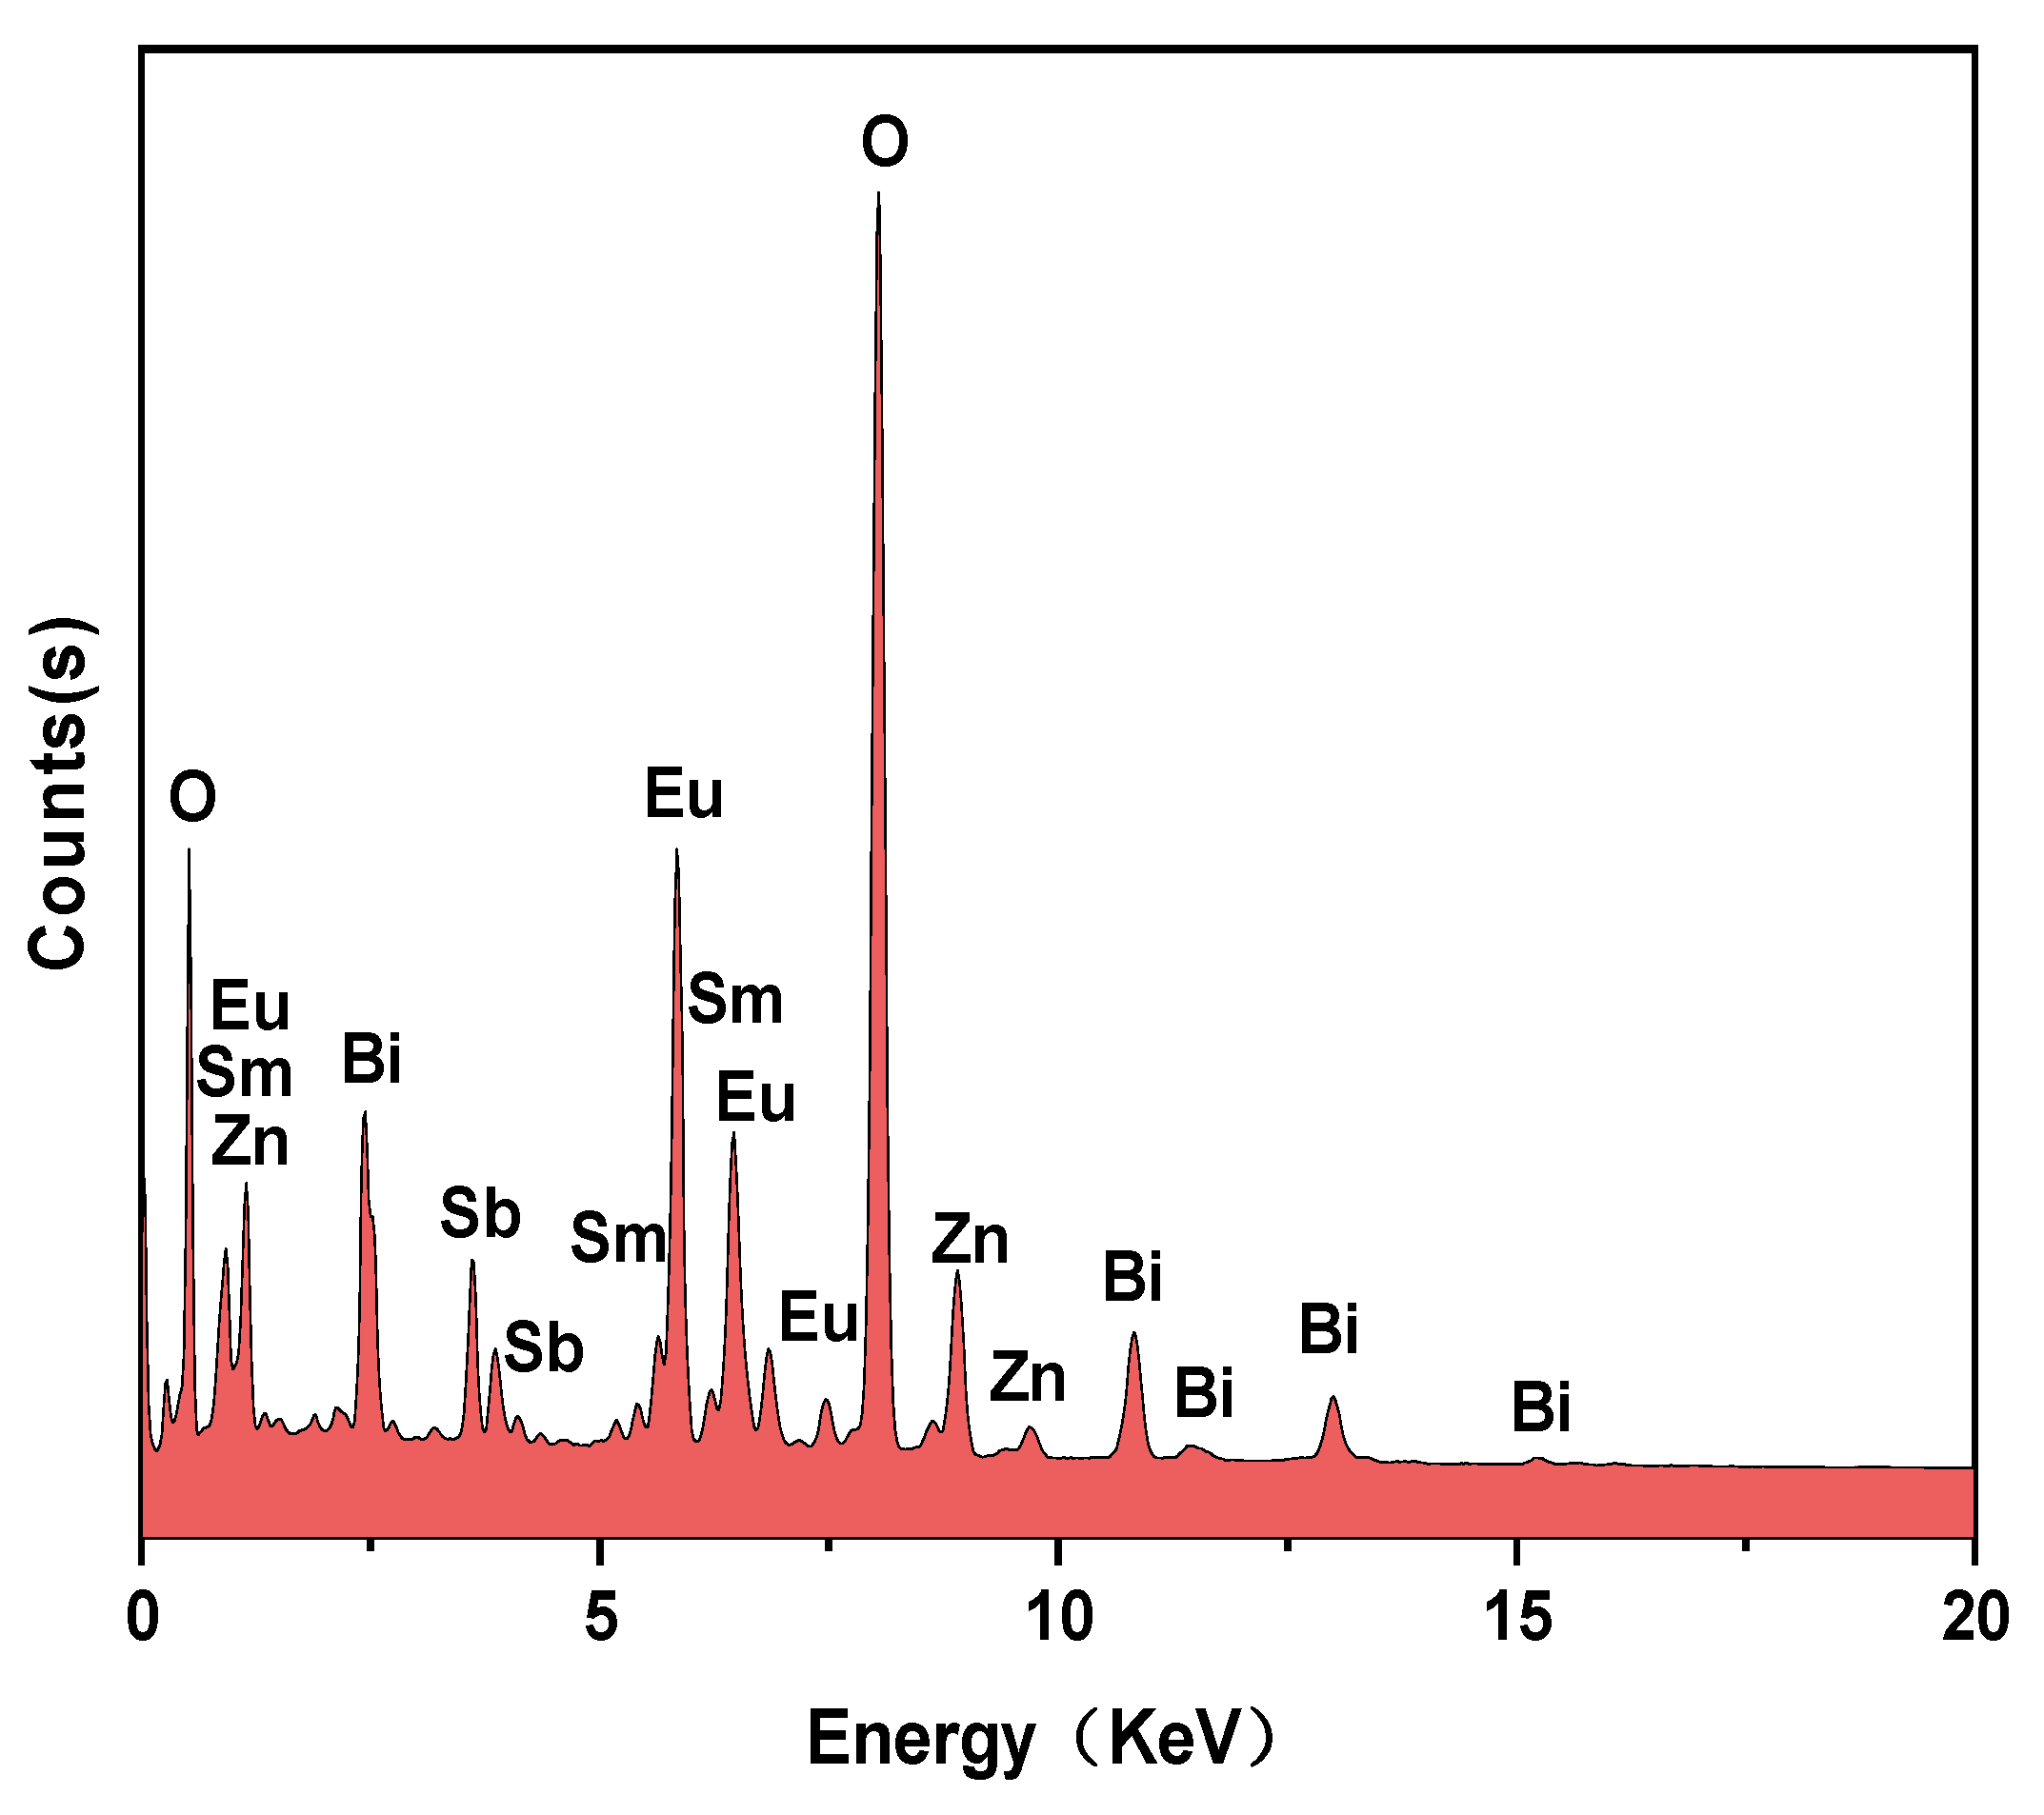
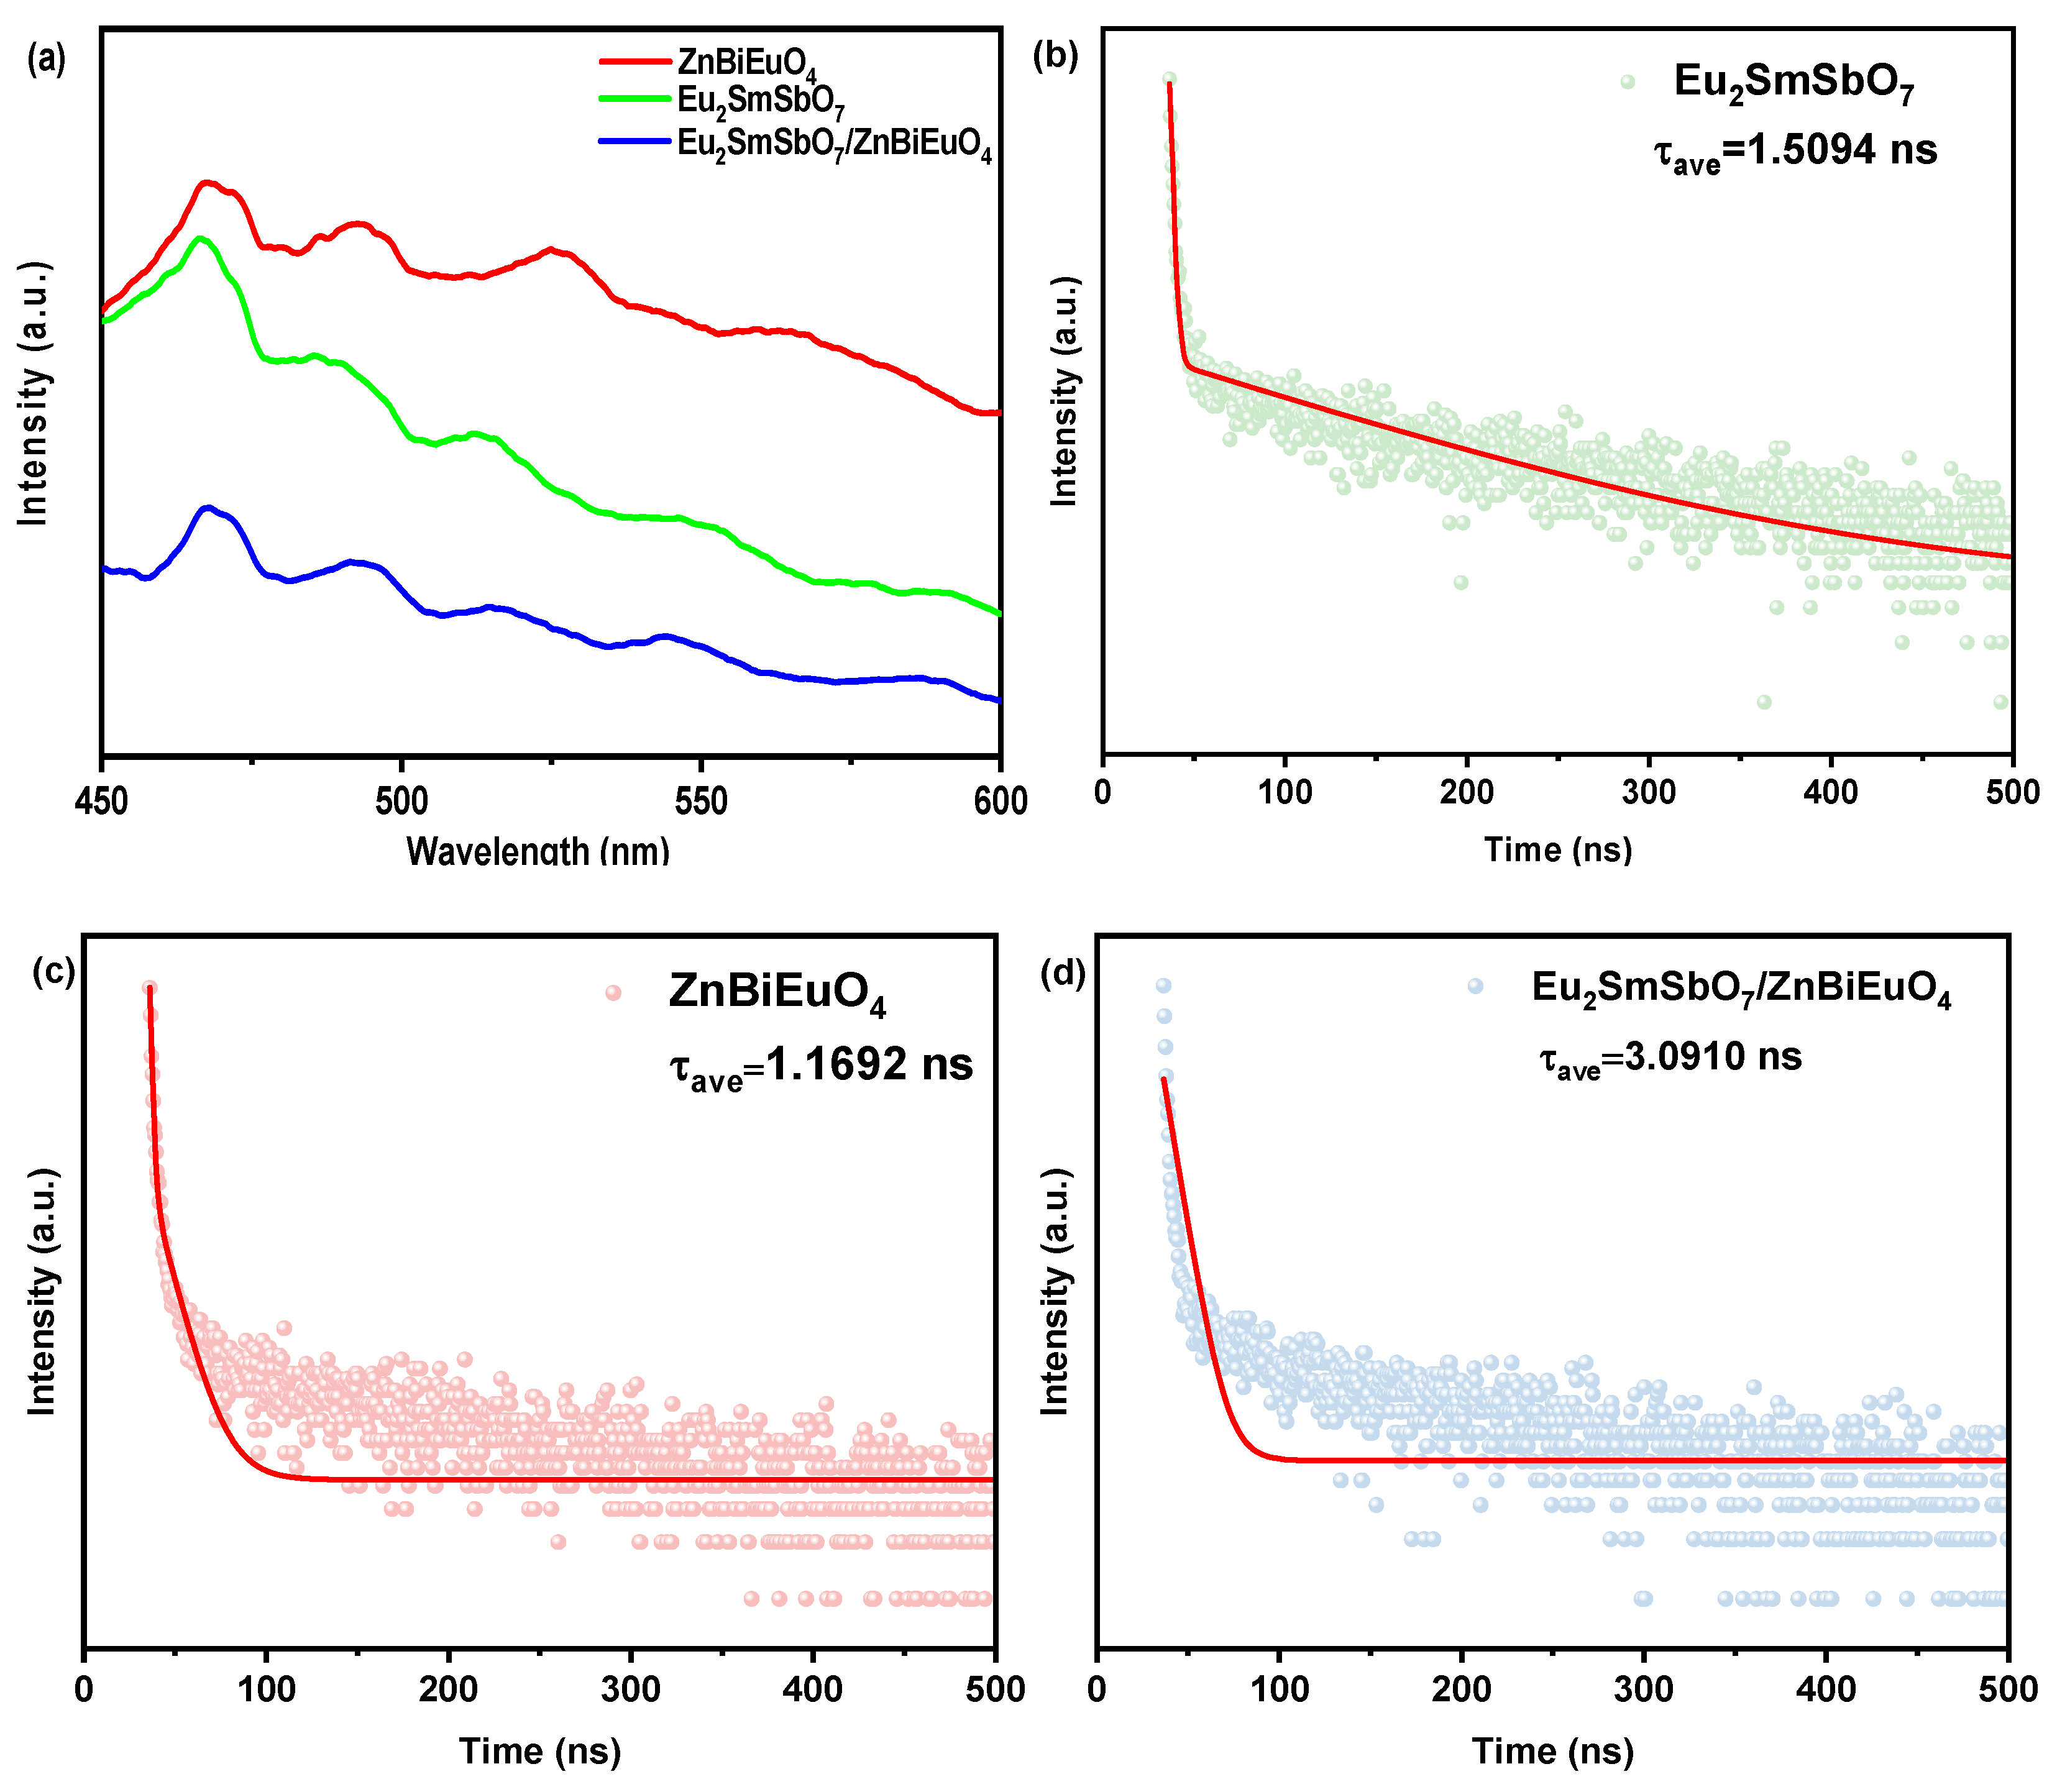
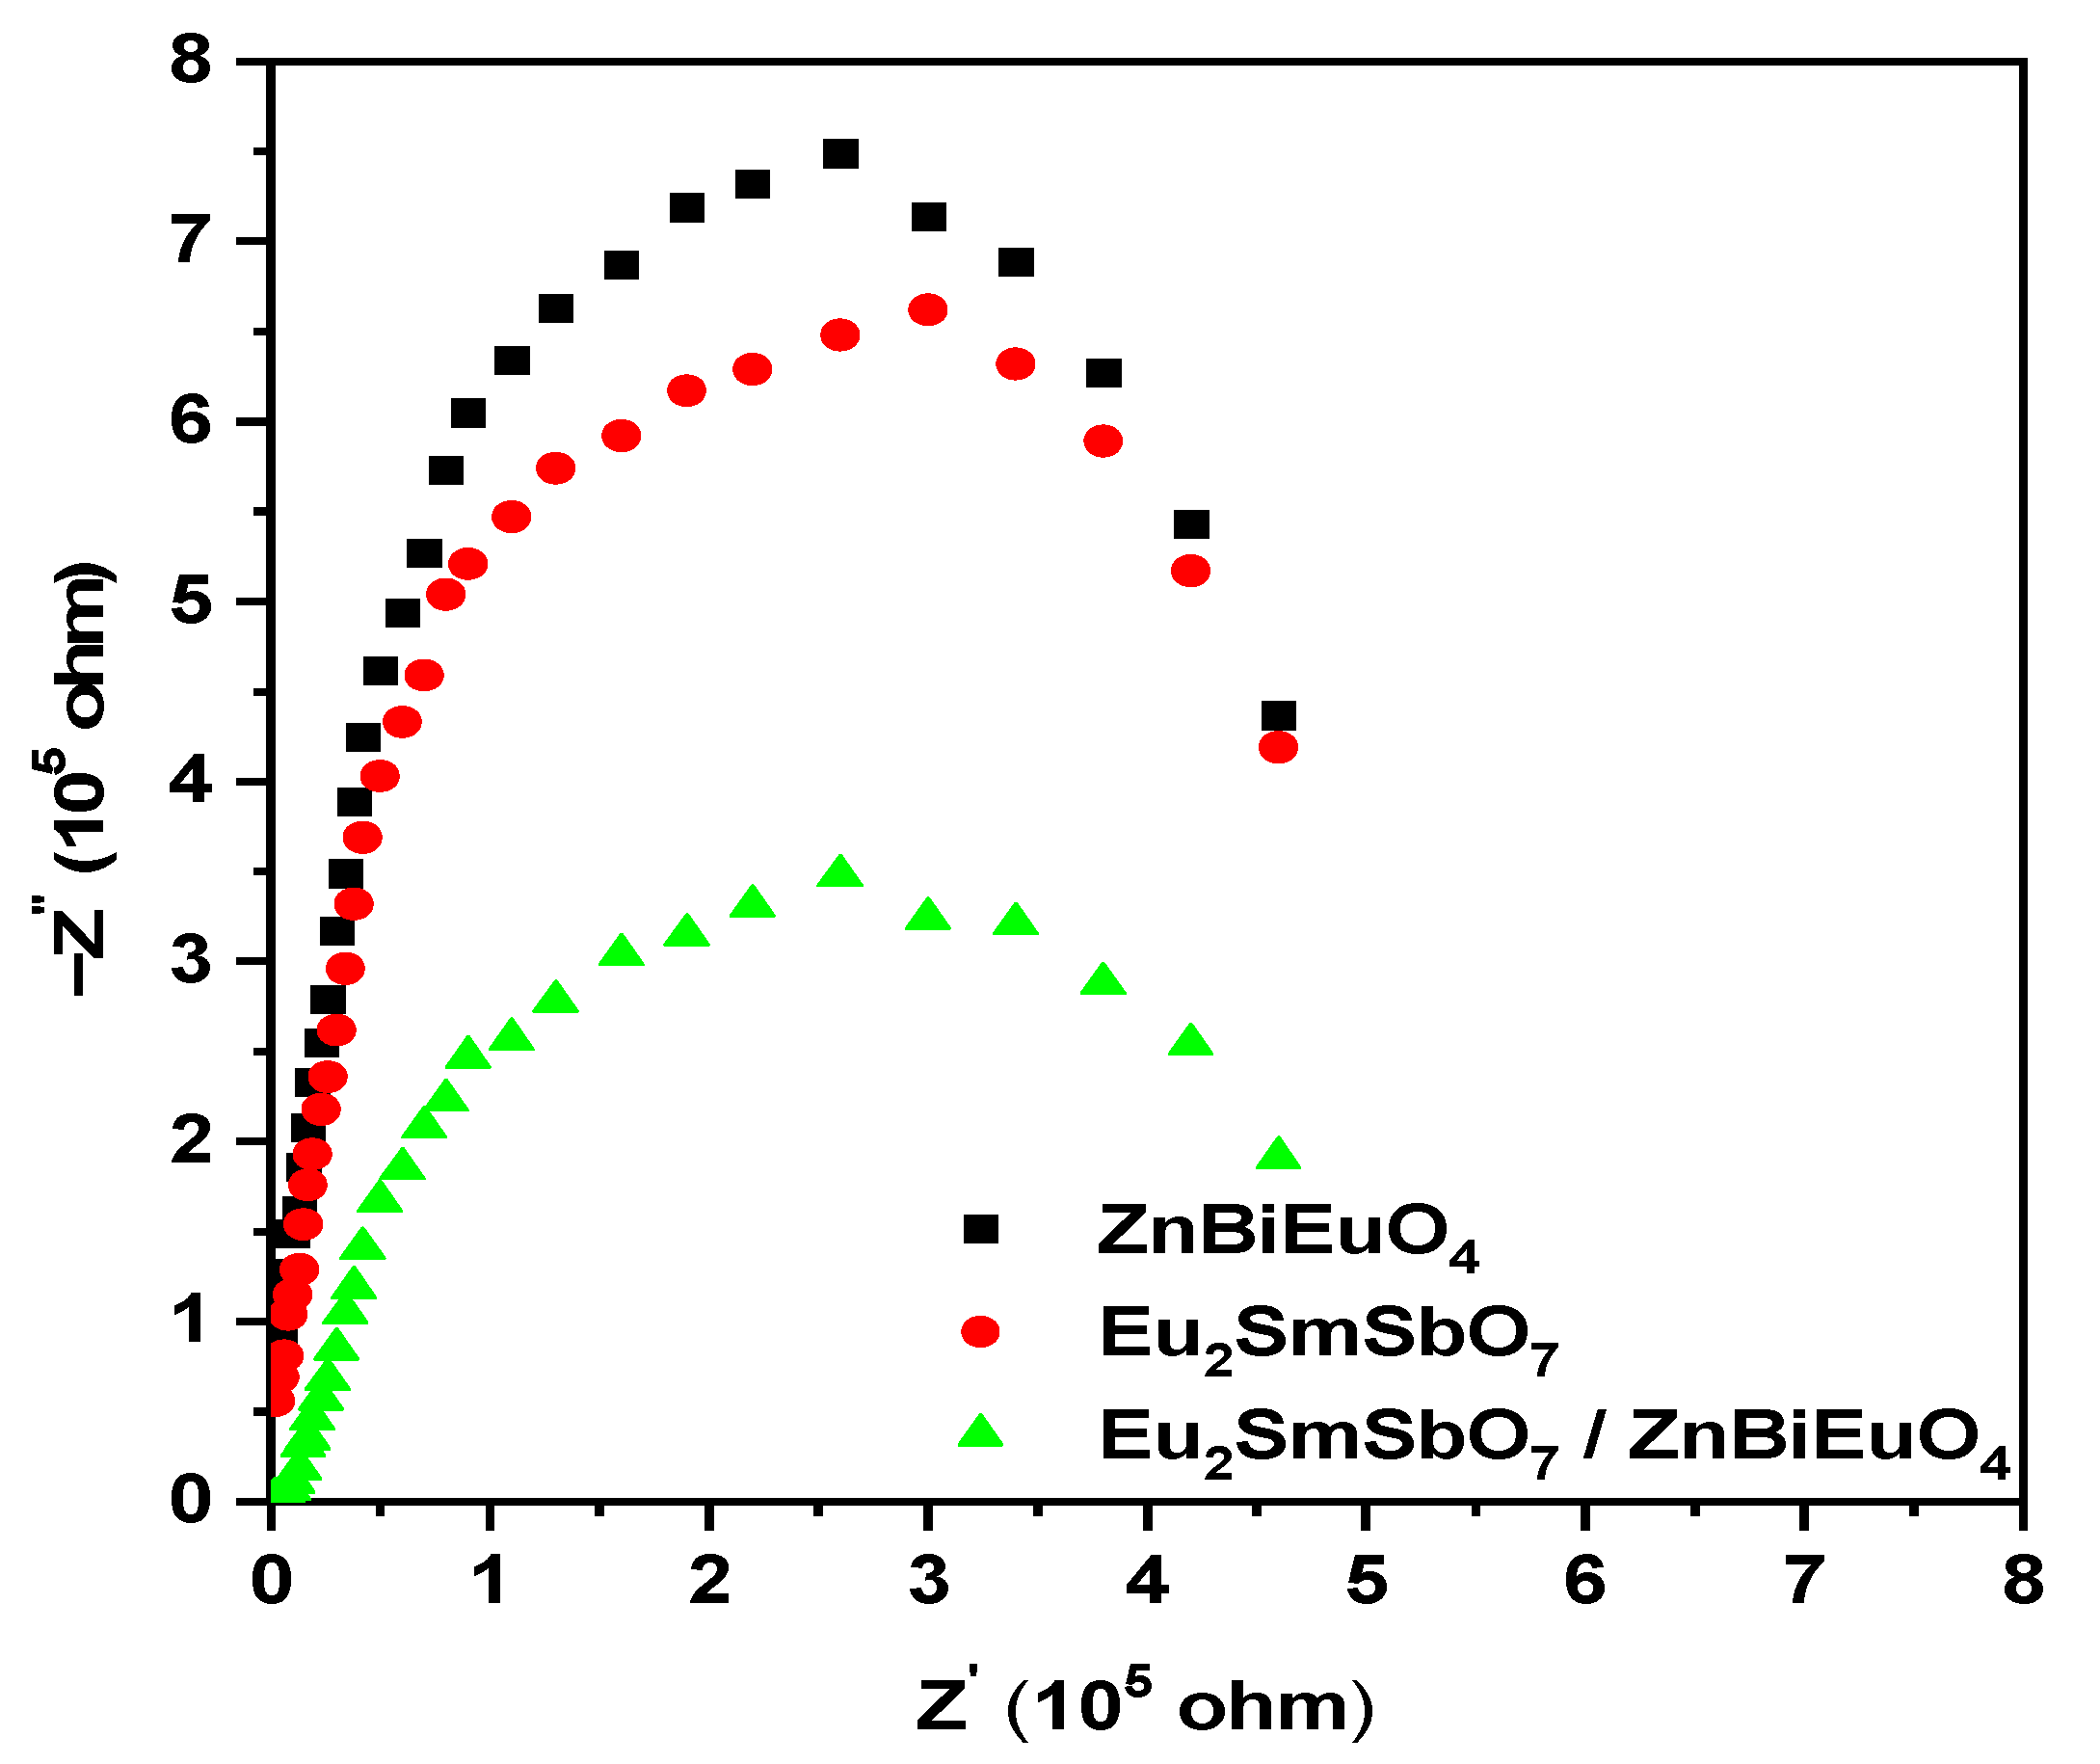
2.6. Property Characterization of Eu2SmSbO7/ZnBiEuO4 Heterojunction Photocatalyst
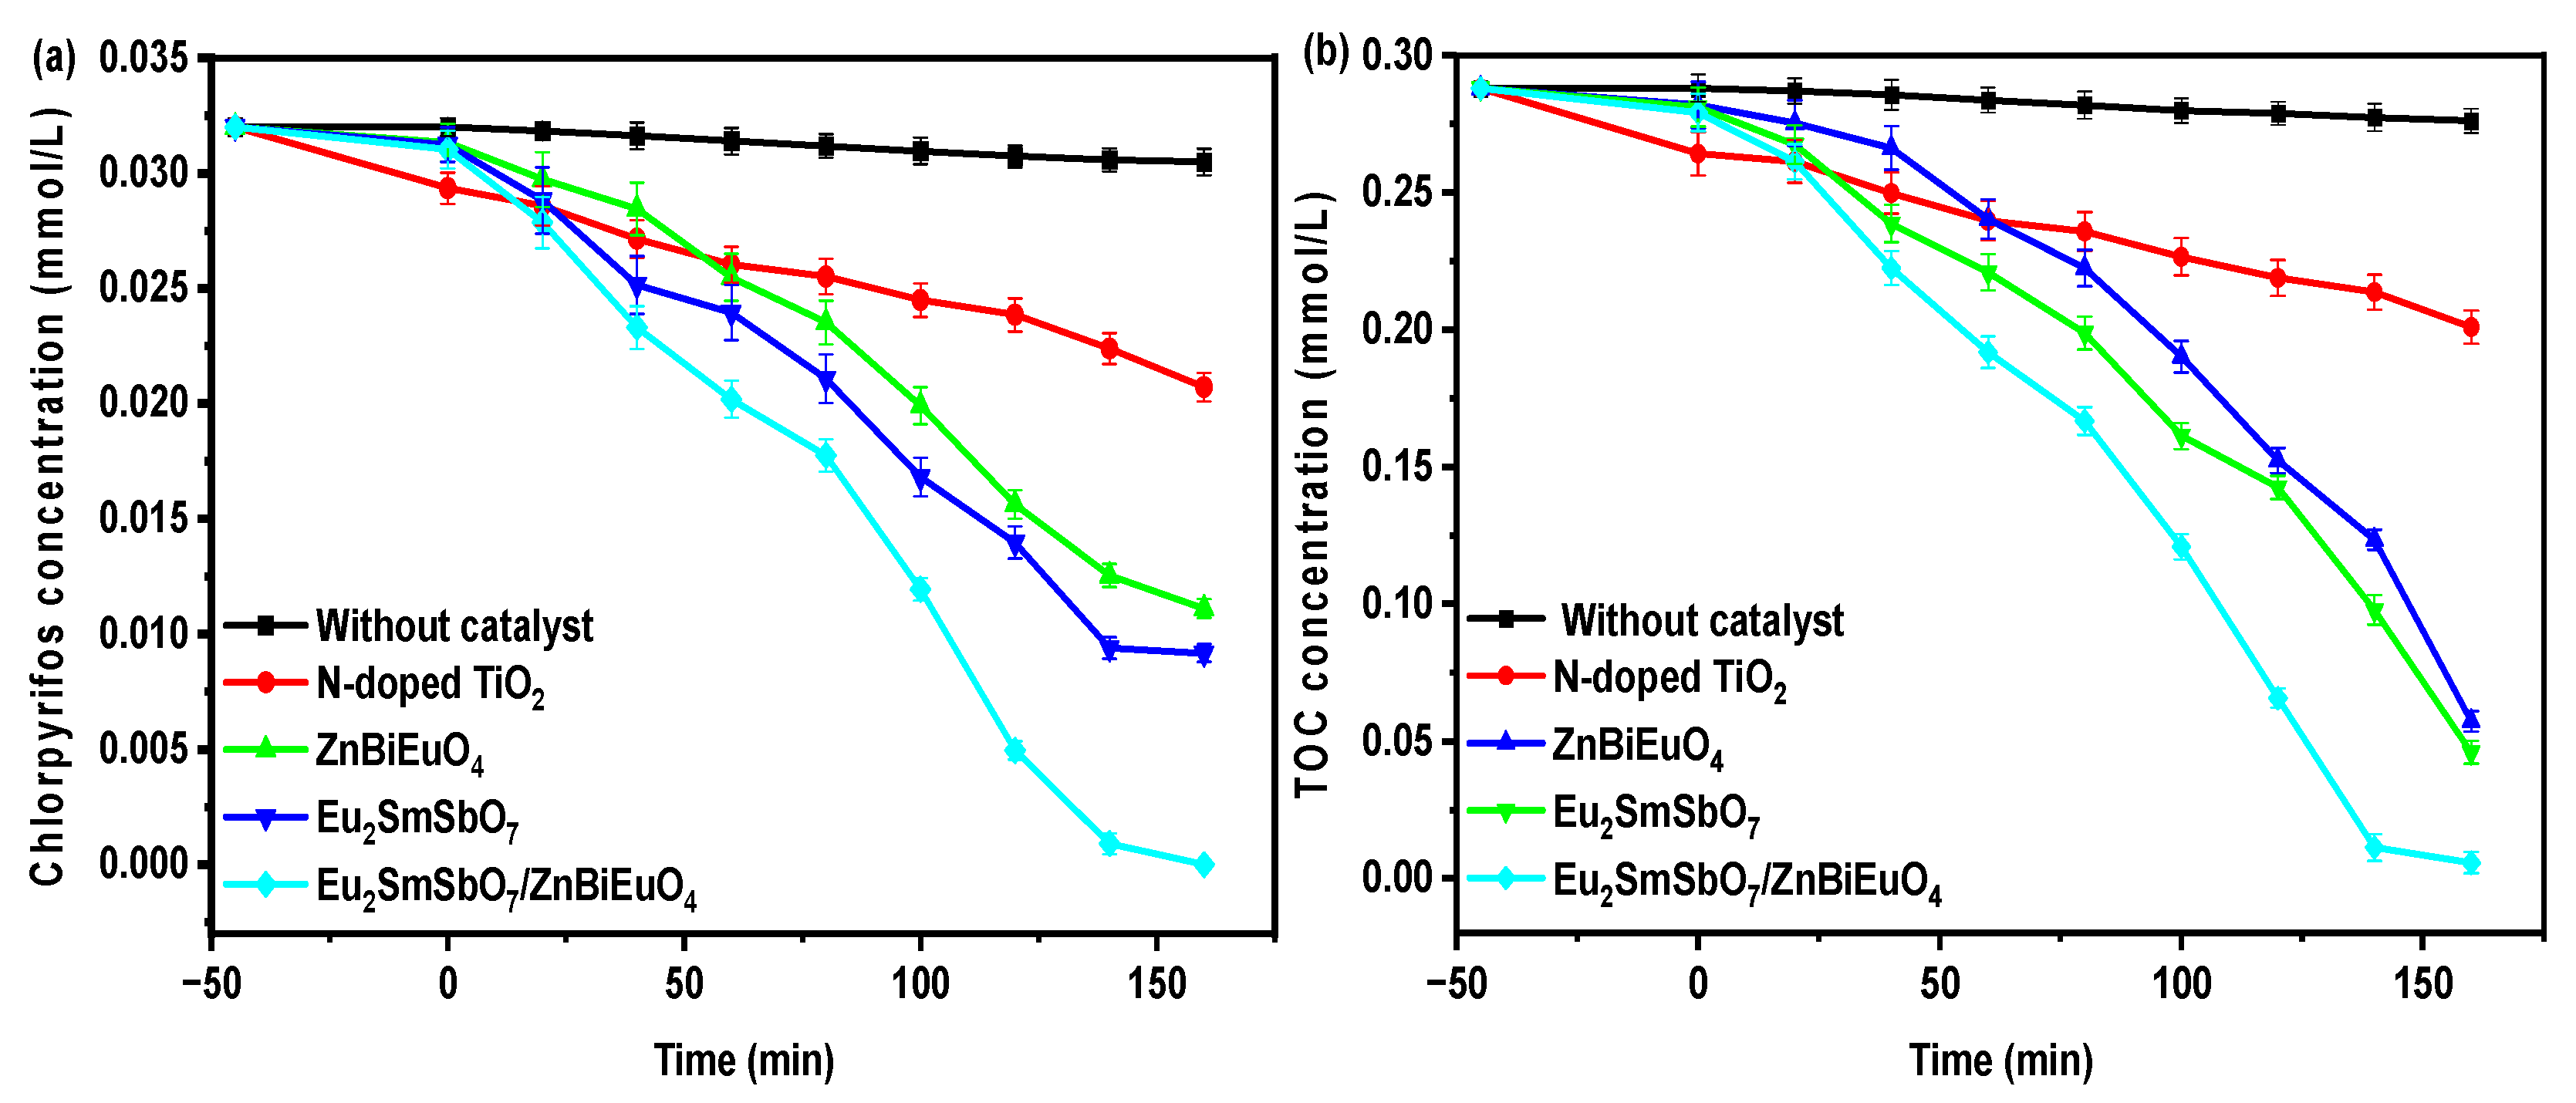
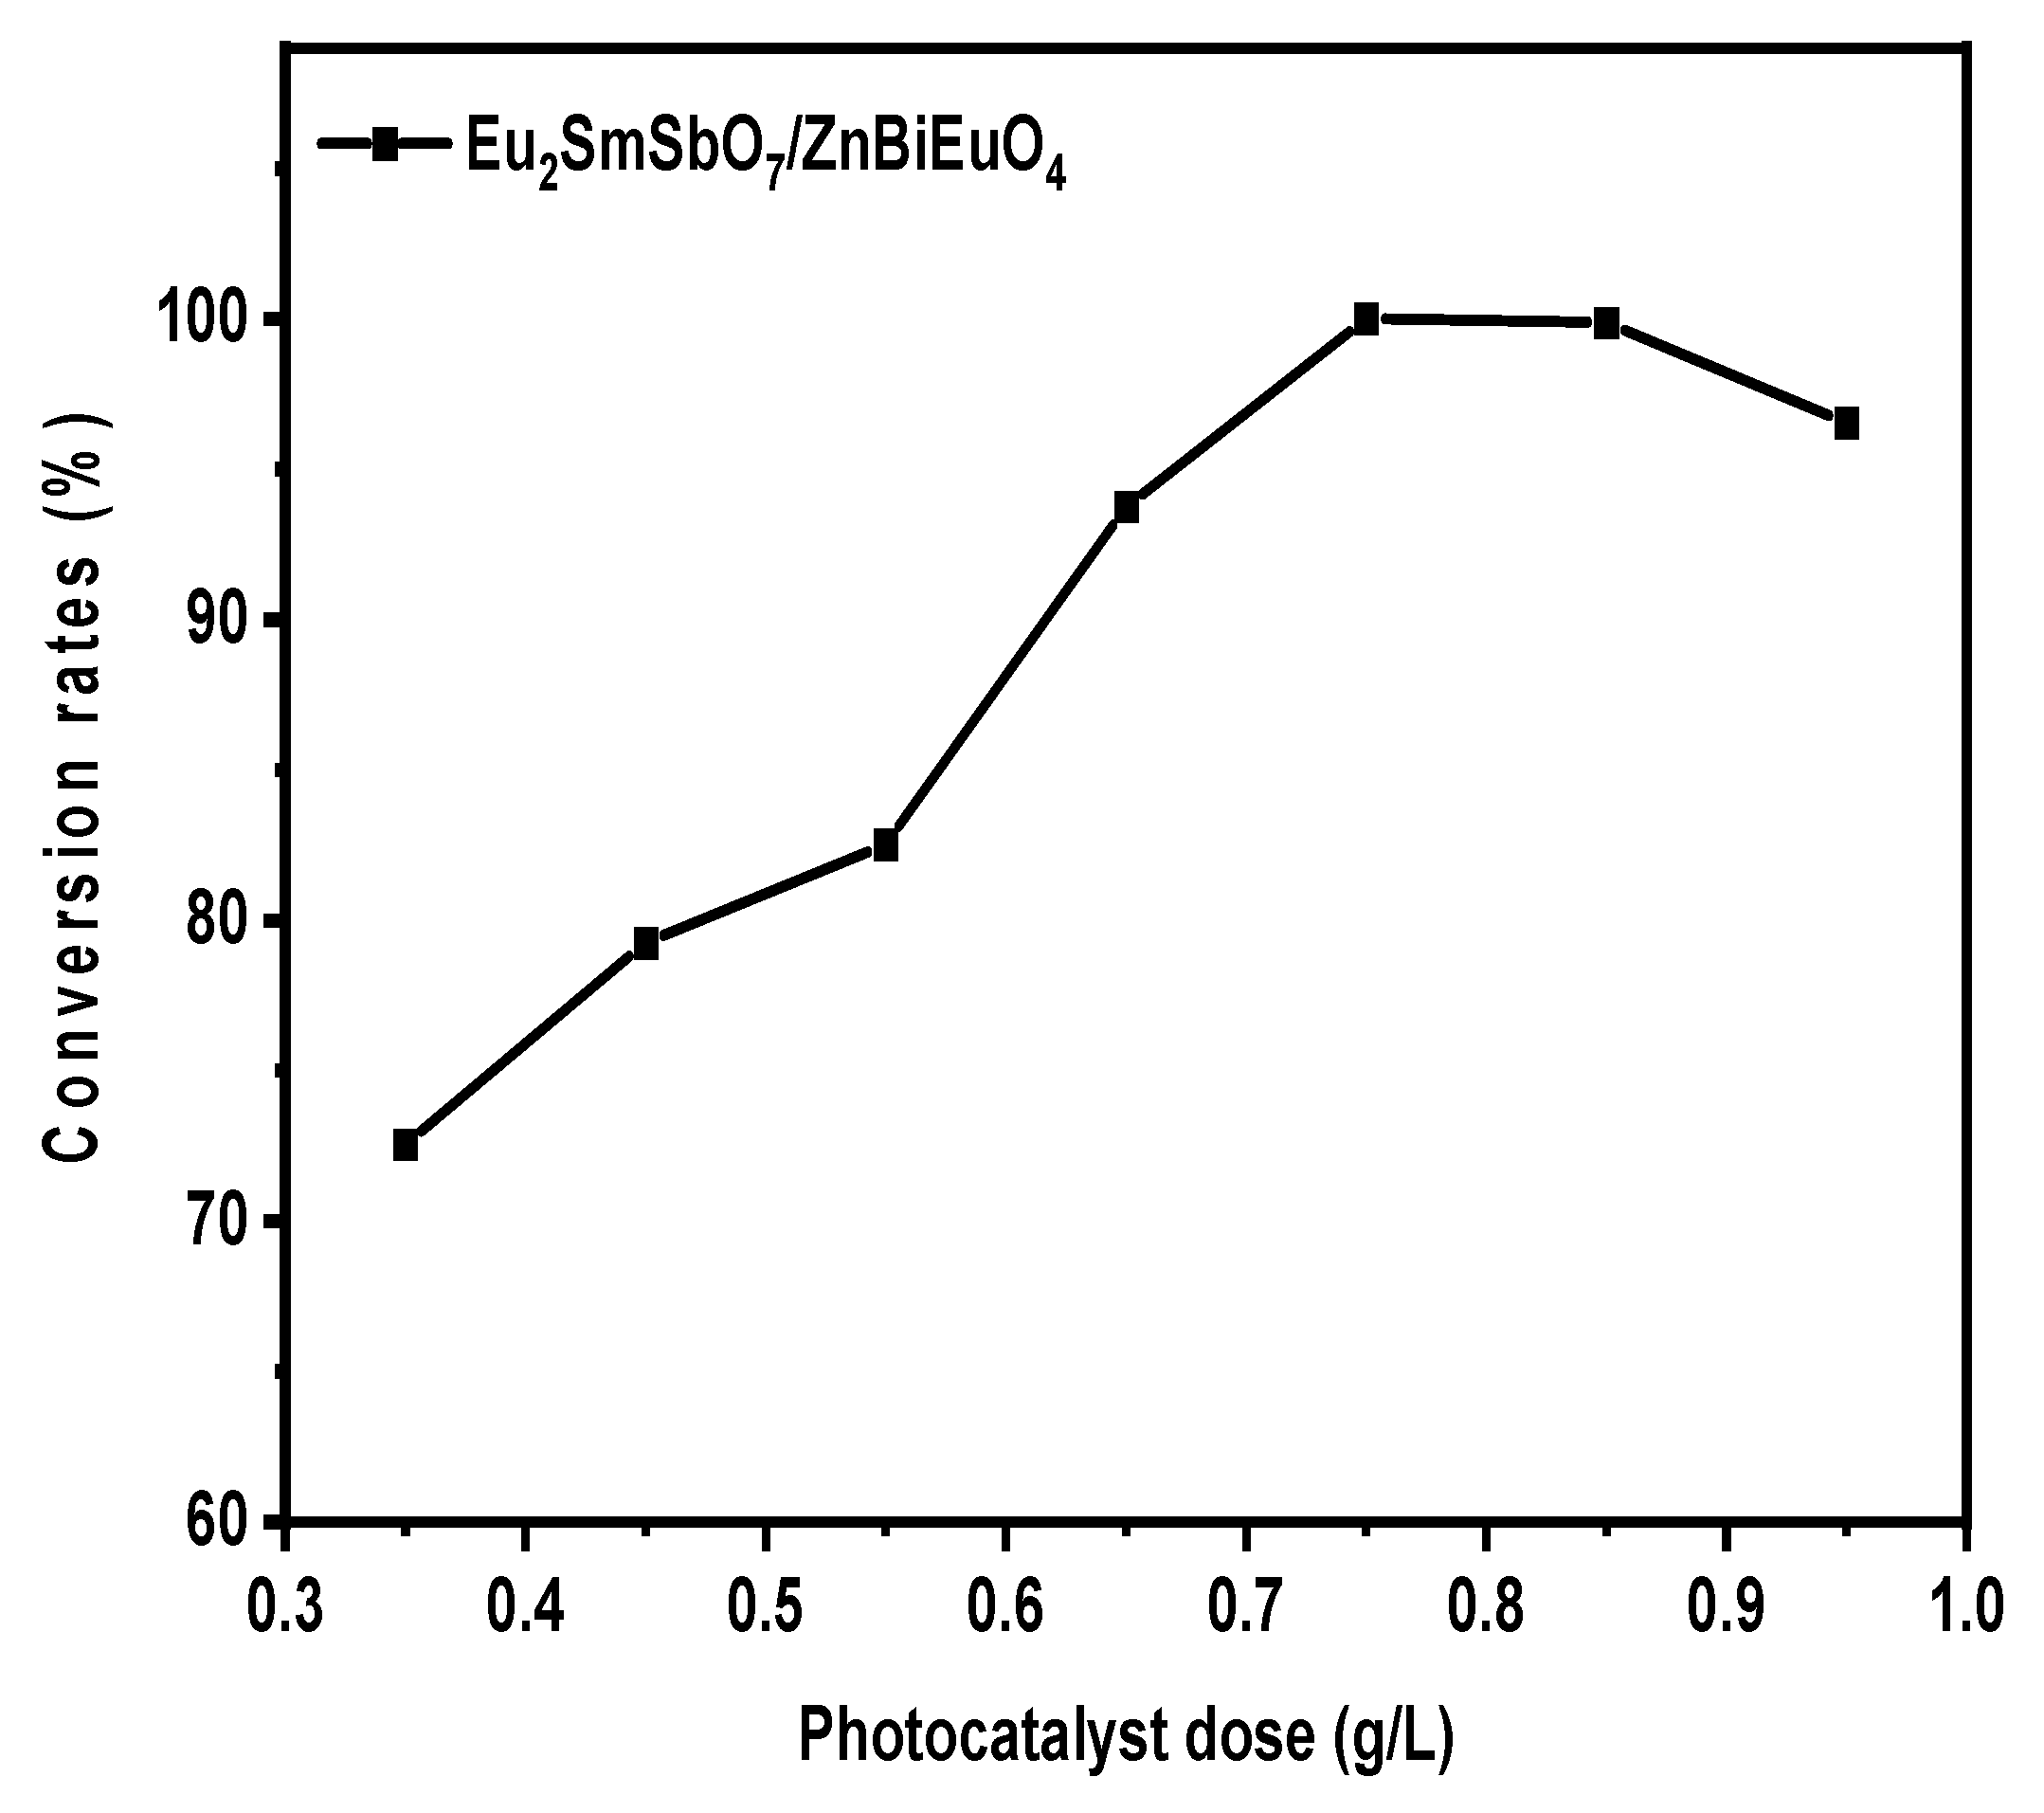
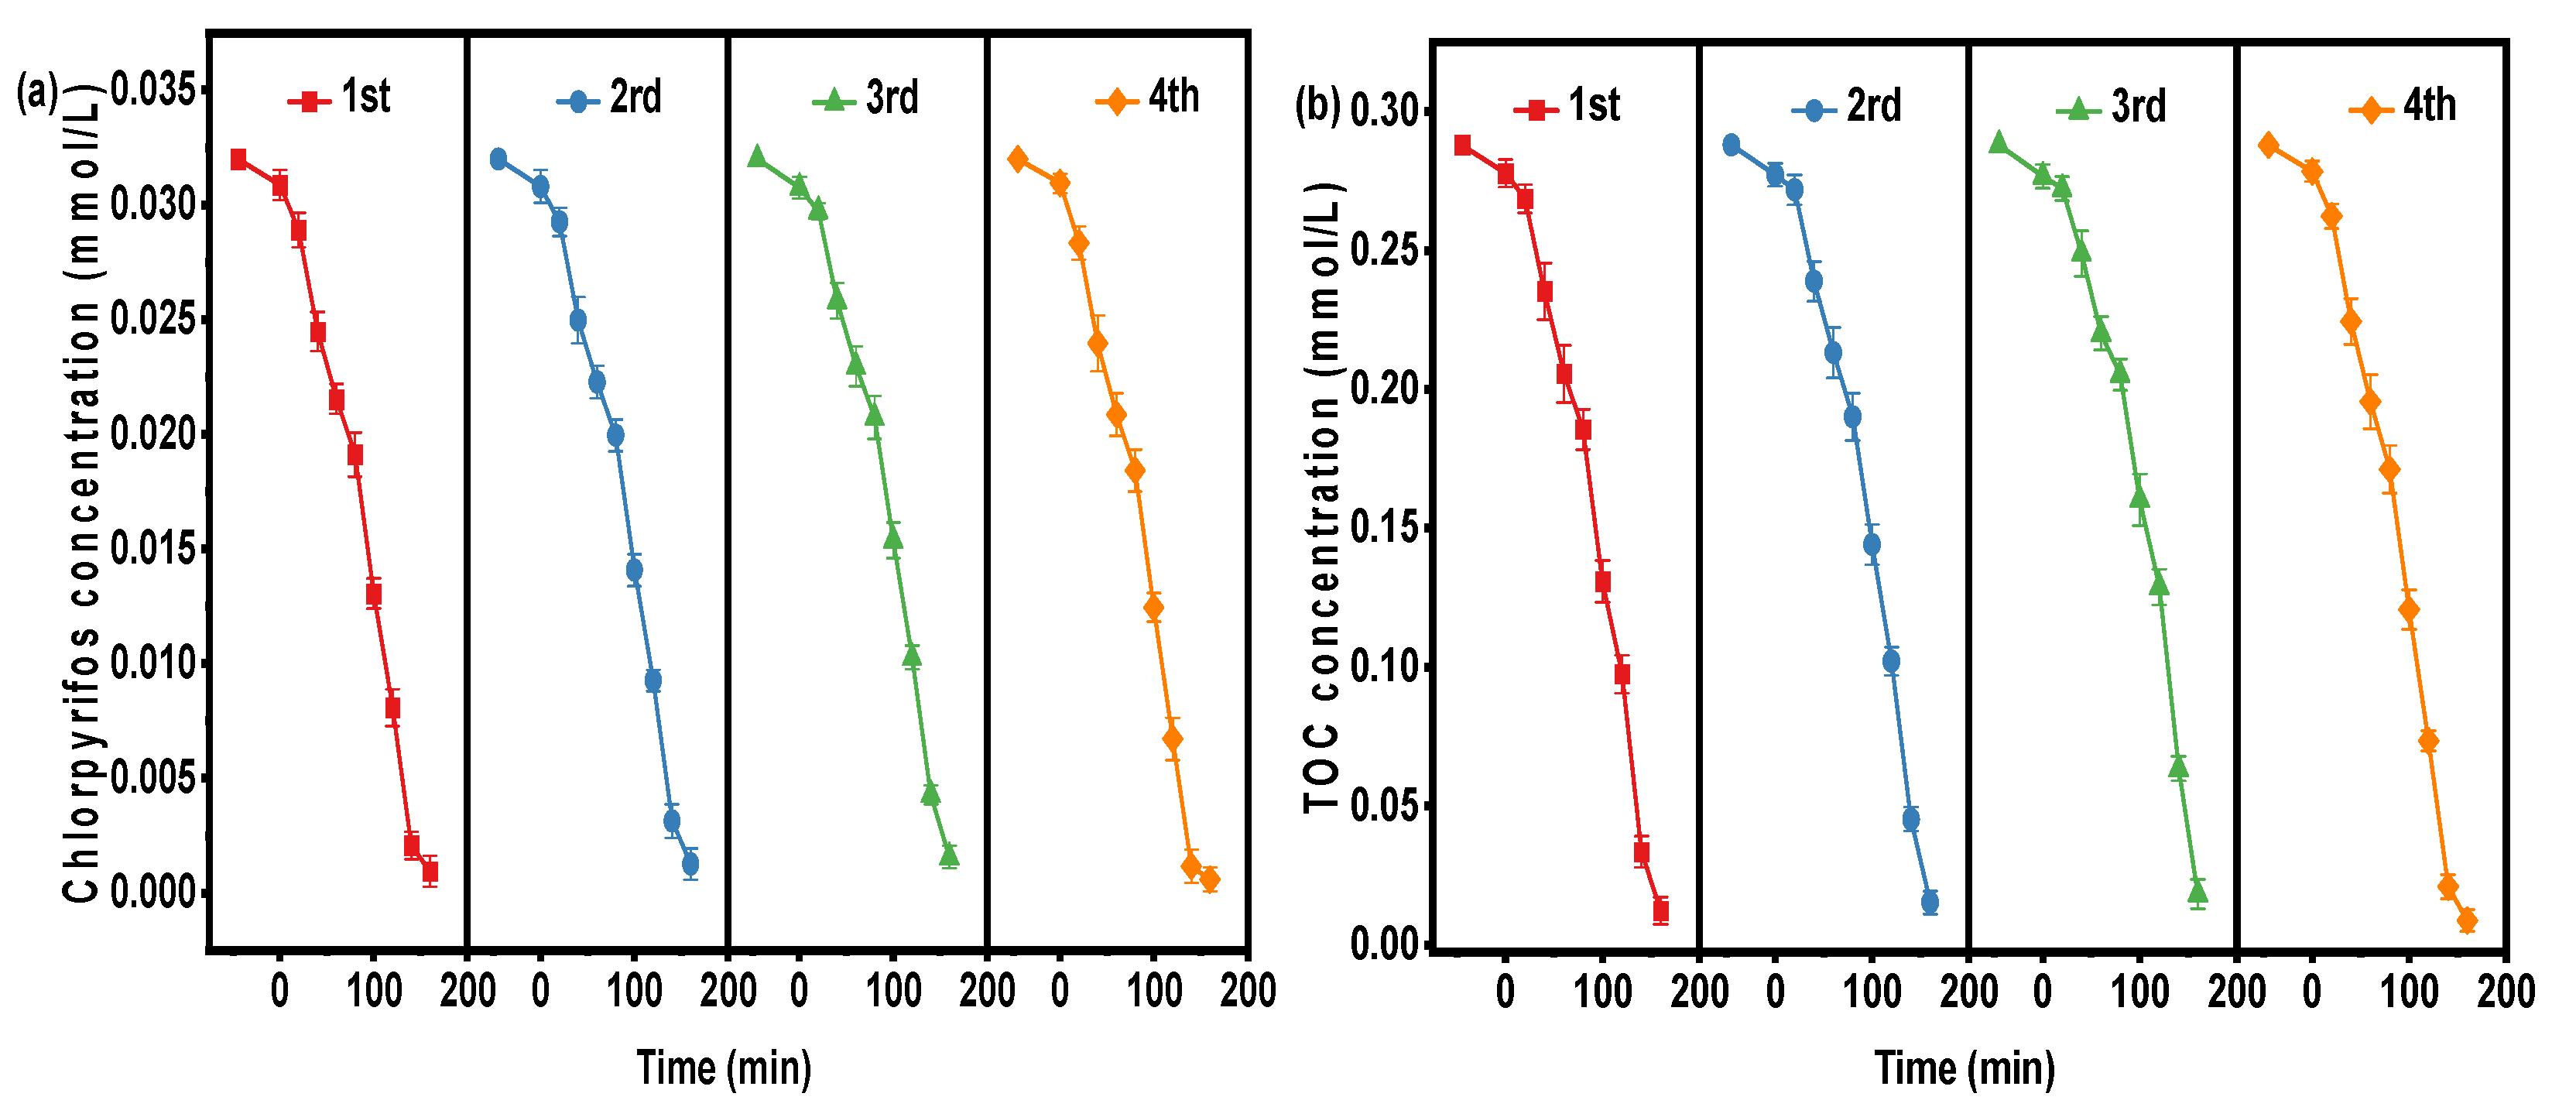
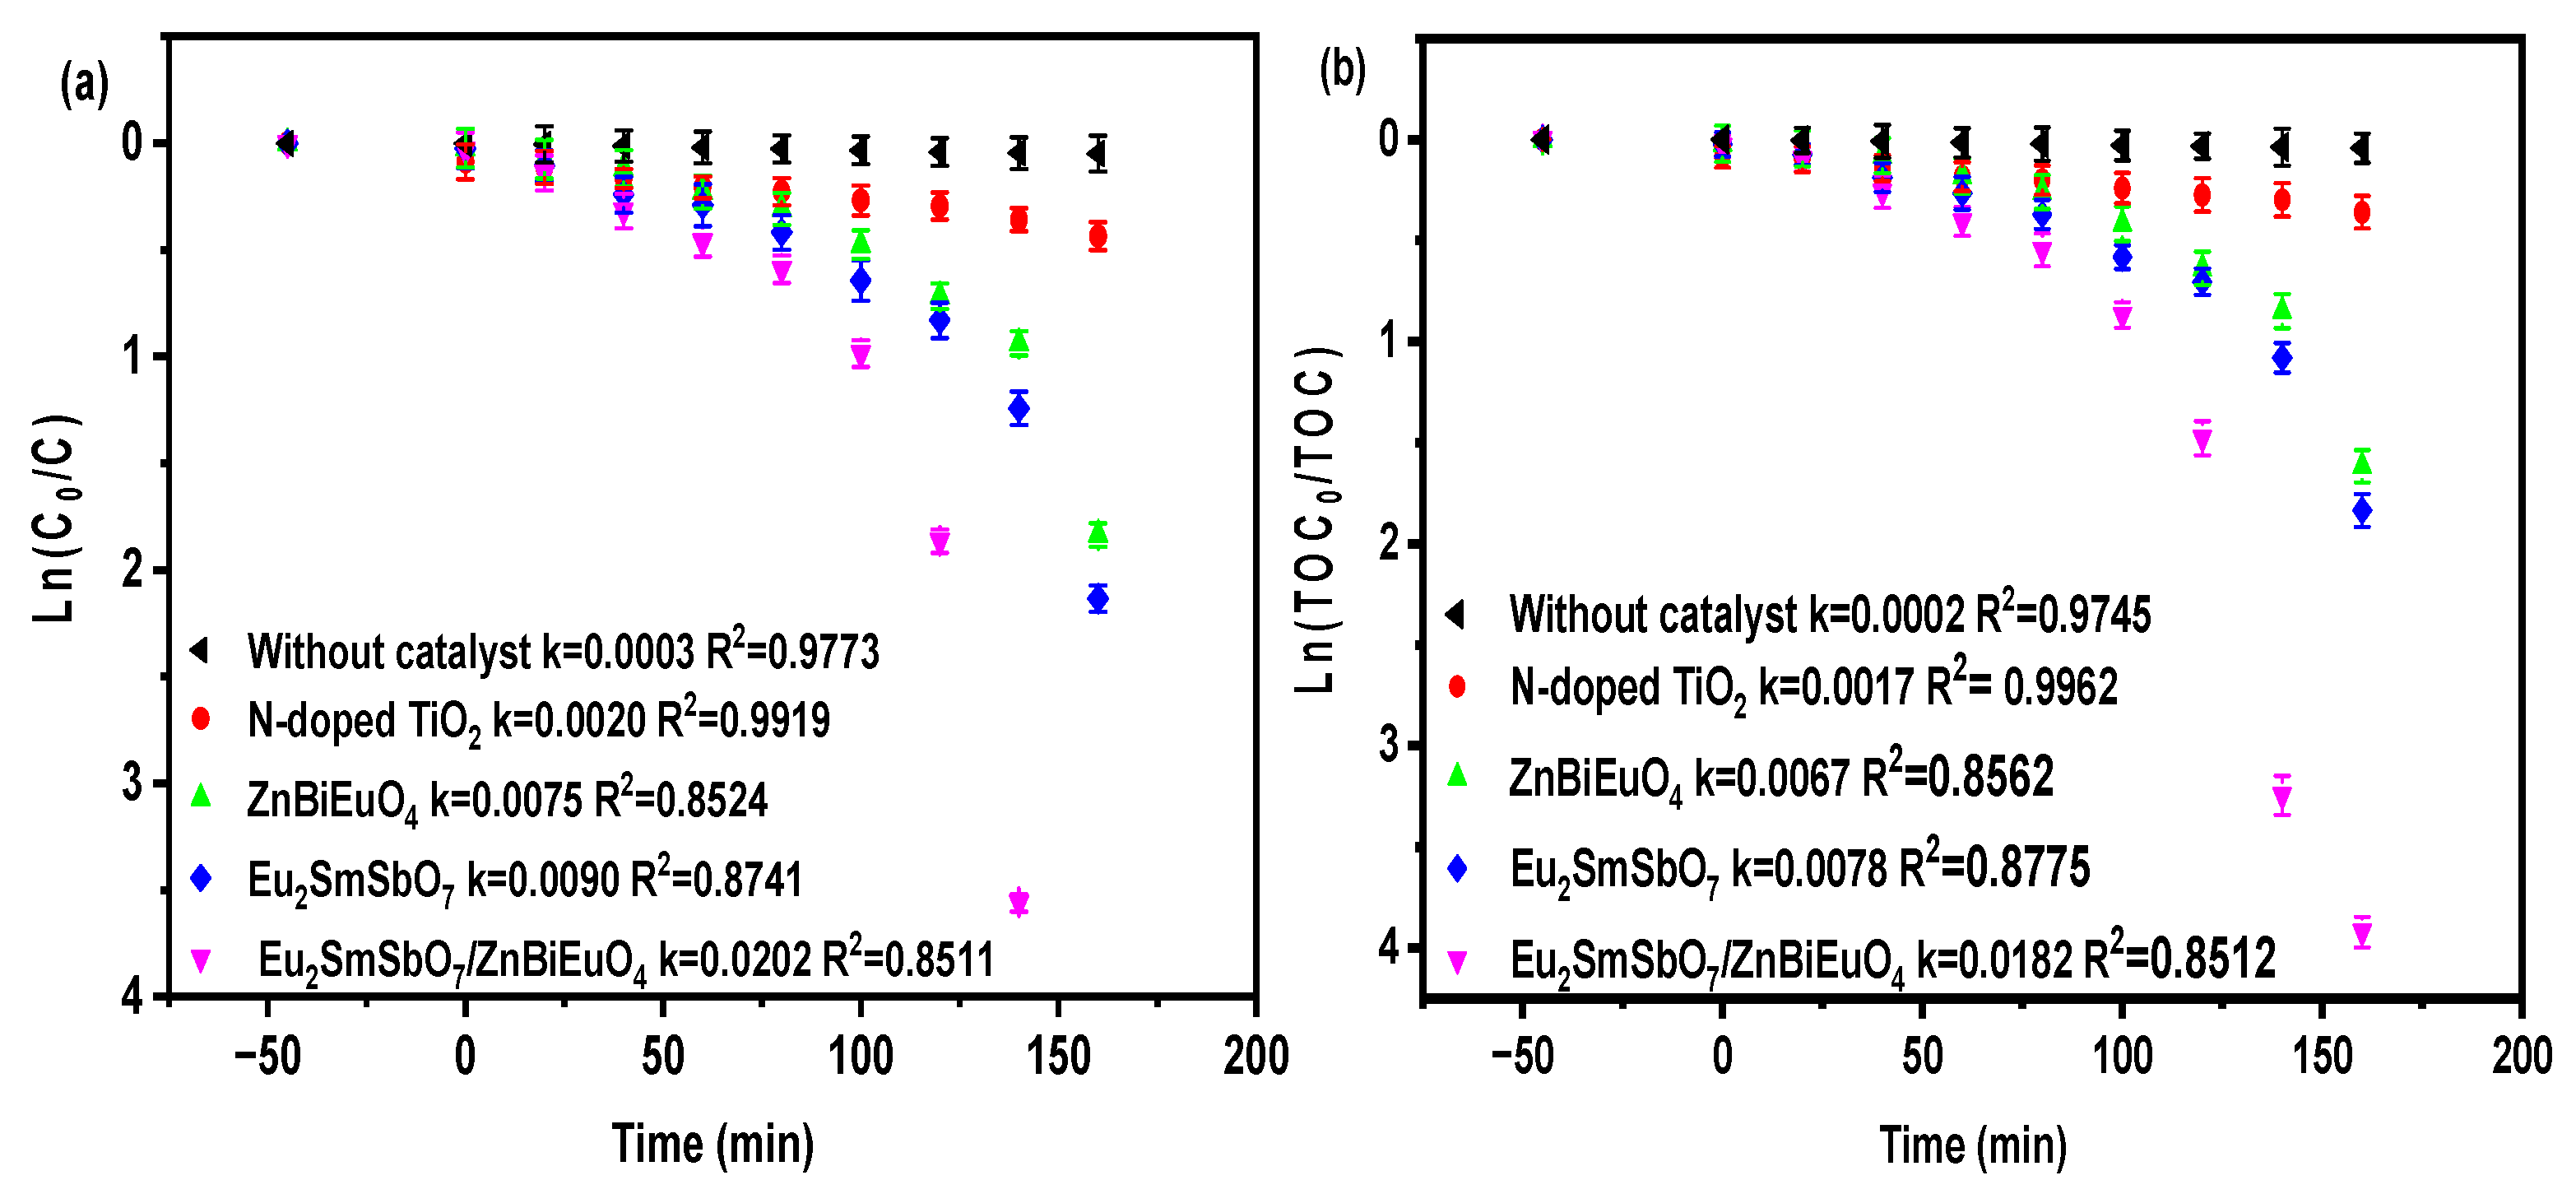
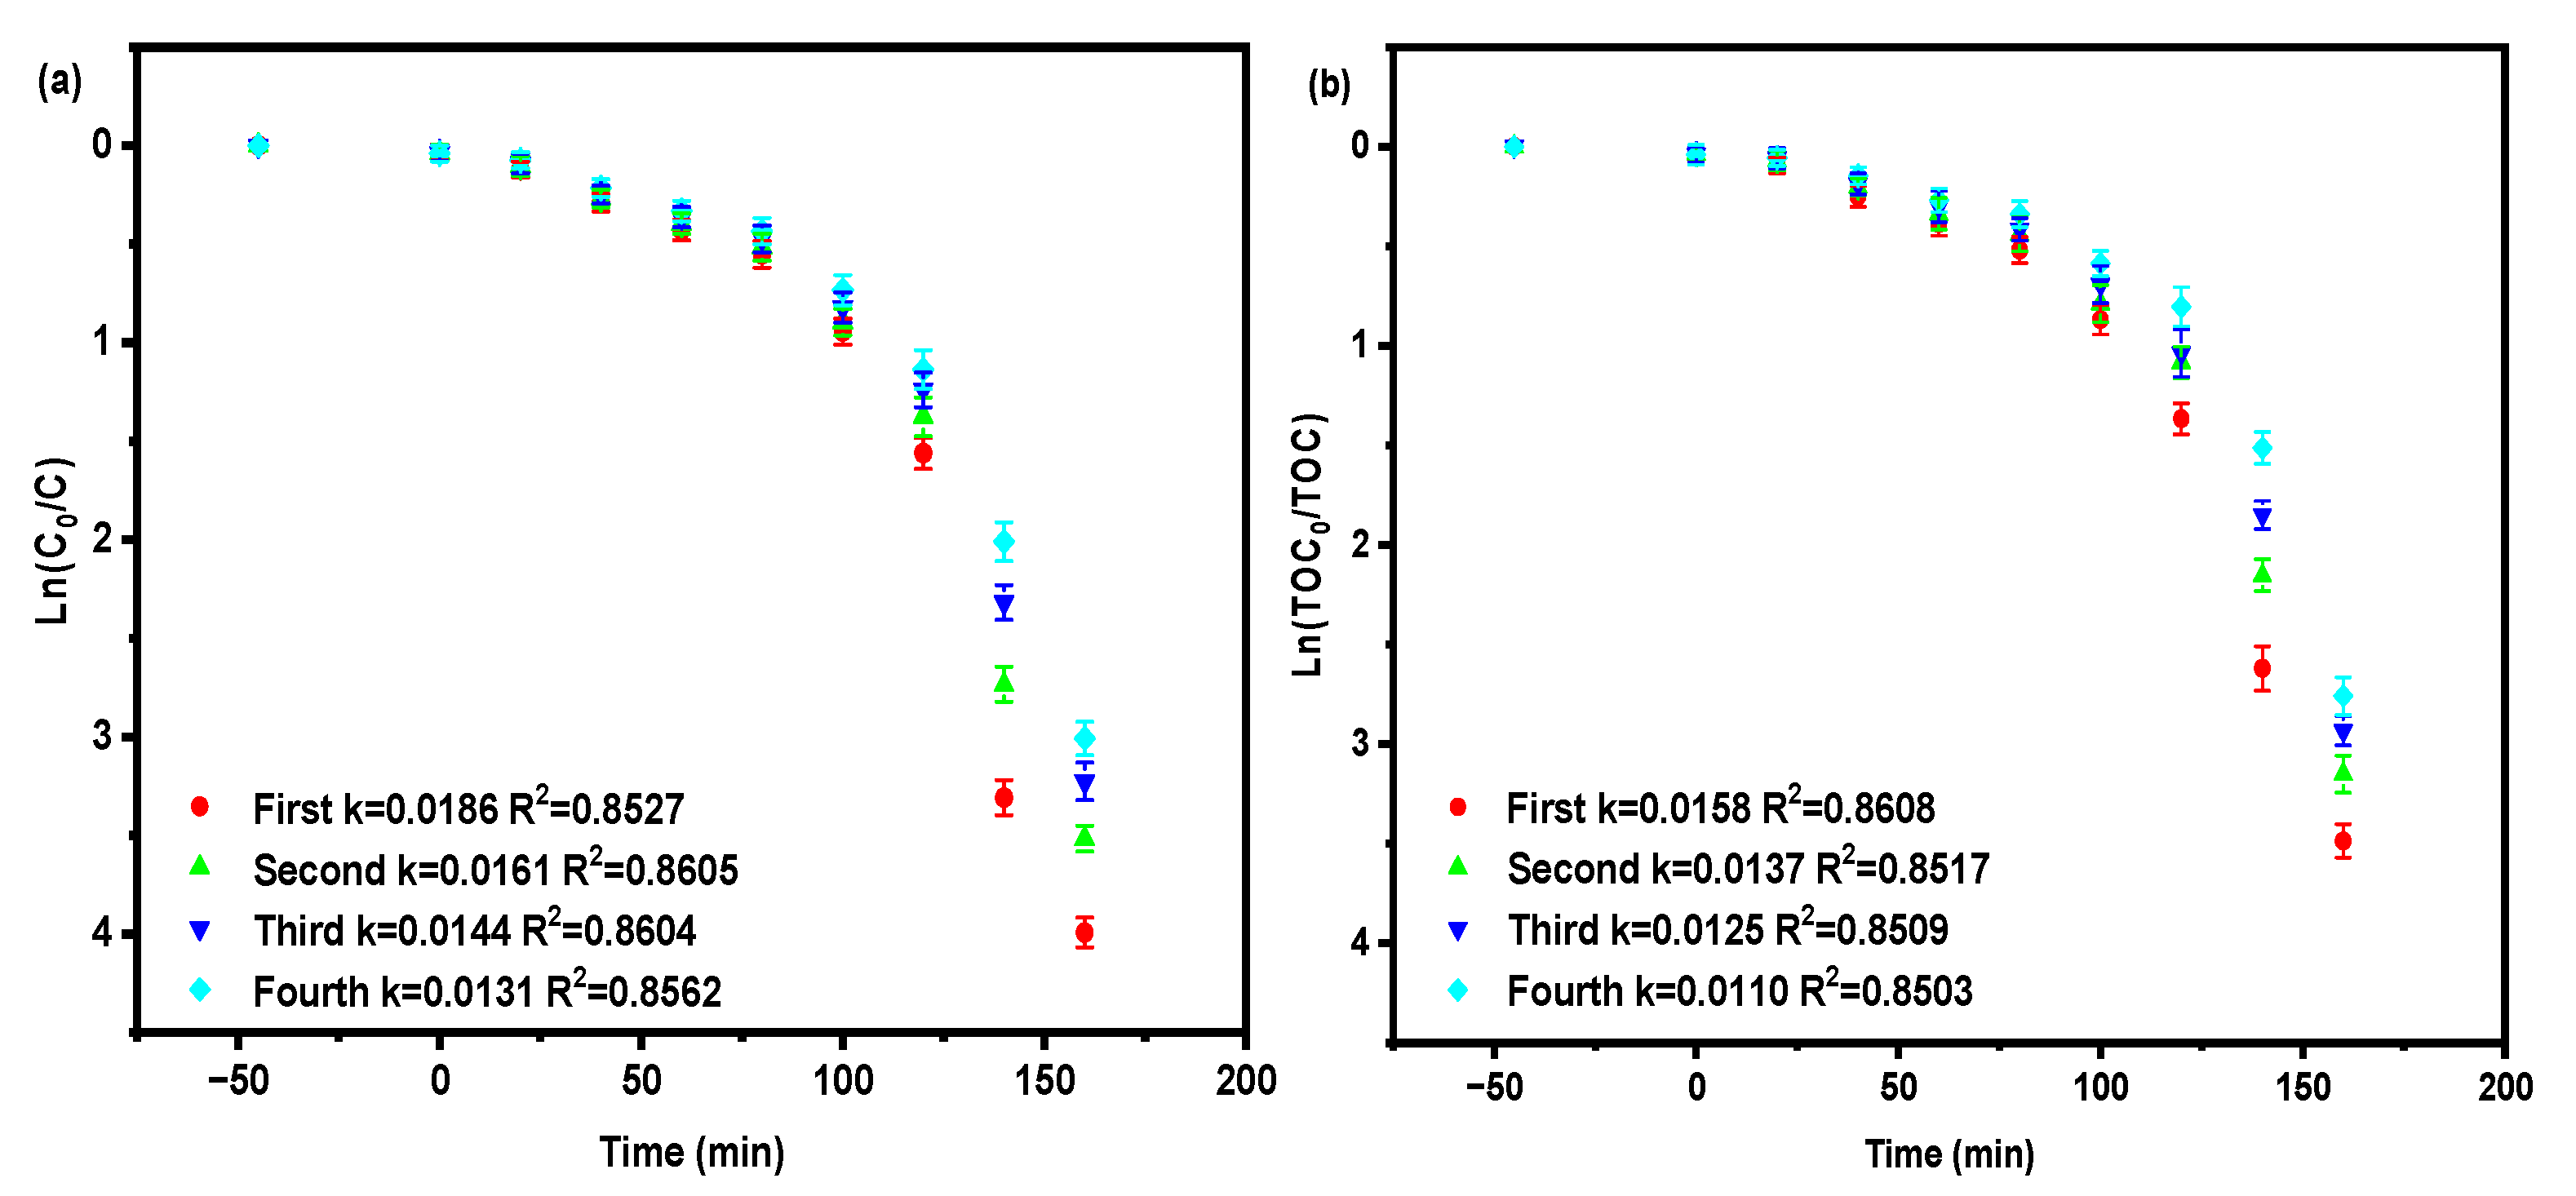
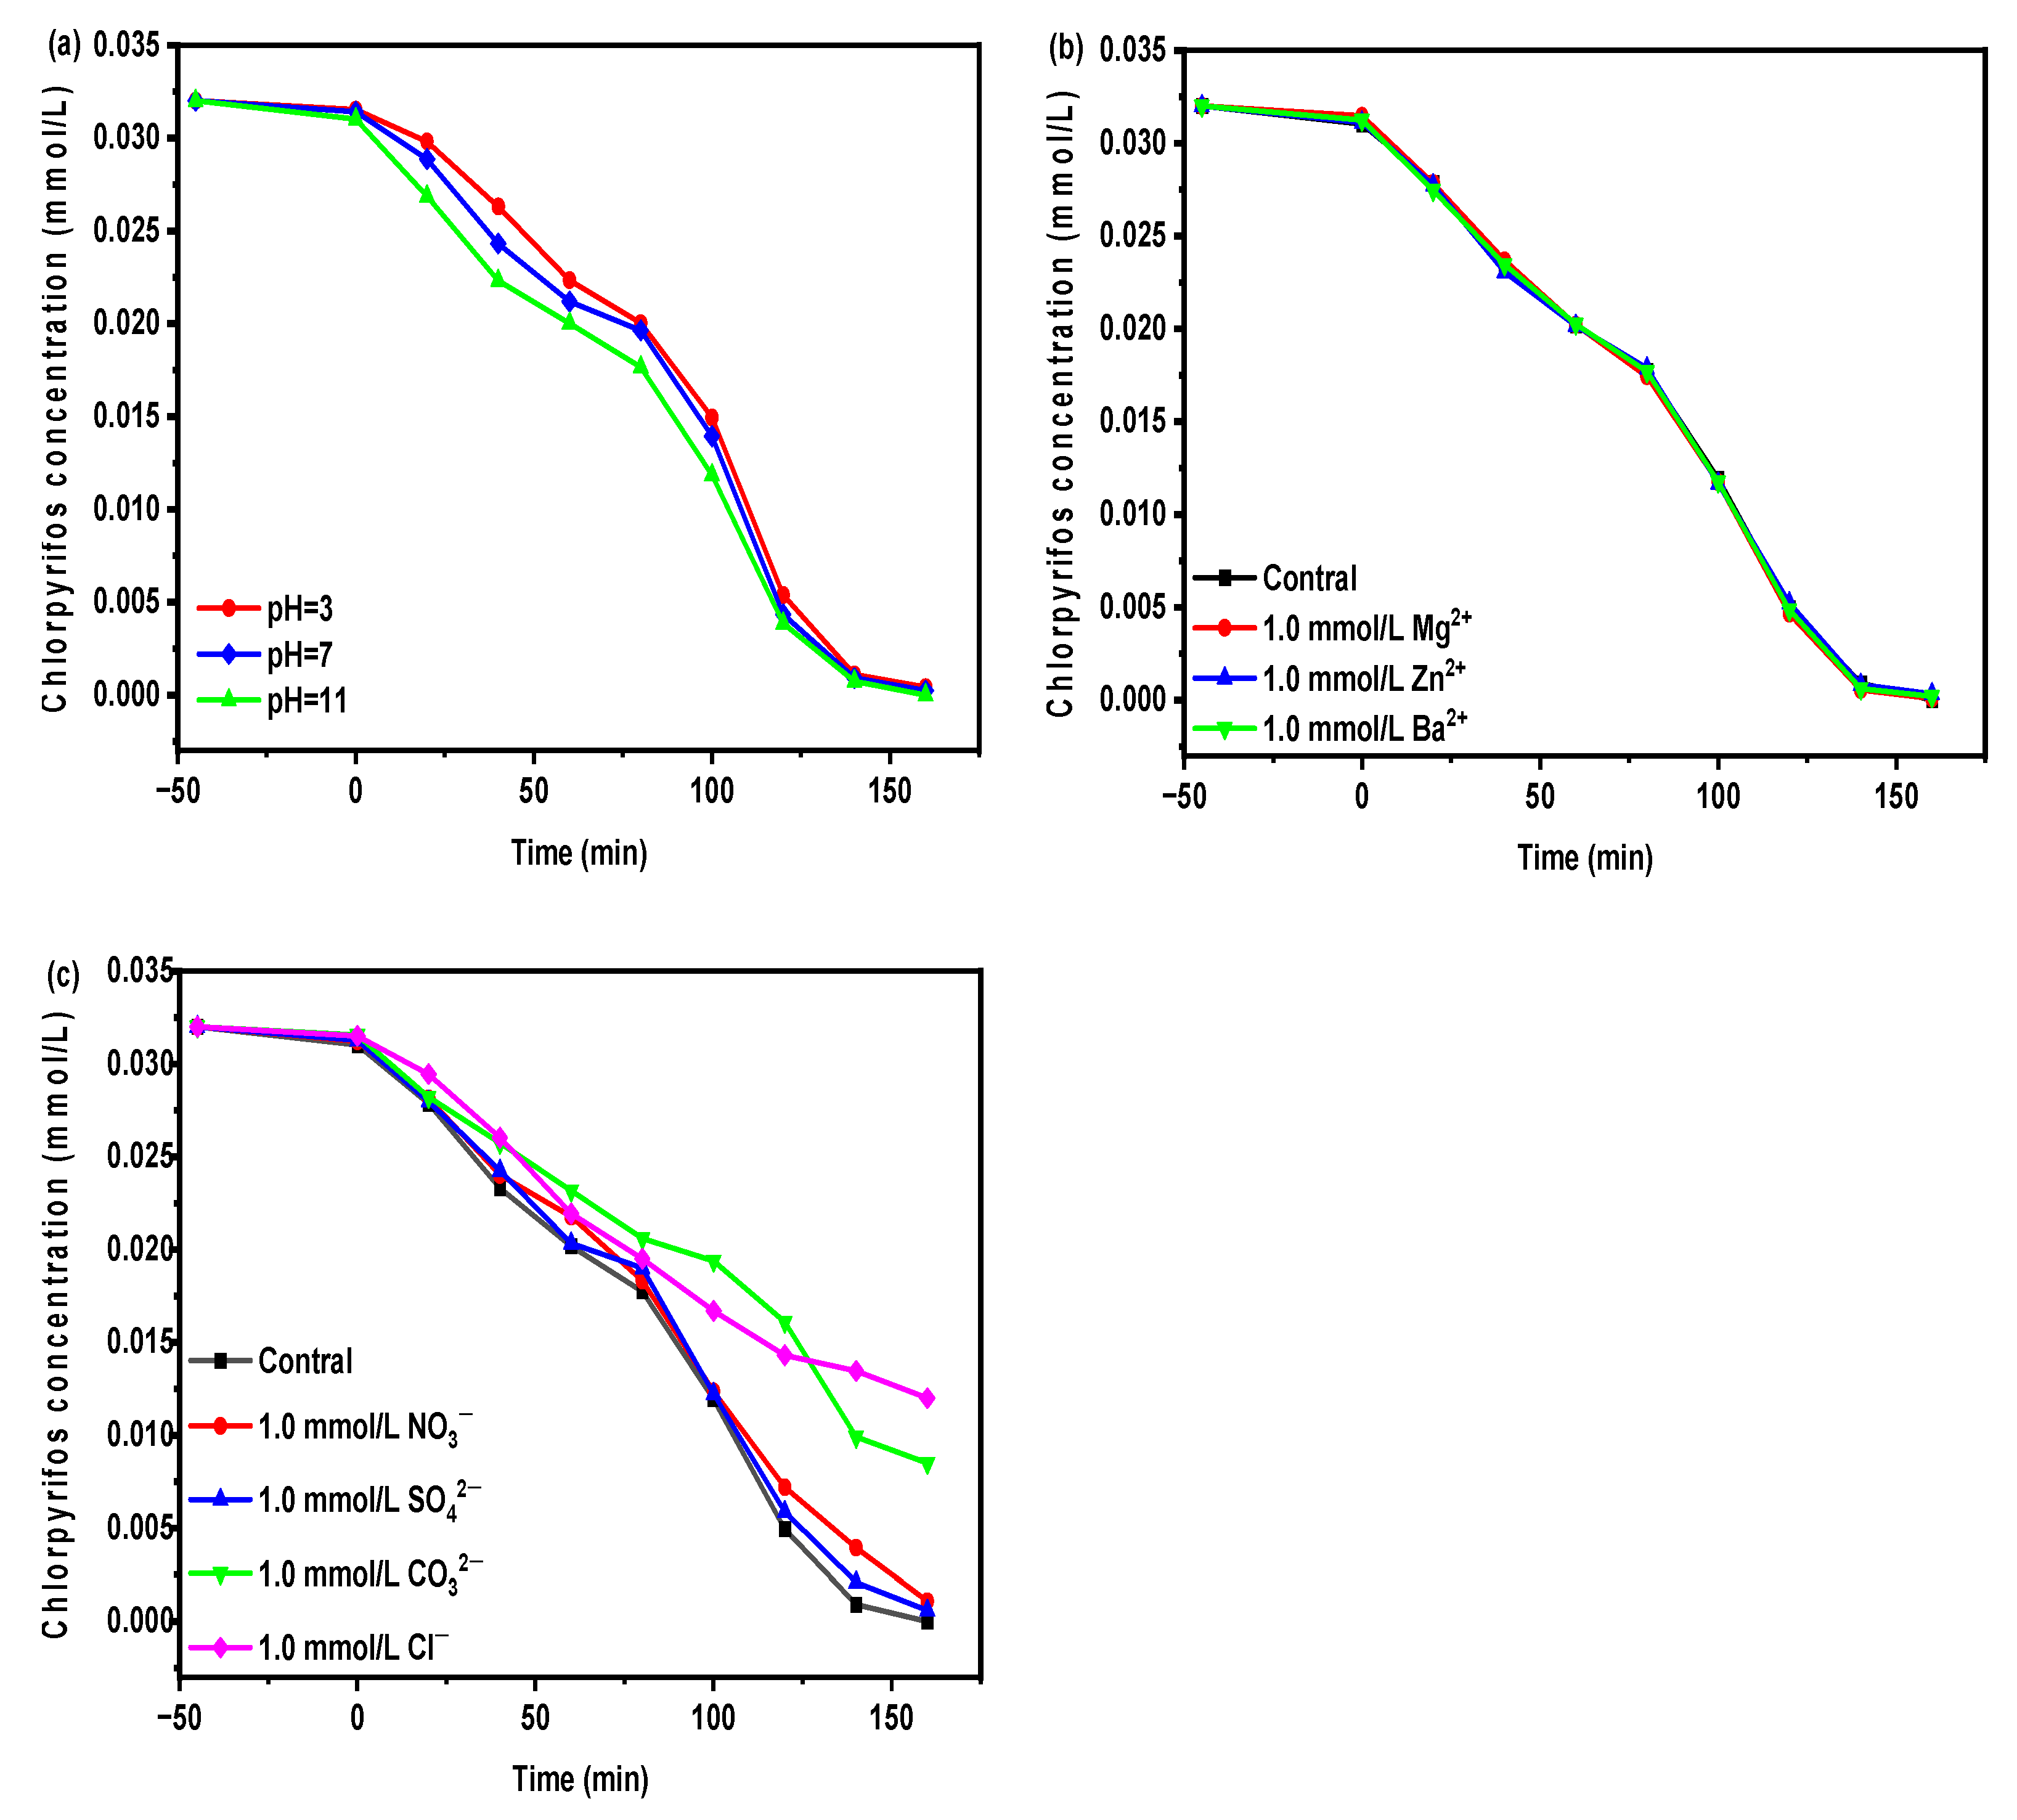
2.7. Photocatalytic Activity
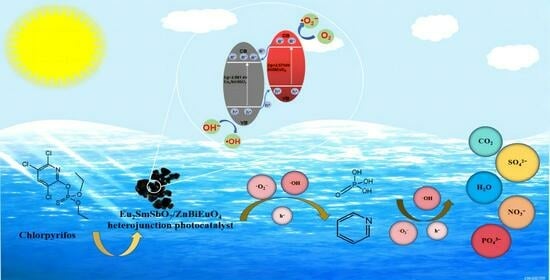
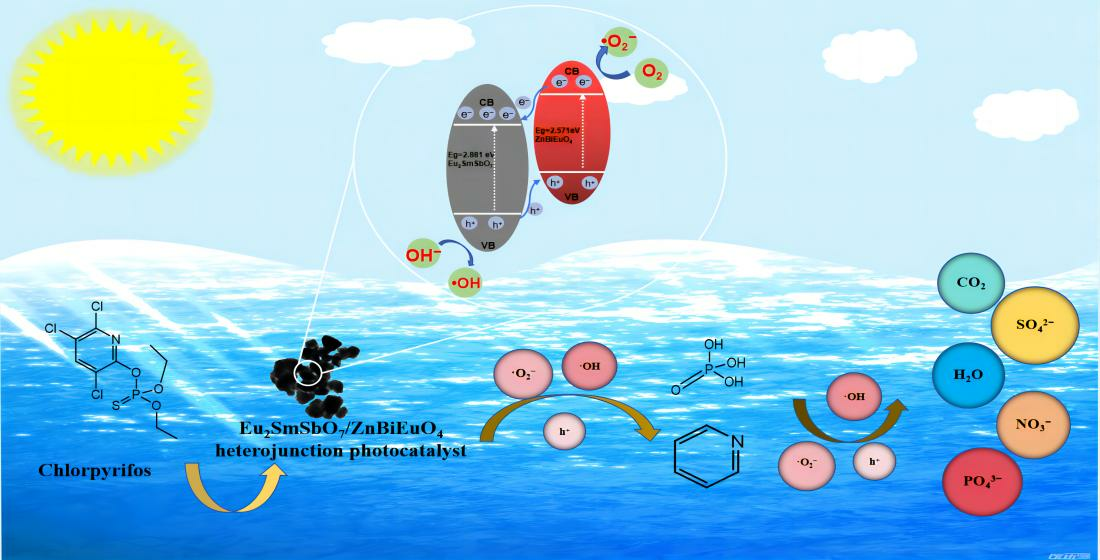
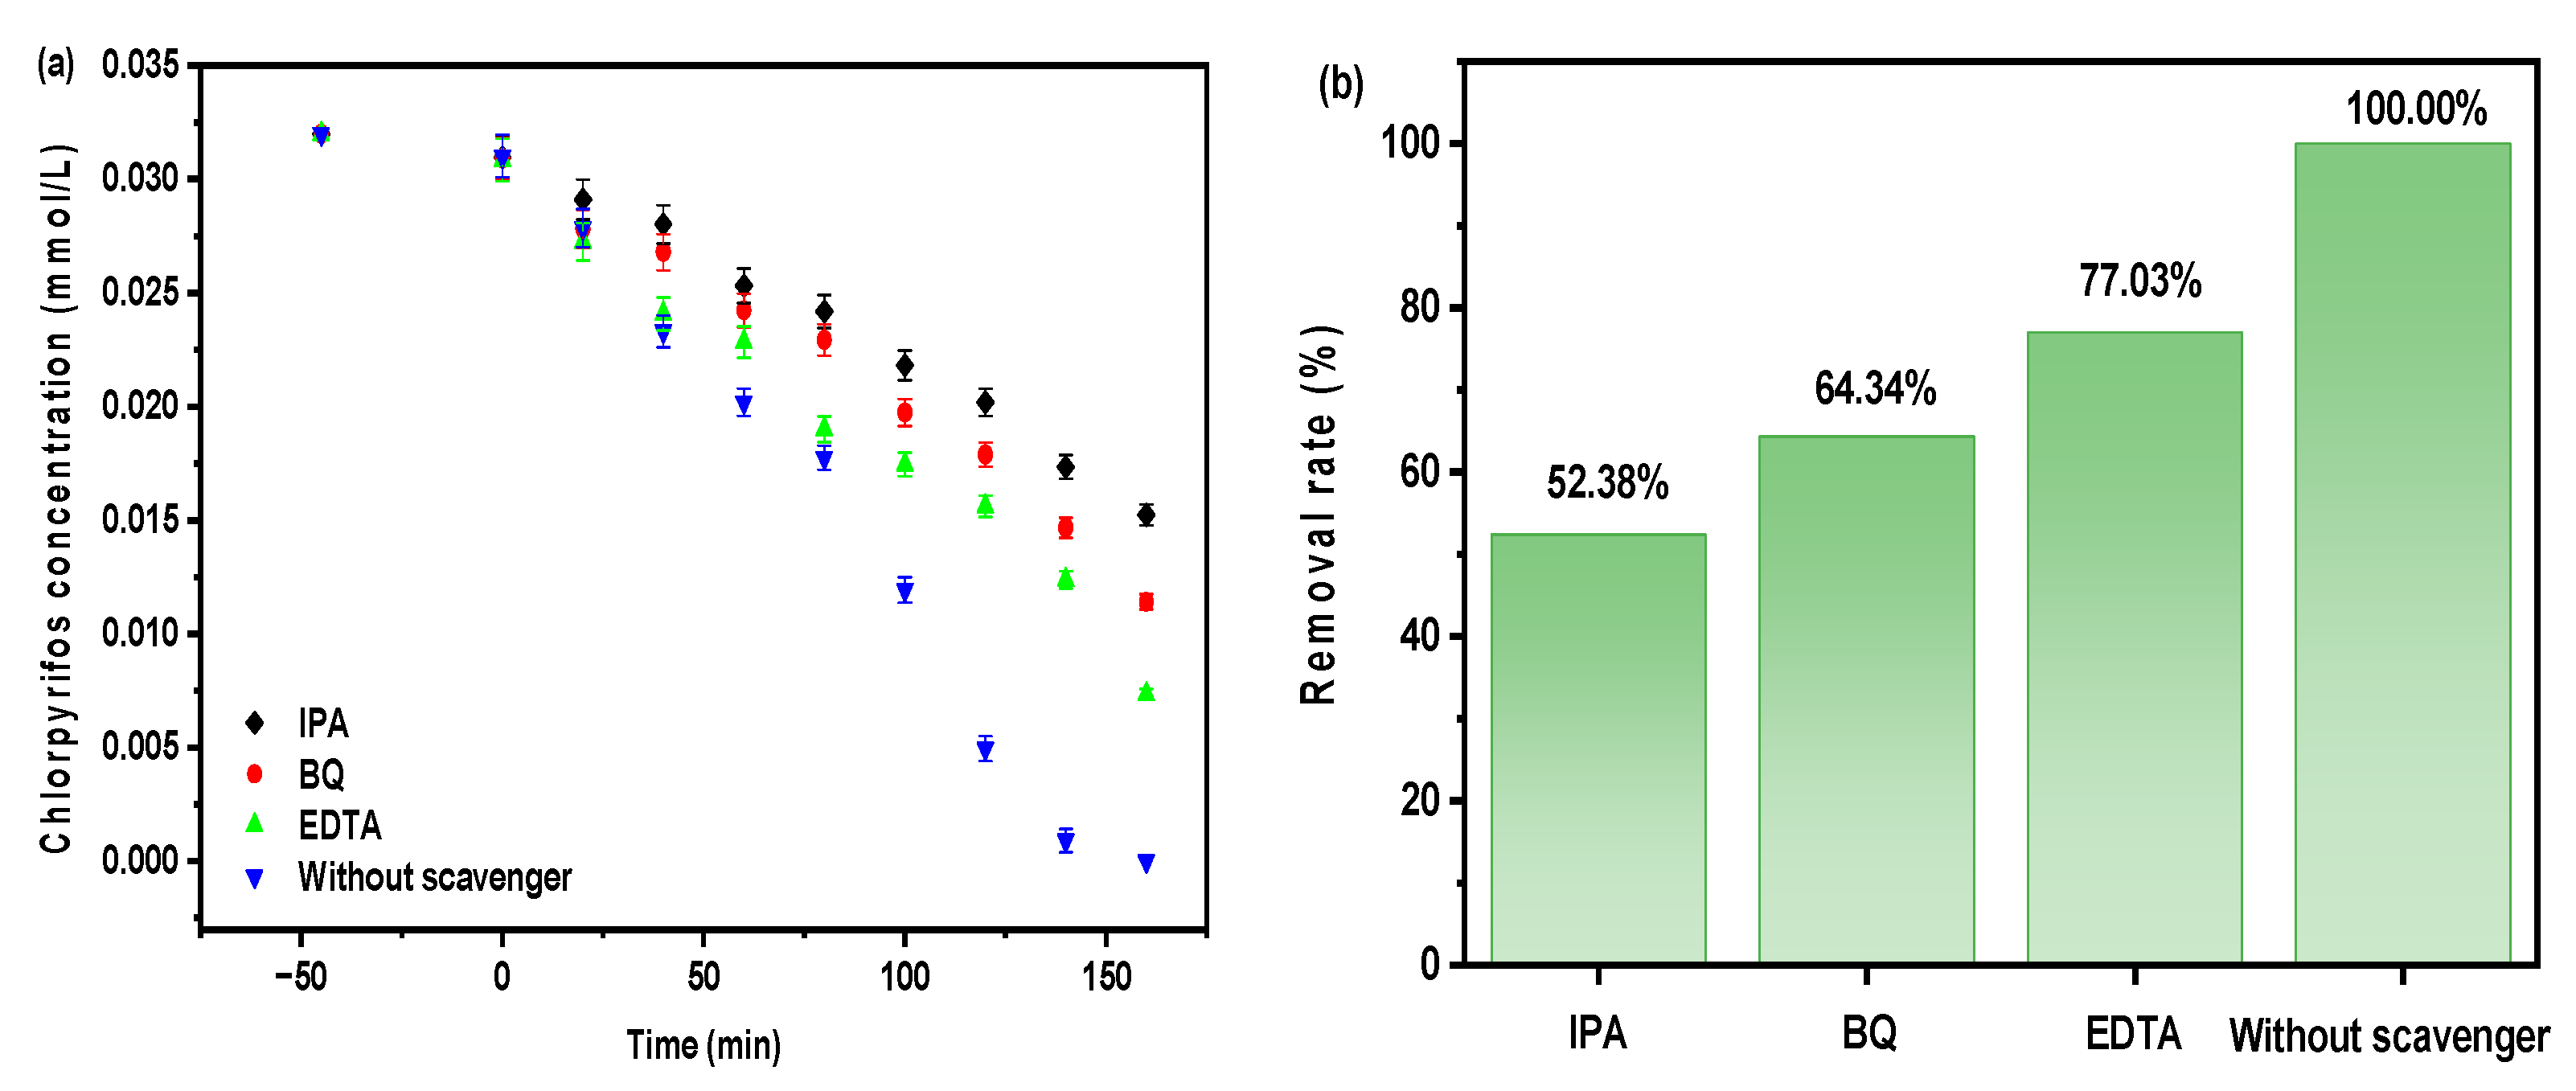
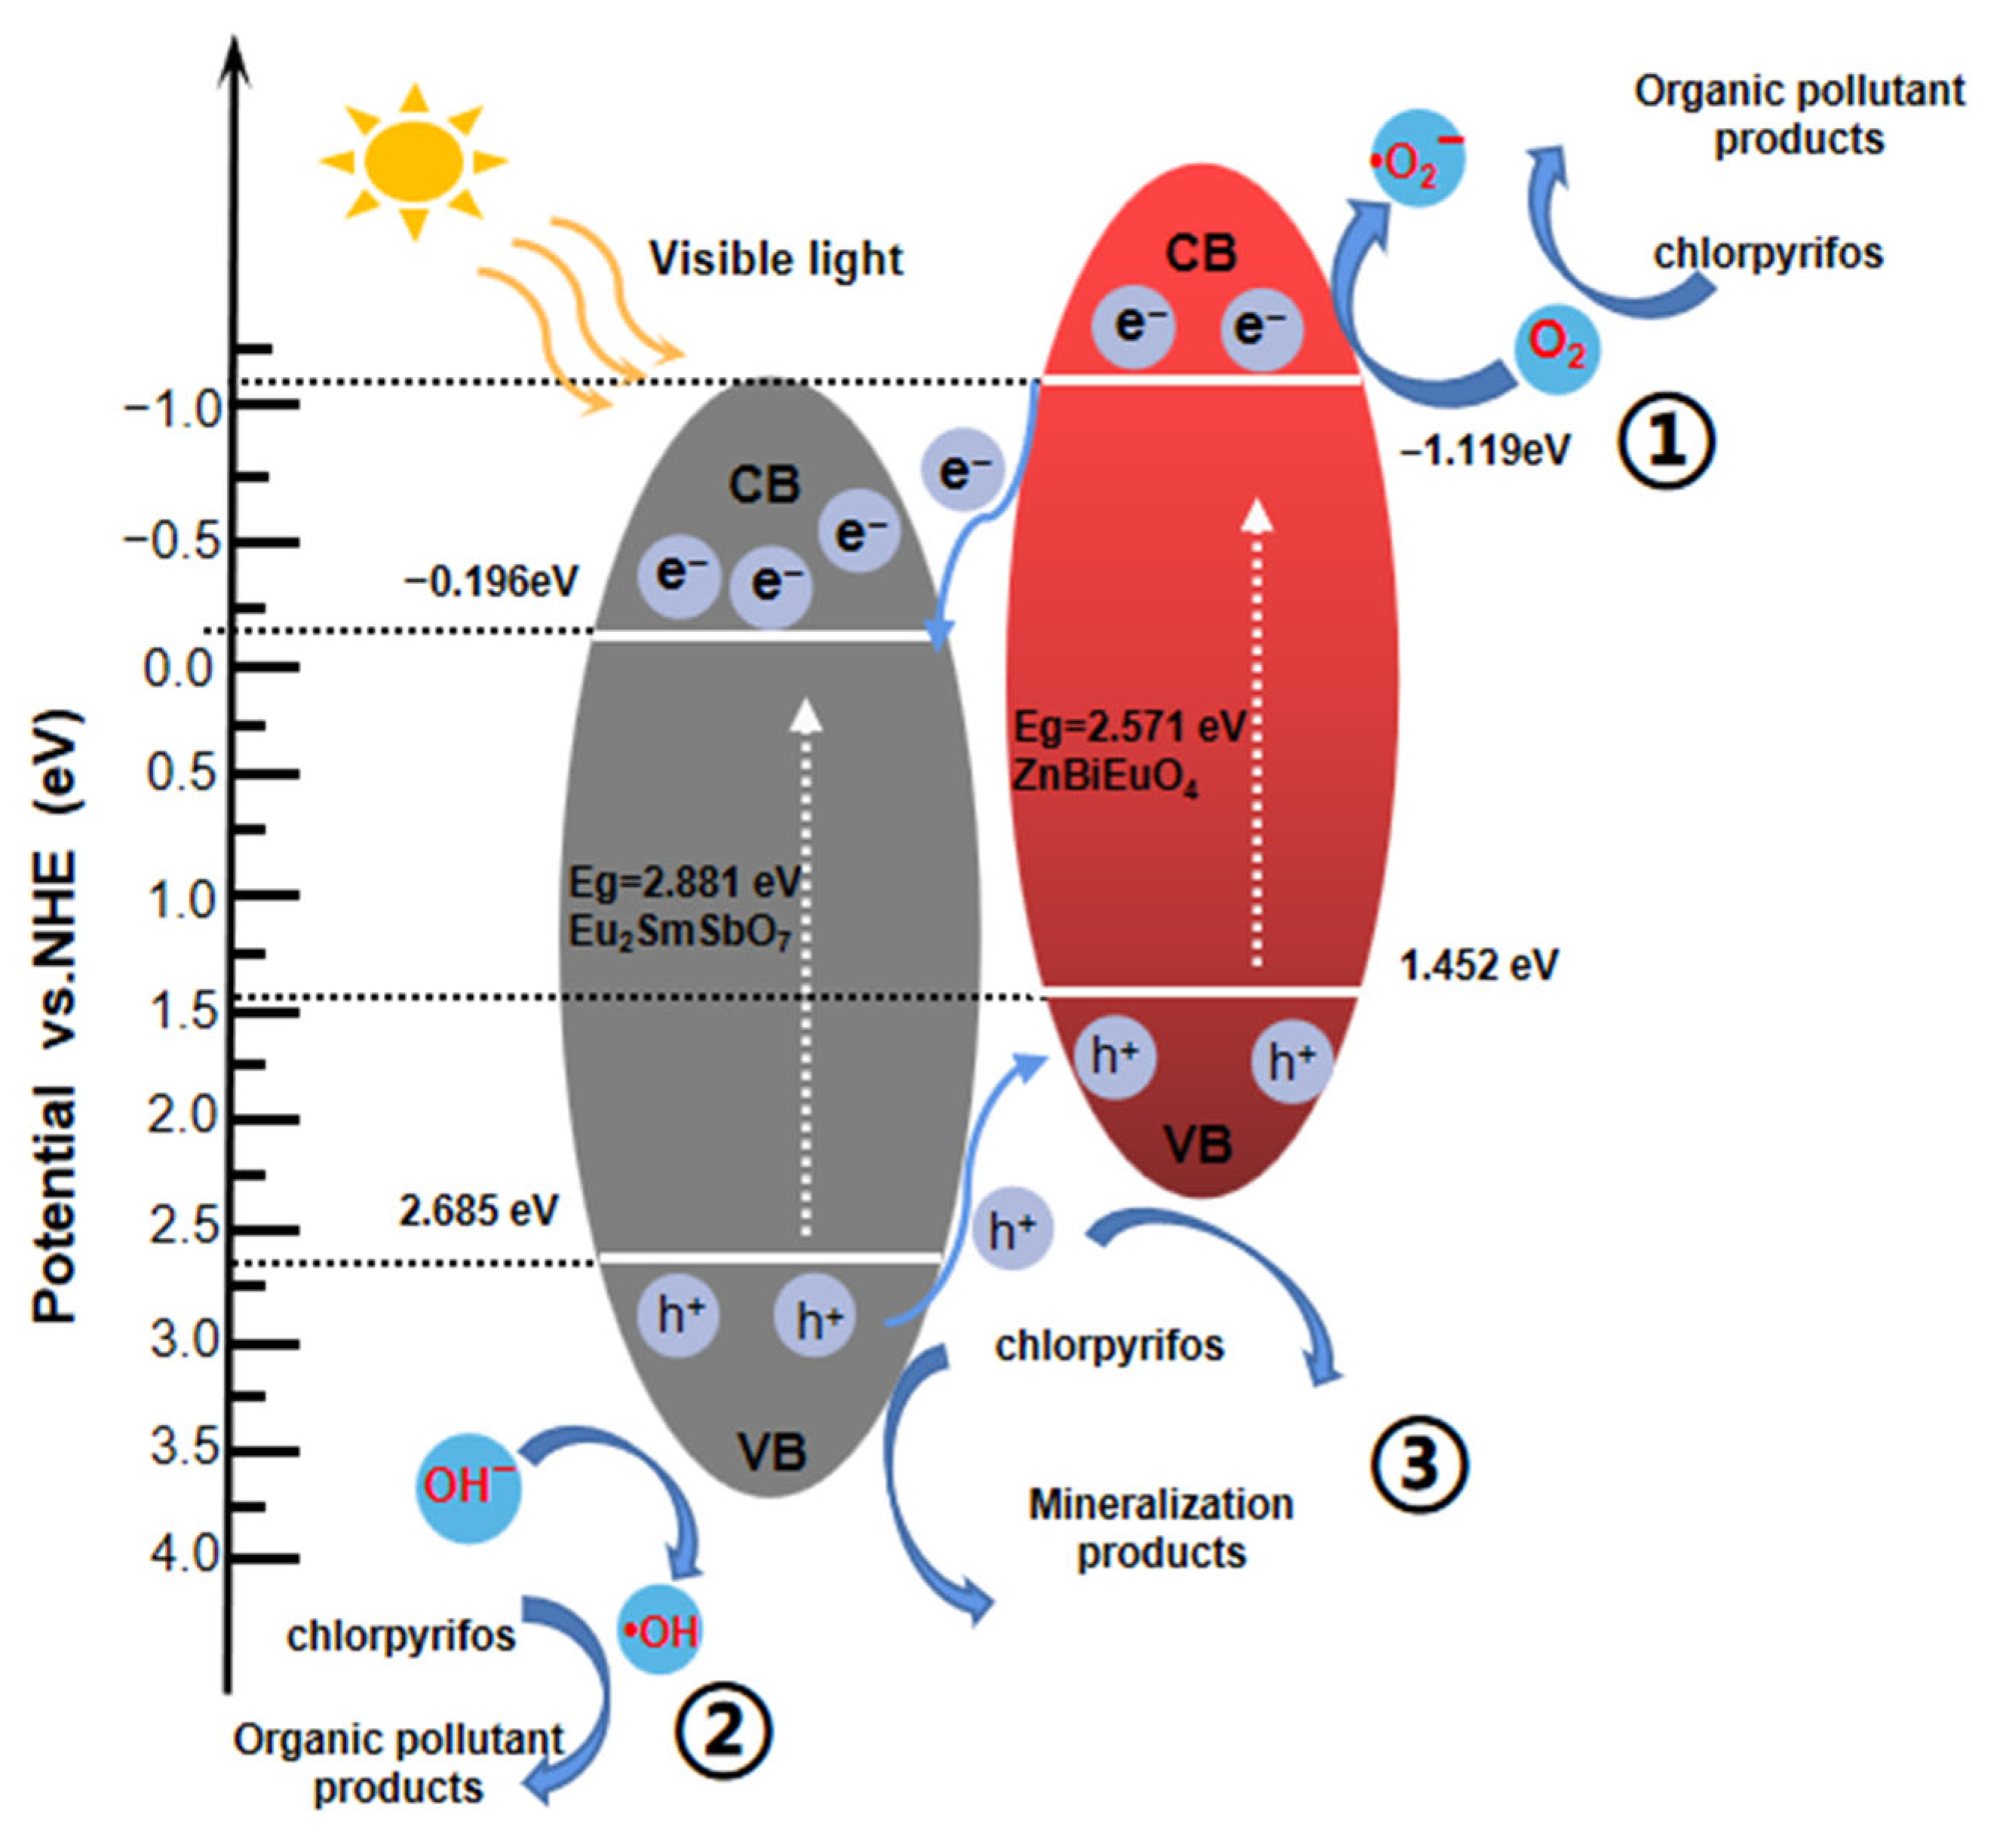
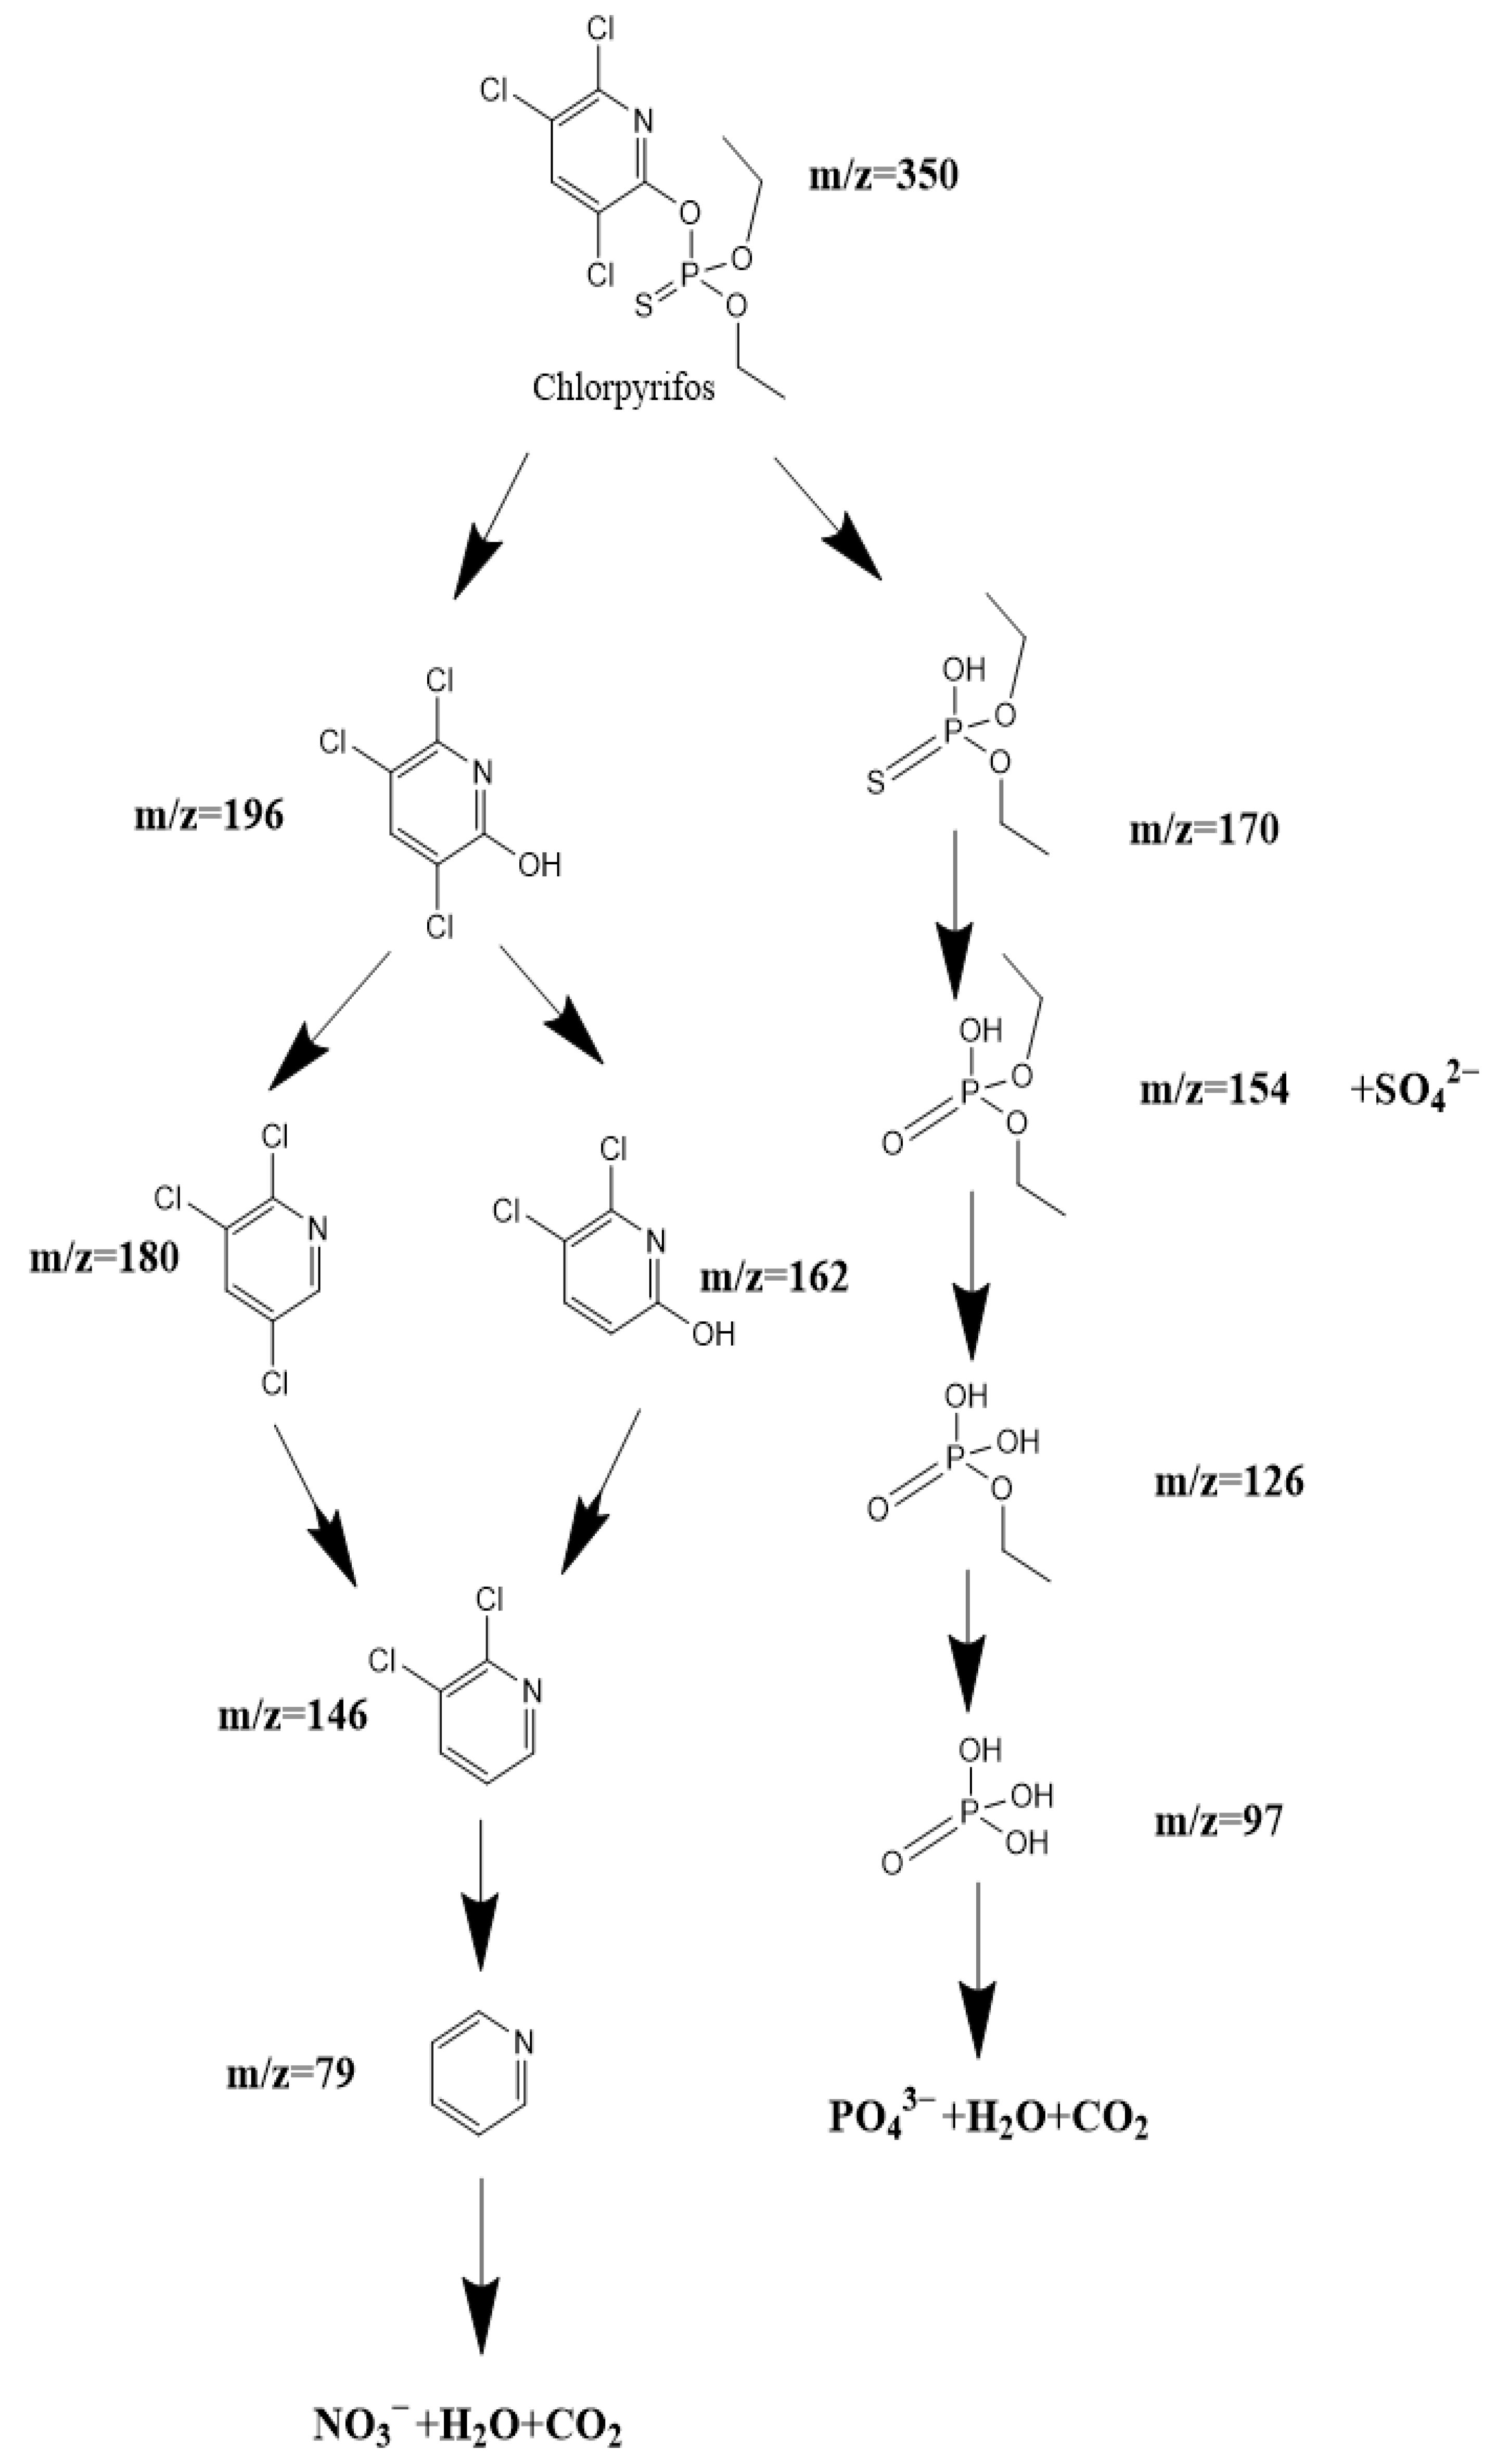
2.8. Analysis of Possible Degradation Mechanisms
3. Experimental Section
3.1. Materials and Reagents
3.2. Synthesis of N-Doped TiO2
3.3. Synthesis of Eu2SmSbO7/ZnBiEuO4 Heterojunction Photocatalyst
3.4. Characterization
3.5. Photoelectrochemical Experiments
3.6. Experimental Setup and Procedure
4. Conclusions
Author Contributions
Funding
Data Availability Statement
Conflicts of Interest
References
- Soria-Lopez, A.; Garcia-Perez, P.; Carpena, M.; Garcia-Oliveira, P.; Otero, P.; Fraga-Corral, M.; Cao, H.; Prieto, M.A.; Simal-Gandara, J. Challenges for future food systems: From the Green Revolution to food supply chains with a special focus on sustainability. Food Front. 2023, 4, 9–20. [Google Scholar] [CrossRef]
- Fukase, E.; Martin, W. Economic growth, convergence, and world food demand and supply. World. Dev. 2020, 132, 104954. [Google Scholar] [CrossRef]
- Webb, R.; Buratini, J. Global Challenges for the 21st Century: The Role and Strategy of the Agri-Food Sector. Anim. Reprod. 2016, 13, 133–142. [Google Scholar] [CrossRef]
- Liu, Y.B.; Pan, X.B.; Li, J.S. A 1961–2010 record of fertilizer use, pesticide application and cereal yields: A review. Agron. Sustain. Dev. 2015, 35, 83–93. [Google Scholar] [CrossRef]
- Delcour, I.; Spanoghe, P.; Uyttendaele, M. Literature review: Impact of climate change on pesticide use. Food Res. Int. 2015, 68, 7–15. [Google Scholar] [CrossRef]
- Popp, J.; Peto, K.; Nagy, J. Pesticide productivity and food security. A review. Agron. Sustain. Dev. 2013, 33, 243–255. [Google Scholar] [CrossRef]
- Washuck, N.; Hanson, M.; Prosser, R. Yield to the data: Some perspective on crop productivity and pesticides. Pest Manag. Sci. 2022, 78, 1765–1771. [Google Scholar] [CrossRef]
- Rodrigues, E.T.; Lopes, I.; Pardal, M.A. Occurrence, fate and effects of azoxystrobin in aquatic ecosystems: A review. Environ. Int. 2013, 53, 18–28. [Google Scholar] [CrossRef]
- Wahab, S.; Muzammil, K.; Nasir, N.; Khan, M.S.; Ahmad, M.F.; Khalid, M.; Ahmad, W.; Dawria, A.; Reddy, L.K.V.; Busayli, A.M. Advancement and New Trends in Analysis of Pesticide Residues in Food: A Comprehensive Review. Plants 2022, 11, 1106. [Google Scholar] [CrossRef]
- Wan, M.T. Ecological risk of pesticide residues in the British Columbia environment: 1973–2012. J. Environ. Sci. Health B 2013, 48, 344–363. [Google Scholar] [CrossRef]
- El-Sheikh, E.S.A.; Ramadan, M.M.; El-Sobki, A.E.; Shalaby, A.A.; McCoy, M.R.; Hamed, I.A.; Ashour, M.B.; Hammock, B.D. Pesticide Residues in Vegetables and Fruits from Farmer Markets and Associated Dietary Risks. Molecules 2022, 27, 72. [Google Scholar] [CrossRef] [PubMed]
- Jyoti, J.L.; Shelton, A.M.; Taylor, A.G. Film-coating seeds with chlorpyrifos for germination and control of cabbage maggot (Diptera:Anthomyiidae) on cabbage transplants. J. Entomol. Sci. 2003, 38, 553–565. [Google Scholar] [CrossRef]
- Bundy, C.S.; Lewis, B. Impact of chlorpyrifos for pink bollworm control on secondary pests and beneficials. Southwest. Entomol. 2005, 30, 105–111. [Google Scholar]
- Goh, W.L.; Yiu, P.H.; Wong, S.C.; Rajan, A. Safe use of chlorpyrifos for insect pest management in leaf mustard (Brassica juncea L. Coss.). J. Food Agric. Env. 2011, 9, 1064–1066. [Google Scholar]
- Su, H.H.; Jiang, L.L.; Wang, H.T.; Yang, T.Z.; Harvey-Samuel, T.; Zhou, Q.X.; Lü, Y.B.; Yang, Y.Z. Sublethal effects of Bt toxin and chlorpyrifos on various Spodoptera exigua populations. Entomol. Exp. Appl. 2015, 157, 214–219. [Google Scholar] [CrossRef]
- Hites, R.A. The Rise and Fall of Chlorpyrifos in the United States. Environ. Sci. Technol. 2021, 55, 1354–1358. [Google Scholar] [CrossRef]
- John, E.M.; Shaike, J.M. Chlorpyrifos: Pollution and remediation. Environ. Chem. Lett. 2015, 13, 269–291. [Google Scholar] [CrossRef]
- Wang, L.; Liu, Z.; Zhang, J.J.; Wu, Y.H.; Sun, H.W. Chlorpyrifos exposure in farmers and urban adults: Metabolic characteristic, exposure estimation, and potential effect of oxidative damage. Environ. Res. 2016, 149, 164–170. [Google Scholar] [CrossRef]
- Rahman, H.U.U.; Asghar, W.; Nazir, W.; Sandhu, M.A.; Ahmed, A.; Khalid, N. A comprehensive review on chlorpyrifos toxicity with special reference to endocrine disruption: Evidence of mechanisms, exposures and mitigation strategies. Sci. Total Environ. 2021, 755, 142649. [Google Scholar] [CrossRef]
- Tudi, M.; Yang, L.S.; Wang, L.; Lv, J.; Gu, L.J.; Li, H.R.; Peng, W.; Yu, Q.M.; Ruan, H.D.; Li, Q.; et al. Environmental and Human Health Hazards from Chlorpyrifos, Pymetrozine and Avermectin Application in China under a Climate Change Scenario: A Comprehensive Review. Agriculture 2023, 13, 1683. [Google Scholar] [CrossRef]
- Guo, J.Q.; Zhang, J.M.; Wu, C.H.; Lv, S.L.; Lu, D.S.; Qi, X.J.; Jiang, S.; Feng, C.; Yu, H.X.; Liang, W.J.; et al. Associations of prenatal and childhood chlorpyrifos exposure with Neurodevelopment of 3-year-old children. Environ. Pollut. 2019, 251, 538–546. [Google Scholar] [CrossRef]
- Rauh, V.A.; Garfinkel, R.; Perera, F.P.; Andrews, H.F.; Hoepner, L.; Barr, D.B.; Whitehead, R.; Tang, D.; Whyatt, R.W. Impact of prenatal chlorpyrifos exposure on neurodevelopment in the first 3 years of life among inner-city children. Pediatrics 2006, 118, E1845–E1859. [Google Scholar] [CrossRef]
- Lee, J.E.; Kim, M.K.; Lee, J.Y.; Lee, Y.M.; Zoh, K.D. Degradation kinetics and pathway of 1H-benzotriazole during UV/chlorination process. Chem. Eng. J. 2019, 359, 1502–1508. [Google Scholar] [CrossRef]
- Mansor, N.A.; Tay, K.S. Degradation of 5,5-diphenylhydantoin by chlorination and UV/chlorination: Kinetics, transformation by-products, and toxicity assessment. Environ. Sci. Pollut. R 2017, 24, 22361–22370. [Google Scholar] [CrossRef] [PubMed]
- Qin, L.; Lin, Y.L.; Xu, B.; Hu, C.Y.; Tian, F.X.; Zhang, T.Y.; Zhu, W.Q.; Huang, H.; Gao, N.Y. Kinetic models and pathways of ronidazole degradation by chlorination, UV irradiation and UV/chlorine processes. Water Res. 2014, 65, 271–281. [Google Scholar] [CrossRef] [PubMed]
- Yang, S.M.; Feng, Y.; Gao, D.; Wang, X.W.; Suo, N.; Yu, Y.Z.; Zhang, S.B. Electrocatalysis degradation of tetracycline in a three-dimensional aeration electrocatalysis reactor (3D-AER) with a flotation-tailings particle electrode (FPE): Physicochemical properties, influencing factors and the degradation mechanism. J. Hazard. Mater. 2021, 407, 18. [Google Scholar] [CrossRef]
- Wang, Y.L.; Cai, N.C.; Huo, Y.D.; Chen, H. Electrochemical oxidation for the degradation of aniline on the SnO2/Ti anode. Acta Phys. Chim. Sin. 2001, 17, 609–613. [Google Scholar] [CrossRef]
- Zhou, M.H.; Wu, Z.C.; Wang, D.H. A novel electrocatalysis method for organic pollutants degradation. Chin. Chem. Lett. 2001, 12, 929–932. [Google Scholar]
- Zhang, M.H.; Liu, G.H.; Song, K.; Wang, Z.Y.; Zhao, Q.L.; Li, S.J.; Ye, Z.F. Biological treatment of 2,4,6-trinitrotoluene (TNT) red water by immobilized anaerobic-aerobic microbial filters. Chem. Eng. J. 2015, 259, 876–884. [Google Scholar] [CrossRef]
- Ji, Q.H.; Tabassum, S.; Yu, G.X.; Chu, C.F.; Zhang, Z.J. Determination of biological removal of recalcitrant organic contaminants in coal gasification waste water. Environ. Technol. 2015, 36, 2815–2824. [Google Scholar] [CrossRef]
- Jiang, Y.; Wang, H.Y.; Shang, Y.; Yang, K. Simultaneous removal of aniline, nitrogen and phosphorus in aniline-containing wastewater treatment by using sequencing batch reactor. Bioresour. Technol. 2016, 207, 422–429. [Google Scholar] [CrossRef]
- Goudarzi, M.; Abdulhusain, Z.H.; Salavati-Niasari, M. Low-cost and eco-friendly synthesis of Mn-doped T2WO4 nanostructures for efficient visible light photocatalytic degradation of antibiotics in water. Sol. Energy 2023, 262, 111912. [Google Scholar] [CrossRef]
- Mehdizadeh, P.; Jamdar, M.; Mahdi, M.A.; Abdulsahib, W.K.; Jasim, L.S.; Yousefi, S.R.; Salavati-Niasari, M. Rapid microwave fabrication of new nanocomposites based on Tb-Co-O nanostructures and their application as photocatalysts under UV/Visible light for removal of organic pollutants in water. Arab. J. Chem. 2023, 16, 104579. [Google Scholar] [CrossRef]
- Hafeez, A.; Shezad, N.; Javed, F.; Fazal, T.; Rehman, M.S.U.; Rehman, F. Synergetic effect of packed-bed corona-DBD plasma micro-reactor and photocatalysis for organic pollutant degradation. Sep. Purif. Technol. 2021, 269, 118728. [Google Scholar] [CrossRef]
- Mmelesi, O.K.; Masunga, N.; Kuvarega, A.; Nkambule, T.T.; Mamba, B.B.; Kefeni, K.K. Cobalt ferrite nanoparticles and nanocomposites: Photocatalytic, antimicrobial activity and toxicity in water treatment. Mat. Sci. Semicon. Proc. 2021, 123, 105523. [Google Scholar] [CrossRef]
- Masunga, N.; Mamba, B.B.; Kefeni, K.K. Trace samarium doped graphitic carbon nitride photocatalytic activity toward metanil yellow dye degradation under visible light irradiation. Colloid. Surface A 2020, 602, 125107. [Google Scholar] [CrossRef]
- Rostami, M.; Jourshabani, M.; Davar, F.; Ziarani, G.M.; Badiei, A. Black TiO2-g-C3N4 heterojunction coupled with MOF (ZIF-67)-derived Co3S4/nitrogen-doped carbon hollow nanobox. J. Am. Ceram. Soc. 2023, 107, 719–735. [Google Scholar] [CrossRef]
- Ye, K.H.; Li, Y.; Yang, H.; Li, M.Y.; Huang, Y.C.; Zhang, S.Q.; Ji, H.B. An ultrathin carbon layer activated CeO2 heterojunction nanorods for photocatalytic degradation of organic pollutants. Appl. Catal. B Environ. 2019, 259, 118085. [Google Scholar] [CrossRef]
- Yang, X.F.; Qin, J.L.; Jiang, Y.; Chen, K.M.; Yan, X.H.; Zhang, D.; Li, R.; Tang, H. Fabrication of P25/Ag3PO4/graphene oxide heterostructures for enhanced solar photocatalytic degradation of organic pollutants and bacteria. Appl. Catal. B-Environ. 2015, 166, 231–240. [Google Scholar] [CrossRef]
- Koe, W.S.; Lee, J.W.; Chong, W.C.; Pang, Y.L.; Sim, L.C. An overview of photocatalytic degradation: Photocatalysts, mechanisms, and development of photocatalytic membrane. Environ. Sci. Pollut. R 2020, 27, 2522–2565. [Google Scholar] [CrossRef] [PubMed]
- Wen, X.J.; Shen, C.H.; Fei, Z.H.; Fang, D.; Liu, Z.T.; Dai, J.T.; Niu, C.G. Recent developments on AgI based heterojunction photocatalytic systems in photocatalytic application. Chem. Eng. J. 2020, 383, 21. [Google Scholar] [CrossRef]
- Luan, J.F.; Niu, B.W.; Ma, B.B.; Yang, G.M.; Liu, W.L. Preparation and Property Characterization of In2YSbO7/BiSnSbO6 Heterojunction Photocatalyst toward Photocatalytic Degradation of Indigo Carmine within Dye Wastewater under Visible-Light Irradiation. Materials 2022, 15, 6648. [Google Scholar] [CrossRef] [PubMed]
- Soleimani, M.; Ghasemi, J.B.; Ziarani, G.M.; Karimi-Maleh, H.; Badiei, A. Photocatalytic degradation of organic pollutants, viral and bacterial pathogens using titania nanoparticles. Inorg. Chem. Commun. 2021, 130, 108688. [Google Scholar] [CrossRef]
- Zhang, Q.H.; Gao, L.; Guo, J.K. Photocatalytic activity of nanosized TiO2. J. Inorg. Mater. 2000, 15, 556–560. [Google Scholar]
- Wold, A. Photocatalytic Properties of TIO2. Chem. Mater. 1993, 5, 280–283. [Google Scholar] [CrossRef]
- Yeber, M.C.; Rodríguez, J.; Freer, J.; Durán, N.; Mansilla, H.D. Photocatalytic degradation of cellulose bleaching effluent by supported TiO2 and ZnO. Chemosphere 2000, 41, 1193–1197. [Google Scholar] [CrossRef] [PubMed]
- Villasenor, J.; Reyes, P.; Pecchi, G. Photodegradation of pentachlorophenol on ZnO. J. Chem. Technol. Biotechnol. 1998, 72, 105–110. [Google Scholar] [CrossRef]
- Dong, W.X.; Bao, Q.F.; Gu, X.Y.; Peng, G.; Zhao, X.G. C3N4/CaTi2O5 Composite: Synthesis and Photocatalytic Properties. Chinese. J.Org. Chem. 2017, 33, 292–298. [Google Scholar] [CrossRef]
- Li, J.H.; Han, M.S.; Guo, Y.; Wang, F.; Sun, C. Fabrication of FeVO4/Fe2TiO5 composite catalyst and photocatalytic removal of norfloxacin. Chem. Eng. J. 2016, 298, 300–308. [Google Scholar] [CrossRef]
- Issarapanacheewin, S.; Wetchakun, K.; Phanichphant, S.; Kangwansupamonkon, W.; Wetchakun, N. A novel CeO2/Bi2WO6 composite with highly enhanced photocatalytic activity. Mater. Lett. 2015, 156, 28–31. [Google Scholar] [CrossRef]
- Hunge, Y.M.; Yadav, A.A.; Kang, S.W. Photocatalytic Degradation of Eriochrome Black-T Using BaWO4/MoS2 Composite. Catalysts 2022, 12, 11. [Google Scholar] [CrossRef]
- Zou, Z.G.; Ye, J.H.; Abe, R.; Arakawa, H. Photocatalytic decomposition of water with Bi2InNbO7. Catal. Lett. 2000, 68, 235–239. [Google Scholar] [CrossRef]
- Cui, Y.B.; Luan, J.F. Synthesis, crystal structure, photodegradation kinetics and photocatalytic activity of novel photocatalyst ZnBiYO4. J. Environ. Sci. 2015, 29, 51–61. [Google Scholar] [CrossRef]
- Ajmal, A.; Majeed, I.; Malik, R.N.; Idriss, H.; Nadeem, M.A. Principles and mechanisms of photocatalytic dye degradation on TiO2 based photocatalysts: A comparative overview. RSC. Adv. 2014, 4, 37003–37026. [Google Scholar] [CrossRef]
- Tu, W.G.; Zhou, Y.; Zou, Z.G. Versatile Graphene-Promoting Photocatalytic Performance of Semiconductors: Basic Principles, Synthesis, Solar Energy Conversion, and Environmental Applications. Adv. Funct. Mater. 2013, 23, 4996–5008. [Google Scholar] [CrossRef]
- Wang, S.B.; Wang, F.F.; Su, Z.M.; Wang, X.N.; Han, Y.C.; Zhang, L.; Xiang, J.; Du, W.; Tang, N. Controllable Fabrication of Heterogeneous p-TiO2 QDs@g-C3N4 p-n Junction for Efficient Photocatalysis. Catalysts 2019, 9, 439. [Google Scholar] [CrossRef]
- Wang, W.Z.; Huang, X.W.; Wu, S.; Zhou, Y.X.; Wang, L.J.; Shi, H.L.; Liang, Y.J.; Zou, B. Preparation of p-n junction Cu2O/BiVO4 heterogeneous nanostructures with enhanced visible-light photocatalytic activity. Appl. Catal. B-Environ. 2013, 134, 293–301. [Google Scholar] [CrossRef]
- Xu, H.; Xu, Y.G.; Li, H.M.; Xia, J.X.; Xiong, J.; Yin, S.; Huang, C.J.; Wan, H.L. Synthesis, characterization and photocatalytic property of AgBr/BiPO4 heterojunction photocatalyst. Dalton Trans. 2012, 41, 3387–3394. [Google Scholar] [CrossRef]
- Cheng, T.T.; Gao, H.J.; Sun, X.F.; Xian, T.; Wang, S.F.; Yi, Z.; Liu, G.R.; Wang, X.X.; Yang, H. An excellent Z-scheme Ag2MoO4/Bi4Ti3O12heterojunction photocatalyst: Construction strategy and application in environmental purification. Adv. Powder Technol. 2021, 32, 951–962. [Google Scholar] [CrossRef]
- Fattah, W.I.A.; Gobara, M.M.; El-Hotaby, W.; Mostafa, S.F.M.; Ali, G.W. Coating stainless steel plates with Ag/TiO2 for chlorpyrifos decontamination. Mater. Res. Express. 2016, 3, 055009. [Google Scholar] [CrossRef]
- Pathania, D.; Sharma, A.; Kumar, S.; Srivastava, A.K.; Kumar, A.; Singh, L. Bio-synthesized Cu-ZnO hetro-nanostructure for catalytic degradation of organophosphate chlorpyrifos under solar illumination. Chemosphere 2021, 277, 130315. [Google Scholar] [CrossRef]
- Luan, J.F.; Wei, Z.J.; Niu, B.W.; Yang, G.M.; Huang, C.S.; Ma, B.B.; Liu, W.L. Synthesis, Property Characterization and Photocatalytic Activity of the Ag3PO4/Gd2BiTaO7 Heterojunction Catalyst under Visible Light Irradiation. Catalysts 2022, 12, 22. [Google Scholar] [CrossRef]
- Wang, J.H.; Zou, Z.G.; Ye, J.H. Synthesis, structure and photocatalytic property of a new hydrogen evolving photocatalyst Bi2InTaO7. In Functionally Graded Materials Vii; Pan, W., Gong, J., Zhang, L., Chen, L., Eds.; Trans Tech Publications Ltd.: Zurich-Uetikon, Switzerland, 2003; Volume 423–424, pp. 485–490. [Google Scholar]
- Kohno, M.; Ogura, S.; Sato, K.; Inoue, Y. Properties of photocatalysts with tunnel structures: Formation of a surface lattice O- radical by the UV irradiation of BaTi4O9 with a pentagonal-prism tunnel structure. Chem. Phys. Lett. 1997, 267, 72–76. [Google Scholar] [CrossRef]
- Kudo, A.; Kato, H.; Nakagawa, S. Water splitting into H2 and O2 on new Sr2M2O7 (M = Nb and Ta) photocatalysts with layered perovskite structures:: Factors affecting the photocatalytic activity. J. Phys. Chem. B 2000, 104, 571–575. [Google Scholar] [CrossRef]
- Wiegel, M.; Middel, W.; Blasse, G. Influence of ns(2) ions on the luminescence of niobates and tantalates. J. Mater. Chem. 1995, 5, 981–983. [Google Scholar] [CrossRef]
- Luan, J.F.; Ma, B.B.; Yao, Y.; Liu, W.L.; Niu, B.W.; Yang, G.M.; Wei, Z.J. Synthesis, Performance Measurement of Bi2SmSbO7/ZnBiYO4 Heterojunction Photocatalyst and Photocatalytic Degradation of Direct Orange within Dye Wastewater under Visible Light Irradiation. Materials 2022, 15, 3986. [Google Scholar] [CrossRef] [PubMed]
- Monshi, A.; Foroughi, M.R.; Monshi, M.R. Modified Scherrer Equation to Estimate More Accurately Nano-Crystallite Size Using XRD. World J. Nano Sci. Eng. 2012, 2, 154–160. [Google Scholar] [CrossRef]
- Nasiri, S.; Rabiei, M.; Palevicius, A.; Janusas, G.; Vilkauskas, A.; Nutalapati, V.; Monshi, A. Modified Scherrer equation to calculate crystal size by XRD with high accuracy, examples Fe2O3, TiO2 and V2O5. Nano Trends 2023, 3, 100015. [Google Scholar] [CrossRef]
- Burton, A.W.; Ong, K.; Rea, T.; Chan, I.Y. On the estimation of average crystallite size of zeolites from the Scherrer equation: A critical evaluation of its application to zeolites with one-dimensional pore systems. Microporous Mesoporous Mater. 2009, 117, 75–90. [Google Scholar] [CrossRef]
- Shaishta, N.; Khan, W.U.; Mane, S.K.B.; Hayat, A.; Zhou, D.D.; Khan, J.; Mehmood, N.; Inamdar, H.K.; Manjunatha, G. Red-emitting CaSc2O4:Eu3+ phosphor for NUV-based warm white LEDs: Structural elucidation and Hirshfeld surface analysis. Int. J. Energy Res. 2020, 44, 8328–8339. [Google Scholar] [CrossRef]
- Goh, K.H.; Haseeb, A.; Wong, Y.H. Effect of Oxidation Temperature on Physical and Electrical Properties of Sm2O3 Thin-Film Gate Oxide on Si Substrate. J. Electron. Mater. 2016, 45, 5302–5312. [Google Scholar] [CrossRef]
- Kaviyarasu, K.; Sajan, D.; Devarajan, P.A. A rapid and versatile method for solvothermal synthesis of Sb2O3 nanocrystals under mild conditions. Appl. Nanosci. 2013, 3, 529–533. [Google Scholar] [CrossRef]
- Rada, S.; Rus, L.; Rada, M.; Zagrai, M.; Culea, E.; Rusu, T. Compositional dependence of structure, optical and electrochemical properties of antimony(III) oxide doped lead glasses and vitroceramics. Ceram. Int. 2014, 40, 15711–15716. [Google Scholar] [CrossRef]
- Achehboune, M.; Khenfouch, M.; Boukhoubza, I.; Leontie, L.; Doroftei, C.; Carlescu, A.; Bulai, G.; Mothudi, B.; Zorkani, I.; Jorio, A. Microstructural, FTIR and Raman spectroscopic study of Rare earth doped ZnO nanostructures. In Proceedings of the Nanosmat Mediterrane Conference, Fac Sci Rabat, Rabat, Morocco, 2 May–4 June 2009; pp. 319–323. [Google Scholar]
- Bosca, M.; Pop, L.; Borodi, G.; Pascuta, P.; Culea, E. XRD and FTIR structural investigations of erbium-doped bismuth-lead-silver glasses and glass ceramics. J. Alloys Compd. 2009, 479, 579–582. [Google Scholar] [CrossRef]
- Isari, A.A.; Hayati, F.; Kakavandi, B.; Rostami, M.; Motevassel, M.; Dehghanifard, E. N, Cu co-doped TiO2@functionalized SWCNT photocatalyst coupled with ultrasound and visible-light: An effective sono-photocatalysis process for pharmaceutical wastewaters treatment. Chem. Eng. J. 2020, 392, 16. [Google Scholar] [CrossRef]
- Karimi, B.; Habibi, M.H. High photocatalytic activity of light-driven Fe2TiO5 nanoheterostructure toward degradation of antibiotic metronidazole. J. Ind. Eng. Chem. 2019, 80, 292–300. [Google Scholar] [CrossRef]
- Berg, R.W.; Thorup, N. The reaction between ZnO and molten Na2S2O7 or K2S2O7 forming Na2Zn(SO4)2 or K2Zn(SO4)2, studied by Raman spectroscopy and X-ray diffraction. Inorg. Chem. 2005, 44, 3485–3493. [Google Scholar] [CrossRef] [PubMed]
- Tsaryuk, V.I.; Zhuravlev, K.P.; Szostak, R.; Vologzhanina, A.V. Structure, Luminescence, and Raman Spectroscopy of Europium and Terbium Dipivaloylmethanates and Other β-Diketonates with 2,2′-Bipyridine. J. Struct. Chem. 2020, 61, 1026–1037. [Google Scholar] [CrossRef]
- Chahine, A.; Et-tabirou, M.; Pascal, J.L. FTIR and Raman spectra of the Na2O-CuO-Bi2O3-P2O5 glasses. Mater. Lett. 2004, 58, 2776–2780. [Google Scholar] [CrossRef]
- Hadjiev, V.G.; Iliev, M.N.; Sasmal, K.; Sun, Y.Y.; Chu, C.W. Raman spectroscopy of R FeAsO (R = Sm, La). Phys. Rev. B 2008, 77, 3. [Google Scholar] [CrossRef]
- Refat, M.S.; Elsabawy, K.M. Infrared spectra, Raman laser, XRD, DSC/TGA and SEM investigations on the preparations of selenium metal, (Sb2O3, Ga2O3, SnO and HgO) oxides and lead carbonate with pure grade using acetamide precursors. Bull. Mater. Sci. 2011, 34, 873–881. [Google Scholar] [CrossRef]
- Gilliam, S.J.; Jensen, J.O.; Banerjee, A.; Zeroka, D.; Kirkby, S.J.; Merrow, C.N. A theoretical and experimental study of Sb4O6: Vibrational analysis, infrared, and Raman spectra. Spectrochim. Acta Part A Mol. Biomol. Spectrosc. 2004, 60, 425–434. [Google Scholar] [CrossRef] [PubMed]
- Luan, J.; Hao, L.; Yao, Y.; Wang, Y.; Yang, G.; Li, J. Preparation and Property Characterization of Sm2EuSbO7/ZnBiSbO5 Heterojunction Photocatalyst for Photodegradation of Parathion Methyl under Visible Light Irradiation. Molecules 2023, 28, 7722. [Google Scholar] [CrossRef] [PubMed]
- Uwamino, Y.; Ishizuka, T.; Yamatera, H. X-ray photoelectron-spectroscopy of rare-earth compounds. J. Electron Spectrosc. Relat. Phenom. 1984, 34, 67–78. [Google Scholar] [CrossRef]
- Izquierdo, R.; Sacher, E.; Yelon, A. X-ray photoelectron-spectra of antimony oxides. Appl. Surf. Sci. 1989, 40, 175–177. [Google Scholar] [CrossRef]
- Birchall, T.; Connor, J.A.; Hillier, I.H. High-energy photoelectron-spectroscopy of some antimony compounds. J. Chem. Soc. Dalton Trans. 1975, 2003–2006. [Google Scholar] [CrossRef]
- Benvenutti, E.V.; Gushikem, Y.; Vasquez, A.; Decastro, S.C.; Zaldivar, G.A.P. X-ray photoelectron-spectroscopy and mossbauer-spectroscopy study of iron(iii) and antimony(v) oxides grafted onto a silica-gel surface. J. Chem. Soc. Chem. Commun. 1991, 1325–1327. [Google Scholar] [CrossRef]
- Dake, L.S.; Baer, D.R.; Zachara, J.M. Auger parameter measurements of zinc-compounds relevant to zinc transport in the environment. Surf. Interface Anal. 1989, 14, 71–75. [Google Scholar] [CrossRef]
- Morgan, W.E.; Stec, W.J.; Van Wazer, J.R. Inner-orbital binding-energy shifts of antimony and bismuth compounds. Inorg. Chem. 1973, 12, 953–955. [Google Scholar] [CrossRef]
- Ettema, A.; Haas, C. AN X-ray photoemission spectroscopy study of interlayer charge-transfer in some misfit layer compounds. J. Phys.-Condens. Matter 1993, 5, 3817–3826. [Google Scholar] [CrossRef]
- Wagner, C.D.; Zatko, D.A.; Raymond, R.H. Use of the oxygen kll auger lines in identification of surface chemical-states by electron-spectroscopy for chemical-analysis. Anal. Chem. 1980, 52, 1445–1451. [Google Scholar] [CrossRef]
- Nowak, M.; Kauch, B.; Szperlich, P. Determination of energy band gap of nanocrystalline SbSI using diffuse reflectance spectroscopy. Rev. Sci. Instrum. 2009, 80, 3. [Google Scholar] [CrossRef]
- Zhou, F.; Kang, K.S.; Maxisch, T.; Ceder, G.; Morgan, D. The electronic structure and band gap of LiFePO4 and LiMnPO4. Solid State Commun. 2004, 132, 181–186. [Google Scholar] [CrossRef]
- Butler, M.A.; Ginley, D.S.; Eibschutz, M. Photoelectrolysis with YFeO3 electrodes. J. Appl. Phys. 1977, 48, 3070–3072. [Google Scholar] [CrossRef]
- Tauc, J.; Grigorovici, R.; Vancu, A.J.p.s.s. Optical properties and electronic structure of amorphous germanium. Phys. Status Solidi. 1966, 15, 627–637. [Google Scholar] [CrossRef]
- Makula, P.; Pacia, M.; Macyk, W. How To Correctly Determine the Band Gap Energy of Modified Semiconductor Photocatalysts Based on UV-Vis Spectra. J. Phys. Chem. Lett. 2018, 9, 6814–6817. [Google Scholar] [CrossRef] [PubMed]
- Cheng, X.W.; Yu, X.J.; Xing, Z.P.; Yang, L.S. Synthesis and characterization of N-doped TiO2 and its enhanced visible-light photocatalytic activity. Arab. J. Chem. 2016, 9, S1706–S1711. [Google Scholar] [CrossRef]
- Ananpattarachai, J.; Kajitvichyanukul, P.; Seraphin, S. Visible light absorption ability and photocatalytic oxidation activity of various interstitial N-doped TiO2 prepared from different nitrogen dopants. J. Hazard. Mater. 2009, 168, 253–261. [Google Scholar] [CrossRef] [PubMed]
- Kanmoni, V.G.G.; Daniel, S.; Raj, G.A.G. Photocatalytic degradation of chlorpyrifos in aqueous suspensions using nanocrystals of ZnO and TiO2. React. Kinet. Mech. Catal. 2012, 106, 325–339. [Google Scholar] [CrossRef]
- Poonam, V.; Poonam, D.D. Photocatalytic degradability of insecticide Chlorpyrifos over UV irradiated Titanium dioxide in aqueous phase. Int. J. Environ. Sci. 2012, 3, 743–755. [Google Scholar]
- Baharvand, A.; Ali, R.; Yusof, A.M.; Ibrahim, A.N.; Chandren, S.; Nur, H. Preparation of Anatase Hollow TiO2 Spheres and Their Photocatalytic Activity in the Photodegradation of Chlorpyrifos. J. Chin. Chem. Soc. 2014, 61, 1211–1216. [Google Scholar] [CrossRef]
- Majhi, D.; Bhoi, Y.P.; Samal, P.K.; Mishra, B.G. Morphology controlled synthesis and photocatalytic study of novel CuS-Bi2O2CO3 heterojunction system for chlorpyrifos degradation under visible light illumination. Appl. Surf. Sci. 2018, 455, 891–902. [Google Scholar] [CrossRef]
- Nekooie, R.; Shamspur, T.; Mostafavi, A. Novel CuO/TiO2/PANI nanocomposite: Preparation and photocatalytic investigation for chlorpyrifos degradation in water under visible light irradiation. J. Photochem. Photobiol. A Chem. 2021, 407, 113038. [Google Scholar] [CrossRef]
- Esfandian, H.; Cherati, M.R.; Khatirian, M. Electrochemical behavior and photocatalytic performance of chlorpyrifos pesticide decontamination using Ni-doped ZnO-TiO2 nanocomposite. Inorg. Chem. Commun. 2024, 159, 111750. [Google Scholar] [CrossRef]
- Balakrishnan, G.; Velavan, R.; Batoo, K.M.; Raslan, E.H. Microstructure, optical and photocatalytic properties of MgO nanoparticles. Results. Phys. 2020, 16, 4. [Google Scholar] [CrossRef]
- Ali, T.; Tripathi, P.; Azam, A.; Raza, W.; Ahmed, A.S.; Ahmed, A.; Muneer, M. Photocatalytic performance of Fe-doped TiO2 nanoparticles under visible-light irradiation. Mater. Res. Express. 2017, 4, 12. [Google Scholar] [CrossRef]
- Chen, J.; Zhao, X.; Kim, S.G.; Park, N.G. Multifunctional Chemical Linker Imidazoleacetic Acid Hydrochloride for 21% Efficient and Stable Planar Perovskite Solar Cells. Adv. Mater. 2019, 31, 1902902. [Google Scholar] [CrossRef]
- Chen, J.; Kim, S.G.; Ren, X.; Jung, H.S.; Park, N.G. Effect of bidentate and tridentate additives on the photovoltaic performance and stability of perovskite solar cells. J. Mater. Chem. A 2019, 7, 4977–4987. [Google Scholar] [CrossRef]
- Jiang, L.B.; Yuan, X.Z.; Zeng, G.M.; Liang, J.; Chen, X.H.; Yu, H.B.; Wang, H.; Wu, Z.B.; Zhang, J.; Xiong, T. In-situ synthesis of direct solid-state dual Z-scheme WO3/g-C3N4/Bi2O3 photocatalyst for the degradation of refractory pollutant. Appl. Catal. B-Environ. 2018, 227, 376–385. [Google Scholar] [CrossRef]
- Franco-Perez, M.; Gazquez, J.L. Electronegativities of Pauling and Mulliken in Density Functional Theory. J. Phys. Chem. A 2019, 123, 10065–10071. [Google Scholar] [CrossRef]
- Mousavi, M.; Habibi-Yangjeh, A.; Abitorabi, M. Fabrication of novel magnetically separable nanocomposites using graphitic carbon nitride, silver phosphate and silver chloride and their applications in photocatalytic removal of different pollutants using visible-light irradiation. J. Colloid Interface Sci. 2016, 480, 218–231. [Google Scholar] [CrossRef] [PubMed]
- Cao, W.; Jiang, C.Y.; Chen, C.; Zhou, H.F.; Wang, Y.P. A novel Z-scheme CdS/Bi4O5Br2 heterostructure with mechanism analysis: Enhanced photocatalytic performance. J. Alloys Compd. 2021, 861, 12. [Google Scholar] [CrossRef]
- Xu, S.; Gong, S.Q.; Jiang, H.; Shi, P.H.; Fan, J.C.; Xu, Q.J.; Min, Y.L. Z-scheme heterojunction through interface engineering for broad spectrum photocatalytic water splitting. Appl. Catal. B-Environ. 2020, 267, 12. [Google Scholar] [CrossRef]


| Atom | x | y | z | Occupation Factor |
|---|---|---|---|---|
| Eu | 0 | 0 | 0 | 1 |
| Sm | 0.5 | 0.5 | 0.5 | 0.5 |
| Sb | 0.5 | 0.5 | 0.5 | 0.5 |
| O(1) | −0.185 | 0.125 | 0.125 | 1 |
| O(2) | 0.125 | 0.125 | 0.125 | 1 |
| Atom | x | y | z | Occupation Factor |
|---|---|---|---|---|
| Zn | 0 | 0 | 0.5 | 1 |
| Bi | 0 | 0 | 0 | 1 |
| Eu | 0 | 0 | 0 | 1 |
| O | 0.75731 | 0.14013 | 0.08188 | 1 |
| Photocatalyst | Ratio of Catalyst to Chlorpyrifos | Conversion Rates of Chlorpyrifos (%) |
|---|---|---|
| Eu2SmSbO7/ZnBiEuO4 | 31.25 | 72.56 |
| 40.18 | 79.26 | |
| 49.11 | 82.52 | |
| 58.04 | 93.75 | |
| 66.96 | 100 | |
| 75.89 | 99.87 | |
| 84.82 | 96.54 |
| Photocatalyst | Radiation | Irradiation Time (min) | Pesticide | Conversion Rates (%) | Ref. |
|---|---|---|---|---|---|
| TiO2/H2O2 | UV | 300 | Chlorpyrifos | 70 | [102] |
| Hollow TiO2 | UV | 180 | Chlorpyrifos | 75.21 | [103] |
| Cu/ZnO | Solar light | 240 | Chlorpyrifos | 81 | [61] |
| TiO2/H2O2 | Solar light | 300 | Chlorpyrifos | 83 | [102] |
| CuS/Bi2O2CO3 | Visible light | 180 | Chlorpyrifos | >95 | [104] |
| CuO/TiO2 | Visible light | 90 | Chlorpyrifos | 60 | [105] |
| Ni-doped ZnO/TiO2 | Visible light | 140 | Chlorpyrifos | 75.5 | [106] |
| Eu2SmSbO7 | Visible light | 160 | Chlorpyrifos | 88.16 | This study |
| EZHP | Visible light | 160 | Chlorpyrifos | 100 | This study |
| Eu2SmSbO7 | ZnBiEuO4 | Eu2SmSbO7/ZnBiEuO4 | |
|---|---|---|---|
| 3.1295 × 10¹⁰ | 2.4041 × 10¹³ | 39.4378 | |
| (ns) | 1.5094 | 1.1692 | 7.6479 |
| 0.0455 | 2.2526 | 811.5324 | |
| (ns) | 140.8084 | 11.1017 | 2.3793 |
| (ns) | 1.5094 | 1.1692 | 3.0910 |
Disclaimer/Publisher’s Note: The statements, opinions and data contained in all publications are solely those of the individual author(s) and contributor(s) and not of MDPI and/or the editor(s). MDPI and/or the editor(s) disclaim responsibility for any injury to people or property resulting from any ideas, methods, instructions or products referred to in the content. |
© 2024 by the authors. Licensee MDPI, Basel, Switzerland. This article is an open access article distributed under the terms and conditions of the Creative Commons Attribution (CC BY) license (https://creativecommons.org/licenses/by/4.0/).
Share and Cite
Luan, J.; Wang, Y.; Yao, Y.; Hao, L.; Li, J.; Cao, Y. Preparation and Property Characterization of Eu2SmSbO7/ZnBiEuO4 Heterojunction Photocatalysts and Photocatalytic Degradation of Chlorpyrifos under Visible Light Irradiation. Catalysts 2024, 14, 144. https://doi.org/10.3390/catal14020144
Luan J, Wang Y, Yao Y, Hao L, Li J, Cao Y. Preparation and Property Characterization of Eu2SmSbO7/ZnBiEuO4 Heterojunction Photocatalysts and Photocatalytic Degradation of Chlorpyrifos under Visible Light Irradiation. Catalysts. 2024; 14(2):144. https://doi.org/10.3390/catal14020144
Chicago/Turabian StyleLuan, Jingfei, Yichun Wang, Ye Yao, Liang Hao, Jun Li, and Yu Cao. 2024. "Preparation and Property Characterization of Eu2SmSbO7/ZnBiEuO4 Heterojunction Photocatalysts and Photocatalytic Degradation of Chlorpyrifos under Visible Light Irradiation" Catalysts 14, no. 2: 144. https://doi.org/10.3390/catal14020144