Article

Influence of the La0.2Sr0.7Ti0.95Ni0.05O3 (LSTN) Synthesis Method on SOFC Anode Performance

1
Department of Materials Science and Engineering, Faculty of Engineering, Tel Aviv University, Tel Aviv 6997801, Israel
2
Faculty of Exact Sciences, School of Chemistry, Tel Aviv University, Tel Aviv 6997801, Israel
3
Department of Materials Engineering, Faculty of Engineering Sciences, Ben-Gurion University of the Negev, Beer Sheva 84105, Israel
*
Author to whom correspondence should be addressed.
Catalysts 2024, 14(1), 79; https://doi.org/10.3390/catal14010079
Submission received: 2 January 2024 / Revised: 14 January 2024 / Accepted: 15 January 2024 / Published: 18 January 2024
(This article belongs to the Topic Advances in Inorganic Synthesis)

Abstract

:
Solid oxide fuel cells are characterized by a high efficiency for converting chemical energy into electricity and fuel flexibility. This research work focuses on developing durable and efficient anodes for solid oxide fuel cells (SOFCs) based on exsolving nickel from the perovskite structure. A-site-deficient La- and Ni-doped strontium titanates (La0.2Sr0.7Ti0.95Ni0.05O3−δ, LSTN) were synthesized using four different techniques and mixed with Ce0.8Gd0.2O2−δ (GDC) to form the SOFC anode. The synthesis routes of interest for comparison included solid-state, sol-gel, hydrothermal, and co-precipitation methods. LSTN powders were characterized via XRD, SEM, TPR, BET and XPS. In situ XRD during reduction was measured and the reduced powders were analyzed using TEM. The impact of synthesis route on SOFC performance was investigated. All samples were highly durable when kept at 0.5 V for 48 h at 800 °C with H2 fuel. Interestingly, the best performance was observed for the cell with the LSTN anode prepared via co-precipitation, while the conventional solid-state synthesis method only achieved the second-best results.

1. Introduction

Solid oxide fuel cells (SOFCs) have been extensively researched as one of the most efficient and environmentally friendly technologies for directly generating power from versatile fuels, requiring relatively low catalyst and maintenance costs [1]. The main bottleneck for reducing the overall cell polarization losses are the electrochemical reactions at the electrodes. The hydrogen oxidation reaction (HOR) at the anode is one of the most important electrode reactions in SOFCs [2]. The HOR takes place at the triple-phase boundaries (TPB) between the gas, the electronically conducting phase, and the ionic conducting phase. To increase the amount of TPBs, fabrication and processing techniques should be selected to obtain a highly porous structure with appreciable continuity of the ionic/electronic conduction pathways. Cermets such as Ni-YSZ, which are widely used as anode materials, suffer from redox instability and agglomeration upon prolonged usage at high temperatures. Perovskites, and in particular La-doped SrTiO3 (LST), have been demonstrated as promising alternative materials for SOFC anodes due to their electrocatalytic behavior towards HOR, matching the thermal expansion to yttrium-stabilized zirconia (YSZ) electrolyte, their high tolerance to fuels containing oxygen, carbon, and sulfur, and their redox cycling [3].
The structure of perovskites provides an extended length of TPBs, and the high availability of oxygen throughout the structure facilitates the oxidation of poisoning compounds based on carbon and sulfur. Donor doping, such as lanthanum (La) on strontium (Sr) sites in SrTiO3, remarkably increases electronic conductivity, while acceptor doping, such as nickel (Ni) on titanium (Ti) sites, can improve ionic conductivity by increasing oxygen vacancy concentration [4]. It was shown that A-site-deficient La-doped SrTiO3 anodes had improved electrical performance [5,6], ionic conductivity [4], redox and thermal stability and fast kinetics. Park and Choi [7,8] showed high anode performance and stability both with hydrogen fuel and methane for A-site-deficient La- and Ni-co-doped SrTiO3 composites with Ce0.8Gd0.2O2−δ (GDC). Ni as a doping agent has the additional advantage of being a good oxidation and reforming catalyst where GDC is added to provide stronger ionic conduction path.
Perovskites can be synthesized via many different routes, each resulting in a unique microstructure with a large impact on the ionic and electronic conduction of the material [9]. Previous work has shown how different synthesis procedures of perovskites influence the microstructure, and in turn, modulate the catalytic activity and stability [10]. Perovskites synthesized by means of different approaches were shown to have different catalytic activities for the oxygen evolution reaction (OER) due to variation in the surface oxidation states of the B-site cations [11]. Different synthesis routes of perovskites used as SOFC cathodes were thoroughly studied in the literature and were shown to affect morphology, stability under oxidizing and reducing atmospheres [12], electrical conductivity [13,14], catalytic activity [15] and electrochemical performance [16]. The most conventional synthesis method of such ceramics, particularly in SOFCs, is the solid-state reaction. This is an energy-intensive process, requiring high temperatures (usually in excess of 1200 °C for efficient diffusion), long periods of time (typically days) and extensive ball milling and mixing to achieve homogeneity and reduce particle size and distribution resulting from sintering.
Alternative wet chemical techniques can be used to produce the same ceramic phases at significantly lower temperatures, including co-precipitation, sol-gel techniques, hydrothermal techniques, spray or freeze drying, and combustion, among others [9]. Many of these wet techniques are versatile in the choice of process parameters, such as the solvents, temperature, pH, chelating or precipitation agents and their ratios, etc., allowing for the optimization of the properties of the ceramic according to its desired functionality [17]. Moreover, wet chemistry synthetic methods can be used to create unique nanostructures with enhanced catalytic and electrocatalytic activity [18]. The catalytic activity of perovskite anodes can be further enhanced by means of the exsolution of nanoparticle catalysts, with stronger metal–support interaction than traditionally deposited particles (i.e., using incipient wetness) [19,20]. Exsolution is the process where reducible cations in the ceramic backbone undergo selective reduction and separate as metallic nanoparticles on or near the surface. Since SOFC anodes are operated in a strongly reducing atmosphere at high temperatures, exsolution occurs in operando [21]. A-site deficiency and a high oxygen vacancy concentration are driving forces influencing the exsolution at B-sites [22,23].
In this paper, anodes made from A-site-deficient La- and Ni-co-doped strontium titanate, Sr0.7La0.2Ti0.95Ni0.05O3-δ (LSTN), were synthesized via four different routes: the solid-state reaction (SS), sol-gel synthesis (SG), hydrothermal synthesis (HT) and co-precipitation (CP). The LSTN was mixed with GDC and compared based on structure, electrochemical properties, performance, and stability in a YSZ-supported SOFC cell using H2/air. This comparison lays the foundation for considering wet chemical synthesis methods as a potential replacement for the common solid-state synthesis technique, in light of performance enhancement of the resultant fuel cell.

2. Results and Discussion

2.1. LSTN Powders Characterization

XRD patterns of the LSTN powders prepared via the different routes are shown in Figure 1. The highest phase purity for LSTN was achieved for the solid-state sample, although a small peak of a secondary Sr2TiO4 Ruddlesden–Popper (RP) phase was observed. The wet techniques, particularly the hydrothermal synthesis, resulted in several secondary phases which could not be removed, even by using higher calcination temperatures. Table 1 summarizes the four samples with respect to their calcination temperature, crystallographic phases observed in XRD, refined lattice parameters, and BET surface area. Similar particle size distributions of LSTN samples were achieved after ball milling, as observed in SEM (Figure S1). Despite the similarity in size, a large variation in BET surface area was measured for the samples prepared, where the largest surface area of CP was more than twice that of the sample with the smallest surface area (solid-state, SS). The SS reaction resulted in a reduced surface area compared to the wet techniques owing to the long-duration high-temperature sintering required for phase purity, and therefore motivates the study into solution-based synthesis methods. SG synthesis resulted in a BET surface area close to that of the SS sample due to the combustion stage which can reach very high local temperatures and lead to similar sintering. Both HT and CP processes resulted in high-surface-area powders compared to the other techniques, the latter even after heat treatment at 900 °C for 2 h in air, which was necessary to provide a crystalline product.
Typical results of Rietveld refinement for SG and CP LSTN samples before exsolution refined to cubic and tetragonal structures are shown in Figure S2. The results for all LSTN samples before and after exsolution are given in Table S1. Increasing La doping in A-site-deficient SrTiO3 reduced the cell parameters [6] and distorted the cubic perovskite phase into a tetragonal phase, while high La contents distorted the lattice into an orthorhombic phase [24]. The lattice distortion into tetragonal and orthorhombic structures in A-site deficient perovskite was caused by A-site cation-vacancy ordering which was shown to be affected not only by La content, but also by steps in the synthesis procedure such as the quenching rate [25]. Therefore, this phenomenon can occur differently in samples with the same stoichiometry synthesized by means of different methods, as shown here. While the majority of SS, SG and HT LSTN samples before and after exsolution were refined to a cubic phase (PDF card no. 00-005-0634), the CP sample before exsolution provided above 90 wt% in favor of the tetragonal phase (PDF card no. 04-025-4518), and the ratio of cubic to tetragonal content was overturned only after exsolution.
XPS measurements of the as-synthesized LSTN powders, as well as powders after 3 min of sputter cleaning, were taken in order to learn about the chemical states of each element in the catalyst powder. XPS spectra comparison is shown in Figure 2, and a summary of the binding energies for each peak is provided in Table S3. All sample spectra were shifted to match the adventitious C1s peak at 284.8 eV (as shown in Figure S3) [26], which was nearly completely removed after sputter cleaning. For the HT sample, a doublet of the K 2p peak was detected on the surface, likely a remnant from the synthesis mixture containing potassium hydroxide, and was this also removed via sputtering. Ar ion sputtering was shown by us and others to create O deficiencies and splitting the titanium oxide into a range of suboxides from TiO2 to metallic Ti [27,28]. This is evident here in the wide shoulder created for the Ti 2p core level towards lower binding energies and the reduction in the height of the main peak after sputtering (Figure S3). This effect was observed for all LSTN samples except the HT sample, which retained the same Ti 2p peak shape before and after sputtering. Therefore, the core level XPS signals of the elements before sputtering will be considered for evaluating their chemical states. By means of the deconvolution of Ti 2p3/2 peaks of all samples before sputtering, a main peak at the range of 458.2–458.7 eV was identified, attributed to Ti+4 (458.6 eV is typical for SrTiO3 [28]), as well as a secondary peak at around 457.0–457.5, attributed to Ti+3 (456.7 eV is typical for Ti2O3 [29]), except for the CP sample, which exhibited a symmetric Ti 2p3/2 peak compatible with Ti+4. The secondary Ti 2p3/2 peak of SS has a considerably higher intensity with respect to the main peak.
The Sr 3d core electron also produced a doublet, as shown in Figure 2. The main Sr 3d5/2 peak position was around 132.8–132.9 eV for the SG, HT and CP samples, and in the SS sample, the signal can be deconvoluted into two peaks at 132.8 eV and 133.3 eV. The lower energy position is typical for SrTiO3 [30] and the higher one in the SS sample can be assigned to surface oxides and hydroxides [31], since there is no indication of a higher carbonate content in the SS sample compared to the other samples according to the C 1s peaks. The Sr 3d peaks before and after sputtering exhibit an opposite trend to that of Ti 2p. For the SS, SG and HT samples before sputtering, a shoulder at lower binding energies was observed, which may suggest the reduction of some of Sr+2 on the surface to lower oxidation states for charge compensation. The Sr 3d5/2 peak of the CP sample was symmetrical to the Ti 2p3/2 peak of this sample. This implies that there were fewer defects on the surface of the CP sample compared to the other samples. All the secondary peaks disappeared after sputtering and the Sr 3d5/2 peaks of all of the samples, including CP, shifted to higher binding energies of 133.1–133.4 eV.
O 1s peaks of all LSTN samples were asymmetric, indicating the presence of contaminations [32]. Via deconvolution, a main peak in the range of 529.9–531.1 eV and a secondary peak in the range of 531.3–532.0 eV were detected. The secondary peak can be ascribed to hydroxyl species, which have been shown to exist on SrTiO3 surfaces and are more abundant in samples oxidized in air instead of pure oxygen [28], as was the case for the SS, SG and CP LSTN samples in this work. The HT sample which was synthesized in a basic hydrothermal environment was even more prone to hydroxyl adsorption, and indeed, the height of the secondary peak was closest to the main O 1s peak in the HT sample.
The La 3d signal for La+3 has a distinctive shape consisting of four peaks: 3d5/2, 3d5/2 satellite, 3d3/2 and 3d3/2 satellite. These peaks were detected for all samples before sputtering, as shown in Figure 2, with the La 3d5/2 peak at 833.9–834.5 eV with doublet and satellite differences as listed in Table S3. This corresponds to the expected peak positions for La+3 [33]. For all of the samples, an additional less intense doublet between the satellite peaks was fitted, which indicates the presence of lanthanum oxide/hydroxides and confirms the interpretation of the O 1s peak [31].
The XPS analysis of nickel is complicated for these LSTN samples due to the overlap between the La 3d and Ni 2p signals and the low concentration of nickel. Before sputtering, a Ni 2p signal could be detected only for the HT and CP samples (as shown in Figure 2), apparently owing to their large surface area, as determined by BET. Small peaks at 872.5 eV and 872.7 eV were found for HT and CP, respectively, corresponding to 2p1/2 signal of NiO. For HT sample, also the satellite of this peak could be detected. In both samples, an additional peak was visible at 874.3 eV and 874.2 eV, which can also belong to NiO 2p1/2 [34], or could imply the presence of Ni0 on the surface by assigning it to 2p1/2 satellite of metallic nickel [35].
Sputtering revealed the Ni 3p core electron for all samples. These signals were fitted into two peaks: one at 65.6–66.1 eV and another one at 67.6–68.0 eV. This suggests that nickel exists in both oxidation states. While the first peak is assigned to Ni metal 3p3/2, the second peak cannot be unambiguously identified, but it could coincide with nickel hydroxide 3p3/2 [36].
Table S2 summarizes the surface elemental ratios for the different LSTN synthesis routes as measured by XPS before and after sputtering (i.e., surface ratio) in comparison to SEM-EDX. Different trends of metal distribution before and after sputtering are observed for each sample; however, a noticeable general trend is that the levels of A-site metals as measured by EDX are lower, while the level of B-site metals are higher compared to those measured by XPS. The difference between XPS and EDX results arise from the different depths of data collection. While XPS is more a surface analysis technique, collecting data within 10 nm of the outer surface, EDX provides average elemental concentrations over a depth that extends ~1 µm into the material with a pear-shaped volume [37]. Therefore, the amounts measured by EDX describe a deeper and wider layer into the bulk. It can be deduced from the XPS results that there is a segregation of A-site metals (Sr and La) close to the surface. The development of an A-site enrichment surface is a known phenomenon in perovskites, particularly for SrTiO3 annealed in oxidizing conditions at high temperatures [38]. This phenomenon caused the formation of A-site rich phases on the surface detected by means of XRD (Figure 1) in all LSTN phases: the Ruddlesden–Popper (RP) perovskite phase, Sr2TiO4, found in the SS and SG samples, and LaSrO2.5 found in the HT and CP samples. The Sr/La ratios were close to the nominal ratios and similar in XPS and EDX. In the HT sample, a relatively large amount of lanthanum was measured on the surface, expressed by the low Sr/La ratios in XPS. This lanthanum is likely to exist as lanthanum hydroxide, as discussed previously in XPS spectrum analysis. While A-site excess was measured on the surface of all LSTN samples according to XPS, A-site deficiency was measured at greater depths via EDX in the SS, SG and CP samples. A-site excess in the HT sample was also supported by EDX, having an influence on the Ni exsolution process as discussed below. It was apparent that the Ni amounts are underestimated by XPS analysis due to the overlap between La and Ni signals. Thus, the Ni amounts measured by EDX were more reliable. The Ti/Ni ratios in the SS and CP samples were close to nominal ratios, indicating good incorporation of Ti and Ni in the perovskite structure. Lower Ti/Ni ratios were measured in the other two samples, arising from excess Ni in the SG sample and the lack of Ti in the HT sample.

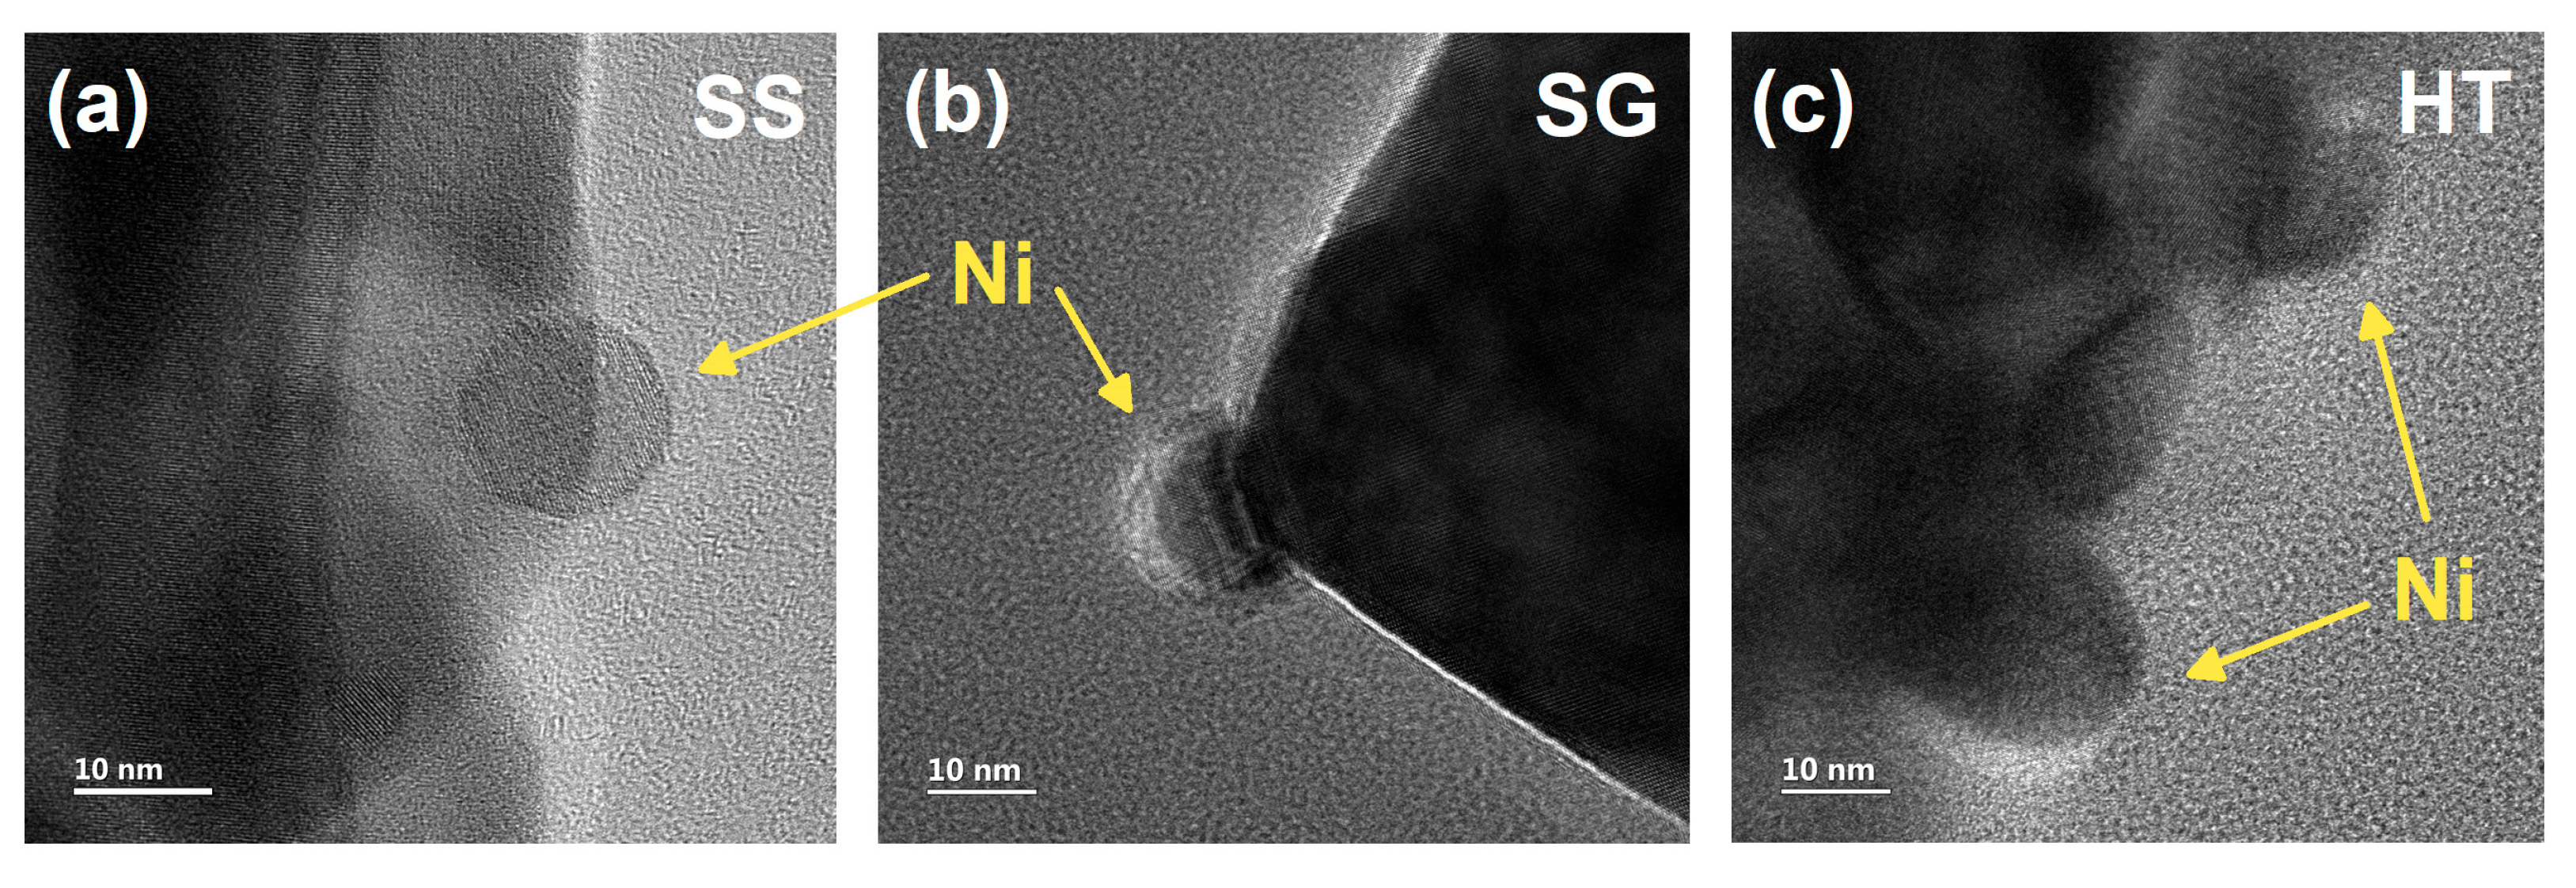
2.2. Nickel Exsolution from LSTN

Temperature programmed reduction (TPR) profiles for the different LSTN variants were measured to learn about the exsolution process, accompanied by in situ XRD measurements in the same 5% H2 atmosphere in order to verify the key temperatures in the Ni exsolution process. TEM was then performed on the reduced samples to investigate the structure and dispersion of exsolved Ni particles. The TPR profiles of the SS, SG and CP LSTN samples shown in Figure 3 exhibit distinct double features with a less intense peak at a lower temperature and a higher peak at a higher temperature. This is a typical reduction profile for LSTN perovskites, where the lower peak is assigned to a reduction step from Ni+3 to Ni+2 and the higher peak is assigned to the reduction of Ni+2 to Ni0 [39,40,41]. The TPR profile for the SS sample shows that the two-step reduction of lattice nickel began at about 550 °C, and indeed, metallic Ni began to appear in the in situ XRD at this temperature (Figure S4). Exsolved Ni particles with a size of 15–20 nm embedded in the surface of SS LSTN were found by means of TEM (Figure 4). The exsolution process in the SG sample started at a lower temperature of about 450 °C (Figure 3), which is corroborated by the in situ XRD in Figure S4. This exsolution resulted in 10–30 nm Ni particles being embedded in the SG LSTN surface, as shown in Figure 4. The TPR profile of the HT sample (Figure 3) shows only a sharp peak at around 500 °C. The growth of a metallic Ni 111 peak at 2θ = 44.5 could not be detected by means of in situ XRD since the contaminant peaks of SrCO3 and La2O2CO3 were in the same 2θ region (Figure S4) and no exsolved Ni particles were found via TEM on the HT LSTN surface. Therefore, it can be assumed that an exsolution process did not occur in this sample, and the TPR peak can be ascribed to the reduction of Ti+4 to Ti+3 [40]. A general driving force for exsolution in perovskite is oxygen vacancy formation [42]. It is postulated that secondary phases formed during HT synthesis, as detected in XRD (Figure 1 and Table 1), reduced the oxygen vacancy concentration, thereby hindered the exsolution process. The reduction process in CP LSTN began at about 470 °C and continued until the end of the measurement at 800 °C. Metallic Ni peaks started to grow at 500 °C in the in situ XRD scans (Figure S4), and many exsolved Ni particles with sizes of 15–25 nm were found on the CP LSTN surface using TEM (Figure 4), confirming that exsolution occurred in this temperature range. The lower starting temperature implies that the SG and CP samples favored Ni exsolution more than the SS sample. The long exsolution process in the CP sample resulted in a large dispersion of Ni nanoparticles, as observed using TEM. It was observed that the Ruddlesden–Popper (RP) stacking faults that formed during the CP synthesis of LaNiO3 acted as nucleation sites for Ni particles’ growth during exsolution. These stacking faults were not observed in LaNiO3 synthesized using the HT route [43]. It was also shown that the RP stacking fault density in LaFeO3 (LF) varied considerably as a function of the synthetic route. While a high RP fault density was found in CP-LF, a lower, yet still significant, density was found in SG-LF and no stacking faults were found in combustion-synthesized LF [44]. TEM micrographs revealed socketed Ni nanoparticles in the SS, SG and CP LSTN samples (Figure 4). This socketing effect is expected to lead to a low tendency of Ni agglomeration on the LSTN anodes. This in turn resists coke formation with the use of carbon-based fuels owing to the strong metal–substrate interaction [45].

2.3. Fuel Cell Performance

As-prepared LSTN samples (i.e., unreduced) were mixed with 30% GDC and used as SOFC anodes with pure H2 fuel. The performance of the cells improved with operation time, as shown in Figure S5, due to the in situ exsolution of nickel particles. In the fuel cell with the CP LSTN-GDC anode, the maximum power density more than doubled from 56 mW/cm2 at the beginning of the experiment at 800 °C to 136 mW/cm2 after 52 h of cell operation. In the fuel cell with the SS anode, there was also a fast improvement in maximum power density, from 50 mW/cm2 at the start to 102 mW/cm2 after only 4 h. However, after the 48 h stability test, the maximum power density slightly reduced due to lower activity in the kinetic region. The performance of the fuel cell with the SG anode was mass-transport-limited, evident by a sharp drop in cell voltage at high overpotentials. This barrier could not be overcome after the long-term in situ reduction via the exsolution process. The HT sample also showed a significant improvement in fuel cell performance after the 48 h stability test. However, the highest power density it reached, 47 mW/cm2, was not competitive with the other fuel cells. Figure 5 shows a comparison between the I–V–P curves of all four samples after the 48 h stability tests.
Surprisingly, the anode with the CP sample provided the best fuel cell performance both in the kinetic region and in the mass transport region. This sample was characterized by a large surface area, high phase purity, and a high tendency for nickel exsolution. The activity of both the SS and SG fuel cells was limited by their lower surface areas, and in the SG sample, non-conductive impurities could have blocked potential triple-phase boundaries (TPBs), thereby reducing mass transport. The low surface area of these samples resulted in fewer catalytic sites of surface nickel particles, reducing the kinetic rate of the hydrogen oxidation reaction (HOR) on the anode. For the HT sample, where the nickel exsolution was not as abundant as in the other samples and many impurities were detected, the fuel cell performance was the lowest.
Many review articles published in recent years [46,47,48] compared the electrochemical performance of SOFCs with LST-based and similar anodes; however, most reported that SOFC performance was tested with humidified H2 fuels, whereas the cell performance reported here was tested with dry H2 fuel, reducing cell performance by limiting the hydrogen oxidation reaction (HOR) [49]. Moreover, it is worth mentioning the significance of electrolyte thickness on the SOFC performance [50]. In this work, electrolyte-supported cells were fabricated with an electrolyte thickness of ~100 μm (Figure S7), having a crucial effect on the overall ohmic resistance.

2.4. Electrochemical Impedance Spectroscopy and Stability Testing

To further investigate the differences in the electrochemical properties and stability of the fuel cells, electrochemical impedance spectroscopy (EIS) was performed at OCV before and after the 48 h stability test, and Nyquist plots are shown in Figure S6. The impedance spectra were fitted by an equivalent circuit (shown in Figure 6) containing a series consisting of an inductor L attributed to wire connectors, a resistor Rs for ohmic resistance throughout the cell, and two or three RQ components where R is a resistor and Q is a constant-phase element (CPE) attributed to different processes in the electrodes.
It was found that the RQ arcs correspond to three processes in three different frequency regions: high frequency, ~3 kHz; medium frequency, ~6 Hz; and low frequency, ~0.2 Hz. The high-frequency arc is related to charge transfer at the anode and electrolyte interface [51]. The medium-frequency arc is associated with processes at the TPBs in the anode, and the resistivity correlates inversely with TPB density. The impedance from anode processes at the medium frequency can also overlap with impedance from LSCF cathode processes [52]. The low-frequency arc is related to a complex mechanism in GDC in the anode known as chemical capacitance, which includes hydrogen adsorption and the dissociation or recombination of adsorbed species as possible rate limiting steps [53].
The fitted parameters of the equivalent circuit are given in Table S4. The ohmic resistance Rs in all cells reduced after the stability test, as the LSTN phase reduced. The ionic conductivity was increased by the reduction of Ti+4 to Ti+3 owing to the creation of O vacancies, and the electronic conductivity increased with Ni particles’ exsolution. The charge transfer step in HOR is influenced by both the electronic and ionic conductivity of the electrolyte surface [49]. The resistivity for this process according to the high-frequency arcs seen in Figure 6 and Figure S6 is low compared to the other processes, indicating a good interface between the anode and the electrolyte. In some cases, this arc is overlapped by the inductance signal due to wiring. The medium-frequency arc did not show any notable differences before and after the stability test for all of the cells except for the HT fuel cell, where a drop was observed after the stability test. Since an identical cathode was used in all fuel cells, the cathodic process’ contribution to the medium-frequency arc was similar for all cells. Therefore, the measured medium-frequency resistance provides an indication of the TPB density. From this observation, it is derived that the TPB structure did not change in the SS, SG and CP fuel cells during cell operation, and no agglomerates were formed. This is also reinforced by the SEM images of cells’ cross-sections post-operation. The decrease in the medium-frequency arc in the HT fuel cell could be affected by in situ reduction processes under the H2 environment, changing the TPB structure. The largest arc and the highest resistance for all fuel cells was observed for the low-frequency arc related to the chemical capacitance, as mentioned above. This arc did not show a large change in the CP fuel cell, showed a slight increase in the SS and SG fuel cells, and displayed a large decrease in the HT cell. This process is limited by H2 adsorption and the dissociation or recombination of adsorbed species, and is also related to the GDC surface area. Highly dispersed Ni nanoparticles act as catalytic sites for H2 adsorption. Therefore, this result can explain the high performance of the CP fuel cell compared to the rest, especially at high overpotential, where mass transport is the main limitation. The rate-limiting step in hydrogen oxidation was catalyzed by the high dispersion of exsolved nickel particles and the large surface area of CP LSTN as an ionic conductor and its good mixing with the GDC reinforcement. The overall polarization resistance Rp is similar for the SS, SG and CP fuel cells after the stability test. However, it is demonstrated by the polarization curves and the impedance analysis that the low-frequency process of chemical capacitance is the most dominant.
The current density of the cells was held at 0.5 V for 48 h and is shown in Figure 7. These measurements reflect all of the electrochemical characterization results presented above. A high rise in performance is observed for the CP and HT fuel cells during the stability test, though the latter exhibits low activity compared to the rest. The SS and SG fuel cells show a constant performance throughout the measurement. None of the fuel cells experienced a drop in activity or degradation. This indicates the high durability of all of the cells. The exsolution of socketed Ni nanoparticles in the anodes led to the high stability of the cells, as discussed in the section analyzing Ni exsolution results above.
SEM cross-sectional images of the LSTN-GDC anodes were taken after the stability test (Figure 8). The differences in microstructure and surface area are substantial in these images. No cracking or sintering can be observed in any of the anodes, and good adhesion between the anodes and the YSZ electrolyte is apparent.

3. Experimental

3.1. Catalyst Precursors and Chemicals

Titanium(IV) oxide (99%, Aldrich, Jerusalem, Israel), strontium carbonate (99.994%, Alfa Aeser, Ward Hill, MA, USA), lanthanum(III) oxide (99.99%, Acros Organics, Antwerp, Israel), nickel(II) oxide black (Fisher Scientific, Pittsburgh, PA, USA), titanium(IV) butoxide (99.95%, Strem, Boston, MA, USA), ethanol absolute (Bio-lab, Jerusalem, Israel), strontium(II) nitrate (99.995%, Aldrich, Jerusalem, Israel), lanthanum(III) nitrate (99.999%, Merck, Rahway, NJ, USA), nickel(II) nitrate (99.999%, Merck, Rahway, NJ, USA), citric acid (Bio-lab, Jerusalem, Israel), ethylene glycol (Alfa Aeser, Ward Hill, MA, USA), strontium(II) chloride (95%, Alfa Aeser, Ward Hill, MA, USA), potassium hydroxide (Merck, Rahway, NJ, USA) and oxalic acid (Aldrich, Jerusalem, Israel) were used as starting materials to synthesize LSTN powders via different routes.

3.2. LSTN Catalyst Synthesis

LSTN powders were synthesized via four different routes, as described schematically in Figure 9. The detailed procedures are given below.

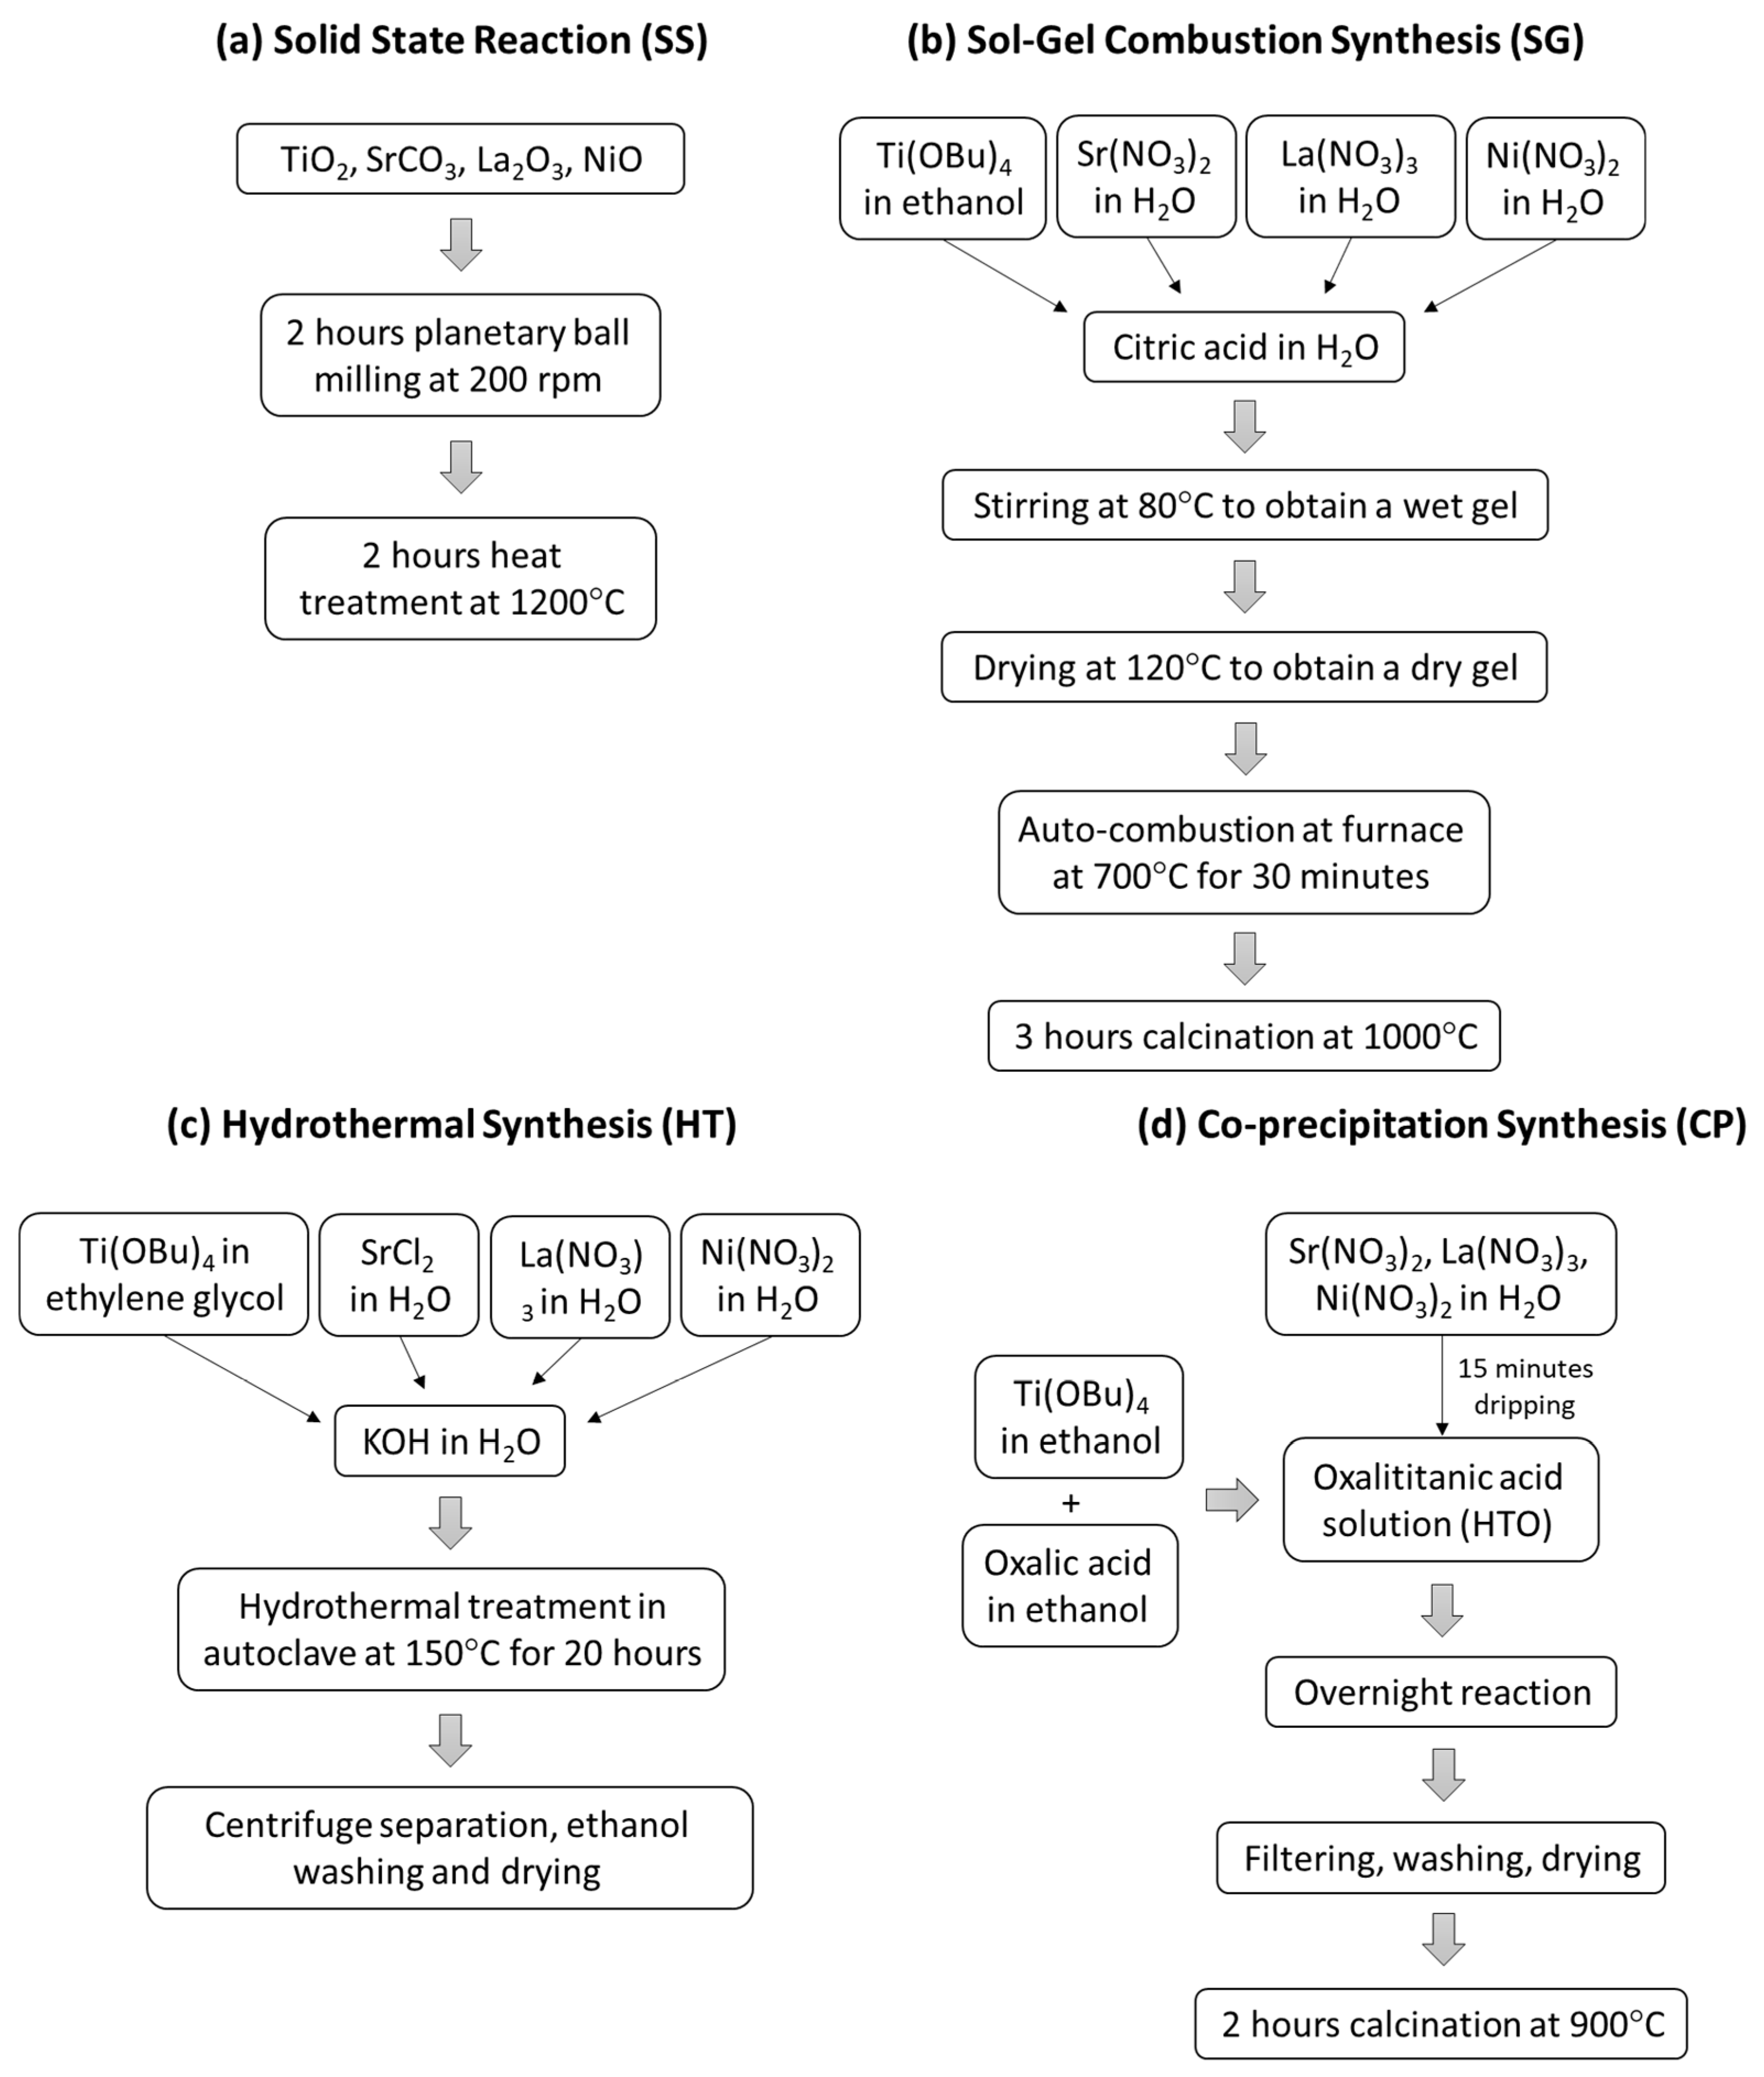
3.2.1. Solid State Reaction

Based on the work of Tao and Irvine [54], appropriate at% of the metal oxides were ground together in a planetary ball mill in a zirconia crucible with zirconia balls at 600 rpm for a total time of 2 h. The milled powder was extracted with acetone and dried on a hot plate, resulting in a paste. The paste was heat-treated at 1200 °C for 2 h, resulting in the final perovskite powder.

3.2.2. Sol-Gel Combustion Synthesis

Based on the procedure reported by Cheng [55], titanium butoxide was dissolved in ethanol. The desired atomic ratios of Sr, La and Ni nitrates were dissolved in water. The cationic solutions were added to a solution of citric acid in water at an atomic ratio of 3:1 to the stoichiometric amount of B-sites (Ti + Ni). The mixture was stirred on a hot plate at 80 °C to obtain a wet gel, and then at 120 °C until the gel was dry. The dry gel was heated in an oven at 700 °C for 30 min for auto-combustion to occur and then calcined for 3 h at 1000 °C to obtain the final peroxide powder.

3.2.3. Hydrothermal Synthesis

Based on the work of Beale et al. [56], titanium butoxide was dissolved in ethylene glycol at an atomic ratio of 1:1 to the stoichiometric amount of B-sites. Appropriate amounts of strontium chloride and La and Ni nitrates were dissolved in water. All cationic solutions were added and mixed with potassium hydroxide solution in water at a ratio of 5 times the stoichiometric amount of B-sites. The mixture was transferred to a ceramic crucible inside a Teflon-lined autoclave and water was added to fill 50% of the crucible. Hydrothermal treatment took place at 150 °C for 20 h. This resulted in a suspension that was separated from water by a centrifuge, washed with ethanol and dried to obtain the final perovskite powder.

3.2.4. Co-Precipitation Synthesis

Based on the procedure of Zhang et al. [57], titanium butoxide was dissolved in ethanol and added to a solution of oxalic acid in ethanol to obtain a clear oxaltitanic acid solution (H2TiO(C2O4)2, HTO). A mixture of Sr, La and Ni nitrates at the desired ratio was dissolved in water and dripped into an HTO solution with constant stirring in 15 min. The resulting precursor was left overnight for the reaction to complete. The precipitate was filtered, washed, dried and calcined at 900 °C for 2 h to obtain the final perovskite powder.

3.3. Fuel Cell Fabrication

The catalyst powders were ball milled to obtain similar sub-micron particle sizes and mixed with a dispersant, solvent, and binder from Fiaxell to achieve a stabilized ink. The catalyst ink was combined with gadolinium-doped ceria (GDC) ink (Fiaxell, Lausanne, Switzerland) to obtain 30%wt of solid GDC in the perovskite–GDC mixture. Yttrium-stabilized zirconia (YSZ) discs (Fiaxell) that were 30 mm in diameter and 100 μm thick were used as electrolytes. These were screen printed on one side with (La0.60Sr0.40)0.95Co0.20Fe0.80O3-δ (LSCF) cathode ink (Fiaxell) with a GDC protecting layer, and on the other side were screen printed with a 14 mm diameter, 10 μm thick layer of the perovskite/30%GDC anode ink. The anode and cathode coatings were calcined in air at 1200 °C and 1000 °C, respectively.

3.4. Fuel Cell Performance and Stability Testing

Single-cell tests were performed in an open flange SOFC test set up from Fiaxell. Cells were tested at 800 °C, with 500 cm3/min air and 300 cm3/min dry hydrogen flows on the cathode and anode, respectively. Anodes were reduced in situ before tests. Electrochemical tests were conducted using a SP-300 potentiostat with EC-lab software (v.11) from BioLogic (Seyssinet-Pariset, France). Linear current sweeps from OCP to zero potential between the anode and reference electrode were performed from the beginning of the in situ reduction to after 4 h of reduction with 2 h intervals, and then after 48 h of stability testing under 0.5 V vs. Eref. The current passing through the cells was measured during the stability test. Electrochemical impedance spectroscopy (EIS) was obtained with a 20 mV amplitude from OCV over the frequency range of 0.1 Hz to 1 MHz. Microstructure and chemical composition maps of cell cross-sections after the stability test were examined using FEI ESEM Quanta 200 (Oregon, Washington, DC, USA) equipped with Oxford-INCA (UK) EDX system. Spent anode powders were also examined using Philips Tecnai (Oregon, Washington, DC, USA) F20 TEM with Schottky FEG

3.5. Material Characterization

The crystallographic structure of the as-prepared perovskite powders was analyzed using powder XRD. Measurements were taken in Bruker (Leipzig, Germany) AXSA D8 Advance with a CuKα radiation source and processed in Diffrac.EVA software (v. 10) provided by Bruker. The microstructure and chemical composition of the ball-milled powders were examined using SEM-EDX. Elemental analysis of the as-prepared powders was conducted via XPS in UHV using a 5600 Multi-Technique System (PHI, Chanhassen, MN, USA) with an Al Kα irradiation source. The sample powders for XPS measurements were drop-cast on silica substrates using isopropanol solvent and dried using a N2 flow. XPS was performed for the as-received LSTN powders before and after 3 min of sputter cleaning with Ar ions. The BET surface area of the powders was measured in Quantachrome (Boynton Beach, FL, USA) ChemBET Pulsar equipped with a TCD detector. The reduction and exsolution processes of the powders were analyzed via several approaches: programmed reduction (TPR) analysis, performed under 5% H2 in N2 at a 10 K/min heating rate in the Quantachrome instrument; in situ XRD measurement under 5% H2 in N2 flow using an Anton Paar (Graz, Austria) XRK 900 reactor chamber taken from room temperature up to 890 °C with 50 °C steps between 400 °C and 890 °C, with 1 h between heating steps and a 30 min stabilization time before each measurement; and the powders were reduced under 10% H2 at 800 C for 4 h. The reduced powders were measured using XRD and their microstructures were analyzed using TEM to detect the exsolved Ni particles. Rietveld analysis of the XRD data before and after reduction was performed using TOPAS v 5.0 software (Bruker, Leipzig, Germany). Refined background parameters included the Chebyshev polynomial of sixth grade and 1/x function, sample displacement, scale factor, lattice parameters, crystallite size and micro-strain established using the double-Voigt approach.

4. Conclusions

SOFC anodes based on A-site-deficient La- and Ni-doped strontium titanates (LSTN) were prepared via four different routes, i.e., solid-state synthesis and three wet synthesis methods: sol-gel, hydrothermal and co-precipitation synthesis. The different synthesis routes had a great impact on LSTN morphology, crystallographic phase purity, Ni exsolution under reducing conditions, and therefore on fuel cell performance. The cell with the CP anode displayed the best results of the four, both in the activation region and in the mass-transport-limited region. The CP LSTN sample had the highest surface area, the highest phase purity and the highest dispersion of exsolved Ni particles obtained via reduction. This allows for continuous ionic and electronic conduction (supported by GDC addition to all anodes) and many catalytic sites. The cell with the SG anode showed similar performance in the activation region to the SS cell, but displayed a voltage drop in the mass transport region. This drop can be reduced by optimizing the synthesis procedure or using foaming agents. The wet techniques compared to the conventional solid-state synthesis also have the advantages of simplicity, being less energy- and time-consuming, and versatility in process conditions. Therefore, the co-precipitation and sol-gel synthesis routes are promising candidates to replace the solid-state reaction in manufacturing SOFC anodes.

Supplementary Materials

The following supporting information can be downloaded at: https://www.mdpi.com/article/10.3390/catal14010079/s1, Table S1. Rietveld refined lattice parameters, lattice strain and phase content of LSTN samples before and after exsolution, refined to cubic Pm-3m structure (PDF card no. 00-005-0634) and tetragonal I4/mcm (PDF card no. 04-025-4518). Table S2. LSTN elements ratios (in percentage) as measured by XPS before and after sputtering and by EDX elemental analysis. Nominal ratios are calculated according to intended stoichiometry Sr0.7La0.2Ti0.95Ni0.05O3-δ. Table S3. XPS binding energy (in eV) of LSTN elements signals before and after 3 min Ar sputtering. Full widths at half maximum (FWHM) are given in brackets. Secondary peaks are given below the main peaks. Table S4. Resistivity values obtained from fitting the impedance spectra of fuel cells with LSTN-GDC anodes to the equivalent circuit shown in Figure 6. Rs is the ohmic resistance, R1 is from hiqh frequency impedance, R2 is from medium frequency impedance, R3 is from low frequency impedance, Rp is the total polarization resistivity equal to R1+R2+R3 and σ is the conductivity according to the ohmic resistance and cell thickness. Figure S1. SEM micrographs of LSTN powders prepared by (a) solid state reaction (SS), (b) sol-gel (SG), (c) hydrothermal (HT) and (d) co-precipitation (CP) methods after identical ball milling process. Scale bars for CP sample apply for all. Figure S2. Rietveld refinement analysis of (a) solid state, (b) sol-gel, (c) hydrothermal and (d) coprecipitation LSTN samples before exsolution. The red lines indicate experimental data, the blue lines indicate simulated data, the lower grey traces indicate the difference between experimental and simulated data, and the blue and black vertical lines at the bottom indicate Bragg positions of cubic Pm-3m structure (PDF card no. 00-005-0634) and tetragonal I4/mcm (PDF card no. 04-025-4518), respectively. Figure S3. XPS spectra of C 1s and T 2p signals for LSTN powders before and after sputtering. (a) C 1s and (b) Ti 2p in solid state LSTN, (c) C 1s and (d) Ti 2p in sol-gel LSTN, (e) C 1s and (f) Ti 2p in hydrothermal LSTN, (g) C 1s and (h) Ti 2p in co-precipitation LSTN. Figure S4. In situ XRD analysis of (a) solid state, (b) sol-gel, (c) hydrothermal, (d) coprecipitation LSTN powders under 5% H2 in N2 flow at R.T and between 400–890 °C. Figure S5. Polarization curves of fuel cells with of (a) solid state, (b) sol-gel, (c) hydrothermal, (d) coprecipitation LSTN-GDC anodes at different operation times at 820 °C under 300 cm3/min dry H2 flow on anode side. The start time is defined when the cell reached the final operation temperature and hydrogen started to flow on the anode. Figure S6. Impedance Nyquist plots of fuel cells with (a) solid state, (b) sol-gel, (c) hydrothermal, (d) coprecipitation LSTN-GDC anodes before and after 48 h stability test. High frequency (HF, 3 kHz), medium frequency (MF, 6 Hz) and low frequency (LF, 0.2 Hz) are indicated. Figure S7. SEM micrograph of the cross-section of full fuel cell with CP LSTN-GDC anode after 48 h stability testing.

Author Contributions

M.D., L.F. and H.H. synthesized LSTN and characterized the as-prepared perovskite. M.D. prepared all fuel cell and exsolution tests and drafted the manuscript with critical comments from the other co-authors. B.A.R., M.G. and Y.G. conceived the idea, managed the project, reviewed the data analysis, and secured funding. All authors have read and agreed to the published version of the manuscript.

Funding

Israeli Ministry of Energy Grant No. 220-11-023.

Data Availability Statement

Data are contained within the article.

Conflicts of Interest

The authors declare no conflict of interest.

References

  1. Stambouli, A.B.; Traversa, E. Solid Oxide Fuel Cells (SOFCs): A Review of an Environmentally Clean and Efficient Source of Energy. Renew. Sustain. Energy Rev. 2002, 6, 433–455. [Google Scholar] [CrossRef]
  2. Jiang, S.P.; Chan, S.H. A Review of Anode Materials Development in Solid Oxide Fuel Cells. J. Mater. Sci. 2004, 39, 4405–4439. [Google Scholar] [CrossRef]
  3. Mahato, N.; Banerjee, A.; Gupta, A.; Omar, S.; Balani, K. Progress in Material Selection for Solid Oxide Fuel Cell Technology: A Review. Prog. Mater. Sci. 2015, 72, 141–337. [Google Scholar] [CrossRef]
  4. Li, X.; Zhao, H.; Xu, N.; Zhou, X.; Zhang, C.; Chen, N. Electrical Conduction Behavior of La, Co Co-Doped SrTiO3perovskite as Anode Material for Solid Oxide Fuel Cells. Int. J. Hydrogen Energy 2009, 34, 6407–6414. [Google Scholar] [CrossRef]
  5. Burnat, D.; Heel, A.; Holzer, L.; Kata, D.; Lis, J.; Graule, T. Synthesis and Performance of A-Site Deficient Lanthanum-Doped Strontium Titanate by Nanoparticle Based Spray Pyrolysis. J. Power Sources 2012, 201, 26–36. [Google Scholar] [CrossRef]
  6. Slater, P.R.; Fagg, D.P.; Irvine, J.T.S. Synthesis and Electrical Characterisation of Doped Perovskite Titanates as Potential Anode Materials for Solid Oxide Fuel Cells. J. Mater. Chem. 1997, 7, 2495–2498. [Google Scholar]
  7. Park, B.H.; Choi, G.M. Performance and Redox-Stability of La and Ni Co-Doped SrTiO3 Anode of Solid Oxide Fuel Cell. ECS Trans. 2015, 68, 1473–1479. [Google Scholar] [CrossRef]
  8. Park, B.H.; Choi, G.M. Redox Stability of La0.2Sr0.7Ti0.9Ni0.1O3-δ (LSTN)-Gd0.2Ce0.8O2-δ (GDC) Composite Anode. Int. J. Hydrogen Energy 2017, 42, 28559–28566. [Google Scholar] [CrossRef]
  9. Athayde, D.D.; Souza, D.F.; Silva, A.M.A.; Vasconcelos, D.; Nunes, E.H.M.; Diniz da Costa, J.C.; Vasconcelos, W.L. Review of Perovskite Ceramic Synthesis and Membrane Preparation Methods. Ceram. Int. 2015, 42, 6555–6571. [Google Scholar] [CrossRef]
  10. Singh, S.; Zubenko, D.; Rosen, B.A. Influence of LaNiO3 Shape on Its Solid-Phase Crystallization into Coke-Free Reforming Catalysts. ACS Catal. 2016, 6, 4199–4205. [Google Scholar] [CrossRef]
  11. Xu, X.; Pan, Y.; Zhou, W.; Chen, Y.; Zhang, Z.; Shao, Z. Toward Enhanced Oxygen Evolution on Perovskite Oxides Synthesized from Different Approaches: A Case Study of Ba0.5Sr0.5Co0.8Fe0.2O3−δ. Electrochim. Acta 2016, 219, 553–559. [Google Scholar] [CrossRef]
  12. Kumar, M.; Srikanth, S.; Ravikumar, B.; Alex, T.C.; Das, S.K. Synthesis of Pure and Sr-Doped LaGaO3, LaFeO3 and LaCoO3 and Sr,Mg-Doped LaGaO3 for ITSOFC Application Using Different Wet Chemical Routes. Mater. Chem. Phys. 2009, 113, 803–815. [Google Scholar] [CrossRef]
  13. da Conceição, L.; Silva, C.R.B.; Ribeiro, N.F.P.; Souza, M.M.V.M. Influence of the Synthesis Method on the Porosity, Microstructure and Electrical Properties of La0.7Sr0.3MnO3 Cathode Materials. Mater. Charact. 2009, 60, 1417–1423. [Google Scholar] [CrossRef]
  14. Bevilacqua, M.; Montini, T.; Tavagnacco, C.; Vicario, G.; Fornasiero, P.; Graziani, M. Influence of Synthesis Route on Morphology and Electrical Properties of LaNi0.6Fe0.4O3. Solid State Ion. 2006, 177, 2957–2965. [Google Scholar] [CrossRef]
  15. Bell, R.J.; Millar, G.J.; Drennan, J. Influence of Synthesis Route on the Catalytic Properties of La1-XSrxMnO3. Solid State Ion. 2000, 131, 211–220. [Google Scholar] [CrossRef]
  16. Sfeir, J.; Vaucher, S.; Holtappels, P.; Vogt, U.; Schindler, H.J.; Van Herle, J.; Suvorova, E.; Buffat, P.; Perret, D.; Xanthopoulos, N.; et al. Characterization of Perovskite Powders for Cathode and Oxygen Membranes Made by Different Synthesis Routes. J. Eur. Ceram. Soc. 2005, 25, 1991–1995. [Google Scholar] [CrossRef]
  17. Shao, Z.; Zhou, W.; Zhu, Z. Advanced Synthesis of Materials for Intermediate-Temperature Solid Oxide Fuel Cells. Prog. Mater. Sci. 2012, 57, 804–874. [Google Scholar] [CrossRef]
  18. Xu, X.; Wang, W.; Zhou, W.; Shao, Z. Recent Advances in Novel Nanostructuring Methods of Perovskite Electrocatalysts for Energy-Related Applications. Small Methods 2018, 2, 1800071. [Google Scholar] [CrossRef]
  19. Huang, K. An Emerging Platform for Electrocatalysis: Perovskite Exsolution. Sci. Bull. 2016, 61, 1783–1784. [Google Scholar] [CrossRef]
  20. Santaya, M.; Jiménez, C.E.; Arce, M.D.; Carbonio, E.A.; Toscani, L.M.; Garcia-Diez, R.; Knop-Gericke, A.; Mogni, L.V.; Bär, M.; Troiani, H.E. Exsolution versus Particle Segregation on (Ni,Co)-Doped and Undoped SrTi0.3Fe0.7O3-δ Perovskites: Differences and Influence of the Reduction Path on the Final System Nanostructure. Int. J. Hydrogen Energy 2023, 48, 38842–38853. [Google Scholar] [CrossRef]
  21. Myung, J.H.; Neagu, D.; Miller, D.N.; Irvine, J.T.S. Switching on Electrocatalytic Activity in Solid Oxide Cells. Nature 2016, 537, 528–531. [Google Scholar] [CrossRef]
  22. Zhu, S.; Fan, J.; Li, Z.; Wu, J.; Xiao, M.; Du, P.; Wang, X.; Jia, L. Metal Exsolution from Perovskite-Based Anode in Solid Oxide Fuel Cells. Chem. Commun. 2024. [Google Scholar] [CrossRef]
  23. Yang, J.; Zhou, J.; Liu, Z.; Sun, Y.; Yin, C.; Wang, K.; Li, R.; Zhou, Z.; Wu, K. Exploring Heterogeneous Phases in Highly A-Site-Deficient Titanate with Ni Exsolution. J. Power Sources 2023, 580, 233369. [Google Scholar] [CrossRef]
  24. Azough, F.; Jackson, S.S.; Ekren, D.; Freer, R.; Molinari, M.; Yeandel, S.R.; Panchmatia, P.M.; Parker, S.C.; Maldonado, D.H.; Kepaptsoglou, D.M.; et al. Concurrent La and A-Site Vacancy Doping Modulates the Thermoelectric Response of SrTiO3: Experimental and Computational Evidence. ACS Appl. Mater. Interfaces 2017, 9, 41988–42000. [Google Scholar] [CrossRef] [PubMed]
  25. Battle, P.D.; Bennett, J.E.; Sloan, J.; Tilley, R.J.D.; Vente, J.F. A-Site Cation-Vacancy Ordering in Sr(1-3x/2)La(x)TiO3: A Study by HRTEM. J. Solid State Chem. 2000, 149, 360–369. [Google Scholar] [CrossRef]
  26. Young, V.; Otagawa, T. XPS Studies on Strontium Compounds. Appl. Surf. Sci. 1985, 20, 228–248. [Google Scholar] [CrossRef]
  27. Greczynski, G.; Hultman, L. Towards Reliable X-Ray Photoelectron Spectroscopy: Sputter-Damage Effects in Transition Metal Borides, Carbides, Nitrides, and Oxides. Appl. Surf. Sci. 2021, 542, 148599. [Google Scholar] [CrossRef]
  28. Nagarkar, P.V.; Searson, P.C.; Gealy, F.D. Effect of Surface Treatment on SrTiO3: An x-Ray Photoelectron Spectroscopic Study. J. Appl. Phys. 1991, 69, 459–462. [Google Scholar] [CrossRef]
  29. Chan, C.-M.; Trigwell, S.; Duerig, T. Oxidation of an NiTi Alloy. Surf. Interface Anal. 1990, 15, 349–354. [Google Scholar] [CrossRef]
  30. Vasquez, R.P. SrTiO3 by XPS. Surf. Sci. Spectra 1992, 1, 129–135. [Google Scholar] [CrossRef]
  31. Cavazzani, J.; Squizzato, E.; Brusamarello, E.; Glisenti, A. Exsolution in Ni-Doped Lanthanum Strontium Titanate: A Perovskite-Based Material for Anode Application in Ammonia-Fed Solid Oxide Fuel Cell. Int. J. Hydrogen Energy 2022, 47, 13921–13932. [Google Scholar] [CrossRef]
  32. Vasquez, R.P. X-Ray Photoelectron Spectroscopy Study of Sr and Ba Compounds. J. Electron Spectros. Relat. Phenomena 1991, 56, 217–240. [Google Scholar] [CrossRef]
  33. Uwamino, Y.; Ishizuka, T.; Yamatera, H. X-Ray Photoelectron Compounds Spectroscopy of Rare-Earth. J. Electron Spectros. Relat. Phenomena 1984, 34, 67–78. [Google Scholar] [CrossRef]
  34. Mansour, A.N. Characterization of NiO by XPS. Surf. Sci. Spectra 1994, 3, 231–238. [Google Scholar] [CrossRef]
  35. Mansour, A.N. Nickel Monochromated Al Kα XPS Spectra from the Physical Electronics Model 5400 Spectrometer. Surf. Sci. Spectra 1994, 3, 221–230. [Google Scholar] [CrossRef]
  36. Mcintyre, N.S.; Cook, M.G. X-Ray Photoelectron Studies on Some Oxides and Hydroxides of Cobalt, Nickel, and Copper. Anal. Chem. 1975, 47, 2208–2213. [Google Scholar] [CrossRef]
  37. Van der Heide, P. X-ray Photoelectron Spectroscopy: An Introduction to Principles and Practices; John Wiley & Sons: Hoboken, NJ, USA, 2011. [Google Scholar]
  38. Neagu, D.; Tsekouras, G.; Miller, D.N.; Ménard, H.; Irvine, J.T.S. In Situ Growth of Nanoparticles through Control of Non-Stoichiometry. Nat. Chem. 2013, 5, 916–923. [Google Scholar] [CrossRef] [PubMed]
  39. Steiger, P.; Alxneit, I.; Ferri, D. Nickel Incorporation in Perovskite-Type Metal Oxides—Implications on Reducibility. Acta Mater. 2019, 164, 568–576. [Google Scholar] [CrossRef]
  40. Lee, J.J.; Kim, K.; Kim, K.J.; Kim, H.J.; Lee, Y.M.; Shin, T.H.; Han, J.W.; Lee, K.T. In-Situ Exsolution of Ni Nanoparticles to Achieve an Active and Stable Solid Oxide Fuel Cell Anode Catalyst on A-Site Deficient La0.4Sr0.4Ti0.94Ni0.06O3-δ. J. Ind. Eng. Chem. 2021, 103, 264–274. [Google Scholar] [CrossRef]
  41. Steiger, P.; Burnat, D.; Madi, H.; Mai, A.; Holzer, L.; Van Herle, J.; Kröcher, O.; Heel, A.; Ferri, D. Sulfur Poisoning Recovery on a Solid Oxide Fuel Cell Anode Material through Reversible Segregation of Nickel. Chem. Mater. 2019, 31, 748–758. [Google Scholar] [CrossRef]
  42. Kwon, O.; Joo, S.; Choi, S.; Sengodan, S.; Kim, G. Review on Exsolution and Its Driving Forces in Perovskites. J. Phys. Energy 2020, 2, 032001. [Google Scholar] [CrossRef]
  43. Singh, S.; Prestat, E.; Huang, L.F.; Rondinelli, J.M.; Haigh, S.J.; Rosen, B.A. Role of 2D and 3D Defects on the Reduction of LaNiO3 Nanoparticles for Catalysis. Sci. Rep. 2017, 7, 10080. [Google Scholar] [CrossRef]
  44. Bornovski, R.; Huang, L.F.; Komarala, E.P.; Rondinelli, J.M.; Rosen, B.A. Catalytic Enhancement of CO Oxidation on LaFeO3 Regulated by Ruddlesden-Popper Stacking Faults. ACS Appl. Mater. Interfaces 2019, 11, 33850–33858. [Google Scholar] [CrossRef]
  45. Neagu, D.; Oh, T.S.; Miller, D.N.; Ménard, H.; Bukhari, S.M.; Gamble, S.R.; Gorte, R.J.; Vohs, J.M.; Irvine, J.T.S. Nano-Socketed Nickel Particles with Enhanced Coking Resistance Grown in Situ by Redox Exsolution. Nat. Commun. 2015, 6, 8120. [Google Scholar] [CrossRef] [PubMed]
  46. Zhou, X.; Yan, N.; Chuang, K.T.; Luo, J. Progress in La-Doped SrTiO3 (LST)-Based Anode Materials for Solid Oxide Fuel Cells. RSC Adv. 2014, 4, 118–131. [Google Scholar] [CrossRef]
  47. Hussain, S.; Yangping, L. Review of Solid Oxide Fuel Cell Materials: Cathode, Anode, and Electrolyte. Energy Transit. 2020, 4, 113–126. [Google Scholar] [CrossRef]
  48. Bilal Hanif, M.; Motola, M.; Qayyum, S.; Rauf, S.; Khalid, A.; Li, C.J.; Li, C.X. Recent Advancements, Doping Strategies and the Future Perspective of Perovskite-Based Solid Oxide Fuel Cells for Energy Conversion. Chem. Eng. J. 2022, 428, 132603. [Google Scholar] [CrossRef]
  49. Jiang, S.P.; Badwal, S.P.S. Hydrogen Oxidation at the Nickel and Platinum Electrodes on Yttria-Tetragonal Zirconia Electrolyte. J. Electrochem. Soc. 1997, 144, 3777–3784. [Google Scholar] [CrossRef]
  50. Minh, N.Q. Solid Oxide Fuel Cell Technology—Features and Applications. Solid State Ionics 2004, 174, 271–277. [Google Scholar] [CrossRef]
  51. Arrivé, C.; Delahaye, T.; Joubert, O.; Gauthier, G. Exsolution of Nickel Nanoparticles at the Surface of a Conducting Titanate as Potential Hydrogen Electrode Material for Solid Oxide Electrochemical Cells. J. Power Sources 2013, 223, 341–348. [Google Scholar] [CrossRef]
  52. Qianli, M.; Tietz, F.; Leonide, A.; Ivers-Tiffée, E. Impedance Studies on Solid Oxide Fuel Cells with Yttrium-Substituted SrTiO3 Ceramic Anodes. ECS Trans. 2011, 35, 1421–1433. [Google Scholar] [CrossRef]
  53. Burnat, D.; Nasdaurk, G.; Holzer, L.; Kopecki, M.; Heel, A. Lanthanum Doped Strontium Titanate—Ceria Anodes: Deconvolution of Impedance Spectra and Relationship with Composition and Microstructure. J. Power Sources 2018, 385, 62–75. [Google Scholar] [CrossRef]
  54. Tao, S.; Irvine, J.T.S. Synthesis and Characterization of (La0.75Sr0.25)Cr0.5Mn0.5O3-δ, a Redox-Stable, Efficient Perovskite Anode for SOFCs. J. Electrochem. Soc. 2004, 151, 252–259. [Google Scholar] [CrossRef]
  55. Cheng, J. Synthesis of LAXSR1-XTIO3anode Materials by Sol-Gel Auto-Combustion Method. J. Chil. Chem. Soc. 2012, 57, 969–971. [Google Scholar] [CrossRef]
  56. Beale, A.M.; Paul, M.; Sankar, G.; Oldman, R.J.; Catlow, C.R.A.; French, S.; Fowles, M. Combined Experimental and Computational Modelling Studies of the Solubility of Nickel in Strontium Titanate. J. Mater. Chem. 2009, 19, 4391–4400. [Google Scholar] [CrossRef]
  57. Zhang, F.; Karaki, T.; Adachi, M. Synthesis of Nanosized (Pb,Sr)TiO3 perovskite Powders by Coprecipitation Processing. Powder Technol. 2005, 159, 13–16. [Google Scholar] [CrossRef]
Figure 1. XRD patterns of as-synthesized LSTN powders prepared by means of the solid-state reaction (SS), sol-gel (SG), hydrothermal (HT) and co-precipitation (CP) methods.
Catalysts 14 00079 g001
Figure 2. XPS spectra of LSTN powders. (a) Sr 3d signals, (b) Ti 2p signals, (c) La 3d signals, (d) O 1s signals, (e) Ni 2p signals (overlapped by La 3d signals), (f) Ni 3p (overlapped by Ti 3s signals). The spectra shown in (ac,e) are for as-received powder surfaces before sputtering, while the spectra shown in (d) and (f) were measured after 3 min of Ar sputtering.
Catalysts 14 00079 g002
Figure 3. Temperature programmed reduction (TPR) of LSTN powders under 5% H2 in N2 at a 10 K/min heating rate. Temperatures at main peaks are indicated.
Catalysts 14 00079 g003
Figure 4. Bright field TEM images of LSTN powders after 4 h of reduction under 10% H2 at 800 °C with exsolved Ni particles visible. (a) Solid-state LSTN, (b) sol-gel LSTN, (c) co-precipitation LSTN. No exsolved particles were found by TEM in the hydrothermal LSTN powder.
Catalysts 14 00079 g004
Figure 5. Polarization curves of fuel cells with LSTN-GDC anodes after the 48 h stability test and a total operation time of 52 h at 820 °C with dry H2 fuel. Closed symbols are for the left Y-axis of voltage and open symbols are for the right Y-axis of power density.
Catalysts 14 00079 g005
Figure 6. Comparison of impedance Nyquist plots of fuel cells with LSTN-GDC anodes after the 48 h stability test. The fitted equivalent circuit is given at the bottom.
Catalysts 14 00079 g006
Figure 7. Current density vs. time for fuel cells with LSTN-GDC anodes held at 0.5 V for stability testing.
Catalysts 14 00079 g007
Figure 8. SEM micrographs of LSTN-GDC anode regions in SOFC cross-sections after 48 h stability testing. (ad) Low-magnification images; (eh) high-magnification images.
Catalysts 14 00079 g008
Figure 9. Schematic description of the different synthesis methods used to prepare Sr0.7La0.2Ti0.95Ni0.05O3-δ (LSTN) powders. (a) Solid-state reaction (SS); (b) sol-gel combustion synthesis (SG); (c) hydrothermal synthesis (HT); (d) co-precipitation synthesis (CP).
Catalysts 14 00079 g009
Table 1. Summary of calcination temperatures, phases observed in XRD, cell parameters of the perovskite phase according to Rietveld refinement and BET surface areas of LSTN samples prepared by different routes.
Synthesis MethodCalcination Temperature (°C)Cell Parameter a0 (Å)Phases in XRDBET Surface Area (m2/g)
Solid state12003.905LSTN, Sr2TiO415.8
Sol-gel10003.904LSTN, Sr2TiO4, TiO2 rutile19.2
HydrothermalNo calcination3.914LSTN, LaSrO2.5, SrCO3, La2O2CO3 34.2
Co-precipitation9003.911LSTN, LaSrO2.539.8
Disclaimer/Publisher’s Note: The statements, opinions and data contained in all publications are solely those of the individual author(s) and contributor(s) and not of MDPI and/or the editor(s). MDPI and/or the editor(s) disclaim responsibility for any injury to people or property resulting from any ideas, methods, instructions or products referred to in the content.

