
Ideal Site Geometry for Heterogeneous Catalytic Reactions: A DFT Study
Center of Materials Science and Optoelectronics Engineering, College of Materials Science and Opto-Electronic Technology, University of Chinese Academy of Sciences, Beijing 100049, China
Catalysts 2024, 14(1), 34; https://doi.org/10.3390/catal14010034
Submission received: 28 October 2023
/
Revised: 10 December 2023
/
Accepted: 19 December 2023
/
Published: 30 December 2023
(This article belongs to the Topic Catalysis: Homogeneous and Heterogeneous)
Abstract
:Surface geometry at the atomic level is an important factor related to the activity of a catalytic site. It is important to identify sites with high activity to comprehend the performance of a given catalyst. In this work, it is proposed that the optimal surface for a given reaction step should satisfy the condition , where E is the transition state energy and xi is any variable characterizing the surface. Taking three elementary steps as examples, it is shown that the optimal site found by this method has significantly reduced TS (transition state) energy compared with facets commonly applied in previous studies, and, thus, it can be several orders more active. The method provides an insight into the geometric impact of catalysis, gives a blueprint for an ideal catalyst surface structure, and, thus, provides guidance for catalyst development.

1. Introduction
A catalyst refers to a substance that accelerates a desired chemical reaction without being affected itself. They can be further classified into homogeneous and heterogeneous catalysts, depending on whether they are in the same phase as the reactants. Heterogeneous catalysts are widely applied in a number of economical chemical reactions due to their easy separation from the reactants and products, and, thus, they play an important role in the modern world [1,2,3].
The fundamental principles of catalytic reactions are relatively simple and clear. In brief, most chemical reactions of interest are made up of multiple elementary steps, and each step can be characterized by its own energetic parameters. In order for the reaction to proceed, an energetic span (or a barrier), usually defined as the energy difference between a specific transition state (TS) and an intermediate [4,5], must be overcome. The magnitude of the energetic span generally determines how fast the reaction can take place. The catalyst interacts with the intermediates and, thus, tunes the energetic parameters of the complete reaction. If the energetic span is reduced, the overall reaction rate is increased. Here, the key transition states or intermediates can be identified by approaches such as DRC [6,7]. With the development of density functional theory (DFT), the above energetic span can be evaluated by setting up simulation models on the atomic level [8,9].
On the other hand, heterogeneous catalysts applied in practice are very complex. From a functional point of view, catalysts have two major components: an active component and a support. The active component, referring to the substance that provides adsorption points directly interacting with the intermediates, generally determines the outcome and selectivity of the reaction product [10,11]. Intermediates are stabilized at these adsorption points as adsorbates. An active site can be formed by two adjacent adsorption points, enabling neighboring intermediates to interact with each other. The support refers to the substance in a catalyst that does not directly participate in the chemical reaction but can still play a vital role in multiple ways, such as dispersing the active component, increasing the surface area, etc. Various adjustments to either the active component or support have been suggested to improve the performance of catalysts. For example, the active component can adopt the form of nanoparticles [12,13,14,15] or isolated single atoms (single-atom catalyst, SAC) [16,17,18,19]; some catalysts use metal oxides, graphene, or biomolecules as a support to achieve good dispersion of the active component or bring together and orient the reactants so that the reaction can proceed with a minimum energy barrier [20,21,22].
The spatial configuration between adsorption points in an active site is referred to as its geometric features. As early as the 1960s, studies reported that catalysts of different particle sizes exhibit different catalytic activity due to the statistical distribution of surface atoms with different coordination numbers and neighboring atom arrangements [23,24]. With the advent of DFT as a staple tool in catalyst research, it is possible to estimate the active site performance if its geometry is well defined [25,26,27]. However, the geometric features tend to be subject to significant uncertainty and variance due to the inherent complexity and defects of realistic catalyst surfaces. It is extremely costly to iterate over all these geometries, which necessitates compromises to simplify the catalyst surface’s geometric model, thus ensuring manageable computational power expenditure. For a simpler catalyst with a crystalline structure, typical facets are usually chosen for simulation models [25,26,27,28]. The approach is simplistic, but these geometric features may not be favored by the reaction or suitable for nanoparticles, and it has difficulties while addressing the interfaces of two catalyst components. For catalysts in the form of molecules or nanoparticles, sampling algorithms are proposed to search for conformations with good catalytic performances [29,30,31,32]. These methodologies are either semi-empirical, using a large database where either a catalyst or transition state is required, or they require substantial computational power while searching for the optimal geometric features. With the ongoing advancements in catalyst development, how to identify optimized geometric features among the diverse possibilities and, thus, break the scaling relation for reaction rates with reasonable computational power becomes an urgent theoretical problem [33].
In this work, we discuss the transition state’s energy dependence on geometric features based on the first-principles theory. A method is proposed to find the optimal geometry such that the transition state of the designated reaction is strictly minimized. This method can be expanded to model a range of catalysts with significant complexity. To test the method, we take three elementary reactions to a simple substance as examples. The proposed method is applied, and the results show a significant improvement compared with those obtained on traditional sites. The physical chemistry insights within the results are also discussed to validate the result as an optimal solution.
2. Theory
Let us first briefly review the definition of a transition state: Any surface reaction step can be generally written as IS ↔ FS. Here, IS and FS refer to the initial and final states of the step, where reactants/products are stabilized at adsorption points. The reaction step has to find a route where all the atoms move from their initial positions in IS to their final positions in FS. Let α (0,1) be the variable to describe the state gradually transitioning from IS to FS (0 for IS and 1 for FS), and let βi (i = 1, 2, 3.....) be a set of continuous functions of α to define such a route. For example, βi(α) gives the coordination of the i-th atoms in the reaction as it proceeds from IS to FS.
With the above definition, we are now able to identipfy any state on any existing route with the variables α and β (bold indicates that the function/variable has multiple components, here and in the rest of the paper). Let the energy of such a state be written as E(α, β). In the DFT calculations, the energy has to be calculated with the catalyst base included, but it can be estimated by removing the base contribution as follows:
In Equation (1), EAdsorbate+Base refers to the DFT result obtained with the adsorbates on the catalyst site, and EBase refers to the DFT result with only the catalyst base.
The transition state of the reaction step is defined on the saddle point of the energy landscape, which encompasses all states between IS and FS. This is the point with the highest energy on a specified route but the lowest among all the routes. Therefore, on this saddle point corresponding to TS, the following expression must be satisfied:
Note that, while Equations (2) and (3) look similar, the second partial derivative with respect to α should be non-positive, while that with respect to βi should be non-negative, to further substantiate the above statement. The above is the definition for the transition state in an elementary step, and it is widely applied in most relating studies.
Now let us go one step further and take the geometric features of the reaction area into consideration. Let S(x) be the site function characterizing the geometric features of the active site. It has a number of variables xi. Based on the way they are defined, these variables can either be discrete (for example, the variables indicating the atomic number of a catalyst atom), or continuous (for example, the variables indicating the coordinates of an atom). One example expression of S(x) has its form written as S(a,b,c), where a, b, and c are three integers that define a facet, such as a 100 facet or a 111 facet. With the site function, now we may use E(α,β,S(x)) to represent the energy of a state for a given reaction step, on a route specified by the function β, at a point on the route specified by α, and on a site specified by S(x).
In case a transition state is rate-determining, we are willing to find the geometric features that minimize the energy for the transition state, reduce the energetic span, and improve the catalytic performance. Mathematically speaking, the goal is to find an optimized site function S(x) in the complete catalyst space covering all possible geometric features. Similar to in Equations (2) and (3), suppose we are able to adjust some continuous variables xi in the site function to reduce the energy of the corresponding transition state. Because the energy should also be a continuous function of xi, at the minimum point, we shall have:
For discrete variables, Equation (4) should still hold if we connect these discrete points with a fitted trend line. In the following, we will show that Equation (4) serves as the key to find the optimal site geometry for the target reaction.
3. Model
In order to apply Equation (4), an immediate question that arises is: what is the detailed expression for S(x) with a number of continuous variables? This is a challenging task; as mentioned previously, there are an overwhelming number of possible site geometries, which cannot all be encapsulated in a single expression. The traditional expression for S(x) used in many simulation studies, where a facet is characterized by 3–4 integers, is not helpful. This is because the variables are discrete, and this expression can only describe perfect facets, which represent only a small portion of all site geometries. To partially address the issue, we need to introduce a different expression for S(x). To do this, we have to make a number of assumptions, as discussed below.
First, for now it is assumed that the active component under study is a simple substance, which is copper in the following examples. This assumption is for simplification, because in this work we focus on the geometry rather than the properties of the active component. In reality, the active component can be a complicated compound; so is the catalyst support, which can be different from the active component.
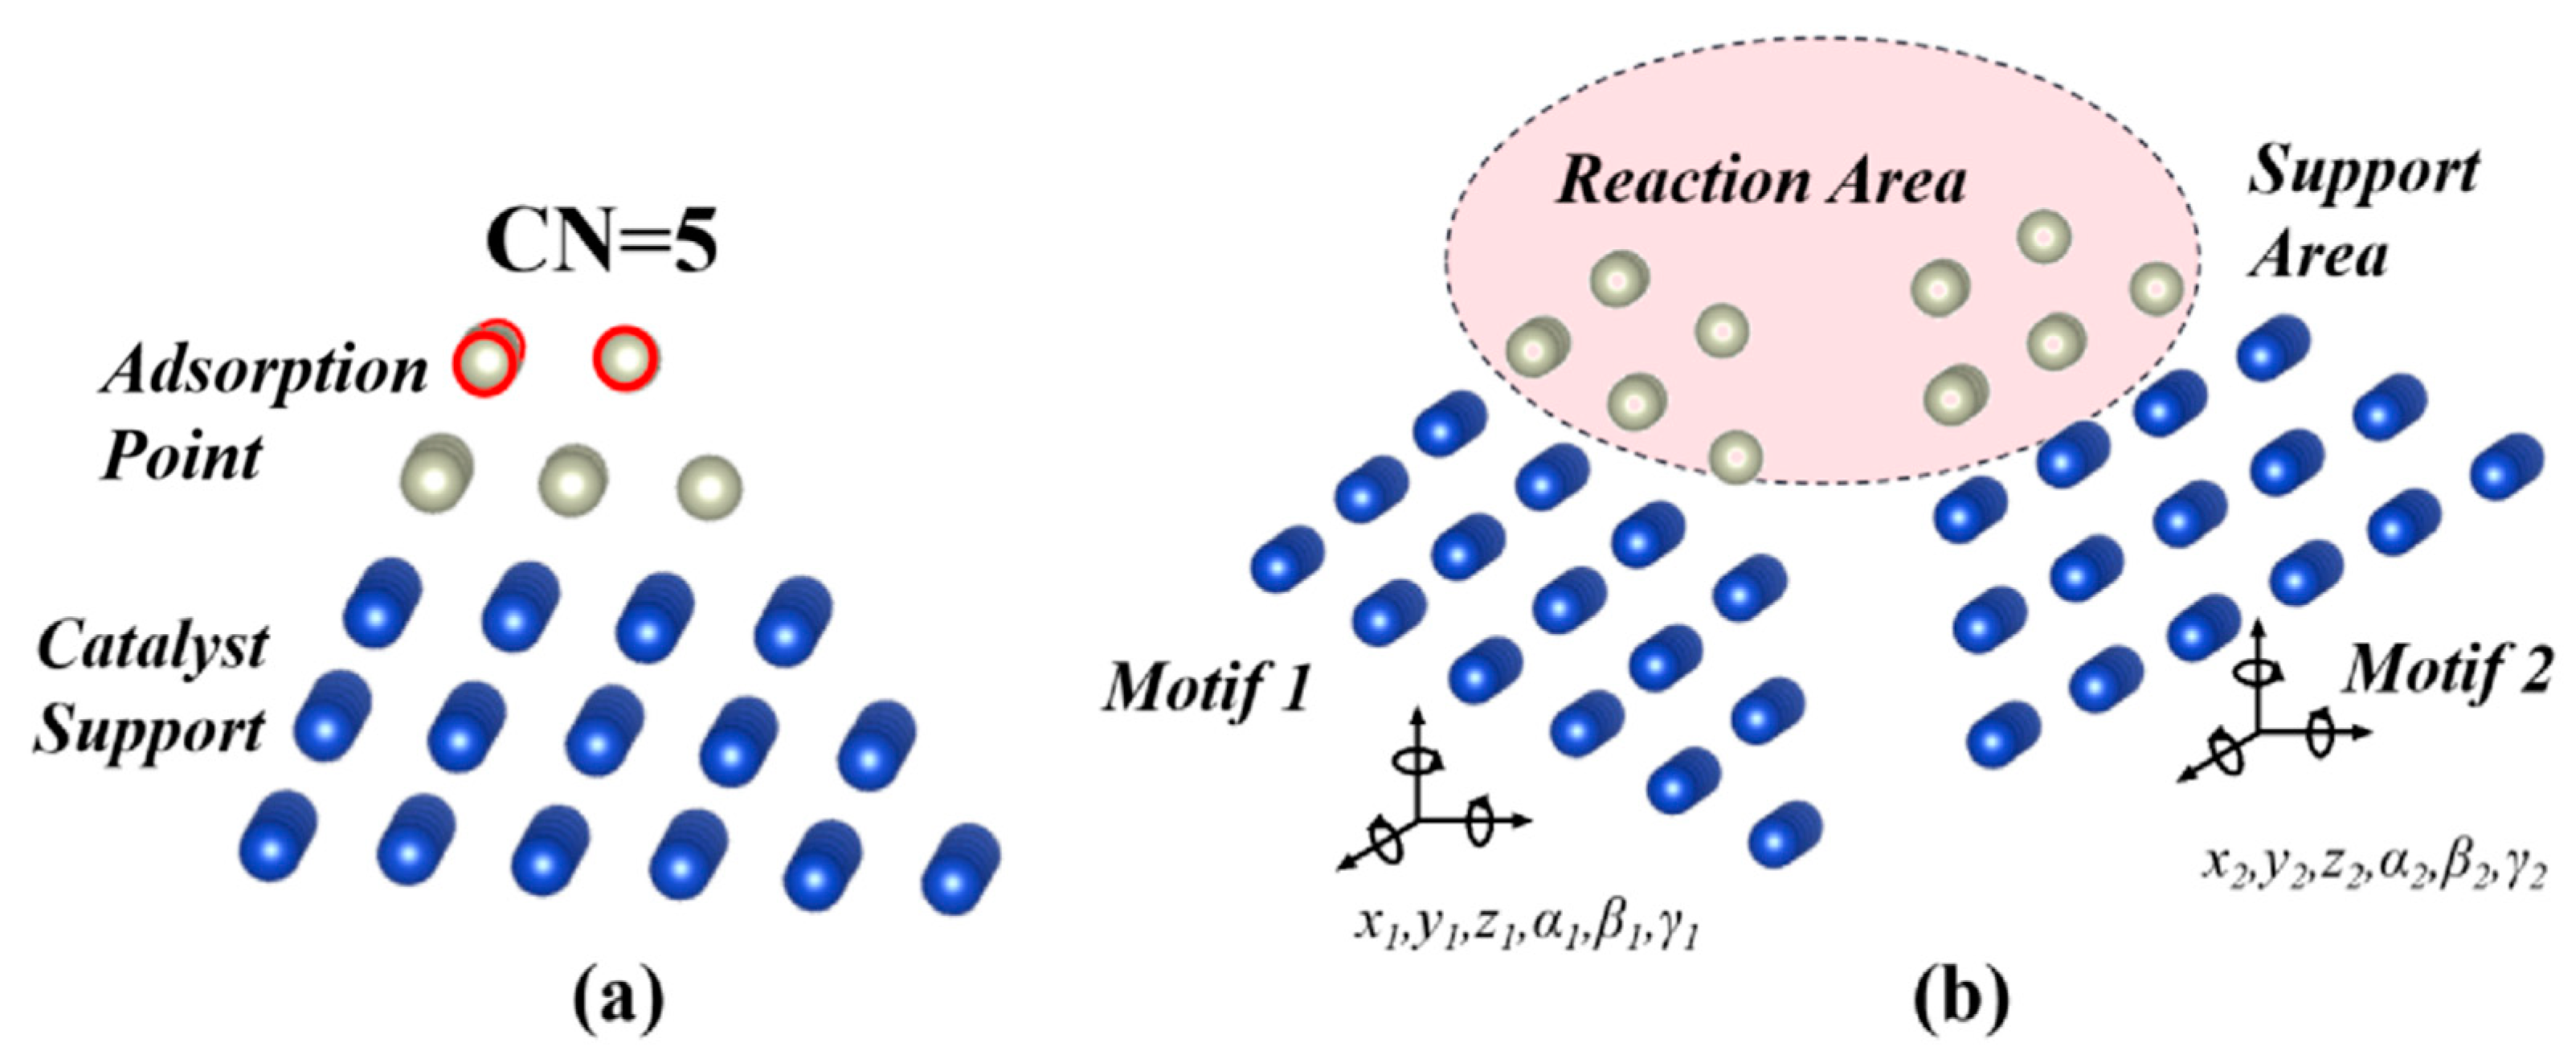
Second, most surface reactions have the form A* + B* ↔ C* + D*, where * indicates an adsorption point. It is assumed that an active site can be presented by a “reaction over two motifs” model. Here, a “motif” refers to a catalyst structure with an adsorption point. In accordance with the simplification that the catalyst is a simple substance, in this work a motif is represented as a multi-layer cluster, with the adsorption point on top and the structure determined by the nature of the substance. Similar to the slab model widely applied in the DFT simulations, the structure should have enough layers to model the catalyst surface properly. Such a motif is characterized by the CN (coordination number) of its top-layer atoms, because its affinity to the intermediates is strongly correlated with CN [31]. A motif example is given in Figure 1a; it adopts the FCC structure and forms a pyramid-like shape. When two motifs are put together, they form an active site. As the position and the orientation of each motif can be characterized by six variables (three translational and three rotational), the geometry of the active site described in this model can be expressed by a site function S(x) with 12 continuous variables. It is notable that some variables can be degenerated, but we will retain the expression with 12 variables for practical purposes, as will be discussed later.
This model essentially divides the whole space into two areas, as shown in Figure 1b. The reaction area refers to the region close to the top layer of both motifs. This is the area where the reactant molecules may be present. The geometry in this area, which is explicitly defined by S(x), can significantly affect the energetic parameters of the reaction. The support area refers to all the area excluding the reaction area. Atoms other than those that make up the two motifs can exist in this area, but their detailed configuration is not important as it has little effect on the reaction. However, it is expected that the catalyst atoms in the support area will contribute to the stabilization of the geometric features specified by S(x) in the reaction area. Consider the numerous possibilities for defects, impurities, or support in this area: for any geometry specified by S(x), there are likely always some configurations in the support area that can stabilize the configuration of the active site.
There are a few issues that must be clarified regarding this “reaction over two motifs” model. First, although the geometry is yet to be determined, the energy of IS/FS is known, because the binding energy can be characterized by CN [34]. For this reason, in this work we focus on only TS and do not show IS/FS. The configuration of IS/FS can be easily found by adsorbing the intermediates on the corresponding motifs then fine-tuning their configuration with the DFT method. Second, this “reaction over two motifs” model primarily aims to find the optimal site geometry and may end up with a seemingly unstable structure. This is due to the missing details of the atoms in the support area. We will discuss this issue in a later section. Lastly, by replacing the motif with more complicated compounds or structures, this simplified model can be extended to describe more realistic active sites. For instance, when modeling the interface between two catalysts, distinct motifs can be assigned with differentiated components correlating to the diverse catalyst combinations. In order to model the active sites with doping/impurities, specific atoms from one or both motifs can be substituted. Furthermore, when modeling a site with adsorbed ligands, these ligands could merely be affixed to the motif.
It should be noted that, even with the possible extensions mentioned above, the set of sites described by this model is still just a subset of all the possible sites. But compared with the traditional definition where 3–4 integers are applied to characterize a facet (a 111 facet, for example), this 12-continuous-variable expression covers many more site geometries. Therefore, searching for the optimal site for a desired reaction in this model gives some useful results.
4. Algorithm
With an understanding of the transition state satisfying Equation (4) and a clear definition of the site function S(x), the optimal site for a given elementary reaction can be determined using the following algorithm:
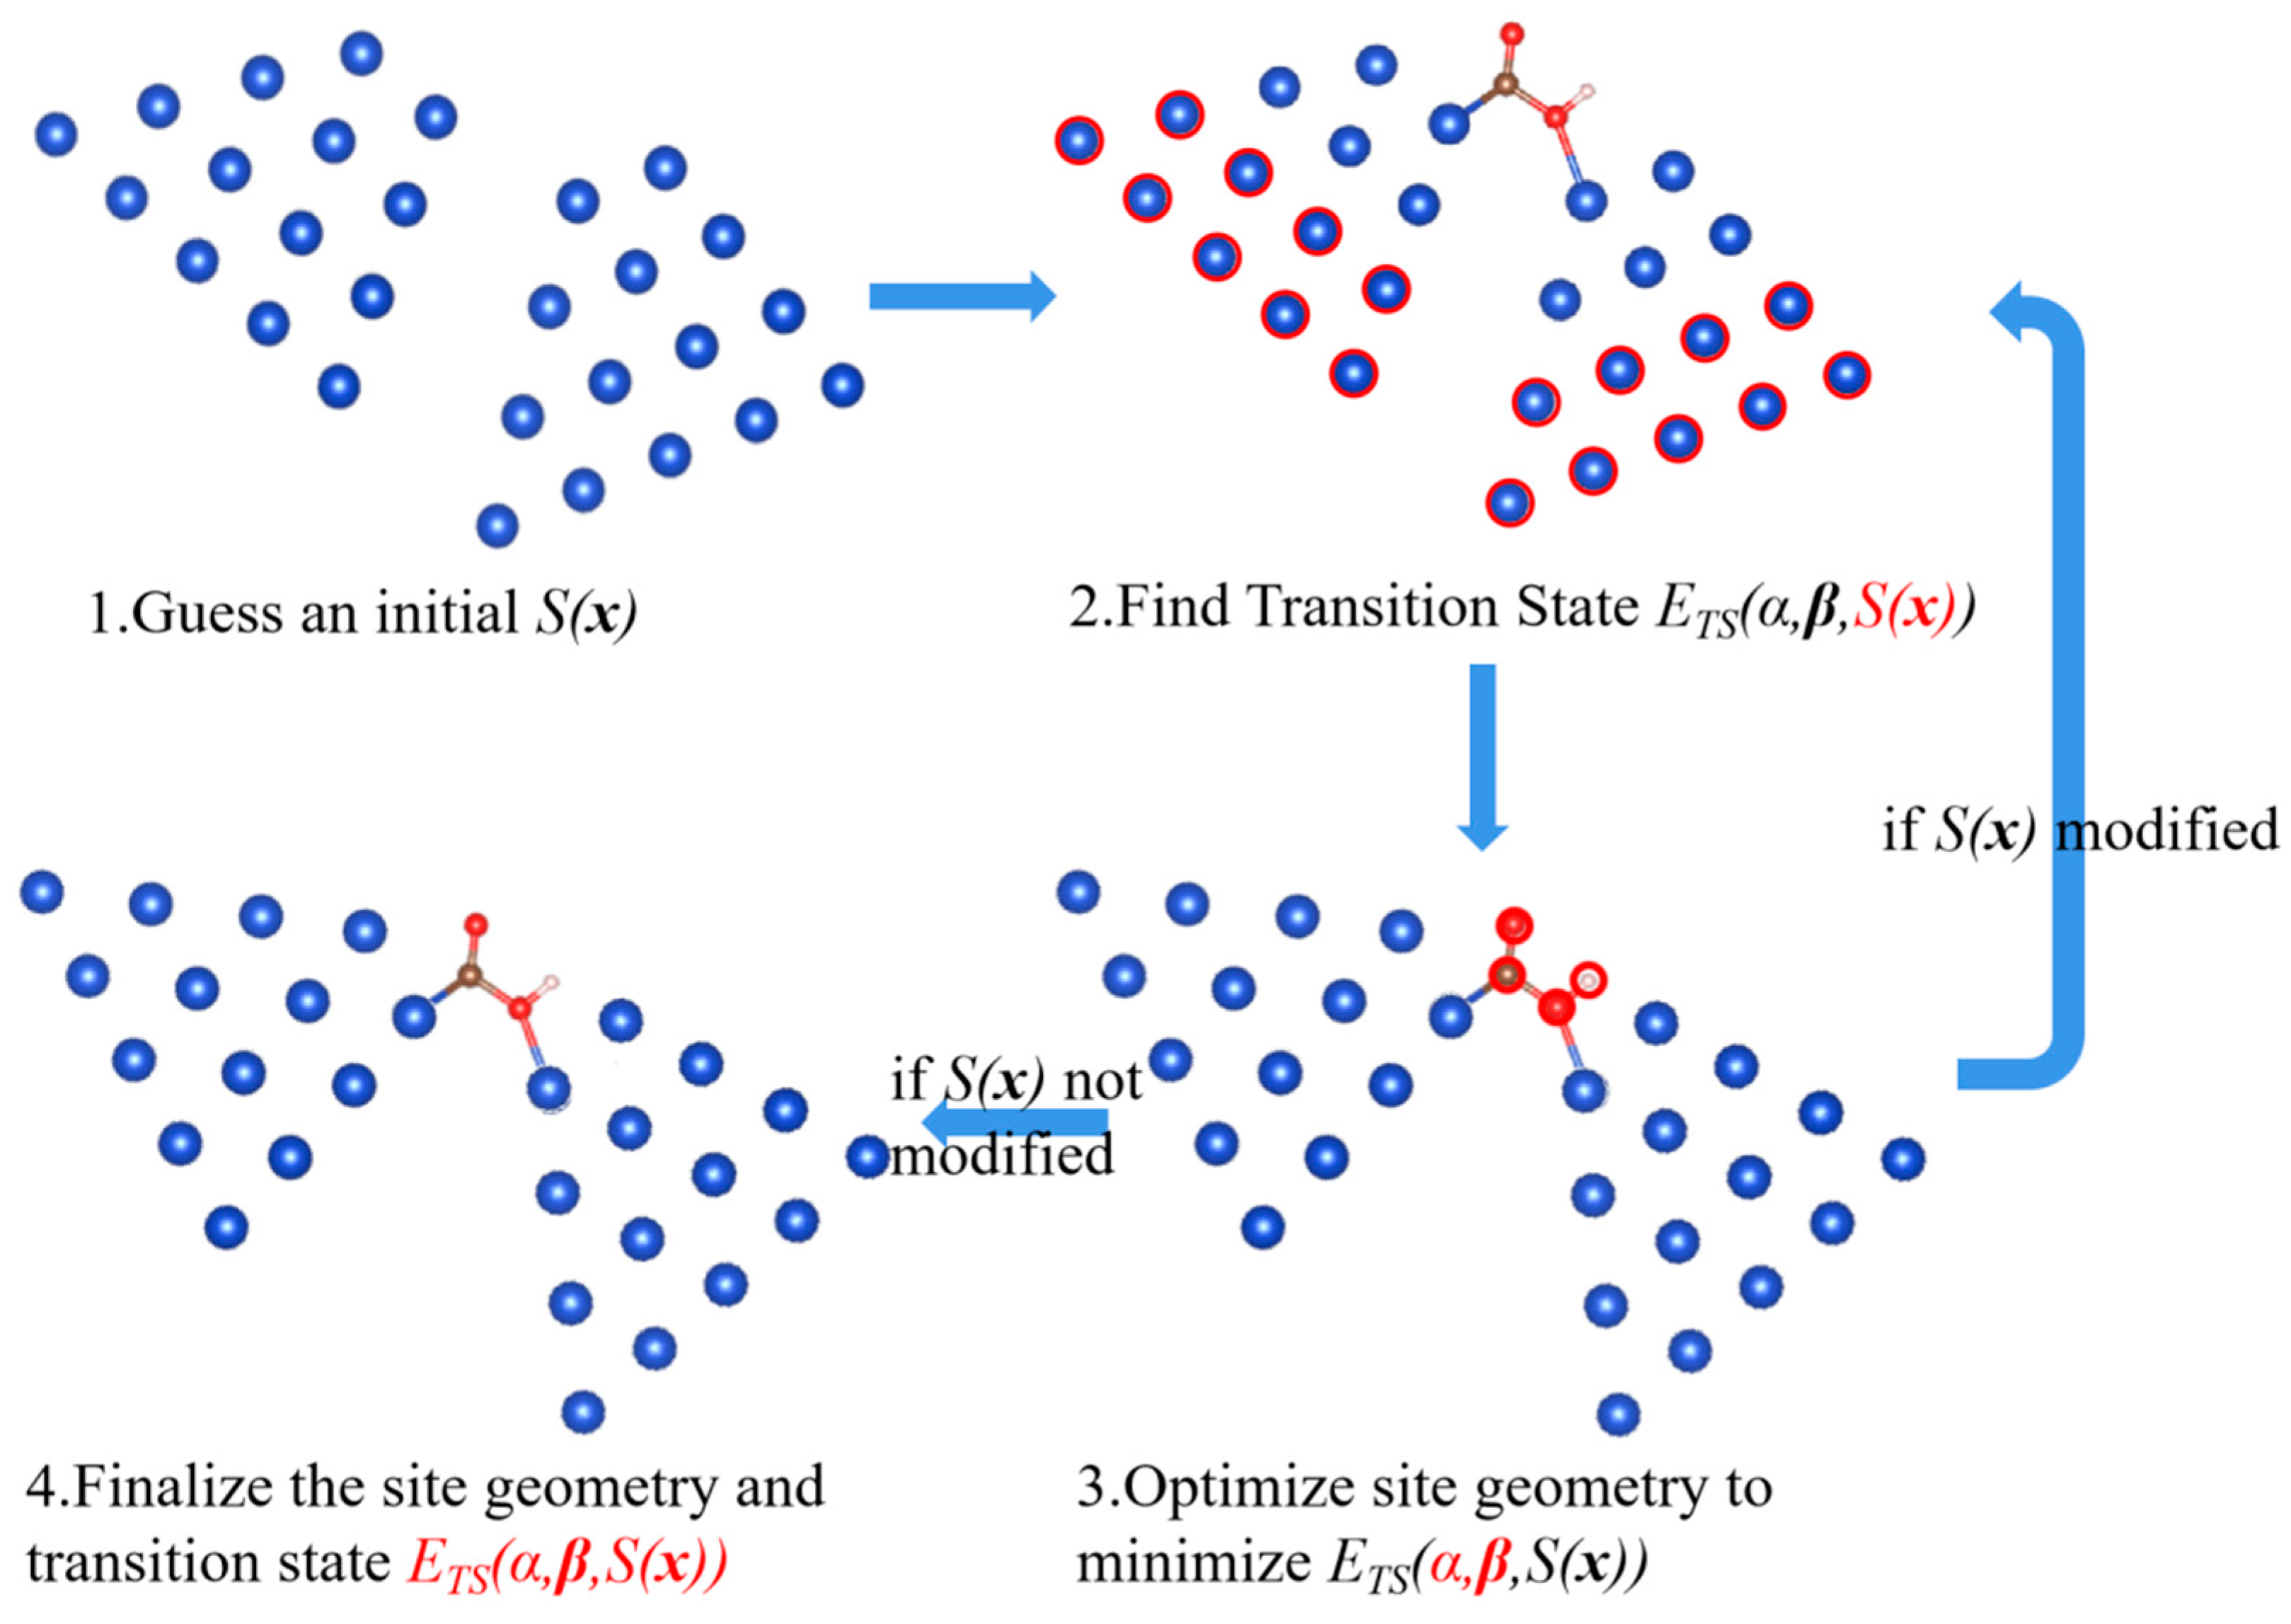
Begin with an initial guess of the site function S(x), as shown in Step 1 in Figure 2.
Find IS and FS on the site by using the DFT method to relax the adsorbates and the top-layer catalyst atoms, then find the reaction route and the transition state (referred to as Step 2 in Figure 2). In practice, the reaction route is represented by a few frames, which describe the configuration transitioning from IS to FS, and the frame with highest energy refers to the TS. In this step, S(x) is fixed, so the catalyst atoms are fixed in their positions, except for those in the top layers, which are allowed to relax.
Then, fix all the reactant atoms in all the frames describing the route, and adjust the variables in S(x) to minimize the transition state energy of the route. In practice, this is done by tuning one of the twelve variables at a time with Newton’s method to find the minimum TS energy of this specified route with respect to this one variable. Repeat for all the variables until the TS energy of this route can no longer be reduced by a threshold for any of the 12 variables (10−3 eV). The step is referred to as Step 3 in Figure 2. In this step, since all reactant atoms in all the frames are fixed, both α and β are fixed while S(x) is free to be adjusted. Note that, once S(x) is modified, the energy of all frames must be estimated over a different base line as indicated by Equation (1).
If any adjustment is made in Step 3, the route has reduced transition state energy on the modified site. However, due to the modifications, other routes with lower transition state energies may appear. Therefore, the modified site should be re-substituted to Step 2 and start another round of iteration.
Otherwise, if no adjustment is made in Step 3, this indicates that the state found is the transition state on the site. Its energy can no longer be reduced by changing the geometric features. This is exactly the case indicated by Equation (4). The optimization is finished, and the site and the transition state can be finalized, as referred to as Step 4 in Figure 2.
For the time complexity of this algorithm, we see that it contains an extra iteration over the traditional CI-NEB method. Considering that the outcome of this algorithm is the optimal geometry as well as the transition state, this time complexity is reasonable.
5. Result and Discussion
5.1. Theoretical Transition State Energy Limit on Separated Motifs
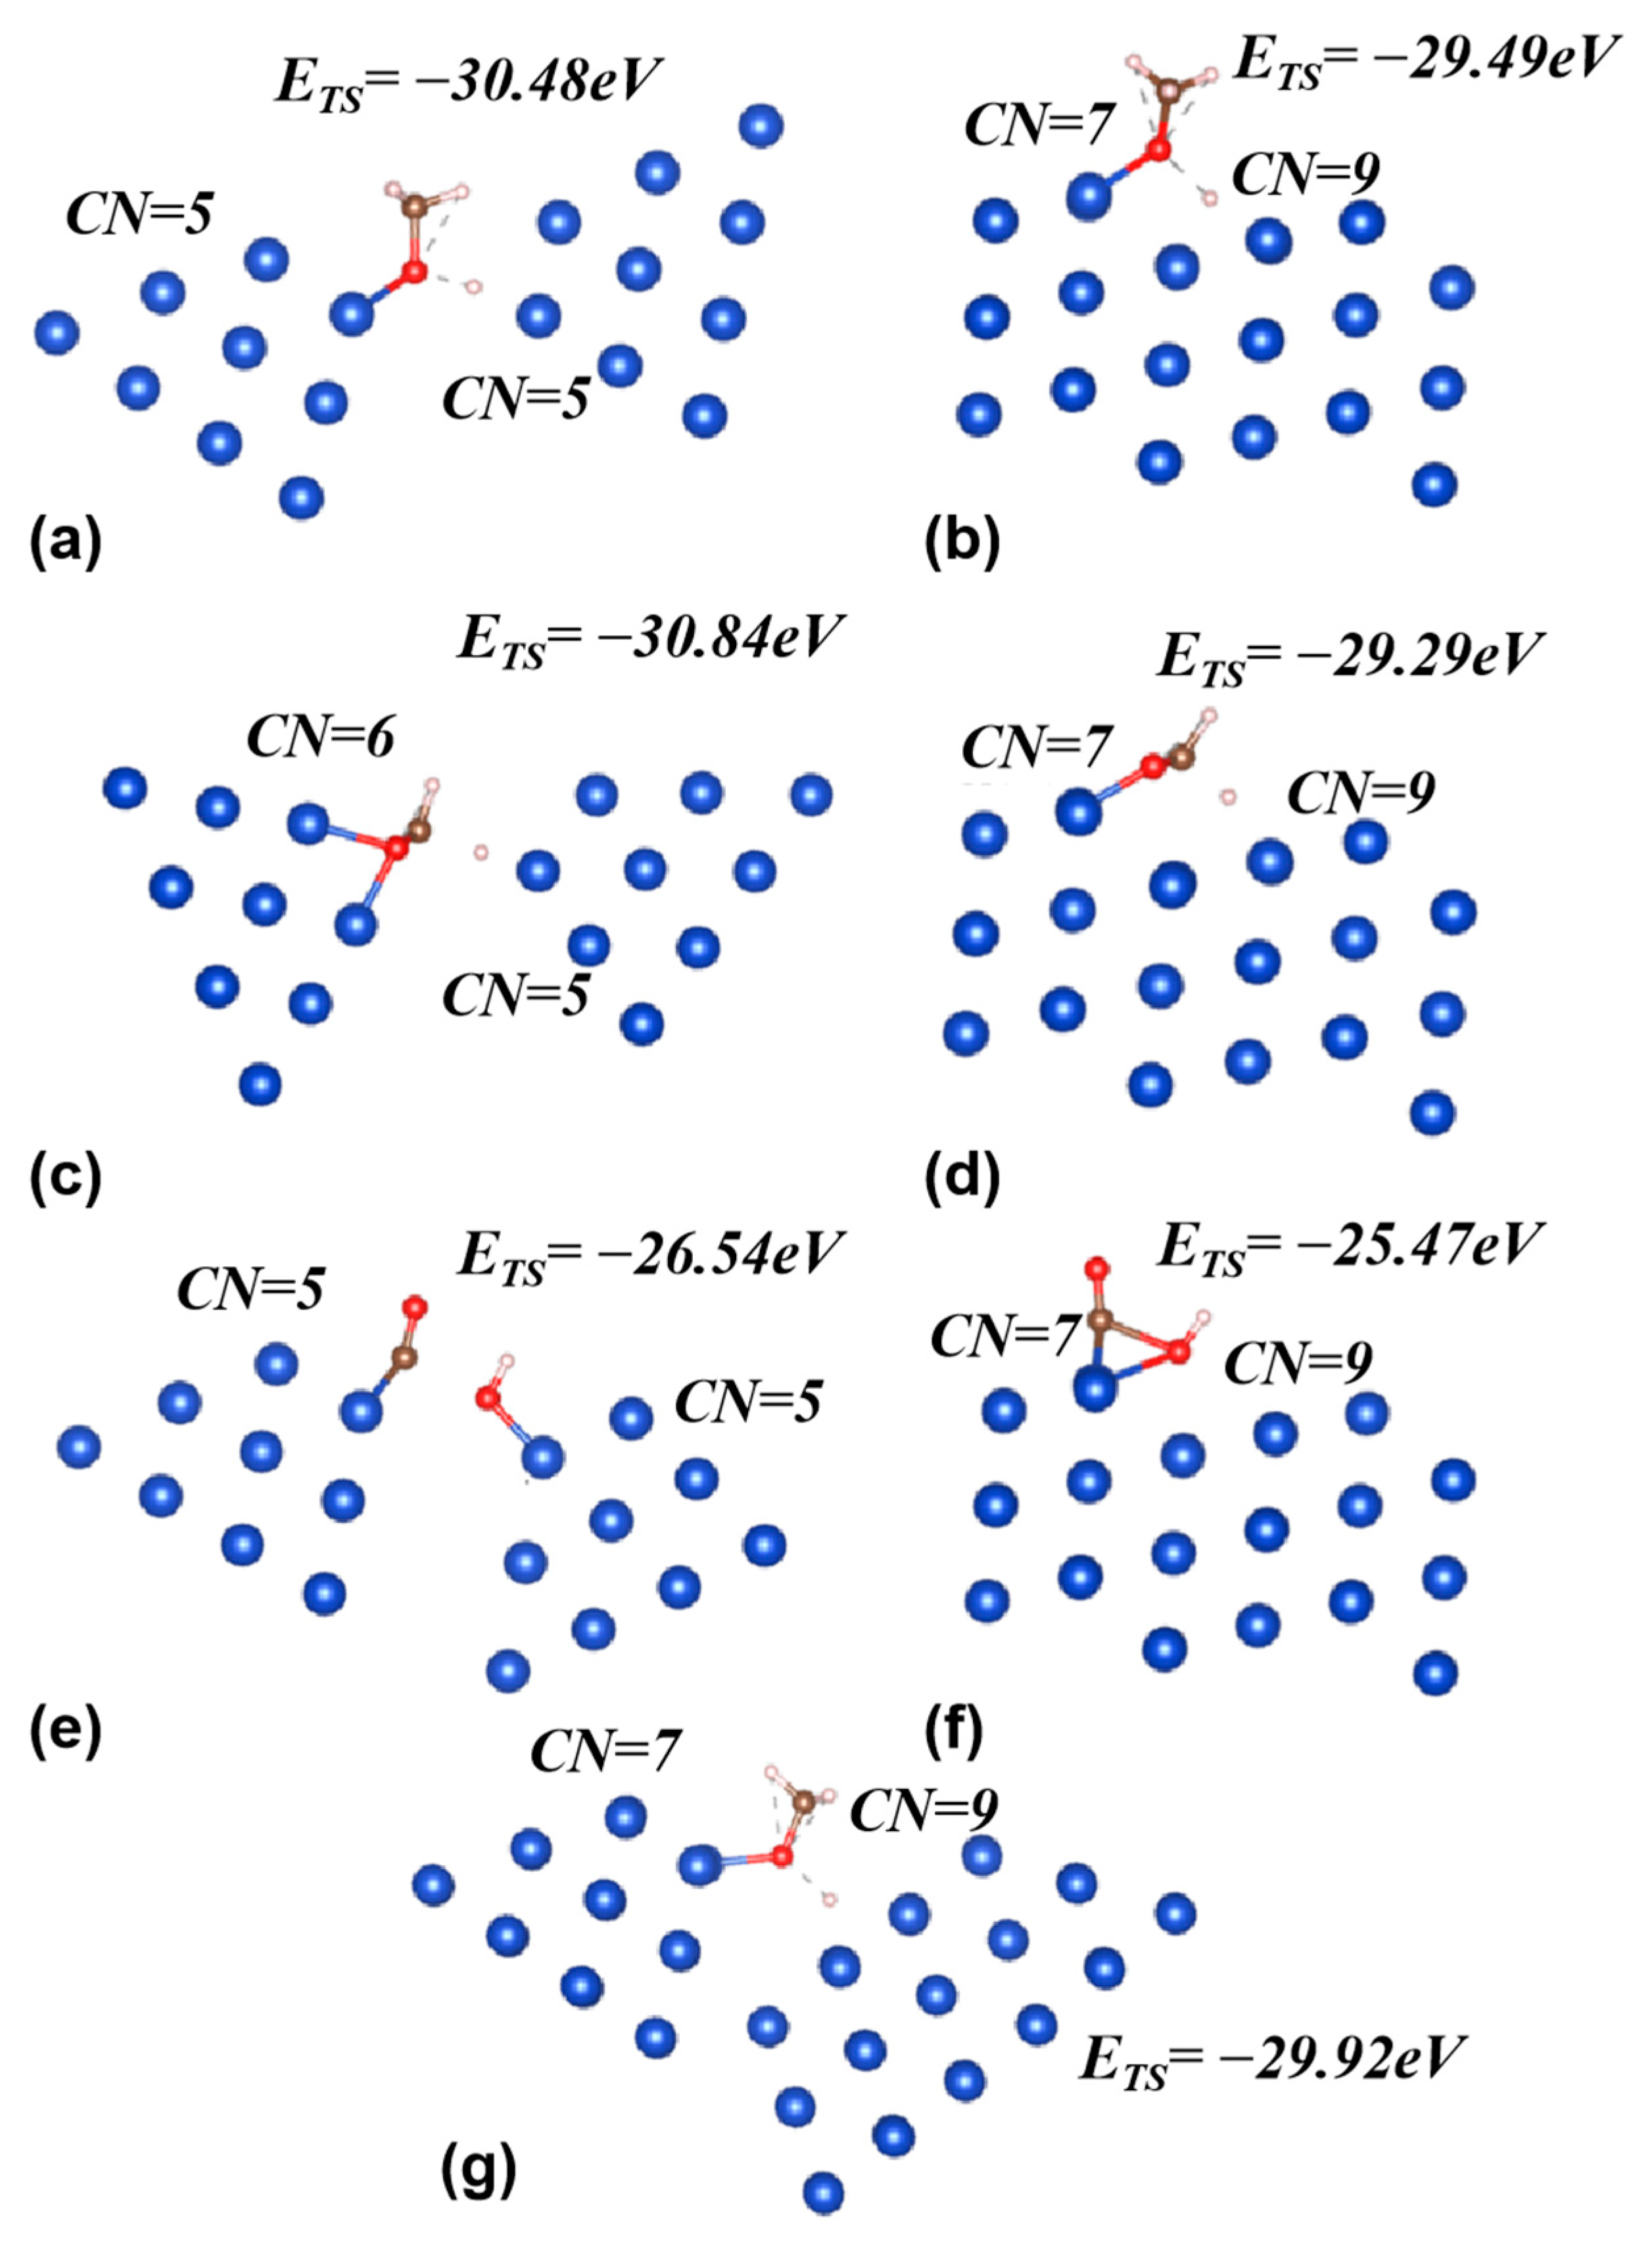
The above algorithm is applied to three elementary reactions over a copper base as examples, which are CH3O* + H* ↔ CH3OH*, HCO2* + H* ↔ H2CO2*, and CO* + OH* ↔ COOH*. The optimized site geometries and the transition state energies are obtained, and the results are compared with those obtained for the Cu211 facet, which is considered a facet with high activity. Note that these optimal sites are only effective for specified reaction steps and may be inefficient for other steps. Despite this, they still play a significant role by enhancing a single reaction step. As demonstrated in a previous study, under certain conditions, the elementary steps of a complete reaction can be allocated across different sites. This distribution seeks to maximize overall reaction efficiency and is referred to as “the assembly line reaction mode” [35].
The results are shown in Figure 3. The energy levels are obtained according to Equation (1) and corrected with zero-point energy (ZPE). The results obtained on Cu211 facets are similar to other reports [26,36].
In Figure 3, we see that the energy levels of the transition states on optimized sites are around 1.0~1.5 eV lower than those obtained on the Cu211 facet. There are two reasons for this difference. The first reason is the low CN (~5, for Cu211 edge atoms CN = 7) for the top-layer atoms at the optimized site; the other reason is the geometry optimization. To estimate the contributions of these two reasons, in Figure 3g the motifs are replaced in order to match the CN of the Cu211 facet (7 and 9), and the optimization is done for the reaction CH3O* + H* ↔ CH3OH*. The energy difference in TS between (a) and (g) is mostly due to the CN difference, while that between (b) and (g) is mostly due to the geometric features. For this reaction step, the contributions from the two factors are comparable (0.56 eV and 0.43 eV).
According to the degree of rate control (DRC) or the energetic span model (ESM), in a multi-step reaction, there are usually one or a few transition states and intermediates that determine the overall rate. At a moderate temperature (~500 K), a 0.5 eV difference in the rate-determining transition state energy can result in a 4–5 order of magnitude difference in the reaction rate. Therefore, the energy differences shown in Figure 3 are significant, indicating the importance of the geometric features. Similar results indicating the significance of site geometry have been also reported in a number of other studies [37,38]. It should be noted that a detailed micro-kinetic analysis is necessary to further estimate the significance of the energy variance for the reaction rate.
5.2. Insights into Geometric Optimization
The method and the results so far are solely a numerical approach. A discussion on the chemical physics will be helpful to better interpret the results. In this section, we will attempt to understand the method and results qualitatively from a few perspectives.
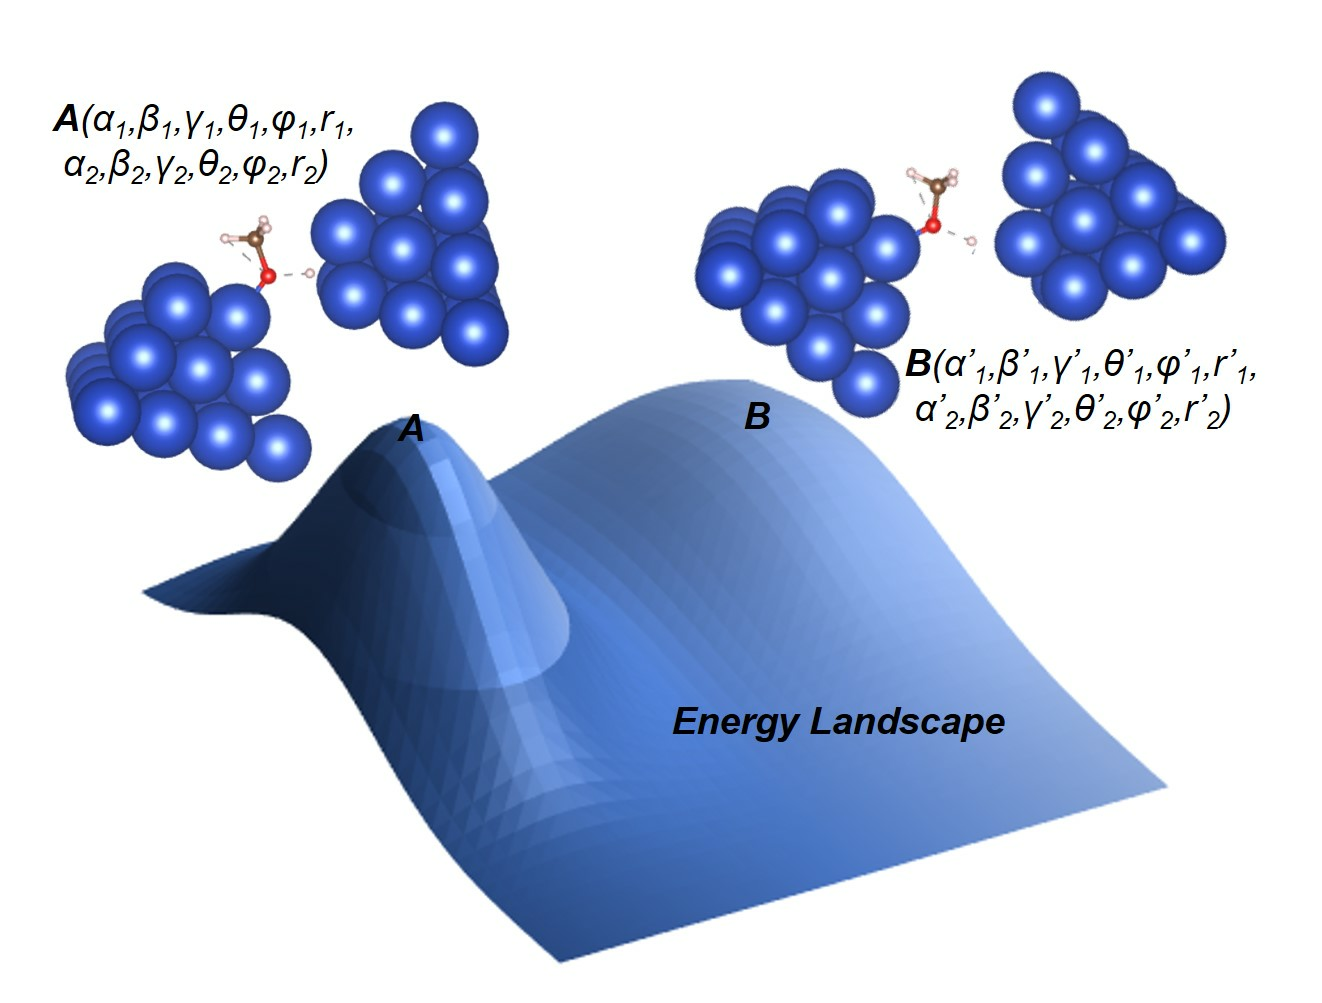
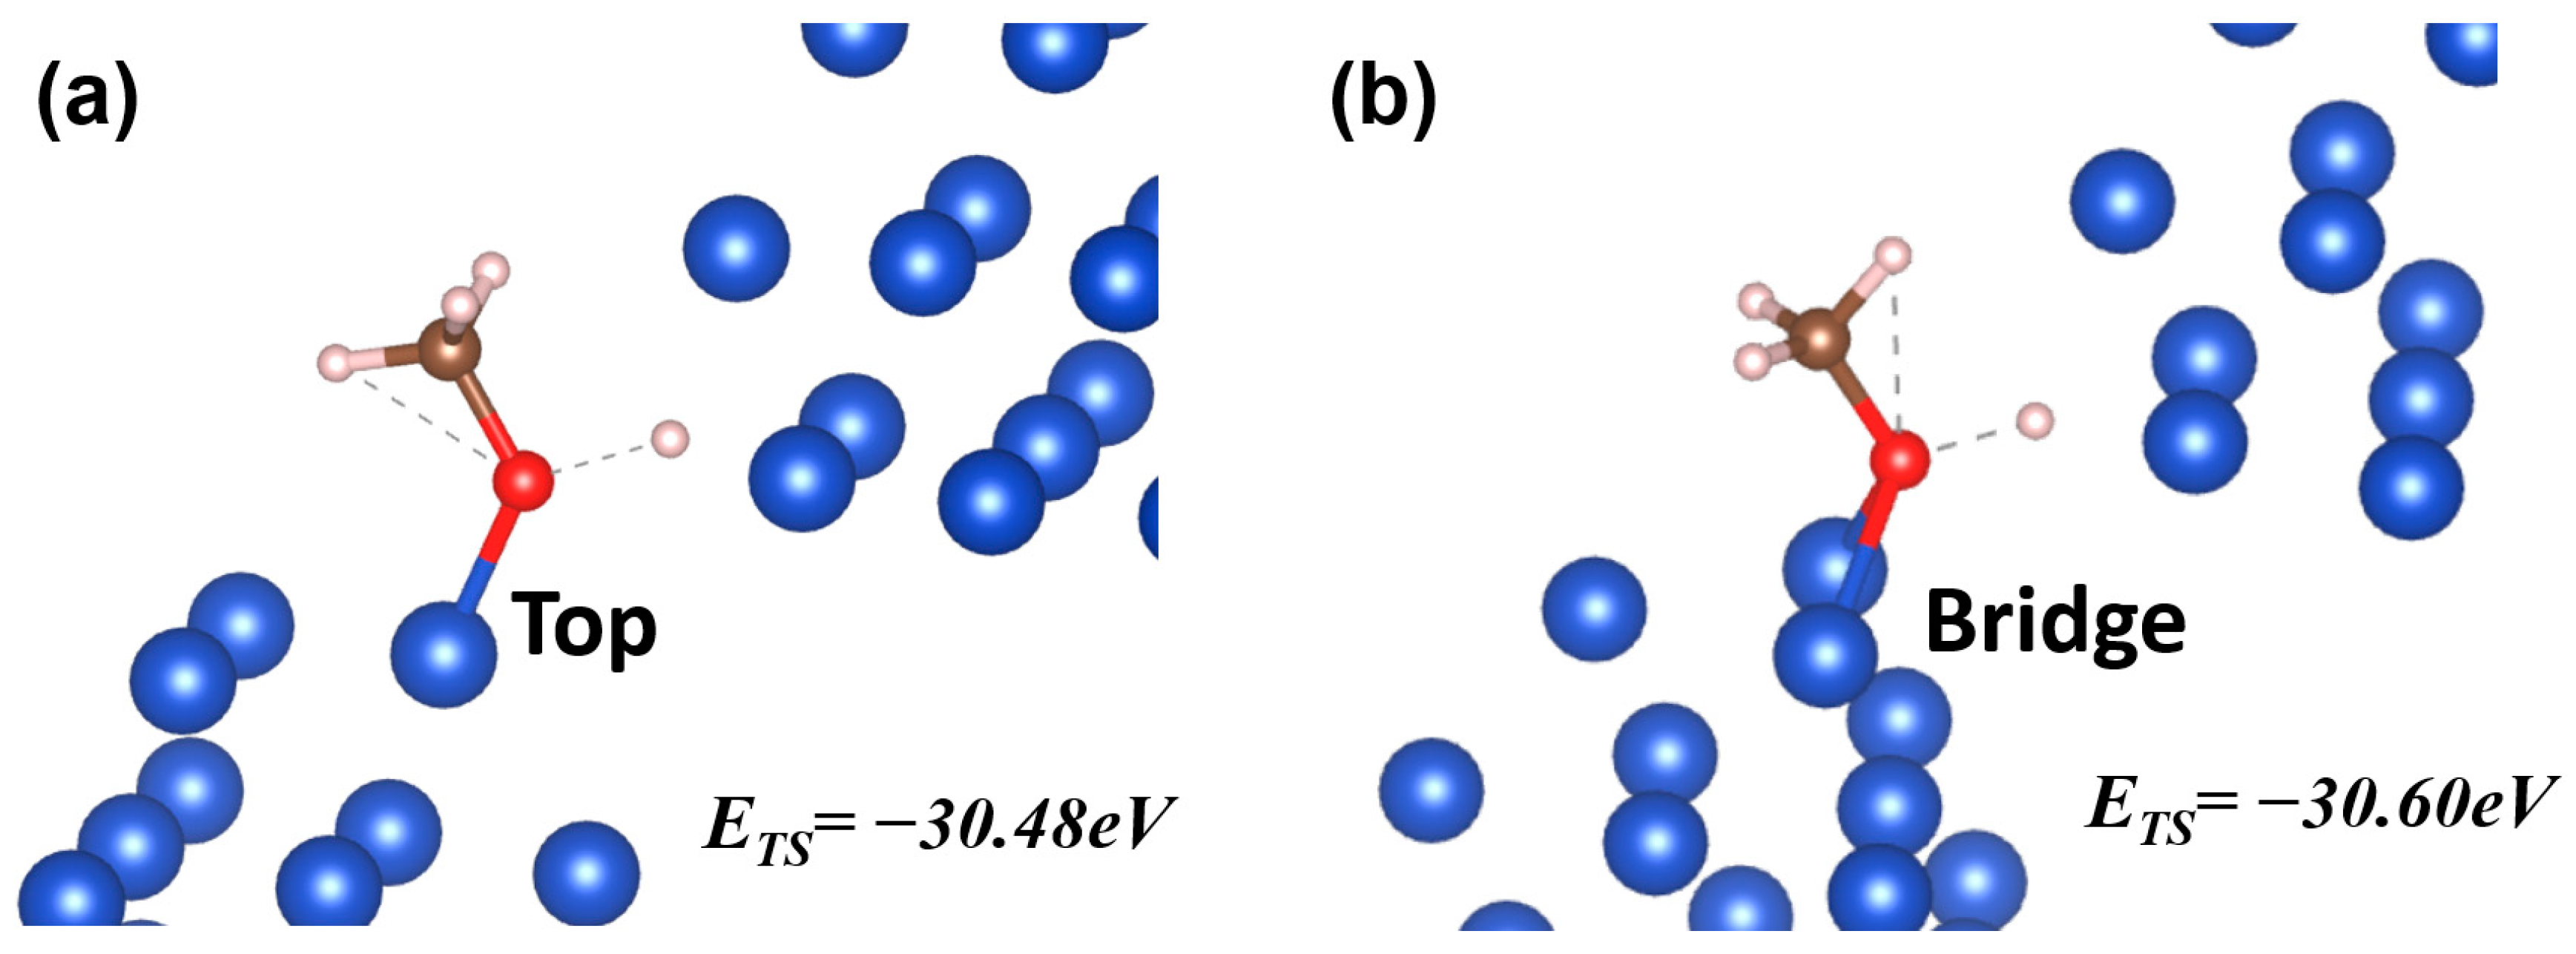
One question that arises from the results in Figure 3 is: are these results obtained with given motifs unique, or are there multiple optimal sites? The concern is reasonable, as Equation (4) only indicates a local minimum, while there can be multiple local minimums in the complete catalyst space even with all the assumptions made. To address the issue, we repeated the iteration for the reaction CH3O* + H* ↔ CH3OH* with a number of different initial guesses to check if they eventually converged to the same result. The results indicated that there are multiple local minimums; one of the results is shown in Figure 4, together with the previous result shown for comparison.
By comparing the two optimized site geometries in Figure 4, an obvious geometric difference can be attributed to the adsorption mode. Similar to the case for IS/FS, the reactants can interact with the motifs through a number of modes (top, bridge, hollow, etc.) in TS as well. In Figure 4a, the reactant molecule CH3O interacts with the motif through the top mode, while in Figure 4b it interacts through the bridge mode. The difference in TS energy level (~0.12 eV) is due to the different interaction modes. Therefore, we see that the site geometry found through the approach is a local optimal solution, associated with a combination of the interaction modes between the motifs and the reactant molecules.
Besides the adsorption mode, the two TS shown in Figure 4 are close. To describe the detailed geometric parameters, the angles and the lengths of bonds broken/formed during the reaction CH3O* + H* ↔ CH3OH* on different sites were measured and are listed in Table 1. Here, the bond length between the reactant and the motif is measured from the center of the nearest catalyst atom to the center of the reactant atom. For example, in the bridge mode the bond length is measured from the center of the two catalyst atoms that form the bridge. From Table 1, we see the bond angles are very close in the three cases on the optimized sites, while the difference in the bond lengths is slightly larger, partially due to the different adsorption modes. The configuration difference between those on the optimized sites and on the Cu211 facet is more significant. Based on this result, the transition state has a preferred configuration, and the energy variance due to the different adsorption modes only slightly changes this configuration. However, on an active site with a fixed geometry such as the Cu211 facet, the TS cannot adopt the optimized configuration due to the restraint of the site geometry, which leads to a higher TS energy. To summarize, the TS energy is dependent on the compatibility between the optimal TS configuration and the active site geometry.
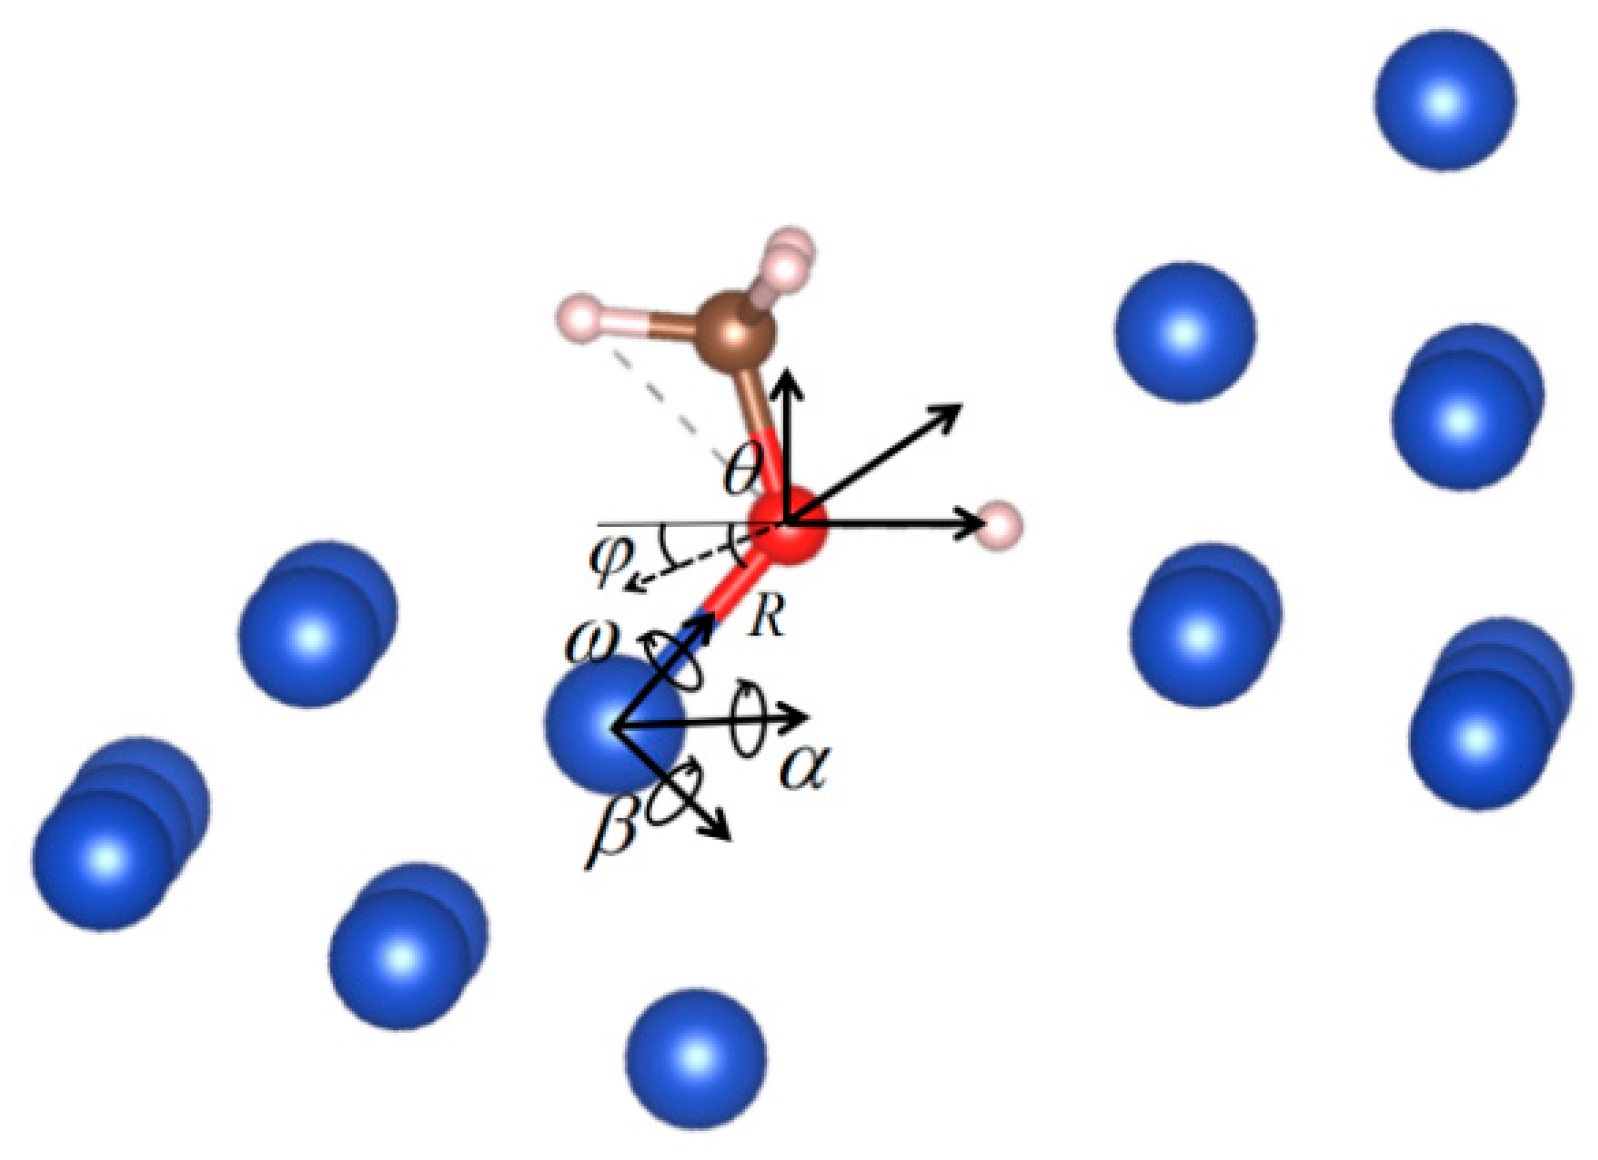
When introducing the model, we mentioned that six variables were applied to characterize the spatial features for each motif. Because the results are associated with the chemical bonds, it is clearer to express the six variables in a way that describes the bond between the reactant molecule and the catalyst motif, as shown in Figure 5. In the figure, there are still six variables: R is the only translational variable, which indicates the bond length; θ and ϕ are two rotational variables that determine the bond orientation relative to the reactant; α and β are two rotational variables that determine the bond orientation relative to the motif; and, finally, ω is the rotational variable that determines the relative angle between reactant and motif around the bond. Therefore, one translational and five rotational variables are applied to characterize the bond between the reactant and the motif, and a similar definition can be applied for the other motif, thus the geometric features of the site can be well defined.
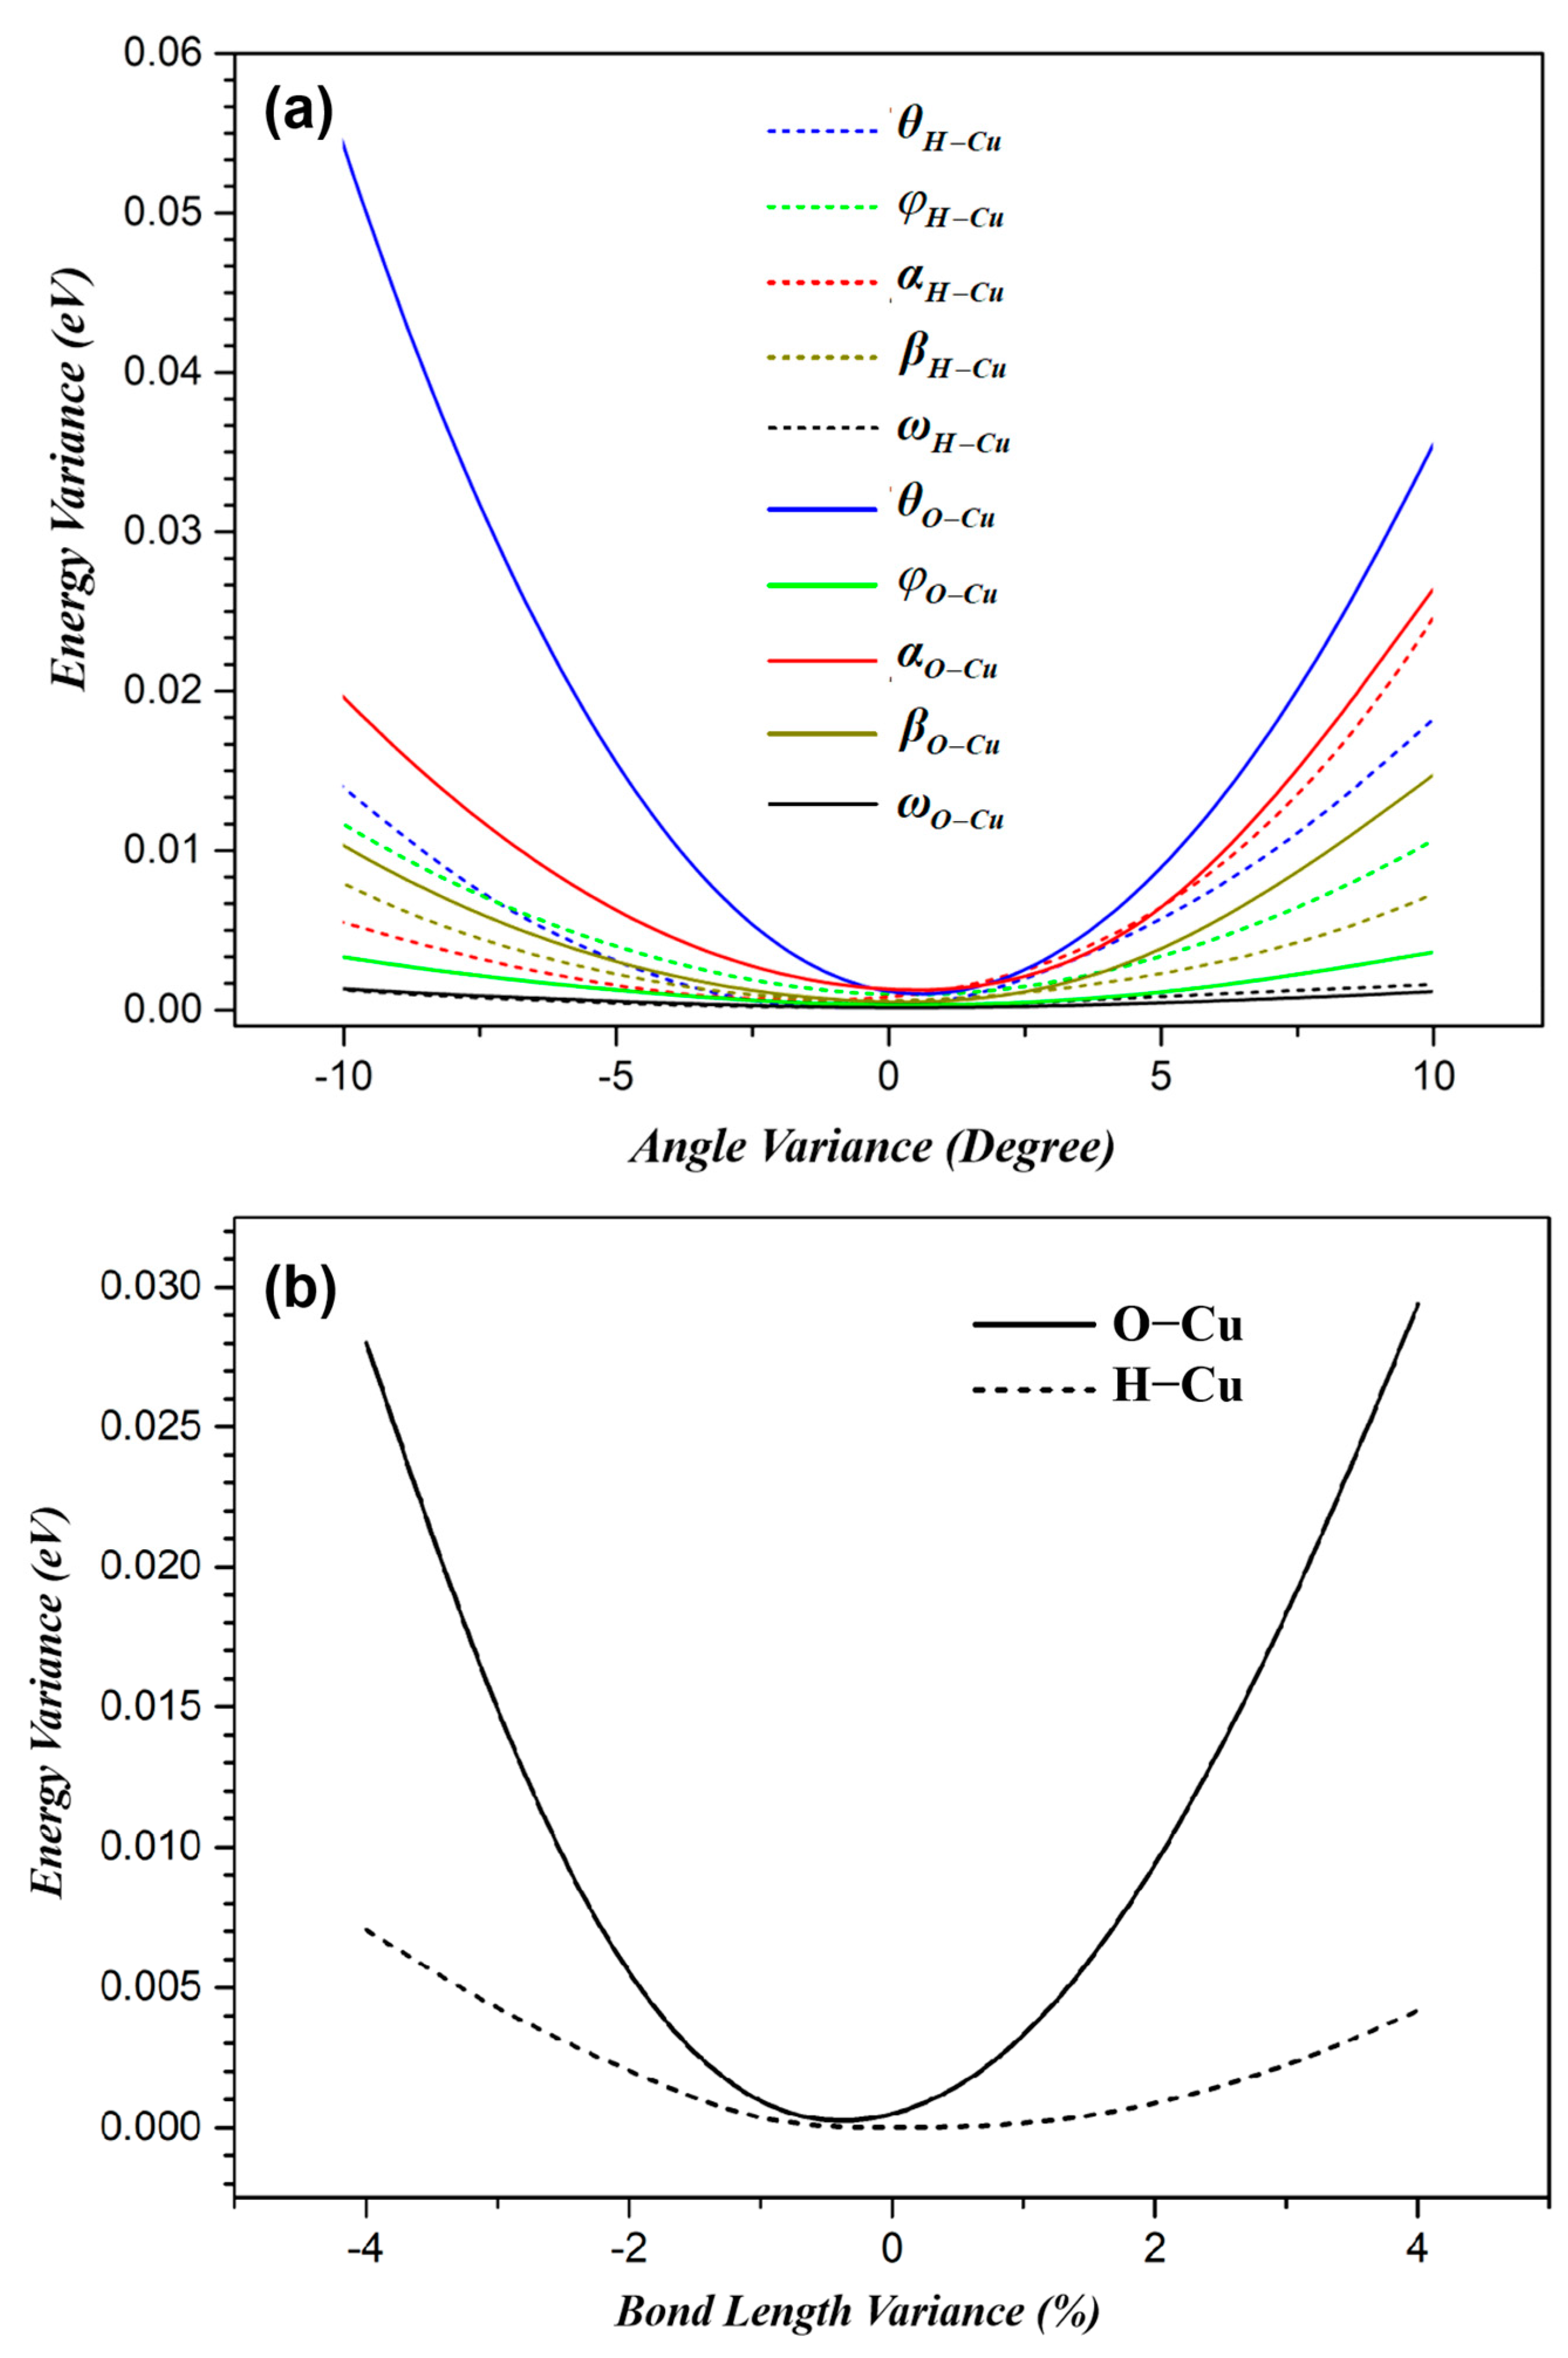
For the TS shown in both Figure 4a and Figure 5, its energy variations on the 12 variables are plotted in Figure 6. From the figure, we see that, in the TS, the bonds between the reactant molecules and the motifs are optimized. The different sensitivity of the TS energy to the angles/bond length is due to the electric density distribution in this state. This also reveals the chemical physics shown in Equation (4). The bond configuration between the catalyst and the reactant in TS is optimized by the optimal site geometry.
To summarize, given two specified motifs, the bonds to be formed/broken among the catalyst and the reactants are all determined. The proposed algorithm minimizes TS energy by finding the optimal configuration of these bonds. The geometry that is compatible with this optimal bond configuration is considered ideal for the active site.
5.3. Active Sites in Realistic Catalytic Reactions
The surface of a realistic catalyst is usually irregular, resulting in a vast diversity in site geometry. Some geometries are more stable due to their compatibility with the properties of the catalyst; the sites with such geometries are usually large in number. Some geometries are more active due to their compatibility with the key intermediates; the sites with such geometries may be fewer but can make a significant contribution to the reaction. In principle, the statistics of different sites, as well as their activities, should both be taken into consideration when evaluating the overall performance.
If the catalyst is relatively simple, the site geometries tend to be uniformly distributed with only a few defects or impurities. In these cases, one or a few typical geometries can represent the majority of all sites, making this a sensible choice for simulation applications. This has been a widely adopted simulation strategy, used in most studies.
However, contemporary catalyst performance enhancement often involves incorporating a co-catalyst to amplify multiplicities in the active components or the support. This strategy results in more frequent occurrence of interfaces, impurities, and defects, diminishing the constraints imposed by the catalyst properties, and consequently boosting overall catalytic efficiency [27,28,39,40]. Moreover, some catalysts have the intrinsic mechanism of adjusting their geometric features to favor certain reactions. For example, a protein’s structure is strongly correlated with its amino acid sequence; altering this sequence can lead to its structural change, and, in case the protein functions as a catalyst, its catalytic behavior may vary as well [41]. In these cases, the choice of a typical geometry becomes doubtful, as such geometry ceases to represent the majority of active sites, and it may not be favored by the reaction.
Ideally, such catalyst surfaces should be analyzed with many models representing the diversity in geometries at the atomic level. However, such a task is almost impractical. Researchers have to find one or a few site models to estimate the performance of such catalysts. A more plausible approach is to find the sites with ideal geometry. While these sites do not represent the majority either, due to their high activity, they potentially make the greatest contribution to the reaction. The method proposed in this work is proven to be capable of finding such sites.
Recently, some reports have suggested that designing 3D active sites is a potential approach to break the scaling relations [33]. This requires the catalyst to have enough sites with a designated site geometry favored by a specified reaction path. If such scenarios can be achieved on a realistic catalyst surface, some theoretical tools to identify 3D active site geometry are certainly necessary.
6. Conclusions
In this work, we briefly go through the theoretical fundamentals of TS and give a mathematical definition of the ideal site geometry which can minimize TS energy. A model is then proposed with two motifs to represent the adsorption point and 12 variables to describe the active site geometry. Based on this model, an algorithm is introduced to find the ideal site geometry. The algorithm can be implemented using the DFT tools and requires an iteration of the CI-NEB algorithm to find the optimal site geometry as well as the TS.
By analyzing the results obtained by applying the method to example reaction steps, the chemical physics insight achieved with the method is that the bonds to be broken/formed during the step have favored lengths/orientations in the TS, and that how compatible these are with the site geometry has a significant effect on TS energy.
The method proposed in this work can be utilized to theoretically estimate catalyst performance, especially when the catalyst surface is highly irregular. In the future, the design of 3D active sites is a potential approach to break the catalytic scaling relation, and the ideal geometry found by this method can provide guidance for the development of catalysts.
7. Method
The DFT calculations are carried out using the Vienna ab initio simulation package (VASP) [42,43,44] with projector-augmented wave density functional theory (PAW-DFT) [45,46,47]. For each simulation, the size of the unit cell is chosen, such that the two motifs can fit into a unit cell, with the reactants in the adjacent cells far enough (>10 Å) from each other. A typical unit cell size is around 15 Å × 30 Å × 25 Å. The K-points grid used for the integration of the Brillouin zone is specified to match the size of the unit cell (322 for the typical unit cell size). The kinetic energy cut-off is 400 eV for plane-wave expansion. It is considered converged when the energy change after the geometric optimization is less than 10−7 eV.
The motif is modeled using five layers of Cu atoms; each layer has a structure the same as the FCC 111 facet. Only the top two layers are allowed to relax to make sure the site geometry is generally stable within the reaction. The motif structure is characterized by the CN of the top-layer atoms. For example, a motif with CN = 5 is shown in Figure 1a; it has a pyramid-like structure, with only three atoms in the top layer, six atoms in the second layer, ten atoms in the third layer, etc. For the top-layer atoms, the CN is 5–7 as a moderate choice. Although a low CN for the top-layer atoms (4 or lower) leads to strong affinity between the motif and the reactants, it also causes a weaker affinity between the top-layer atoms and the lower-layer atoms. As a result, it is found that the structure of such a motif is severely deformed during reaction and thus is considered unstable. IS and FS are determined by optimizing the configurations of the reactants/products that bind to the site specified by S(x) using the DFT method. The transition states and the activation energies are calculated based on IS/FS values found using the climbing image nudged elastic band method (CI-NEB) [48,49]. The minimum energy path is discretized by at least 10 frames, including the two depicting IS and FS.
Funding
This research and the APC were funded by the International Partnership Program of the Chinese Academy of Sciences, grant number 211211KYSB20180020.
Data Availability Statement
No new data were created or analyzed in this study. Data sharing is not applicable to this article.
Conflicts of Interest
The authors declare no conflicts of interest.
References
- Ratnasamy, C.; Wagner, J.P. Water Gas Shift Catalysis. Catal. Rev. 2009, 51, 325–440. [Google Scholar] [CrossRef]
- Erisman, J.W.; Sutton, M.A.; Galloway, J.; Klimont, Z.; Winiwarter, W. How a Century of Ammonia Synthesis Changed the World. Nat. Geosci. 2008, 1, 636–639. [Google Scholar] [CrossRef]
- Shih, C.F.; Zhang, T.; Li, J.; Li, J.H.; Bai, C.L. Powering the Future with Liquid Sunshine. Joule 2018, 2, 1925–1949. [Google Scholar] [CrossRef]
- Kozuch, S.; Solel, E.; Tarannam, N. Catalysis: Energy is the Measure of All Things. Chem. Commun. 2019, 55, 5306–5322. [Google Scholar]
- Kozuch, S.; Shaik, S. How to Conceptualize Catalytic Cycles? The Energetic Span Model. Acc. Chem. Res. 2011, 44, 101–110. [Google Scholar] [CrossRef] [PubMed]
- Campbell, C.T. The Degree of Rate Control: A Powerful Tool for Catalysis Research. ACS Catal. 2017, 7, 2770–2779. [Google Scholar] [CrossRef]
- Stegelmann, C.; Andreasen, A.; Campbell, C.T. Degree of Rate Control: How Much the Energies of Intermediates and Transition States Control Rates. J. Am. Chem. Soc. 2009, 131, 13563. [Google Scholar] [CrossRef]
- Gokhale, A.A.; Kandoi, S.; Greeley, J.P.; Mavrikakis, M.; Dumesic, J.A. Molecular-level Descriptions of Surface Chemistry in Kinetic Models using Density Functional Theory. Chem. Eng. Sci. 2004, 59, 4679–4691. [Google Scholar] [CrossRef]
- Sholl, D.S.; Steckel, J.A. Density Function Theory: A Practical Introduction; Wiley: Hoboken, NJ, USA, 2009. [Google Scholar]
- Nørskov, J.K.; Studt, F.; Abild-Pedersen, F.; Bligaard, T. Fundamental Concepts in Heterogeneous Catalysis; Wiley: Hoboken, NJ, USA, 2014. [Google Scholar]
- Medford, A.J.; Vojvodic, A.; Hummelshj, J.S.; Voss, J.; Abild-Pedersen, F.; Studt, F.; Bligaard, T.; Nilsson, A. From the Sabatier Principle to a Predictive Theory of Transition-metal Heterogeneous Catalysis. J. Catal. 2015, 328, 36–42. [Google Scholar] [CrossRef]
- Wu, C.Y.; Zhang, P.; Zhang, Z.F.; Zhang, L.J.; Yang, G.Y.; Han, B.X. Efficient Hydrogenation of CO2 to Methanol over Supported Subnanometer Gold Catalysts at Low Temperature. Chem. Cat. Chem. 2017, 9, 3691–3696. [Google Scholar] [CrossRef]
- Oh, H.S.; Nong, H.N.; Reier, T.; Bergmann, A.; Gliech, M.; de Araujo, J.F.; Willinger, E.; Schlogl, R.; Teschner, D.; Strasser, P. Electrochemical Catalyst-support Effects and their Stabilizing Role for IrOx Nanoparticle Catalysts during the Oxygen Evolution Reaction. J. Am. Chem. Soc. 2016, 138, 12552–12563. [Google Scholar] [CrossRef] [PubMed]
- Yamamoto, K.; Imaoka, T.; Tanabe, M.; Kambe, T. New Horizon of Nanoparticle and Cluster Catalysis with Dendrimers. Chem. Rev. 2019, 120, 1397–1437. [Google Scholar] [CrossRef] [PubMed]
- Zhang, S.; Zhang, X.; Jiang, G.M.; Zhu, H.Y.; Guo, S.J.; Su, D.; Lu, G.; Sun, S.H. Tuning Nanoparticle Structure and Surface Strain for Catalysis Optimization. J. Am. Chem. Soc. 2014, 136, 7734–7739. [Google Scholar] [CrossRef] [PubMed]
- Matsubu, J.C.; Yang, V.N.; Christopher, P. Isolated Metal Active Site Concentration and Stability Control Catalytic CO2 Reduction Selectivity. J. Am. Chem. Soc. 2015, 137, 3076–3084. [Google Scholar] [CrossRef] [PubMed]
- Zhao, X.; Liu, Y. Unveiling the Active Structure of Single Nickel Atom Catalysis: Critical Roles of Charge Capacity and Hydrogen Bonding. J. Am. Chem. Soc. 2020, 142, 5773–5777. [Google Scholar] [CrossRef] [PubMed]
- Gawande, M.B.; Fornasiero, P.; Zboil, R. Carbon-Based Single Atom Catalysts for Advanced Applications. ACS Catal. 2020, 10, 2231–2259. [Google Scholar] [CrossRef]
- Li, Z.; Ji, S.F.; Liu, Y.W.; Cao, X.; Tian, S.B.; Chen, Y.J.; Niu, Z.G.; Li, Y.D. Well-Defined Materials for Heterogeneous Catalysis: From Nanoparticles to Isolated Single Atom Sites. Chem. Rev. 2020, 120, 623–682. [Google Scholar] [CrossRef]
- Huang, C.; Wen, J.; Sun, Y.; Zhang, M.; Chen, L. CO2 Hydrogenation to Methanol over Cu/ZnO Plate Model Catalyst: Effects of Reducing Gas Induced Cu Nanoparticle Morphology. Chem. Eng. J. 2019, 374, 221–230. [Google Scholar] [CrossRef]
- Huang, C.; Li, C.; Shi, G. Graphene based catalysts. Energy Environ. Sci. 2012, 5, 8848. [Google Scholar] [CrossRef]
- Breijyeh, Z.; Karaman, R. Enzyme Models-From Catalysis to Prodrugs. Molecules 2021, 26, 3248. [Google Scholar] [CrossRef]
- Poltorak, O.M.; Boronin, V.S. Mitohedry—A new method of studying active centres in crystalline catalysts. Russ. J. Phys. Chem. 1966, 40, 1436. [Google Scholar]
- Van Hardeveld, R.; Hartog, F. The statistics of surface atoms and surface sites on metal crystals. Surf. Sci. 1969, 15, 189. [Google Scholar] [CrossRef]
- Yang, Y.; Evans, J.; Rodriguez, J.A.; White, M.G.; Liu, P. Fundamental Studies of Methanol Synthesis from CO2 Hydrogenation on Cu(111), Cu Clusters, and Cu/ZnO(0001). Phys. Chem. Chem. Phys. 2010, 12, 9909–9917. [Google Scholar] [CrossRef] [PubMed]
- Behrens, M.; Studt, F.; Kasatkin, I.; Kuhl, S.; Havecker, M.; Abild-Pedersen, F.; Zander, S.; Girgsdies, F.; Kurr, P.; Kniep, B.L.; et al. The Active Site of Methanol Synthesis over Cu/ZnO/Al2O3 Industrial Catalysts. Science 2012, 336, 893–897. [Google Scholar] [CrossRef] [PubMed]
- Kuld, S.; Thorhauge, M.; Falsig, H.; Elkjaer, C.F.; Helveg, S.; Chorkendorff, I.; Sehested, J. Quantifying the Promotion of Cu Catalysts by ZnO for Methanol Synthesis. Science 2016, 352, 969–974. [Google Scholar] [CrossRef] [PubMed]
- Tang, Q.L.; Ji, W.C.; Russell, C.K.; Zhang, Y.L.; Fan, M.H.; Shen, Z. A New and Different Insight into the Promotion Mechanisms of Ga for the Hydrogenation of Carbon Dioxide to Methanol over a Ga-doped Ni(211) Bimetallic Catalyst. Nanoscale 2019, 11, 9969–9979. [Google Scholar] [CrossRef]
- Yang, H.; Wong, M. Automatic Conformational Search of Transition States for Catalytic Reactions Using Genetic Algorithm. J. Phys. Chem. A 2019, 123, 10303–10314. [Google Scholar] [CrossRef]
- Grimme, S. Exploration of Chemical Compound, Conformer, and Reaction Space with Meta-Dynamics Simulations Based on Tight-Binding Quantum Chemical Calculations. J. Chem. Theory Comput. 2019, 15, 2847–2862. [Google Scholar] [CrossRef]
- Zhao, Q.; Hsu, H.; Savoie, B. Conformational Sampling for Transition State Searches on a Computational Budget. J. Chem. Theory Comput. 2022, 18, 3006–3016. [Google Scholar] [CrossRef]
- Guan, Y.; Ingman, V.; Rooks, B.; Wheeler, S. AARON: An Automated Reaction Optimizer for New Catalysts. J. Chem. Theory Comput. 2018, 14, 5249–5261. [Google Scholar] [CrossRef]
- Chen, B.W.; Xu, L.; Mavrikakis, M. Computational Methods in Heterogeneous Catalysis. Chem. Rev. 2021, 121, 1007–1048. [Google Scholar] [CrossRef] [PubMed]
- Calle-Vallejo, F.; Loffreda, D.; Koper, M.T.M.; Sautet, P. Introducing Structural Sensitivity into Adsorption–energy Scaling Relations by Means of Coordination Numbers. Nat. Chem. 2015, 7, 403–410. [Google Scholar] [CrossRef] [PubMed]
- Liu, R. Dynamic Microkinetic Modeling for Heterogeneously Catalyzed Hydrogenation Reactions: A Coverage-Oriented View. ACS Omega 2021, 6, 29432–29448. [Google Scholar] [CrossRef] [PubMed]
- Studt, F.; Behrens, M.; Kunkes, L.E.; Thomas, N.; Zander, S.; Tarasov, A.; Schumann, J.; Frei, E.; Varley, B.J.; Abild-Pedersen, F.; et al. The Mechanism of CO and CO2 Hydrogenation to Methanol over Cu-Based Catalysts. ChemCatChem 2015, 7, 1105–1111. [Google Scholar] [CrossRef]
- Rusydi, F.; Aisyah, N.D.; Fadilla, R.N.; Dipojono, H.K.; Rusydi, A. The transition state conformational effect on the activation energy of ethyl acetate neutral hydrolysis. Heliyon 2019, 5, e02409. [Google Scholar] [CrossRef] [PubMed]
- Zhang, J.; Li, Y.; Liu, Z.; Li, G.; Fan, H.; Jiang, L.; Xie, H. Ligand-mediated reactivity in co oxidation of niobium-nickel monoxide carbonyl complexes: The crucial roles of the multiple adsorption of co molecules. J. Phys. Chem. Lett. 2019, 10, 1566–1573. [Google Scholar] [CrossRef] [PubMed]
- Wang, L.; Sofer, Z.; Pumera, M. Will Any Crap We Put into Graphene Increase Its Electrocatalytic Effect? ACS Nano 2021, 14, 21–25. [Google Scholar] [CrossRef]
- Larmier, K.; Liao, W.C.; Tada, S.; Lam, E.; Verel, R.; Bansode, A.; Urakawa, A.; Comas-Vives, A.; Coperet, C. CO2-to-Methanol Hydrogenation on Zirconia-Supported Copper Nanoparticles: Reaction Intermediates and the Role of the Metal-Support Interface. Angew. Chem. Int. Ed. 2017, 56, 2318–2323. [Google Scholar] [CrossRef]
- Voet, D.; Voet, J.G. Biochemistry, 2nd ed.; Wiley, John Wiley & Sons Inc.: Hoboken, NJ, USA, 1995. [Google Scholar]
- Kresse, G.; Hafner, J. Ab initio Molecular Dynamics for Open-shell Transition Metals. Phys. Rev. B 1993, 48, 13115–13118. [Google Scholar] [CrossRef]
- Kresse, G.; Hafner, J. Ab initio Molecular Dynamics for Liquid Metals. Phys. Rev. B 1993, 47, 558–561. [Google Scholar] [CrossRef]
- Kresse, G.; Hafner, J. Ab initio Molecular-dynamics Simulation of the Liquid-metal–amorphous-semiconductor Transition in Germanium. Phys. Rev. B 1994, 49, 14251–14269. [Google Scholar] [CrossRef] [PubMed]
- Kresse, G.; Joubert, D. From Ultrasoft Pseudopotentials to the Projector Augmented-wave Method. Phys. Rev. B 1999, 59, 1758–1775. [Google Scholar] [CrossRef]
- Blöchl, P.E. Projector Augmented-wave Method. Phys. Rev. B 1994, 50, 17953–17979. [Google Scholar] [CrossRef] [PubMed]
- Hafner, J. Ab-initio Simulations of Materials using VASP: Density-functional Theory and Beyond. J. Comput. Chem. 2008, 29, 2044–2078. [Google Scholar] [CrossRef]
- Sheppard, D.; Xiao, P.H.; Chemelewski, W.; Johnson, D.D.; Henkelman, G. A Generalized Solid-state Nudged Elastic Band Method. J. Chem. Phys. 2012, 136, 074103. [Google Scholar] [CrossRef]
- Sheppard, D.; Terrell, R.; Henkelman, G. Optimization Methods for Finding Minimum Energy Paths. J. Chem. Phys. 2008, 128, 385–404. [Google Scholar] [CrossRef]
Figure 1.
(a) The configuration of a five-layer motif. Each layer has a structure similar to a FCC 111 facet. The blue atoms make up the catalyst support. The silver atoms make up the adsorption point. When finding TS with the CI-NEB method, the blue atoms are fixed while the silver atoms are allowed to relax. The top-layer atoms are marked with the red circles; they can directly interact with the reactants and are characterized by their CN, which is 5 in this figure. (b) Sketch of a reaction site composed of two motifs. Each motif can translate or rotate and can be characterized by six variables. During the reaction step, the reactants are in the reaction area marked in red. The support area is outside the reaction area, and the catalyst atoms in the support area have little effect on the reaction. Note that there can be other catalyst atoms in the support area to stabilize the atom configuration in the reaction area.

Figure 2.
The four steps to optimize site geometry composed of two motifs. Blue indicates the catalyst atoms; brown (C), red (O), and white (H) indicate the reactant atoms. In the figure, the atoms and the variables marked as red are fixed in that step.
Figure 2.
The four steps to optimize site geometry composed of two motifs. Blue indicates the catalyst atoms; brown (C), red (O), and white (H) indicate the reactant atoms. In the figure, the atoms and the variables marked as red are fixed in that step.

Figure 3.
The transition states of CH3O* + H* ↔ CH3OH* (a,b,g); HCO2* + H* ↔ H2CO2* (c,d); and CO* + OH* ↔ COOH* (e,f) on the optimized sites (a,c,e), Cu211 facet (b,d,f), and site with a similar CN as Cu211 (g). The energy levels of the TS estimated with Equation (1) are marked as well. Note that for the reaction HCO2* + H* ↔ H2CO2*, a different motif, with CN = 6 for the top-layer atoms, is applied for HCO2* adsorption. In the figure, blue, brown, red, and white indicate Cu, C, O, and H atoms. Only three top layers of Cu atoms are shown.

Figure 4.
Two TS on different optimized sites. In (a), the reactant molecule interacts with the motif through the top mode, while in (b) it is through the bridge mode. The energy levels of the two TS have a difference of 0.12 eV.
Figure 4.
Two TS on different optimized sites. In (a), the reactant molecule interacts with the motif through the top mode, while in (b) it is through the bridge mode. The energy levels of the two TS have a difference of 0.12 eV.

Figure 5.
The six variables regarding the Cu-O bond for the corresponding motif: R indicates the length of the bond; θ and ϕ indicate the bond orientation relative to the reactant molecule; α and β indicate the bond orientation relative to the motif; and ω indicates the angle between the reactant and the motif around the bond. In this specific case, θ is defined in the plane defined by the C-O bond and the O-H bond and α refers to the rotation around an axis perpendicular to that plane. Another similar set of six variables can be found for the H-Cu bond for the other motif.

Figure 6.
The energy variance in TS with bond orientation (a) and bond length (b). The variance is obtained by fixing the reactant molecule in space while adjusting the angles or the bond lengths as indicated in Figure 5.
Figure 6.
The energy variance in TS with bond orientation (a) and bond length (b). The variance is obtained by fixing the reactant molecule in space while adjusting the angles or the bond lengths as indicated in Figure 5.


Table 1.
The geometric features of the TS shown in Figure 3 and Figure 4. Here, M1 is the center of the catalyst atoms nearest to the oxygen atom, while M2 is the center of the catalyst atoms nearest to the hydrogen atom (referred to as H*). Note that the different adsorption modes for O-M and H-M bonds can significantly affect the bond length.
| Bond Length (Å) | Figure 4a | Figure 4b | Figure 3g | Figure 3b |
| O-C | 1.44 | 1.45 | 1.43 | 1.42 |
| O-M1 | 1.90 | 1.71 | 1.94 | 1.93 |
| O-H | 1.51 | 1.37 | 1.60 | 1.61 |
| H-M2 | 1.44 | 1.60 | 1.27 | 1.30 |
| Bond Angle (degree) | Figure 4a | Figure 4b | Figure 3g | Figure 3b |
| ∠M1OC | 123.8 | 124.3 | 121.0 | 133.9 |
| ∠COH | 105.5 | 104.9 | 106.9 | 120.3 |
| ∠HOM1 | 130.7 | 130.8 | 131.9 | 103.4 |
| ∠OHM2 | 0.5 | 5.3 | 14.0 | 33.5 |
Disclaimer/Publisher’s Note: The statements, opinions and data contained in all publications are solely those of the individual author(s) and contributor(s) and not of MDPI and/or the editor(s). MDPI and/or the editor(s) disclaim responsibility for any injury to people or property resulting from any ideas, methods, instructions or products referred to in the content. |
© 2023 by the author. Licensee MDPI, Basel, Switzerland. This article is an open access article distributed under the terms and conditions of the Creative Commons Attribution (CC BY) license (https://creativecommons.org/licenses/by/4.0/).
Share and Cite
MDPI and ACS Style
Liu, R. Ideal Site Geometry for Heterogeneous Catalytic Reactions: A DFT Study. Catalysts 2024, 14, 34. https://doi.org/10.3390/catal14010034
AMA Style
Liu R. Ideal Site Geometry for Heterogeneous Catalytic Reactions: A DFT Study. Catalysts. 2024; 14(1):34. https://doi.org/10.3390/catal14010034
Chicago/Turabian StyleLiu, Runcong. 2024. "Ideal Site Geometry for Heterogeneous Catalytic Reactions: A DFT Study" Catalysts 14, no. 1: 34. https://doi.org/10.3390/catal14010034
Note that from the first issue of 2016, this journal uses article numbers instead of page numbers. See further details here.