Article

Effects of Mott–Schottky Frequency Selection and Other Controlling Factors on Flat-Band Potential and Band-Edge Position Determination of TiO2

The Eduardo Torroja Institute for Construction Sciences (IETcc—CSIC), 28033 Madrid, Spain
*
Author to whom correspondence should be addressed.
Catalysts 2023, 13(6), 1000; https://doi.org/10.3390/catal13061000
Submission received: 26 April 2023 / Revised: 1 June 2023 / Accepted: 5 June 2023 / Published: 13 June 2023
(This article belongs to the Special Issue Photocatalysis in Air Purification)

Abstract

:
The use of titanium dioxide for tackling environmental pollution has attracted great research interest recently. The potential of a photocatalyst in removing contaminants depends mainly on its conduction and valence-band edges relative to the standard potential of reactive oxygen species. One of the methods used in determining these band-edge positions is via the Mott–Schottky analysis. Thus, the aim of this work was to investigate the influence of the Mott–Schottky frequency and different electrochemical conditions on flat-band potential values and band-edge positions of pure anatase or Degussa P25, calcined or uncalcined in a 0.2 M Na2SO4 solution. The results showed that the shift in the flat-band potential was not so frequency-dependent in the Mott–Schottky analysis, however, other reasons, such as immersion duration leading to thenardite Na2SO4 salt deposition on the surface, irradiation of sources and the change in the pH of the solution (in the range of 1.64–12.11) were also responsible for it. In general, both the calcined anatase and P25 had a less negative value of the flat-band potential compared to the uncalcined. On the other hand, the calcined anatase had a tendency to have a less negative value of the flat-band potential than the calcined P25. From this study, the frequency range for obtaining the flat-band potential within one standard deviation in the Mott–Schottky at a single-frequency analysis was found to be between 200 and 2000 Hz. The energy difference between the Fermi level and the conduction band edge for anatase and P25, either calcined or uncalcined, was 0.097–0.186 and 0.084–0.192 eV, respectively. On the other hand, the band-edge position of anatase or P25 tended to shift upwards when it was repeatedly used in the photoelectrochemical analysis.

Graphical Abstract

1. Introduction

In recent years, titanium dioxide (TiO2) has become the most extensively used metal oxide semiconductor in the field of environmental cleaning [1,2,3,4] and clean energy production [5,6,7,8,9,10]. The reasons for that mainly lie on the fact that TiO2 has inherently unique properties, such as nontoxicity and great stability, as well as having a good photoactivity. The photoactivity of a semiconductor depends mainly on two essential parameters: the band-edge positions and the energy band-gap (Eg) [6,7,11,12]. The band-edge positions consist of conduction band edge (EC) and valence band edge (EV). However, EC and EV cannot be measured directly using electrochemical methods. The estimation of EC and EV can be obtained via the determination of the flat-band potential (Vfb) from electrochemical experiments. There are several electrochemical methods for obtaining Vfb [13], however, the Mott–Schottky analysis has been the most used because it permits Vfb and Nd (charge carrier density) to be determined, and subsequently, the band-edge positions can be constructed.
The Mott–Schottky analysis involves the total interfacial capacitances of a metal oxide semiconductor as a function of applied potentials, with each applied potential being coupled with a range of perturbation frequencies. Traditionally, electrochemical impedance spectroscopy, involving a range of perturbation frequencies, has been adopted to obtain the interfacial capacitances for each applied potential. This Mott–Schottky electrochemical impedance spectroscopy (MS-EIS) analysis has been well-investigated for its complexities and pitfalls [13,14]. The following parameters have been set up for MS-EIS: (a) the range of applied potentials should not fall in the potential region where proton insertion would occur [15,16], and (b) the range of perturbation frequencies is typically between 105 and 0.1 Hz [13]. In the MS-EIS analysis, the impedance spectrum obtained at each applied potential will have to be fitted with a suitable equivalent circuit model to extract the values of space-charge capacitance (CSC) at the thin film interface and Helmholtz capacitance (CH) at the electrolyte interface based on a proper understanding of the interfacial behaviour across the range of the applied potentials. This technique has been well-investigated, however, it is usually time-consuming as it involves searching for a suitable equivalent circuit model for fixing the impedance spectrum corresponding to each of the applied potentials.
Thus, the adoption of Mott–Schottky at a single-frequency (MS-SF) analysis will usually be considered by researchers when CH is considered negligible with Nd being less than 1023 m−2 [13], especially for undoped or low-doped semiconductors [17,18,19]. To obtain a nearly constant value of Vfb of TiO2 based on the MS-SF analysis, some researchers proposed that a suitable range of frequencies should be between 10 and 1000 Hz [20,21], while others proposed between 500 and 1500 Hz [17,18,22] or even a higher frequency region between 5 and 45 kHz [12,23]. Until now, no systematic studies have properly addressed this issue. On the other hand, it has also been reported that Vfb is irradiation intensity-dependent [24] as well as pH-dependent, with a negative linear relationship being erected between them that follows the Nernst Equation [25,26,27,28].
In view of the above, a systematic study on frequency-dependent capacitance by Mott–Schottky analysis was undertaken, in which different TiO2 thin films (anatase and P25—uncalcined and calcined at 400 °C) immersed in a 0.2 M Na2SO4 solution were characterized from 10 to 6000 Hz to investigate the influence of frequency on the determination of Vfb. This work revealed that the obtained Vfb is not so frequency dependent in an MS-SF analysis, and the thenardite Na2SO4 salt deposition on the surface of the nano-compact TiO2 thin film after a prolonged MS-SF analysis was reported. Then, a suitable frequency was selected to be coupled with the MS-SF analysis to study the influence of irradiation sources, immersion duration, and solution pHs on the Vfb of pure Anatase. A relationship between Vfb vs. time under different irradiation sources and Vfb vs. pH of pure anatase in the laboratory light was presented. The plots between ΔE vs. frequency, irradiation sources, and pH, together with the band-edge positions for photocatalytic activity prediction, were also analyzed.

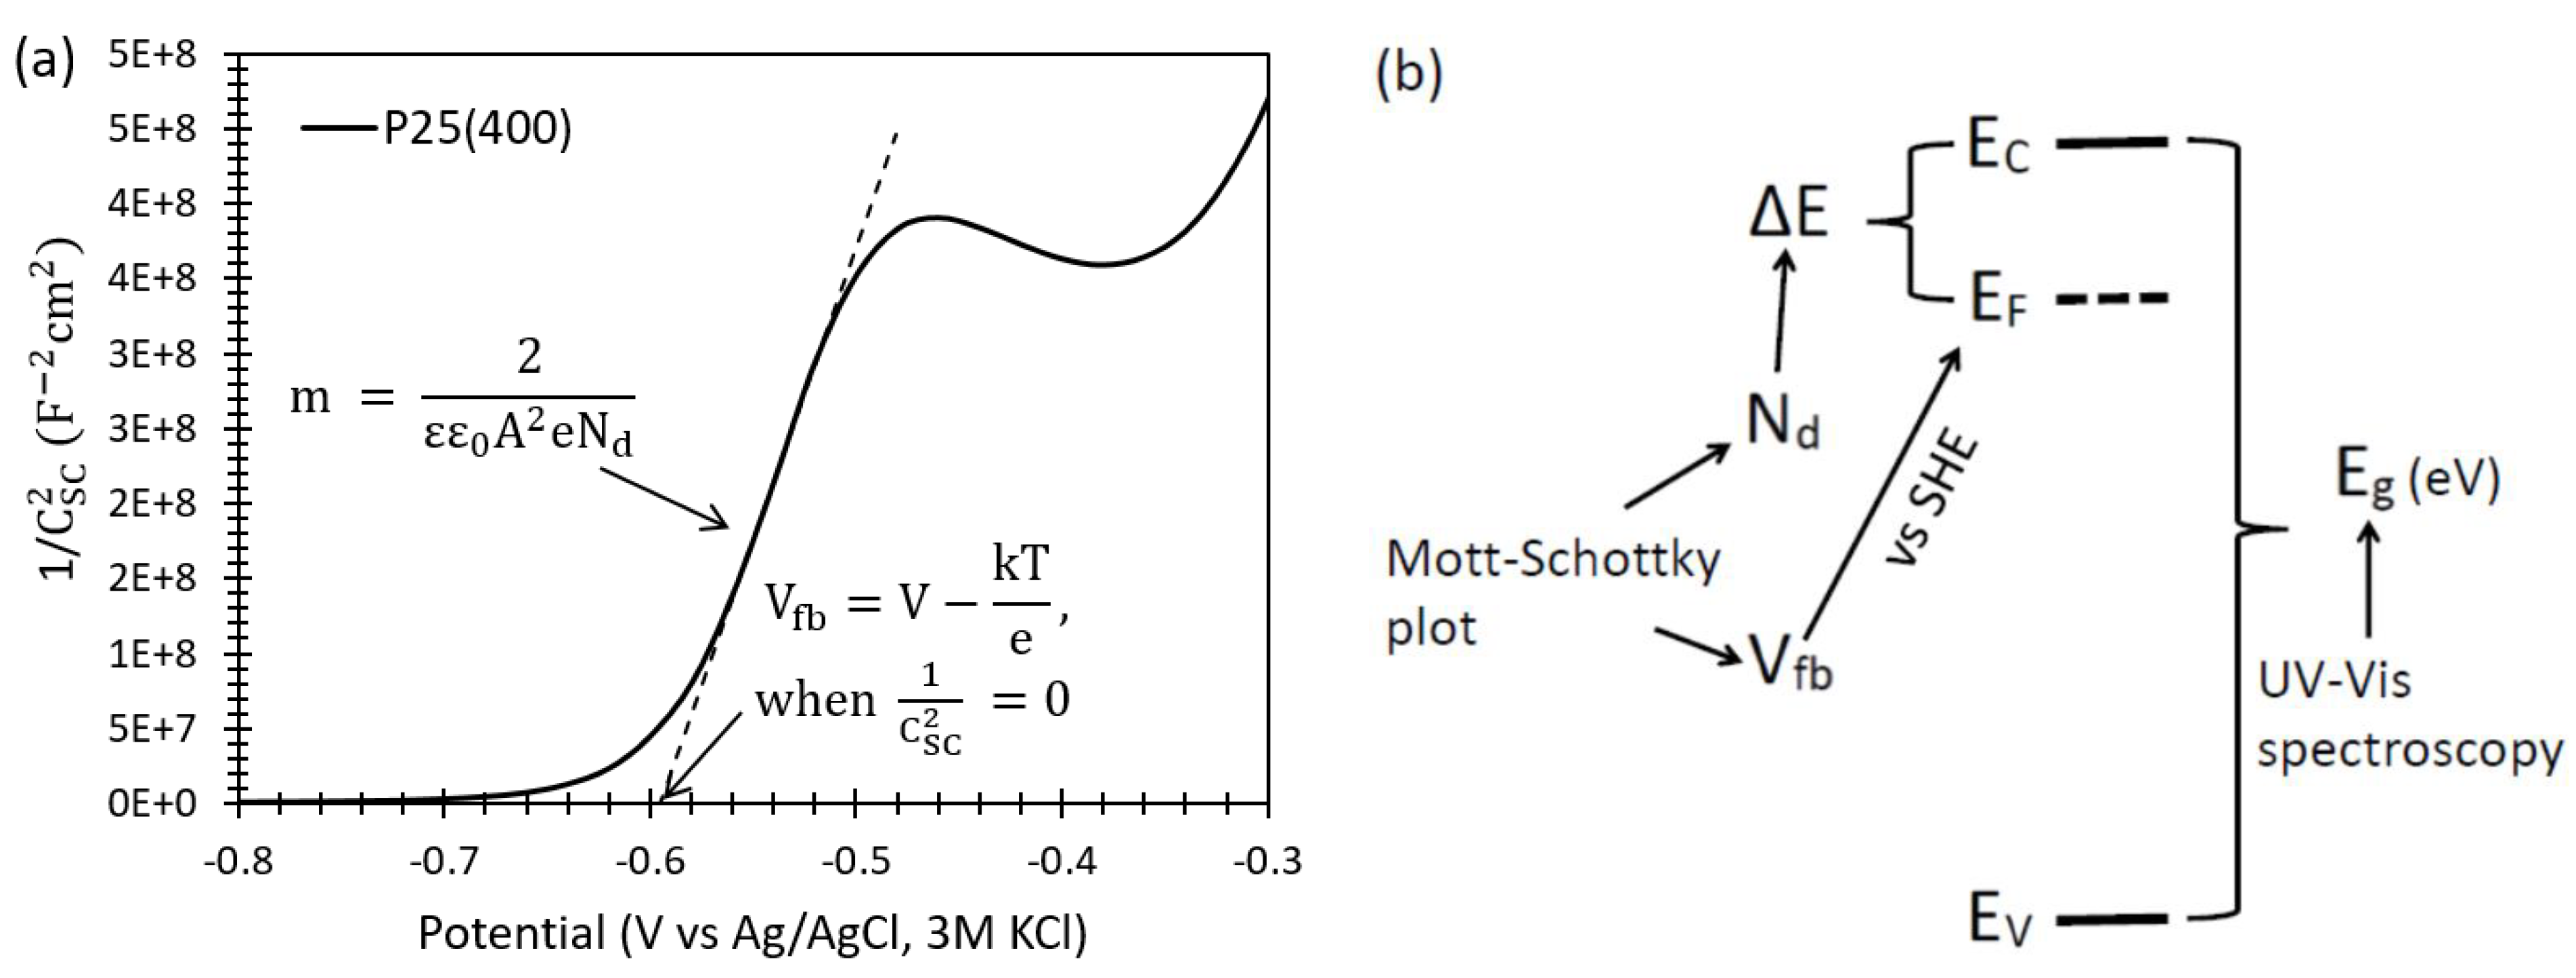
Theory on Band Edges Construction from MS-SF Analysis

The Mott–Schottky equation is principally based on the measurement of the total capacitances (CT), which is the sum of the space-charge capacitance (CSC), chemical capacitance (Cμ), and Helmholtz capacitance (CH) induced at the n-type metal-oxide-semiconductor/solution interface over a range of applied potentials (V).
1 C T 2 = 2 e ε ε 0 A 2 N d ( V V fb k B T e )
where e is the electronic charge (1.60 × 10⁻¹⁹ C), ɛ the relative permittivity of the n-type metal-oxide-semiconductor thin-film (where ɛ = 55 for TiO2 thin-film [29]), ɛ0 the vacuum permittivity (8.85 × 10⁻¹⁴ Fcm−1), A the exposed surface area (cm), kB the Boltzmann constant (1.38 × 10⁻²³ m2kgs−2K−1), and T the temperature in Kelvins.
Cμ needs to be taken into consideration in the calculation of CT when the n-type metal-oxide-semiconductor thin-film has a nano size of roughly between 1 and 10 nm, involving discrete energy (quantum effect) [30], or the system is polarized to a sufficiently negative potential than Vfb that involves the proton insertion into TiO2 thin-film [15,16]. Otherwise, CT usually consists of CSC at the thin-film interface and CH at the electrolyte interface, with both capacitances being put in series with each other:
1 C T = 1 C SC + 1 C H
It is theoretically proven that for an Nd less than 1023 m−2, CH can be considered negligible, especially for undoped or low-doped semiconductors (n-type) [13]. Thus, CT ≈ CSC. For n-type metal oxide semiconductors, when CH becomes negligible, the Mott–Schottky equation is, thus, as below:
1 C SC 2 = 2 e ε ε 0 A 2 N d ( V V fb k B T e )
In this case, CSC can then be calculated from the imaginary part of the measured impedance (Zim) obtained over a range of applied potentials based on the following relation:
C SC = 1 2 π fZ im
where f is a frequency that is coupled to the applied potentials in the MS-SF analysis.
A Mott–Schottky plot is thus displayed as a graph of 1 C s c 2 versus V, as shown in Figure 1a that is taken from one of the samples used in this study. The positive linear slope reveals that the nano-compact TiO2 thin-film is an n-type metal oxide semiconductor. Given that 1 C s c 2 = 0 , Equation (3) becomes V V fb k B T e = 0 . Thus,
V fb = V k B T e
and
N d = 2 e ε ε 0 A 2 m
where m is the slope of the Mott–Schottky plot in Figure 1a. The energy difference between EF and EC (ΔE in eV) in Figure 1b can be obtained as below:
Δ E = E C   E F =   k B TIn ( N d N v )
with kB being expressed in 8.62 × 10⁻⁵ eVK−1, T in K, and NV being the effective density of the states in the conduction band, which can be calculated as shown below:
N v = 2 ( 2 π m * k B h 2 ) 3 / 2
with m*, the effective mass of the electron, being 0.1412 m0 for the TiO2 thin-film, where m0 is 9.11 × 10⁻³¹ kg, kB (1.38 × 10⁻²³ m2kgs−2K−1), and h the Planck constant (6.63 × 10⁻³⁴ kgm−2s−1).
By referring to the standard hydrogen electrode (SHE), Vfb is assigned as Fermi Level (EF) [11,31], as demonstrated in Figure 1b. The ΔE is usually below 0.3 eV [11,31,32], which is small compared to Eg, which has a value of 3.30 eV for anatase [33], 3.02 eV for rutile [34], and 3.20–3.25 eV for P25 [6,7]. Thus, Vfb is sometimes taken directly as EC for the band edge determination [35], while Eg can be obtained from UV-Vis spectroscopy.

2. Experiment

2.1. Sample Preparation

Two types of commercial TiO2 were adopted, which were pure anatase (Hombikat UV-100, Sachtleben Chemie, Germany) or Degussa P25 (AEROXIDE® TiO2, Evonik, Germany), which has 78% anatase and 14% rutile [36]. About 2 g of anatase or P25 powder was mixed with 4 mL of distilled water and stirred using a glass rod for around 10 min to form a paste. The paste was then coated on a fluorine-doped tin oxide (FTO) glass slide (OSSILA TEC15: 20 × 15 × 2.2 mm, FTO thickness of 200 nm, 12.46 ± 0.50 Ω/sq) using the doctor blade technique to obtain FTO/TiO2 samples. The FTO substrate was initially taped with two layers of cello tape to limit the thickness as well as the exposed surface area to 1 cm2. The paste coated on the FTO was then calcined at 400 °C for one hour in the oven with the ramp of 20 °C/min, and this was marked as Ana(400) or P25(400), or it was left to dry in the air for 24 h at the room temperature, and this was marked as Ana or P25. The temperature of 400 °C will not change anatase crystallite to rutile. In addition, it will help to improve the electronic contact between all the TiO2 particles as well as between TiO2 and FTO [37,38], leading to a more stable adhesion to FTO [11]. The stability of the calcined TiO2 thin film at 400 °C was also tested by gently stirring the solution where the sample was immersed with a magnet. No sign of flaking off was observed after the two-hour stirring. The reuse of the calcined TiO2 thin film in another test was guaranteed for its stability, especially in the solution-pH test carried out in this study, where re-immersing the sample was needed after the desired solution pH was achieved. For the TiO2 thin film treated at room temperature, gentle immersion in the solution was required to guarantee its stability.

2.2. Experimental Setup and Electrochemical Method

A three-electrode electrochemical cell was used, where the working electrode was the corresponding sample of FTO/TiO2, the reference electrode was Ag/AgCl (3 M KCl), and the counter electrode was a platinum wire. The solution was 0.2 M Na2SO4 at a pH of 6.5. Potentiostat/Galvanostat (PGSTAT204, Metrohm, Herisau, Switzerland) was adopted to perform the MS-SF analysis at the DC potential starting from 1 to −1 V with an AC amplitude of ±10 mV coupling with a frequency. All the MS-SF tests described below were carried out at a room temperature of 21 °C.
In order to solve the doubt of the selection of a suitable frequency for the Vfb determination in MS-SF analysis, the frequency that would be coupled in MS-SF test was chosen from 10 (starting frequency) to 6000 Hz (ending frequency). In total, 15 frequencies were chosen between 10 and 6000 Hz. For this study, seven samples were made and labelled as in Table 1 and all tests were performed in the laboratory light. The Vfb data were then analyzed to view which frequency range is suitable to be adopted in MS-SF analysis.
After the suitable frequency range was determined, a frequency was then selected within the range to perform the MS-SF test on Ana(400) to study the influence of different irradiation sources (dark, laboratory light, and UV (Philips TL-D 15 W BLB: 47 mWcm−2)), immersion duration, and solution pHs on Vfb. For the solution-pH test in the laboratory light, two separate tests were performed—one was to increase the pH using aqueous sodium hydroxide ((NaOH)aq), and another was to decrease the pH using acid hydrochloric (HCl) from the original pH of 0.2 M Na2SO4 solution of 6.5. After each drop of (NaOH)aq or HCl, the solution in the electrochemical cell was magnetically stirred. When the determined pH was reached, the same sample was immersed back in the solution, and the MS-SF test was performed.
After the MS-SF tests, the samples were left dry in the air and analyzed ex situ by X-ray diffraction (D8 Advance, Bruker, Billerica, MA, USA) and scanning electron microscopy with energy dispersive spectroscopy (S-4800, Hitachi, Tokyo, Japan). A UV-Vis spectrometer (UV-2600, Shimadzu) was used to obtain the band gap energies (Eg) of Ana(400), Ana, P25(400), and P25 powder that would be used to construct the band-edge positions of TiO2.

3. Results and Discussion

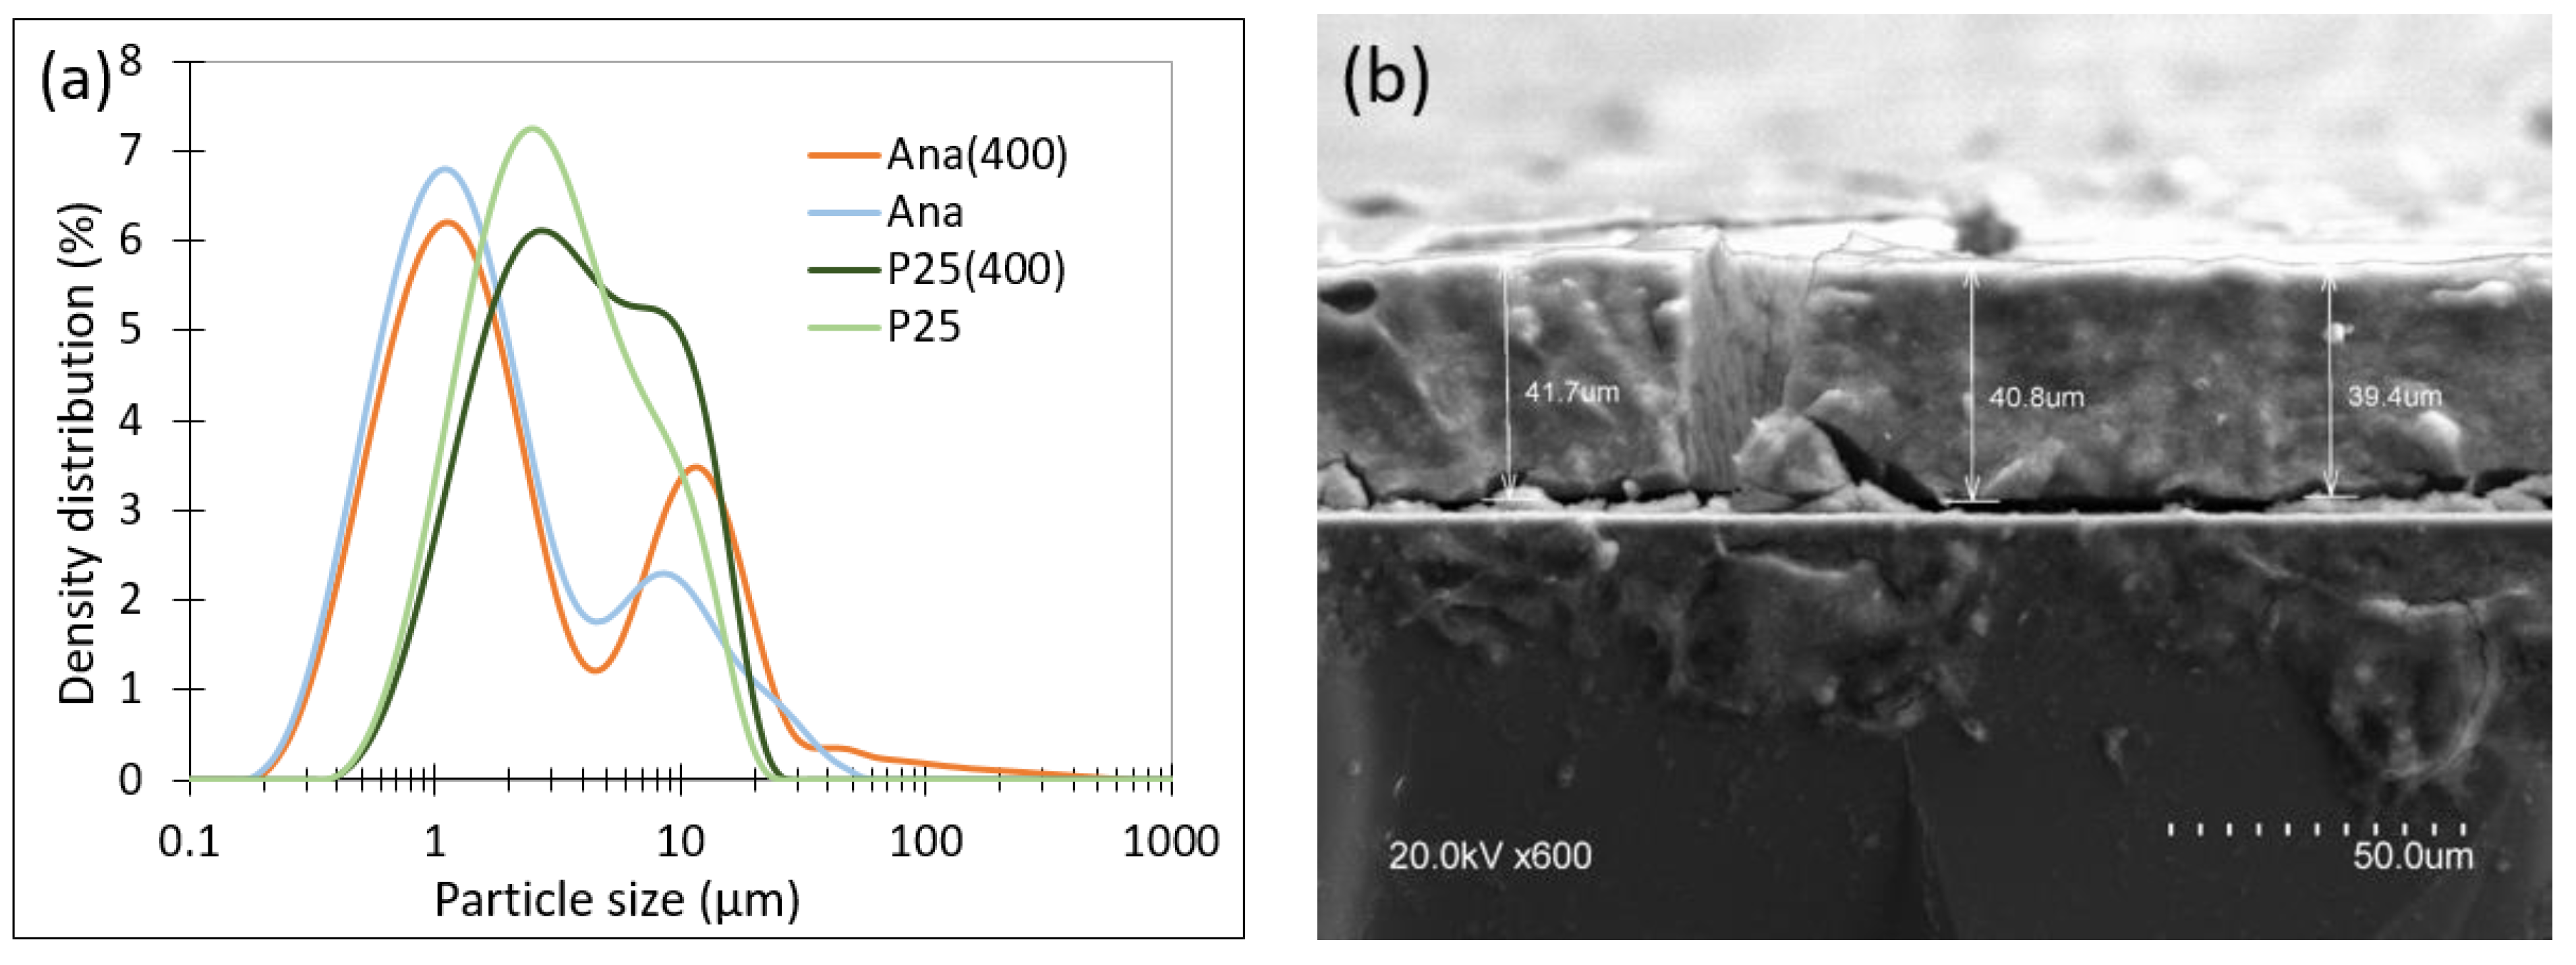
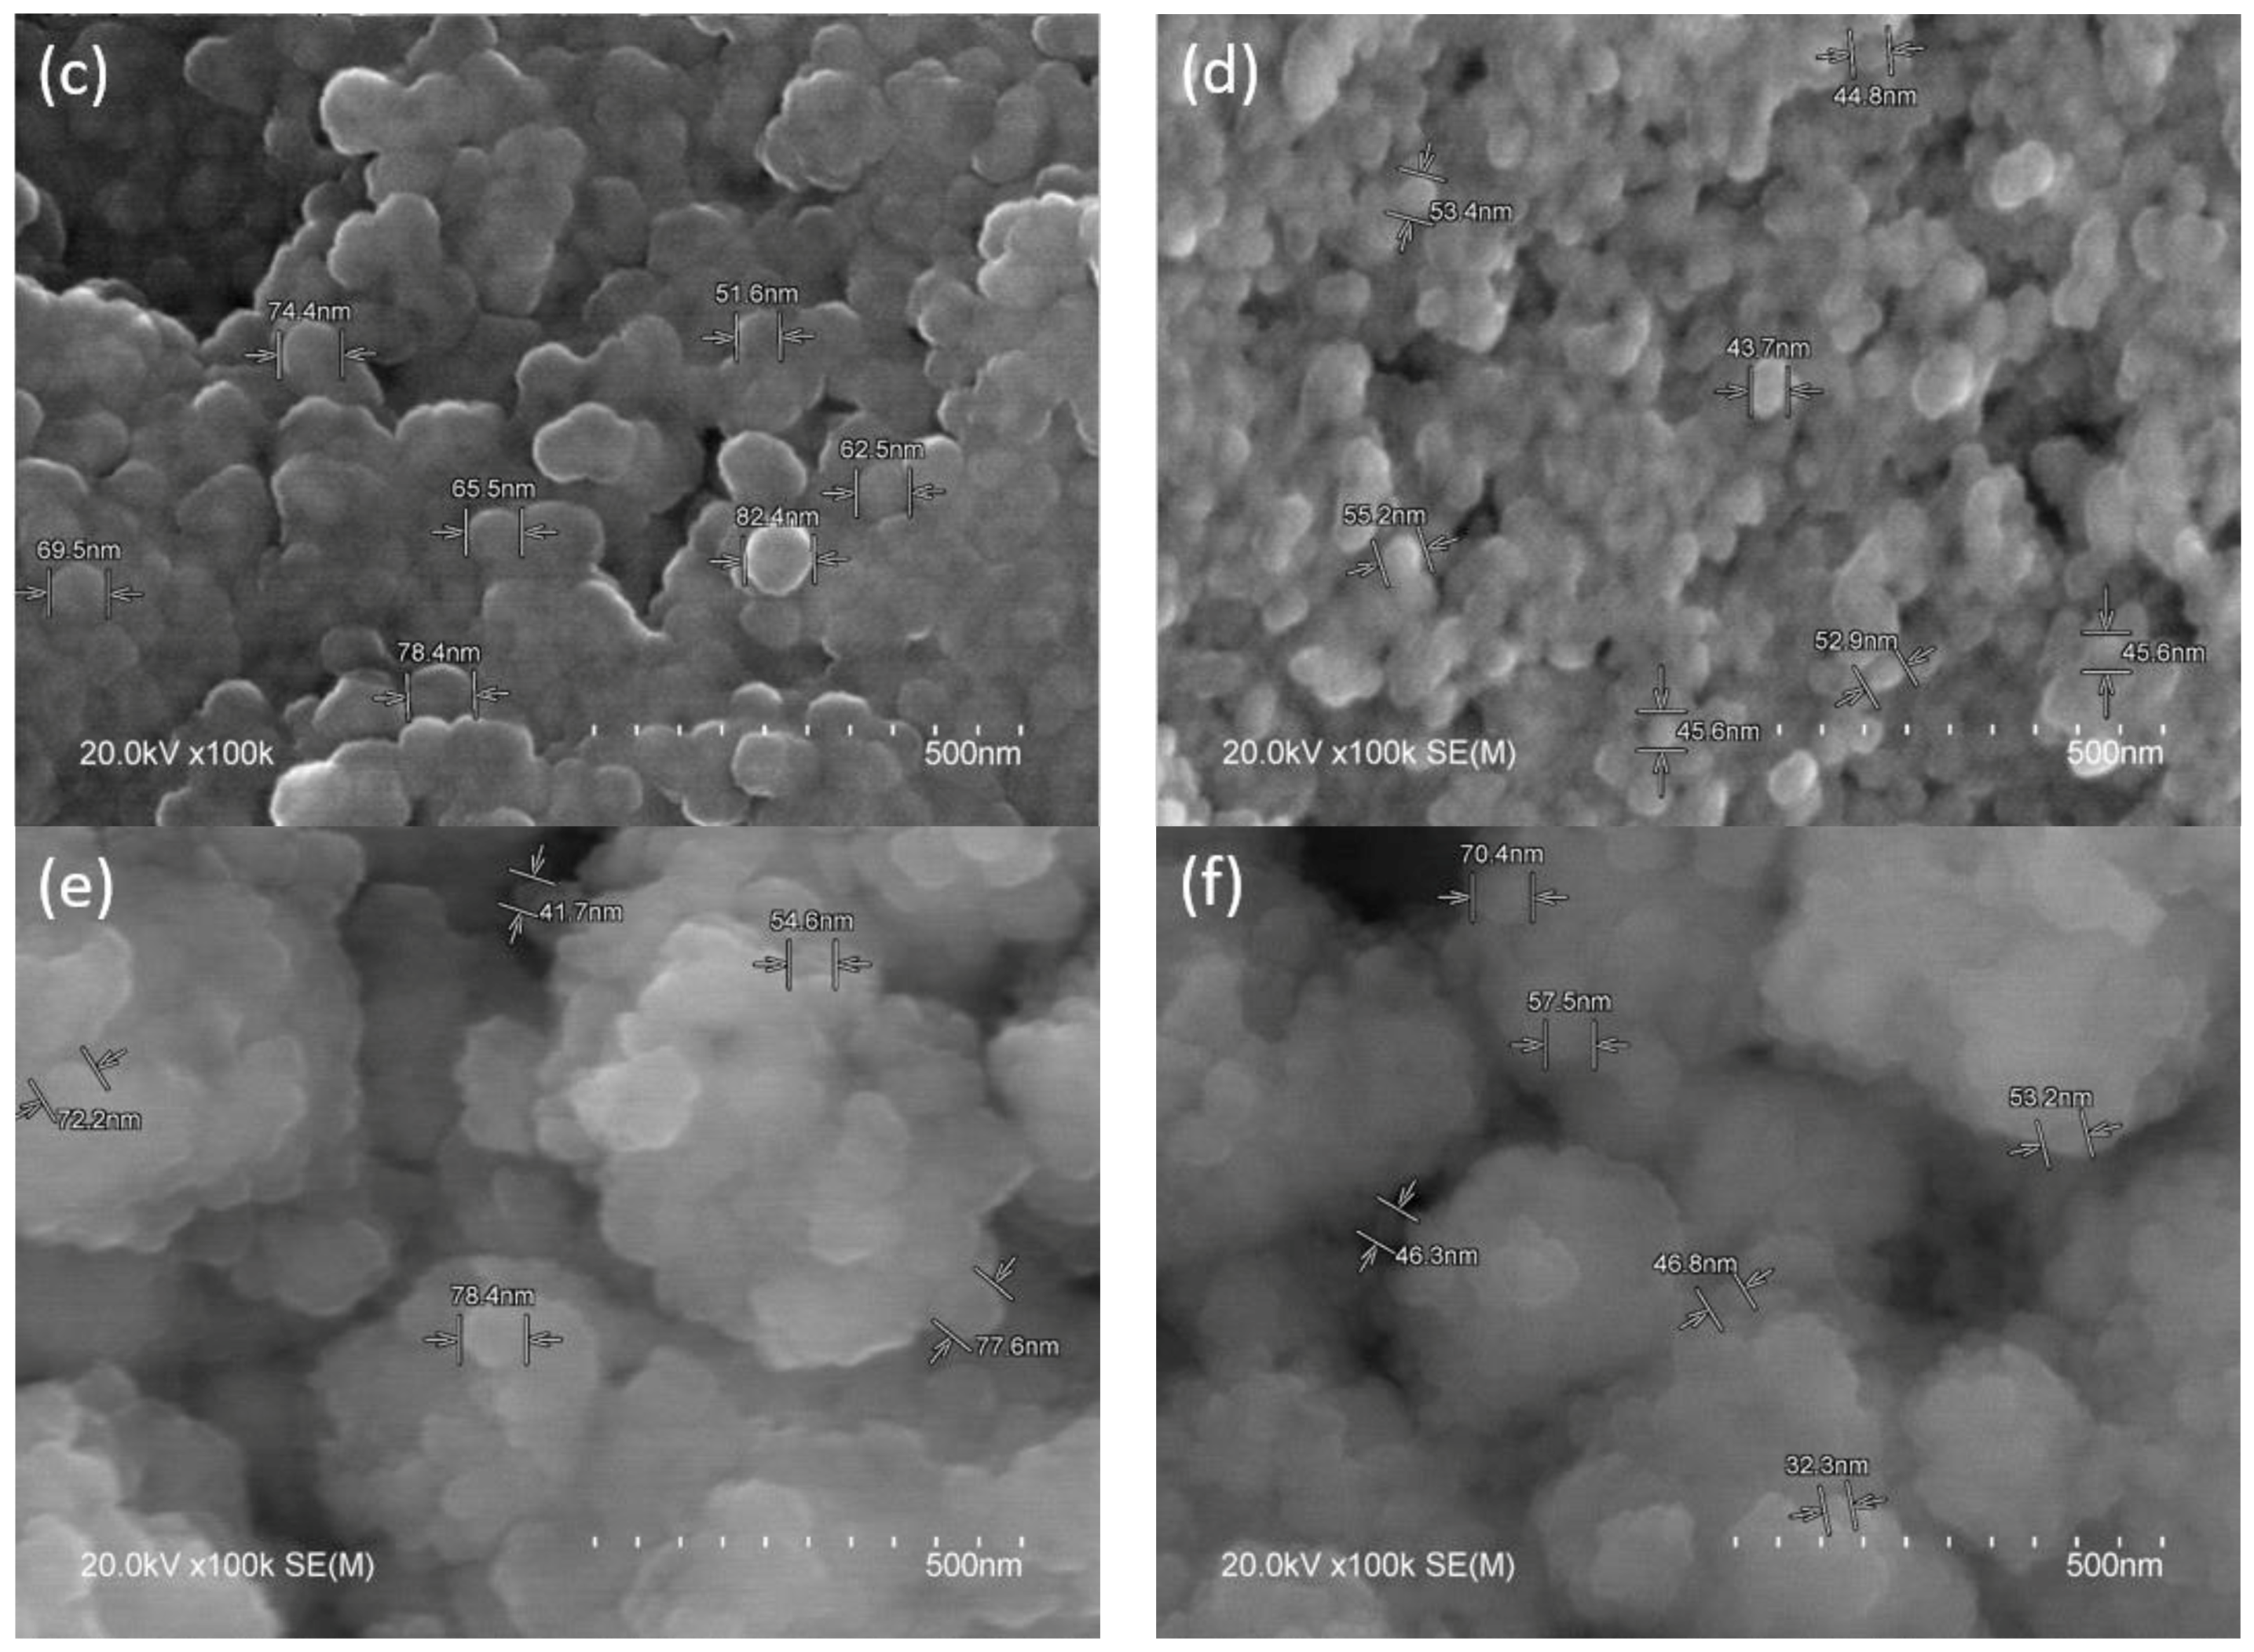
3.1. Sample Characterization

Figure 2 shows the thermogravimetric analysis (TGA) of as-received anatase and P25. When the powders are heated from 0 to 450 °C, a weight loss of about 13.32 and 2.57% was observed for anatase and P25, respectively. The weight loss is mainly due to the elimination of the residual water and organic materials in both powders [39]. No weight loss was found from 450 to 1000 °C, indicating that both powders have high thermal stability. Thus, the sample prepared by calcining at 400 °C for one hour in this study would not alter its microstructural property.
The powders of Ana, Ana(400), P25, and P25(400) were analyzed in the dry state using a laser diffractometer for their particle size distribution, as shown in Figure 3a. It can be seen that in the dry state, the particle sizes range from 0.1 to 100 μm, with both Ana and Ana(400) having the same maximum peaks at 1.2 μm; however, P25 and P25(400) had the maximum peaks at 2.6 and 2.9 μm, respectively. This indicates that the calcination at 400 °C does not shift the range of particle sizes much. For the photoelectrochemical analysis in this study, the powder was first mixed with distilled water, which usually leads to agglomeration, and thus, the magnetic stirring of the mixture is necessary to separate the powders in the paste. The microstructure and the thickness of the paste after being coated on the FTO using the doctor blade technique were examined under SEM. Figure 3b shows one example of the side morphology of the paste coated on FTO, which is P25. The average thickness of P25 is found to be 40.6 ± 1.2; P25(400), 35.9 ± 1.6; Ana, 37.1 ± 3.6; and Ana(400), 33.5 ± 4.8 μm. Figure 3c–f show the top morphology of the nano-compact P25, P25(400), Ana, and Ana(400), respectively, with the particle sizes being found to be between 51.6 and 82.4 nm for P25, 43.7 to 55.2 nm for P25(400), 41.7 to 78.4 nm for Ana, and 32.3 to 70.4 nm for Ana(400). All the particle sizes are bigger than 10 nm, wherever the discrete energy (quantum effect) can be neglected [30].

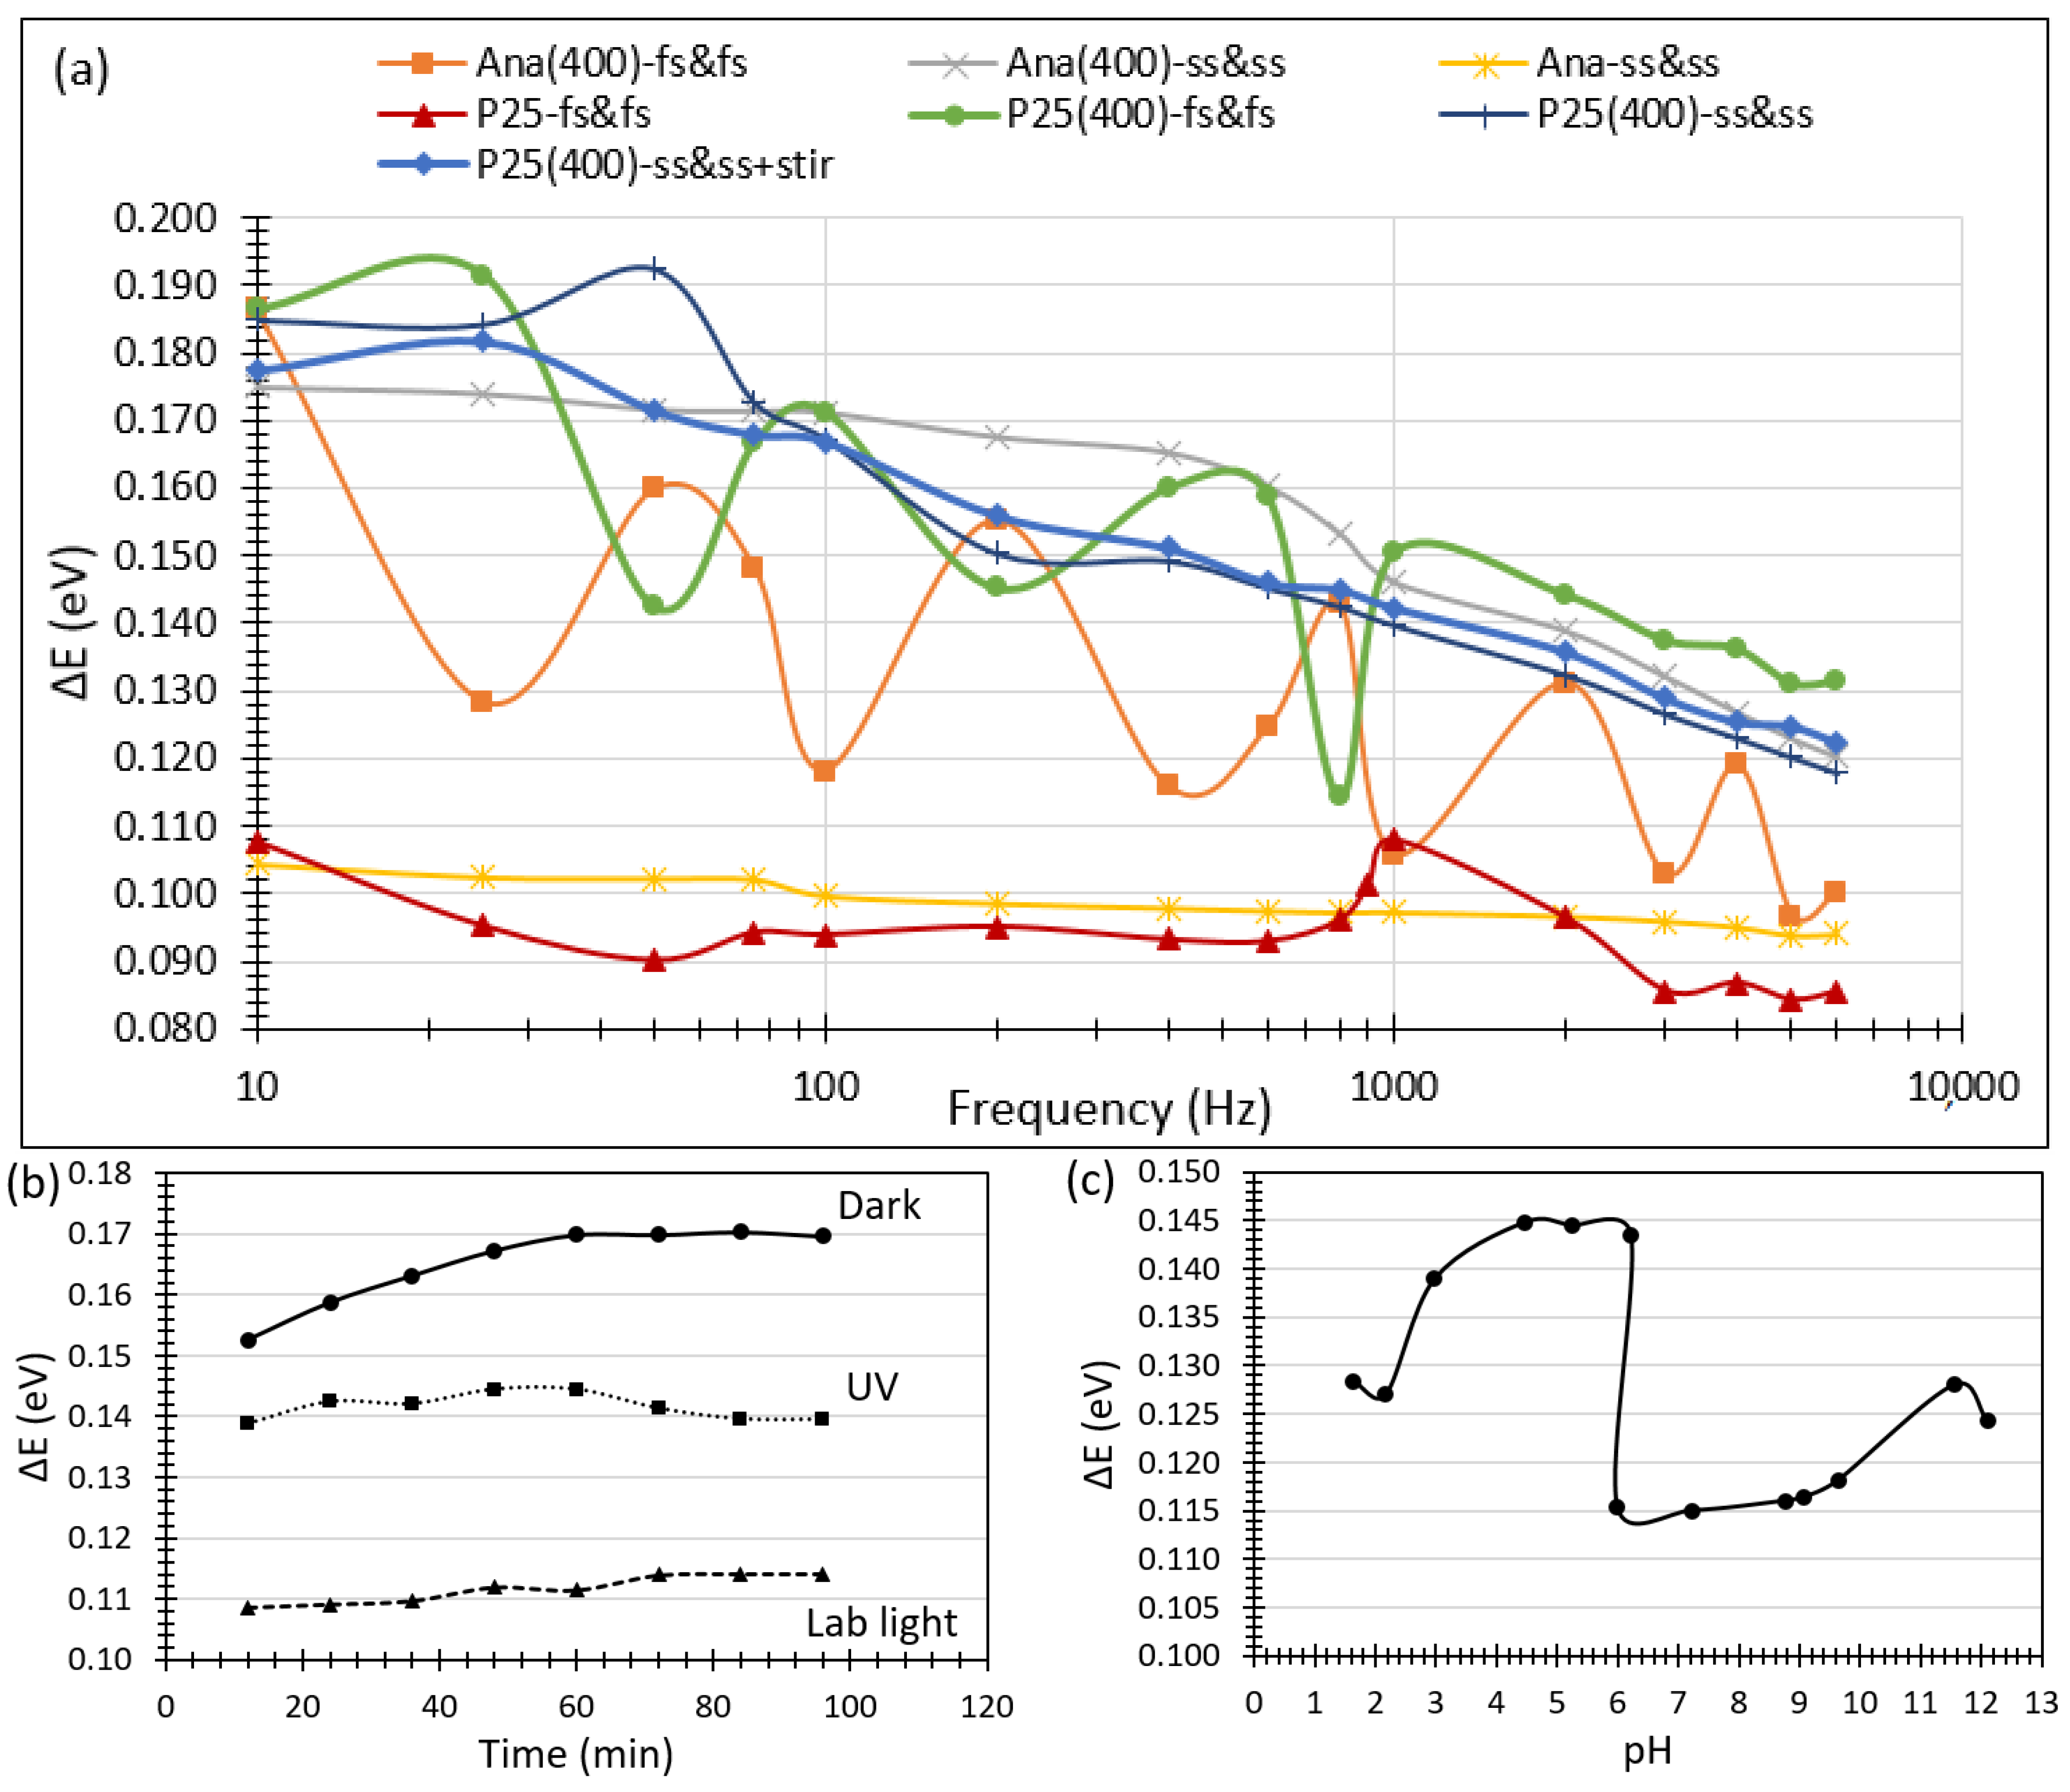
3.2. Frequency Determination on MS-SF Analysis

Vfb of the different samples (Table 1) are plotted against the frequency coupled in the MS-SF analysis, as shown in Figure 4. For Ana(400)-fs&fs, P25-fs&fs, and P25(400)-fs&fs, either uncalcined or calcined, Vfb does not shift tremendously towards negative values when higher frequencies are adopted, showing no clear trends of frequency dependence. However, for Ana(400)-ss&ss, Ana-ss&ss, P25(400)-ss&ss, and P25(400)-ss&ss + stir, either uncalcined or calcined, with the same sample and same solution being applied throughout the test, Vfb shows an obvious steep shift to a more negative value with the increase in frequency. Concerning the effect of calcination, a comparison between Ana(400)-ss&ss and Ana-ss&ss as well as P25(400)-fs&fs and P25-fs&fs is made, and it can be seen that the calcined samples at 400 °C tend to have a less negative Vfb than those that are uncalcined, regardless of whether they are fs&fs or ss&ss.
The samples, after MS-SF analysis, were examined under XRD and SEM-EDX. The XRD patterns obtained for all samples show the presence of Na2SO4 peaks on the surface of the thin film [40,41]. Since the film is thin and has cracks due to the drying process, other peaks belonging to FTO, which is SnO2 [42], are also detected. In general, the obtained XRD patterns of the studied samples can be divided into two groups: (i) peaks displaying the presence of anatase, Na2SO4, and SnO2, and (ii) peaks displaying the presence of anatase, rutile, Na2SO4, and SnO2. Thus, only two XRD patterns are shown here as a representative for each group, with Figure 5a being Ana(400)-ss&ss, which exemplifies a clearly crystalline phase of anatase, Na2SO4, and SnO2; Figure 5b being P25(400)-ss&ss + stir that exemplifies a clearly crystalline phase of anatase-rutile [43], Na2SO4, and SnO2.
Here, only the SEM image, mapping, and EDX spectrum of P25(400)-ss&ss + stir, as displayed in Figure 6, is adopted as a representative of all samples because the same salt was found deposited on their surface after the MS-SF test. The SEM image on the right side of Figure 6a is the magnified microstructure of Na2SO4 at 5000×. The elemental mappings of Ti in pink, O in green, Na in purple, and S in light blue in Figure 6b clearly confirm that the salt is thenardite Na2SO4, which is deposited through heterogeneous nucleation on the surface of the TiO2 thin film [44]. Figure 6c shows the full EDS spectrum of the SEM image on the right side of Figure 6a. The full EDS spectrum also reveals the same elements of Ti, O, Na, and S.
The intensity at [111] peak of thenardite Na2SO4 in the XRD pattern at 2θ of 19.0° is plotted in Figure 7 as a rough estimation of the differences in the amount of thenardite Na2SO4 salt deposited on the surface, without any attempts of quantification. In general, samples under the condition of ss&ss present a higher intensity than fs&fs. Figure 4 shows that the Vfb of samples with the ss&ss condition tends to have a steep drop to more negative values compared to fs&fs from 10 to 6000 Hz. Thus, the deposition of the thenardite Na2SO4 salt could be responsible for the shifting of the Vfb to a more negative value.
In order to determine the suitable frequency to be adopted in the MS-SF analysis, the mean of Vfb for seven samples, studied in Figure 4, over a range of frequencies from 10 to 6000 Hz and their standard deviation, σ, were calculated. The range of frequency corresponding to the mean Vfb ± 1σ is displayed in Table 2. By performing a study on the overlapping of the frequency range for these seven cases, the suitable frequency range for obtaining Vfb ± 1σ using an MS-SF analysis is found to be between 200 and 2000 Hz.

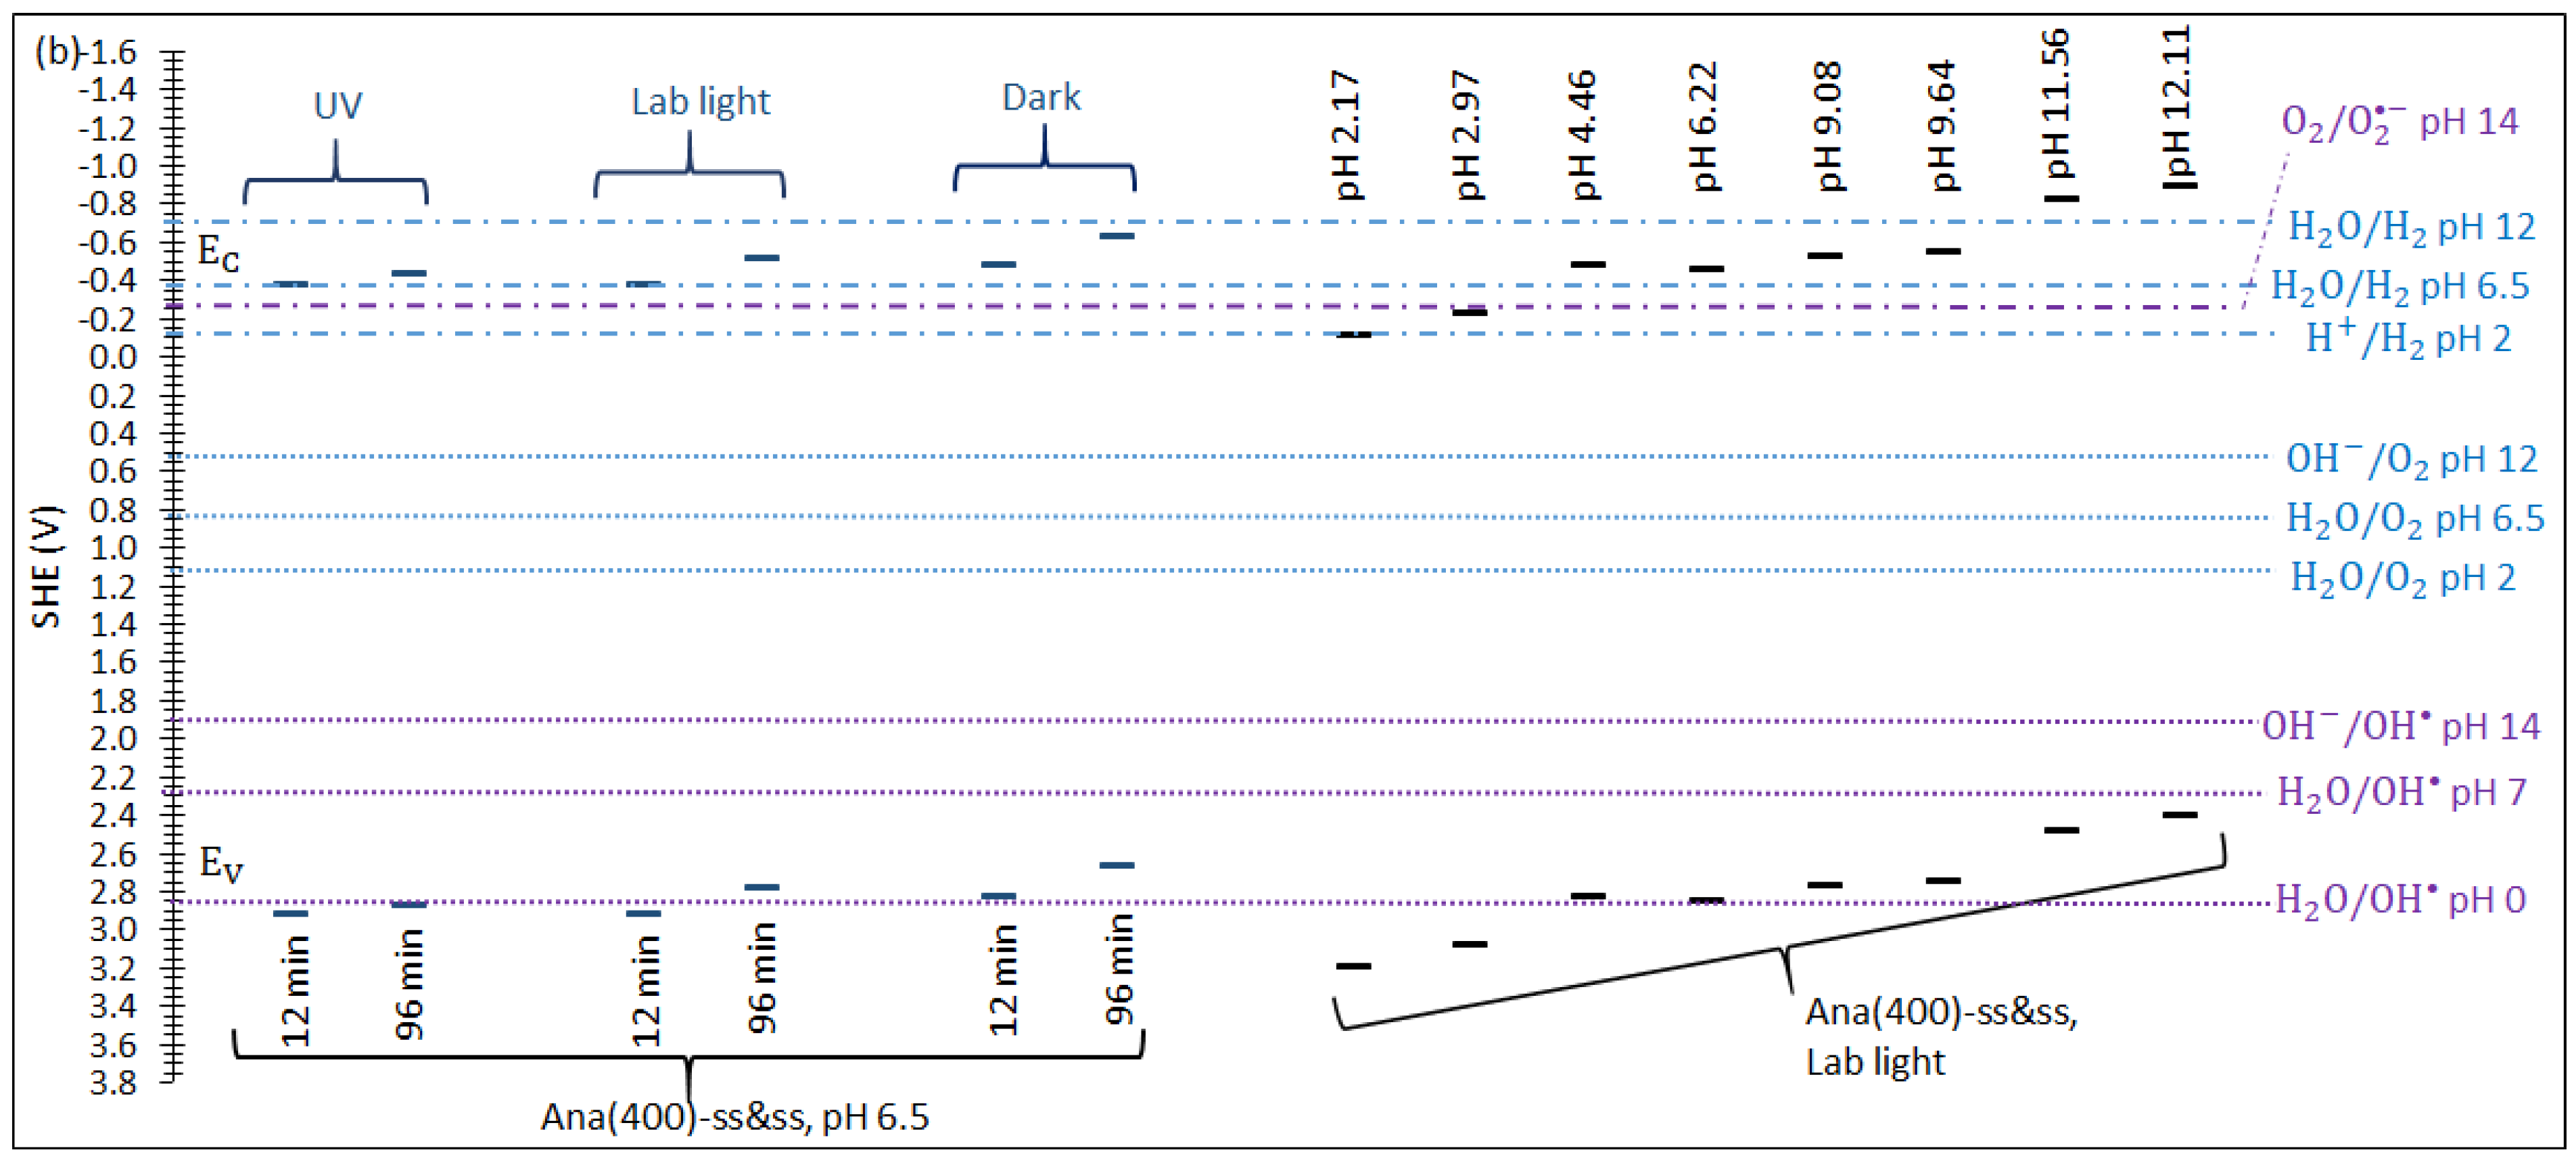
3.3. Influence of Different Irradiation Sources

Different irradiation sources, which are UV, lab light, or dark, were adopted and scanned from the potential of 1 to −1 V, with each scan lasting 12 min, using a frequency of 400 Hz. The same scan was repeated eight times on the Ana(400)-ss&ss thin film to study the effect of immersion duration. It can be seen that different irradiation sources pose different values on the Vfb of Ana(400)-ss&ss. An obvious deep shift of Vfb to a negative value is observed with time under the UV, laboratory light, or dark, as shown in Figure 8a. At the eighth scan, the differences in the Vfb of UV, laboratory light, and dark are bigger than the differences in Vfb at the first scan. When the sample is examined under XRD, it reveals that the intensity at peak [111] of thenardite is higher when the irradiation source is UV, followed by laboratory light and the dark, as shown in Figure 8b. Figure 8c–e are SEM microstructures, SEM mappings, and an EDX spectrum showing the thenardite Na2SO4 salt on the surface of Ana(400)-ss&ss under the UV, respectively. The samples under the laboratory light or in the dark have similar characteristics to those under UV. Thus, the shift of Vfb to a negative value could be, again, due to the deposition of a layer of thenardite Na2SO4 salt, instead of the influence of the application of different types of irradiation sources.

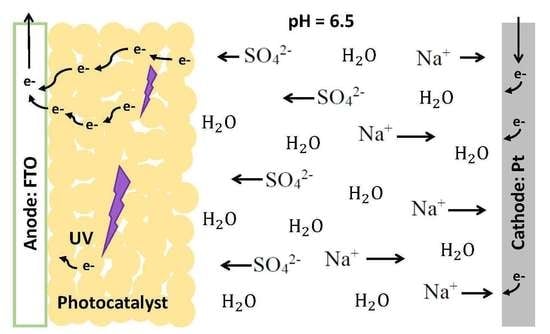
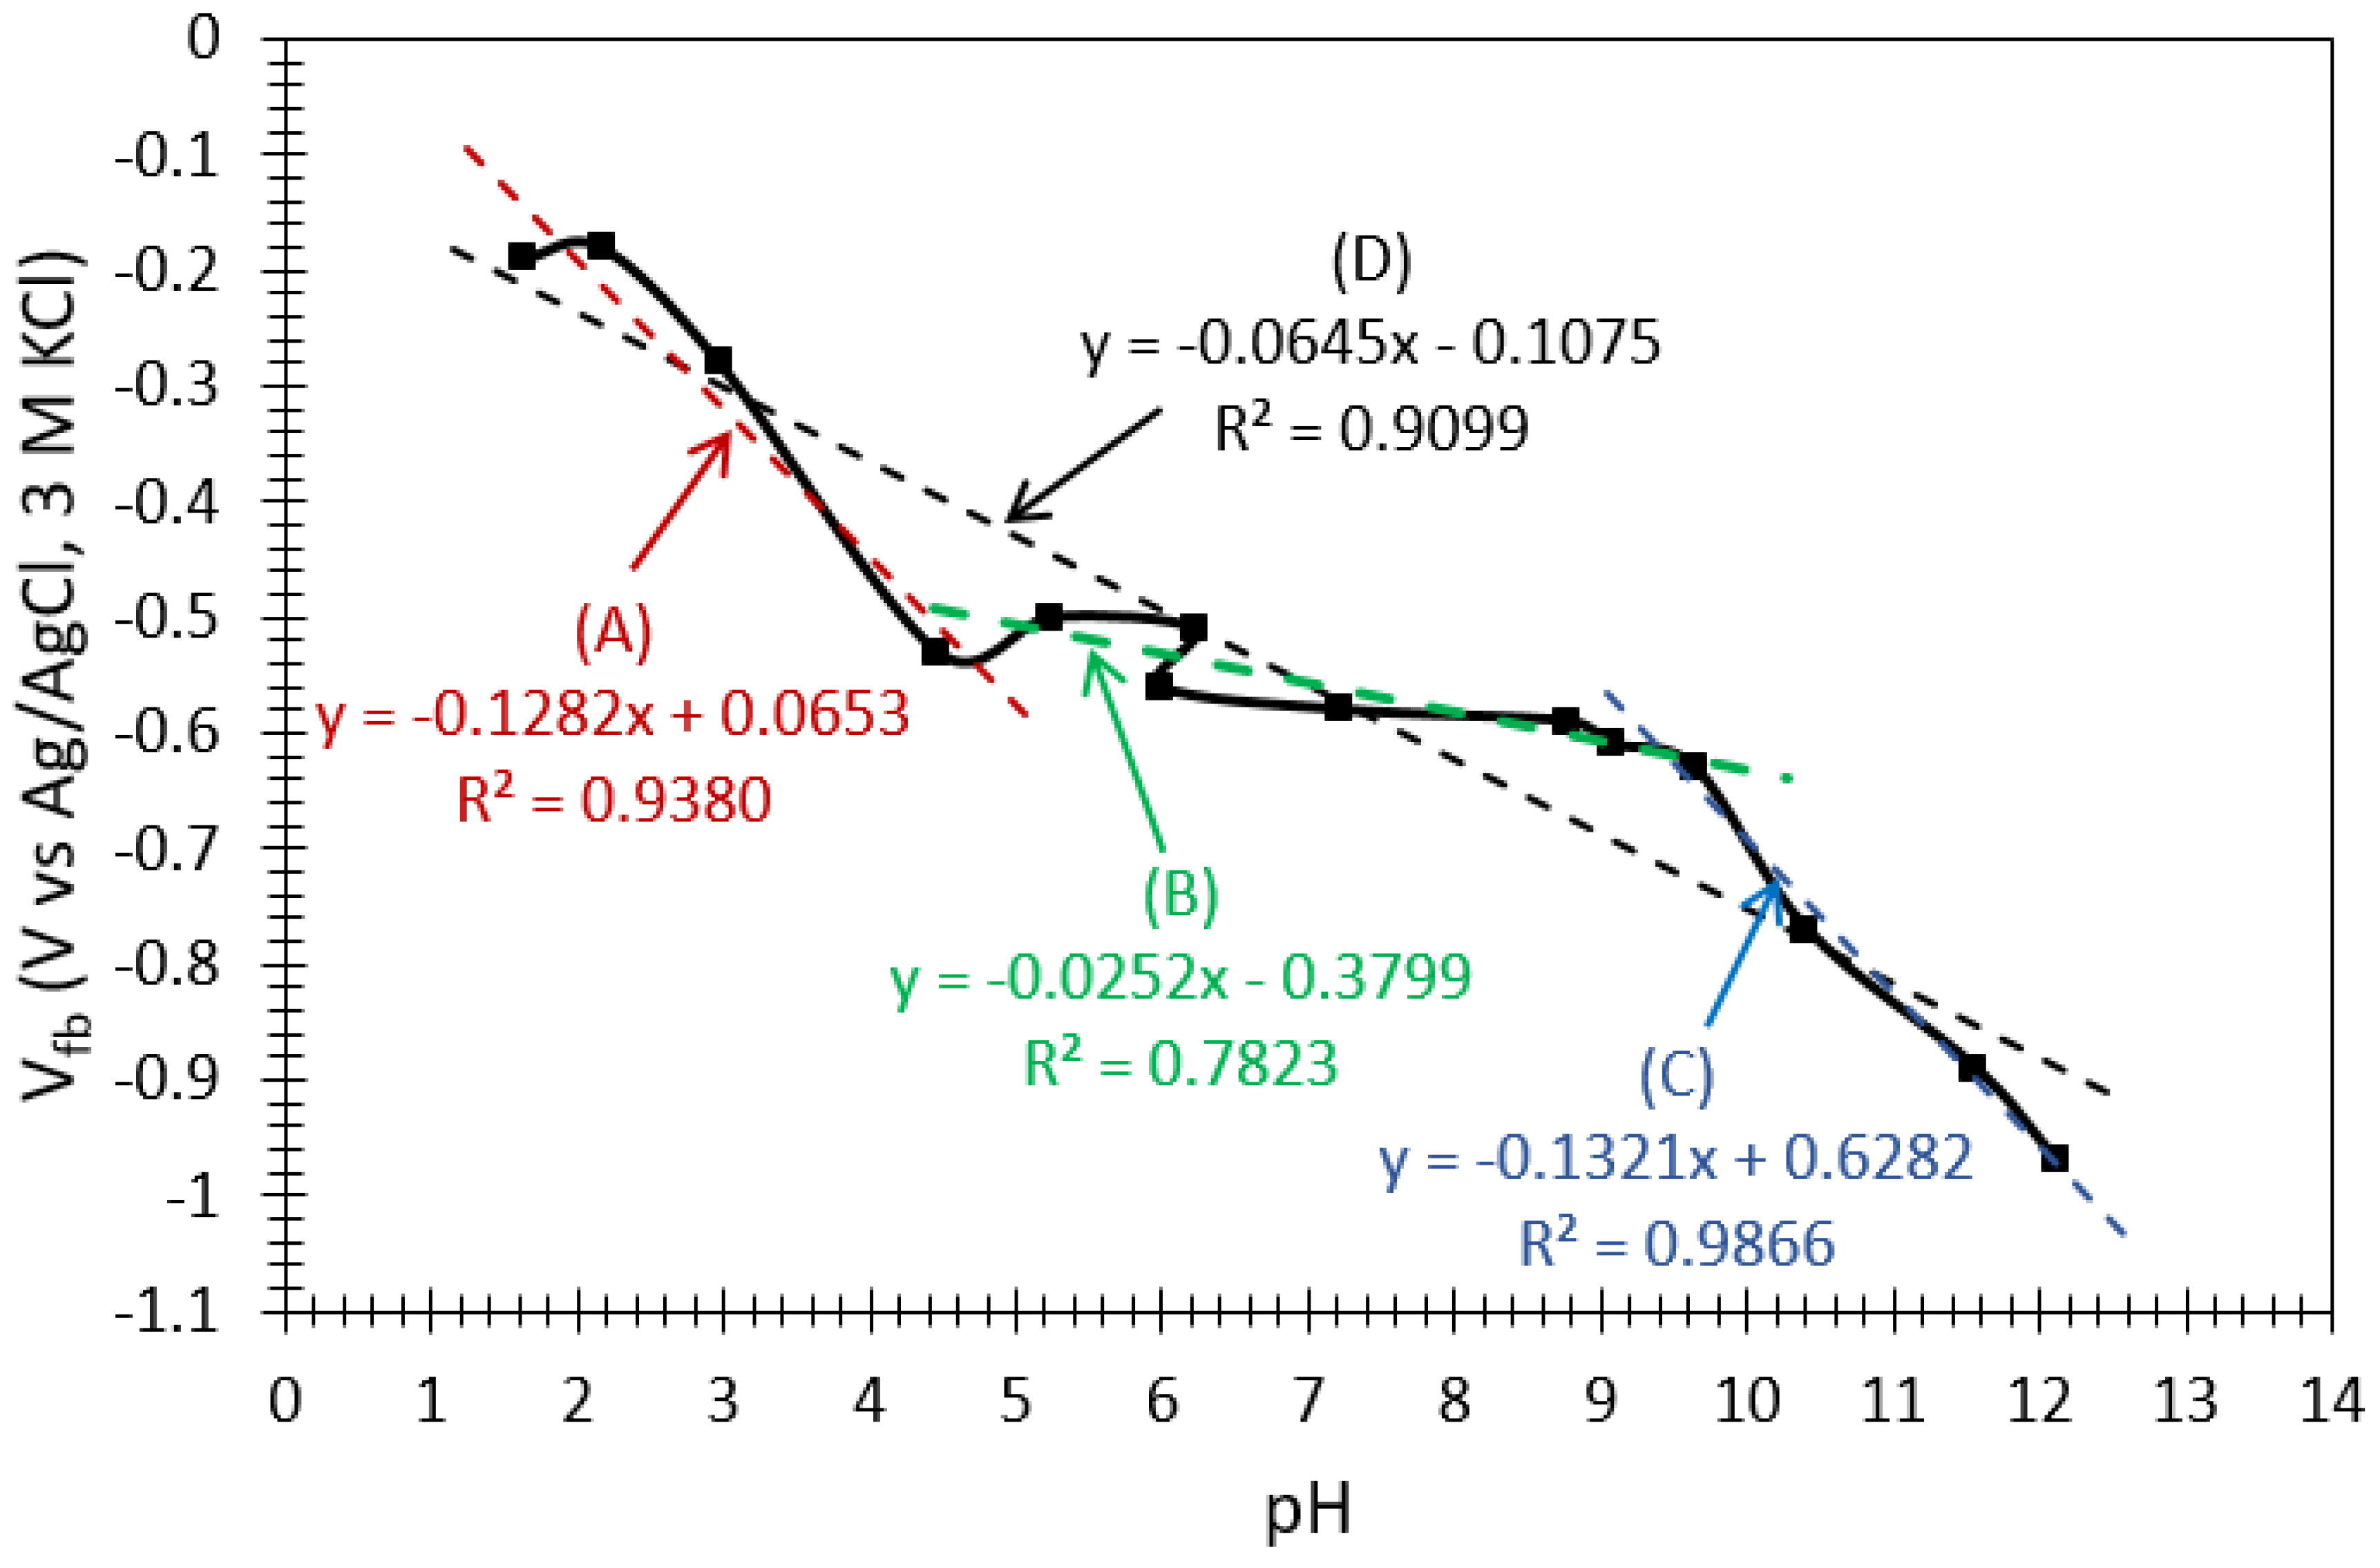
3.4. Influence of pH
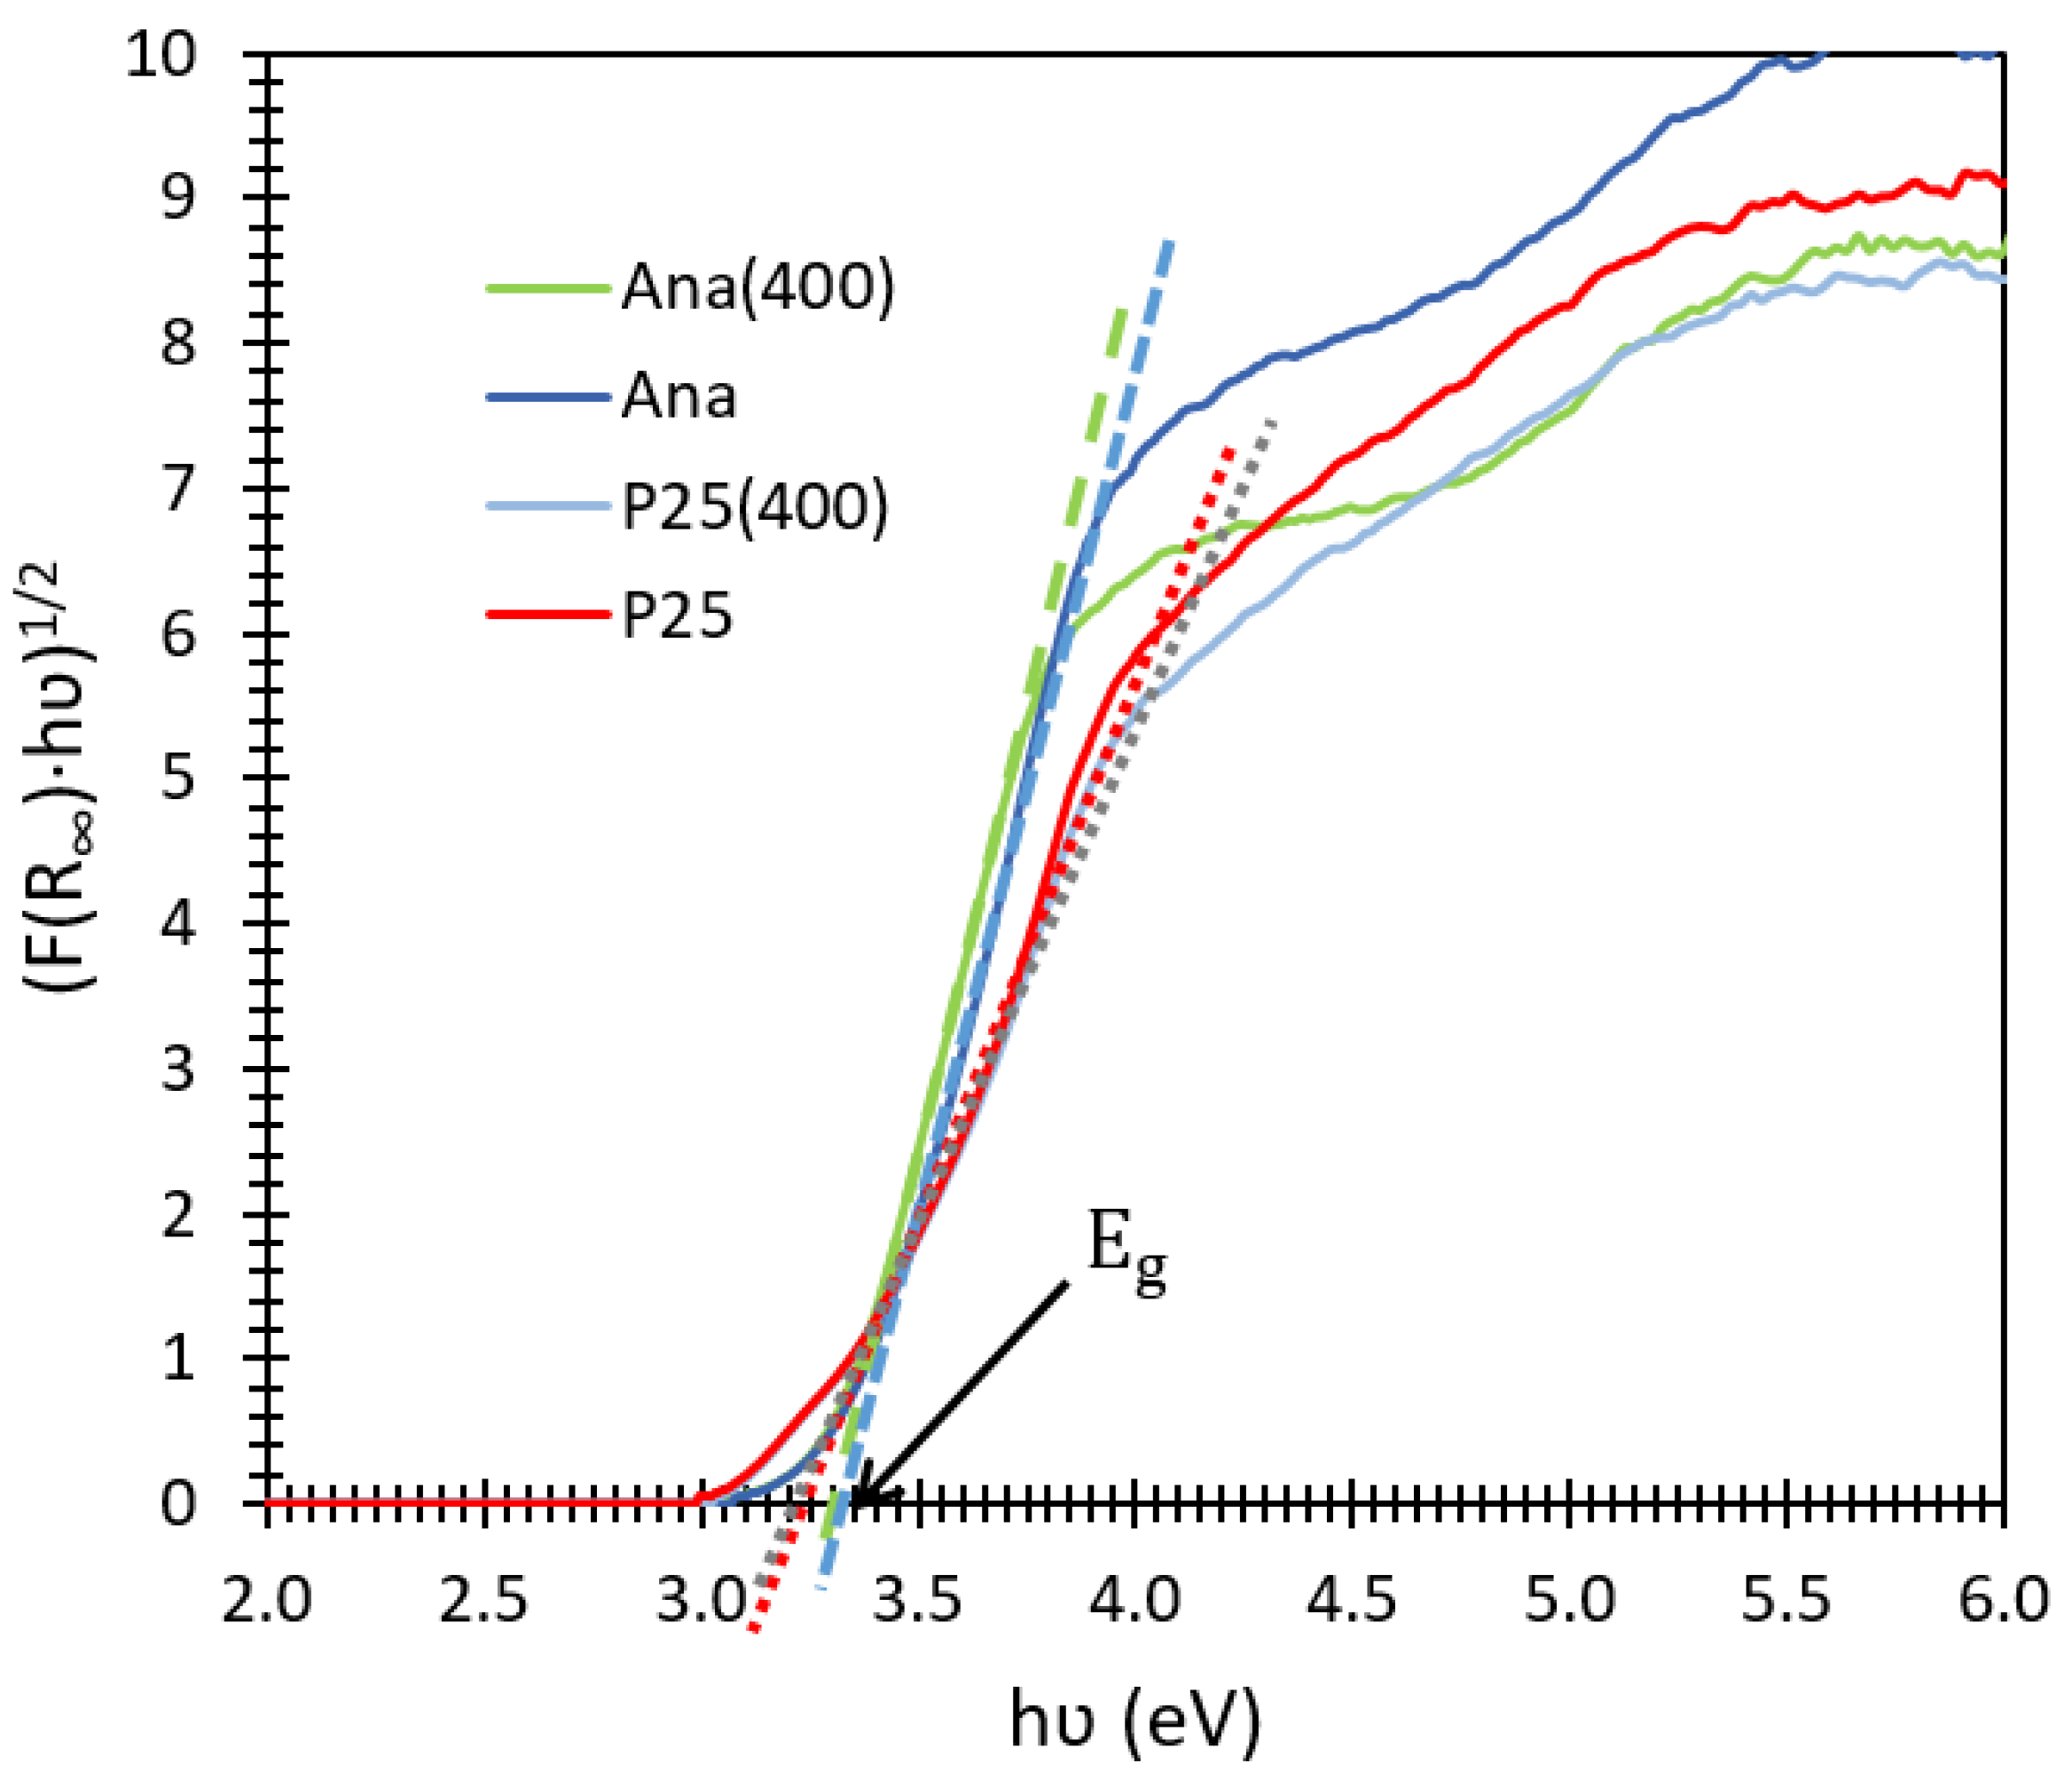
The effect of the pH on the Vfb of Ana (400)-ss&ss is given in Figure 9. It has also been reported that the value of Vfb is pH-dependent, with a negative linear relationship being erected between them based on the Nernst Equation [25,27,28]. However, in this study, when the pH of 0.2 M Na2SO4 solution is increased or decreased from its starting pH of 6.5 using (NaOH)aq or HCl, respectively, the obtained graph displays three distinct slopes that can be indicated by A, B, and C, which is contrary to the reported linear Nernstian relationship between Vfb and pH [25,28]. However, the values of Vfb in the strong acidic region and strong basic region, which are −0.19 at pH 1.64 and −0.97 V at pH 12.11, respectively, are indeed consistent with others [23,45]. Although TiO2 is inert to the pH change, its surface tends to adsorb hydrogen ions (H+) or hydroxide ions (OH-) in the function of the pH. Thus, the less negative values of Vfb in the acidic solution are attributed to the adsorption of H+ on the surface O atoms leading to the formation of a positively charged layer, and the more negative values of Vfb in the basic solution are caused by the adsorption of OH- on the surface Ti atoms forming a negatively charged layer [46].
From the pH of 1.6 to 4.5, Vfb shows a steep decrease with a negative slope of 0.1282 V/pH. From the pH of 9.6 to 12.1, Vfb shows a steep decrease as well, with a negative slope of 0.1371 V/pH. While in the mildly acidic, neutral, and mildly basic region, which is from pH 4.5 to 9.6, Vfb shows almost a plateau somewhere between −0.5 to −0.6 V [12], with a negative slope of 0.0252 V/pH. The pH of zero change (pHpzc) for the nanoparticle of TiO2 is reported to be from 4.4–5.4 [47], 6.2 [48], 6.5 [49], and 7.0 [50], and this could explain the plateau formed between pH 4.5 and 9.6. Gerischer [27] reported that the theoretical value of the slope should be 0.059 V/pH, given the fact that both charged species need to appear on the surface in order to fulfill the Nernstian relationship. Thus, this could possibly be the reason that the slope of A (strong acidic region) and the slope of C (strong basic region) are far from 0.059 V/pH. The experimentally reported value of the slope fulfilling the Nernstian relationship is somewhere between −0.056 and −0.065 V/pH [27,28]. Applying the linear regression to the whole data points (indicated as D) gives the slope of 0.065 V/pH, which is within the experimentally reported range of the slope values.

3.5. Band Gap

The Kubelka–Munk absorption coefficient (F(R)) of the sample obtained from the UV-Vis spectrometer is linked to the incident photon energy (hʋ) and band gap energy (Eg) using the Tauc equation:
(F(R)·hʋ)1/γ = hʋ − Eg,
where h is the Planck constant, ʋ the photon’s frequency, and the factor γ relates to the types of electron transition. By taking γ = 2, which is an indirect transition band gap, (F(R)·hʋ)1/2 versus hʋ is plotted, as shown in Figure 10. The Eg of Ana(400), Ana, P25(400), and P25 powder are then obtained from the x–axis intersection point of the plot, which are 3.30, 3.33, 3.21, 3.22 eV, respectively, and are in agreement with the reported Literature [6,7,33].

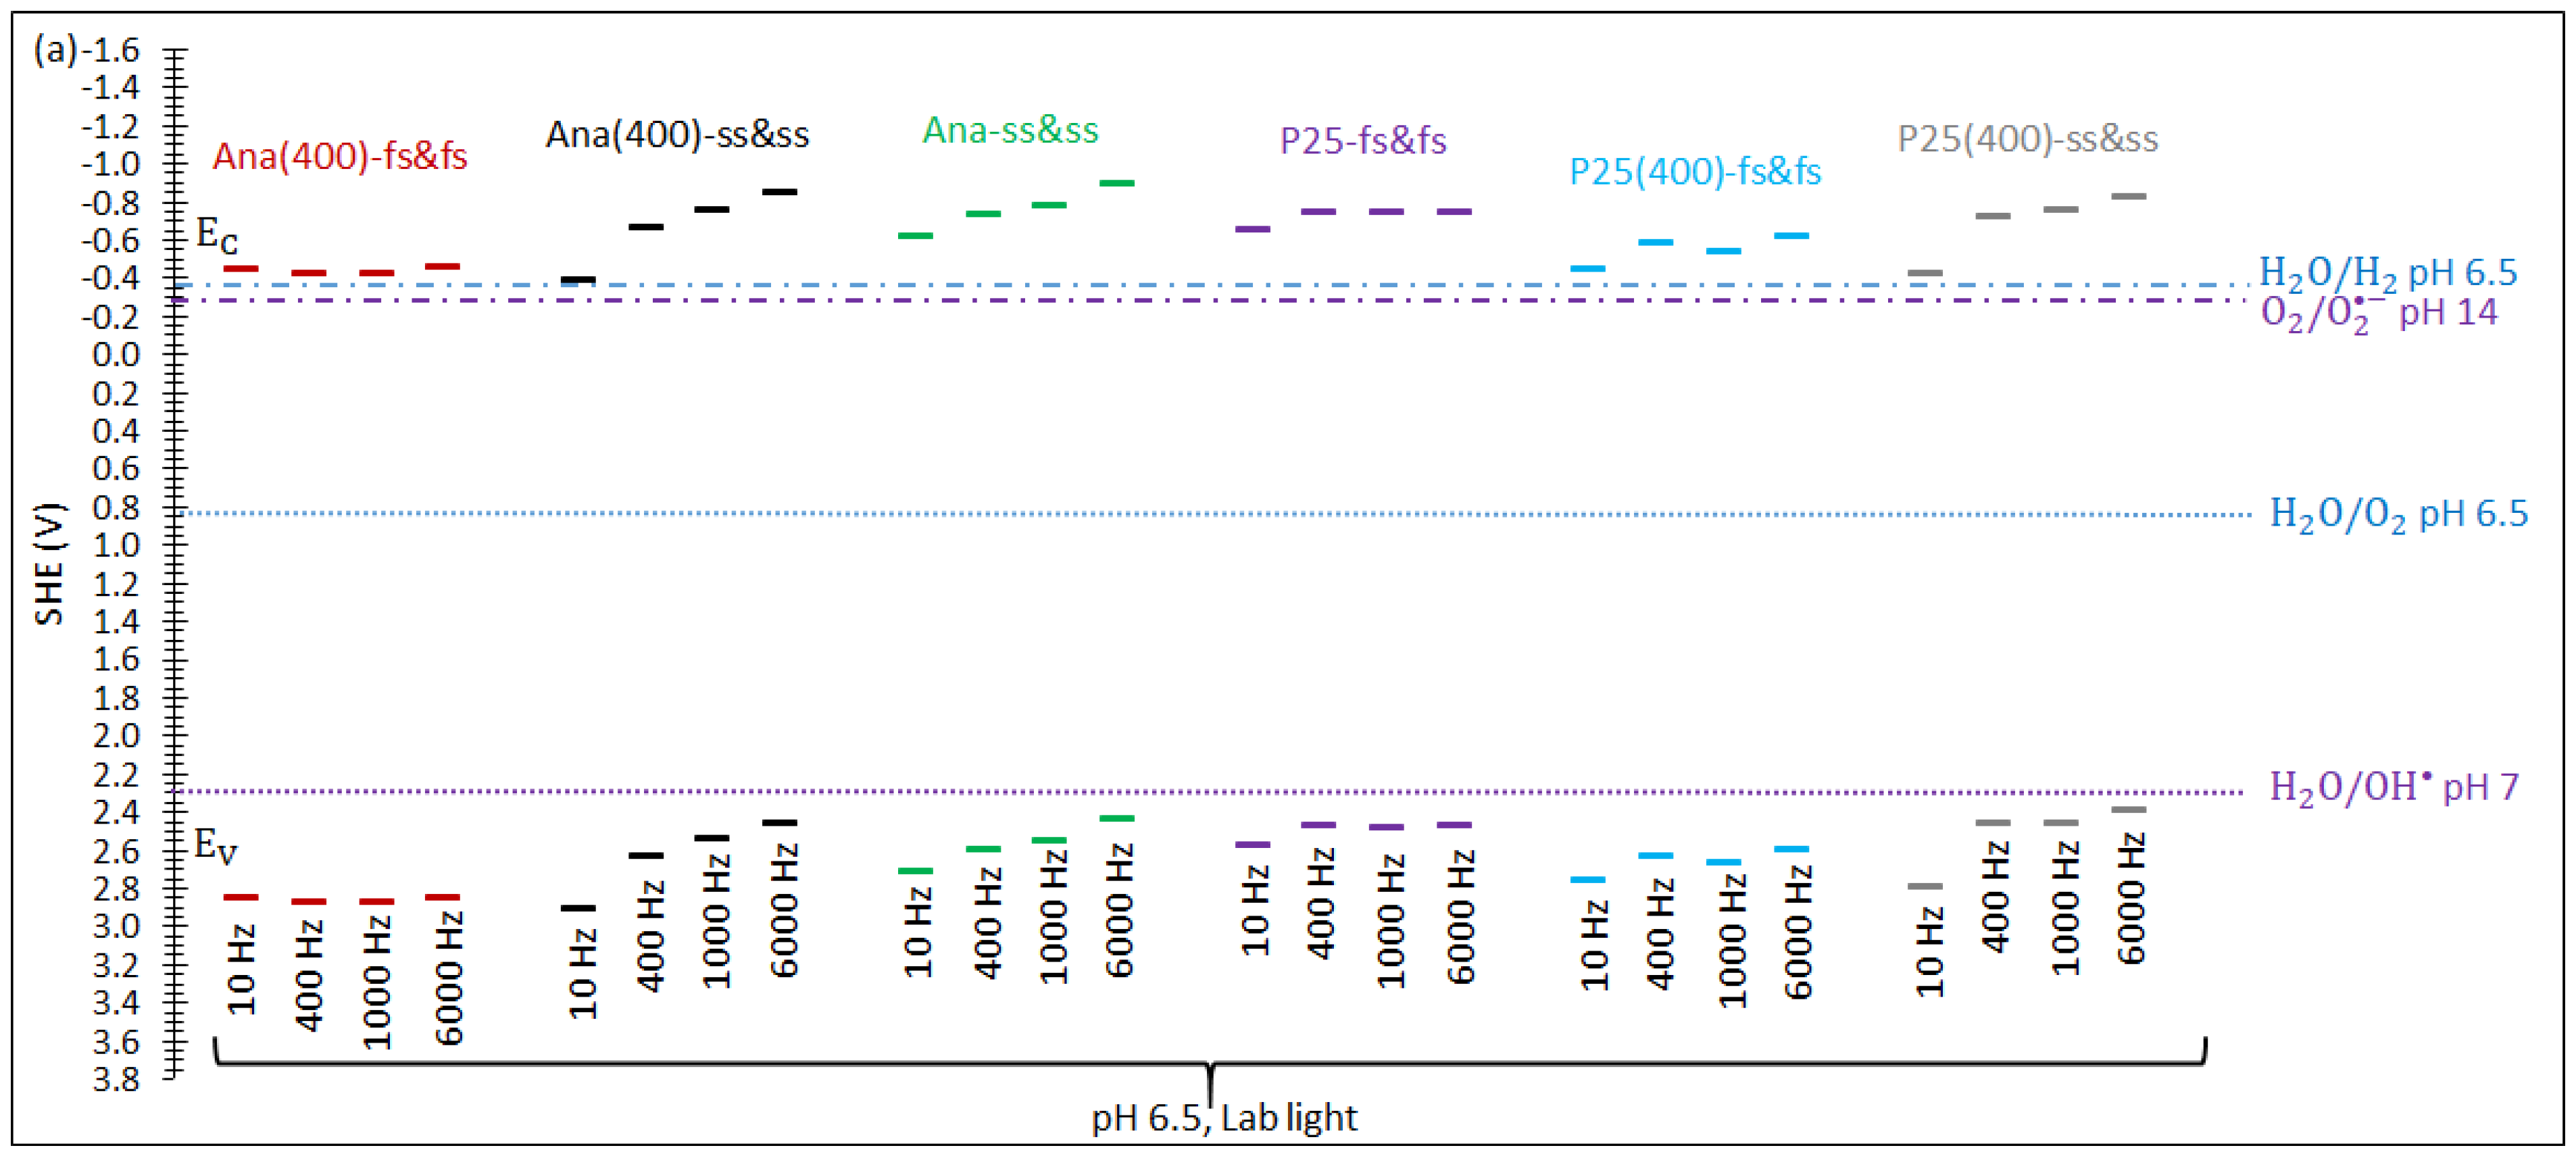
3.6. Band-Edge positions for Photocatalytic Activity Prediction

The band-edge positions of all the studied samples were constructed by first converting the Vfb (reference electrode Ag/AgCl used in this study) to the Vfb in SHE, which is assigned as EF [11], as shown in the schematic diagram in Figure 1.
The Nd obtained from the Mott–Schottky plots based on Equation (6) is between the order of 19 and 21 (Tables S1–S11), fulfilling the requirement that CH can be considered negligible in the calculation of CT [13].
The ΔE (Tables S1–S11) was calculated from Nd obtained from the MS-SF plots using Equations (7) and (8).
The plots of ΔE versus frequency, irradiation sources, immersion duration, and solution pH are shown in Figure 11. Figure 11a shows that uncalcined TiO2 (Ana-ss&ss and P25-fs&fs) tends to have almost a constant value of ΔE that is not greatly influenced by the frequency adopted in the MS-SF analysis and is basically lower than that of the calcined at 400 °C. However, the ΔE of the calcined TiO2 tends to show a decrease with the increase in the frequency adopted, regardless of whether it is a fresh or the same sample throughout MS-SF analysis. Ana(400)-fs&fs has ΔE between 0.097 and 0.186; Ana(400)-ss&ss, 0.120–0.175; Ana-ss&ss, 0.094–0.104; P25-fs&fs, 0.084–0.108; P25(400)-fs&fs, 0.114–0.191; P25(400)-ss&ss, 0.118–0.192; and P25(400)-s&ss + stir, 0.122–0.182. Figure 11b shows that the ΔE is larger in the dark (0.152–0.170 eV), followed by the UV (0.139–0.144 eV) and the laboratory light (0.109–0.114 eV). In the dark, EF shifts close to the valence band, and thus, this explains how ΔE is larger in the dark. Supposedly, TiO2 under the UV should have a smaller ΔE when compared to that of laboratory light. However, this work reveals that ΔE under the intense UV has a larger value than in the laboratory light which contains a lesser intensity of UV. This could be due to the accumulation of the excited electrons in the conduction band leading to a Burstein shift [35], causing the ΔE of UV to become larger than that of the laboratory light. For the pH influence, as shown in Figure 11c, it can be seen that ΔE in the mildly acidic region is larger than that in the mildly basic region. However, in the region of strong acidity and strong basicity, the value of ΔE becomes nearly the same, around 0.124 to 0.128.
By adding ΔE to EF, the EC of nano-compact TiO2 thin films in different electrochemical conditions were obtained. With the band gaps from Figure 10, each corresponding EV was then calculated (see Tables S1–S11). The band-edge positions of Ana(400), Ana, P25(400), and P25 thin films obtained under different electrochemical conditions using MS-SF analysis are then displayed in Figure 12, with the pH-indication of the standard potentials of chemical reactions corresponding to water splitting and reactive oxygen species formation.
In Figure 12a, samples are tested at pH 6.5 under laboratory light and divided into two groups, which include ss&ss (under the condition of the same sample and same solution throughout the test) and fs&fs (under the condition of fresh sample and the fresh solution being applied for each frequency tested). It can be seen that Ana(400)-ss&ss, Ana-ss&ss, and P25(400)-ss&ss tend to show an obvious upward shift in their band-edge positions from 10 to 6000 Hz, while Ana(400)-fs&fs, P25-fs&fs, and P25(400)-fs&fs tend to show a slight upward shift. Despite that, they do not lose their photocatalytic ability in hydrogen and oxygen production via water splitting at pH 6.5 because their EC is well above the corresponding pH-indicated H 2 O / H 2 potential, and the EV is well below the corresponding pH-indicated H 2 O / O 2 potential [16,51,52].
For Ana(400)-ss&ss, under UV at pH 6.5, very little upward shift is observed after the 96 min immersion in Figure 12b; however, under the laboratory light or in the dark, an obvious upward shift in the band-edge positions is clearly seen when the immersion duration becomes longer. Although this is the case, there is no loss in their photocatalytic ability in hydrogen and oxygen production via water splitting. As for the influence of the solution pH, the band-edge positions in the strongly basic regions are found to be higher than those in the strongly acidic regions. From pH 4.46 to 9.64, the band edges have similar positions. However, in the strongly acidic solution below pH 2.17, TiO2 can fail to produce H2 at EC because it locates slightly below the corresponding pH-indicated H + / H 2 potential.
The superoxide radical anion ( O 2 ), with its reported standard reduction potential ranging from −0.27 to −0.33 V, vs. SHE in alkaline solution [53,54], is reportedly effective in killing microorganisms [55]. It is mainly produced from the reduction of dissolved oxygen gas at the EC of TiO2 with the photogenerated electron ( O 2 ( aq ) + e O 2 ( aq ) ). Further reduction of O 2 with the photogenerated electron will lead to the formation of hydrogen peroxide ( O 2 + 2 H + + 2 e H 2 O 2 ). The H2O2 then undergoes one-electron reduction and forms a hydroxyl radical ( H 2 O 2 + H + + e H 2 O + OH ), which is the most reactive species that oxidize most of the inorganic and organic pollutants [56,57]. On the other hand, the photogenerated hole ( h + ) at the EV of TiO2 can oxidize the water molecules to form OH ( H 2 O ( aq ) + h + OH ( aq ) + H + ) [53,58], with its reported standard oxidation potential being 2.80 V in the acidic solution (pH 0) [52], 1.86 V in the basic solution (pH 14) [52], and 2.27 V in the neutral solution (pH 7) [53].
Through the comparison of the samples of ss&ss and fs&fs at pH 6.5, it can be seen that the application of frequency from low to high, in Figure 12a, obviously increases the band-edge positions of ss&ss. The longer immersion in the laboratory light or in the dark, in Figure 12b, also leads to an obvious increase in the band-edge positions of ss&ss. However, ss&ss does not lose its photocatalytic ability in superoxide radical anion and hydroxyl radical production. This is because all Ev are well below the corresponding pH-indicated H 2 O / OH potential, and the EC is well above the corresponding pH-indicated O 2 / O 2 potential. In Figure 12b, the band-edge positions of Ana(400)-ss&ss are higher in strongly basic solutions than in strongly acidic solutions; however, it shows a plateau from pH 4.46 to 9.64. In strongly acidic solutions below the pH of 2.97, Ana(400)-ss&ss loses its photocatalytic ability in O 2 generation because EC is well below the pH-indicated O 2 / O 2 potential. This can be because, in acidic solutions, the dissolved O2 is prone to react with the photogenerated electron, together with the existing proton in the solution, to form a perhydroxyl radical (HO2) [54].

4. Conclusions

This preliminary study on the effects of frequency selection in Mott–Schottky analysis on the flat-band potential determination revealed the precipitation of thernardite Na2SO4 salt from a 0.2 M Na2SO4 solution on the surface of the nano-compact TiO2 thin film after the test, and this could cause a negative shift in the flat-band potential more than its frequency dependence, as previously reported. This study on the overlapping of frequency ranges for the analyzed cases showed that the suitable frequency range for obtaining Vfb ± 1σ using Mott Schottky at a single-frequency analysis was found to be between 200 and 2000 Hz. On the other hand, irradiation sources, immersion duration, and solution pHs contributed as well to the shift, with the pH of the solution being the most influential parameter on the flat-band potential and the band-edge positions of the nano-compact TiO2 thin film immersed in the solution. According to the analysis of band-edge positions, the nano-compact TiO2 thin film would lose its photocatalytic ability in superoxide radical anion generation at a pH below 2.97, and it would fail to produce H2 at a pH below 2.17.

Supplementary Materials

The following supporting information can be downloaded at: https://www.mdpi.com/article/10.3390/catal13061000/s1, Table S1: Ana(400)-fs&fs; Table S2: Ana(400)-ss&ss; Table S3: Ana-ss&ss; Table S4: P25-fs&fs; Table S5: P25(400)-fs&fs; Table S6: P25(400)-ss&ss; Table S7: P25(400)-ss&ss+stir; Table S8: Ana(400)-ss&ss under UV; Table S9: Ana(400)-ss&ss under laboratory light; Table S10: Ana(400)-ss&ss in the dark; Table S11: Ana(400)-ss&ss at Different pHs.

Author Contributions

Methodology by S.F.L.; Investigation by S.F.L.; Data Curation by S.F.L.; Writing—Original Draft Preparation by S.F.L.; Formal Analysis by S.F.L., I.M. and M.C.; Conceptualization by S.F.L., I.M. and M.C.; Resources by E.J.-R., I.M. and M.C.; Writing—Review and Editing by E.J-R., I.M. and M.C.; Supervision by I.M. and M.C.; Project Administration by M.C.; Funding Acquisition by M.C. All authors have read and agreed to the published version of the manuscript.

Funding

The research was funded by the project of ERIQ with Ref: PID2019-111063RB-I00.

Data Availability Statement

Not available.

Acknowledgments

We would like to thank Isaias Benjamin for his help in the experimental part.

Conflicts of Interest

The authors declare no conflict of interest.

References

  1. Martinez-Oviedo, A.; Kshetri, Y.K.; Joshi, B.; Lee, S.W. Surface modification of blue TiO2 with silane coupling agent for NOx abatement. Prog. Nat. Sci. Mater. Int. 2021, 31, 230–238. [Google Scholar] [CrossRef]
  2. Liu, Y.; Gao, F.; Ko, S.; Wang, C.; Liu, H.; Tang, X.; Yi, H.; Zhou, Y. Superior catalytic performance within H2O-vapor of W-modified CoMn2O4/TiO2 catalyst for selective catalytic reduction of NOx with NH3. Chem. Eng. Sci. 2022, 434, 134770. [Google Scholar] [CrossRef]
  3. Khan, H.; Alalm, M.G.; Lalonde-Lavoie, M.; Ordonez, M.F.; Sartirana, M.; Giordana, A.; Cerrato, G.; Bianchi, C.L.; Boffito, D.C. Photocatalytic degradation of NOx and ethanol in the gas phase by spray dried Ce-TiO2. J. Environ. Chem. Eng. 2021, 9, 106813. [Google Scholar] [CrossRef]
  4. Jimenez-Relinque, E.; Lee, S.F.; Plaza, L.; Castellote, M. Synergetic adsorption–photocatalysis process for water treatment using TiO2 supported on waste stainless steel slag. Environ. Sci. Pollut. Res. 2022, 29, 39712–39722. [Google Scholar] [CrossRef]
  5. Zhao, D.; Yang, C.-F. Recent advances in the TiO2/CdS nanocomposite used for photocatalytic hydrogen production and quantum-dot-sensitized solar cells. Renew. Sustain. Energy Rev. 2016, 54, 1048–1059. [Google Scholar] [CrossRef]
  6. Xie, Z.; Chen, J.; Chen, Y.; Wang, T.; Jiang, X.; Xie, Y.; Lu, C.Z. A Z-scheme Pd modified ZnIn2S4/P25 heterojunction for enhanced photocatalytic hydrogen evolution. Appl. Surf. Sci. 2022, 579, 152003. [Google Scholar] [CrossRef]
  7. Mao, J.X.; Wang, J.C.; Gao, H.; Shi, W.; Jiang, H.P.; Hou, Y.; Li, R.; Zhang, W.; Liu, L. S-scheme heterojunction of CuBi2O4 supported Na doped P25 for enhanced photocatalytic H2 evolution. Int. J. Hydrogen Energy 2022, 47, 8214–8223. [Google Scholar] [CrossRef]
  8. Qin, M.; Chen, L.; Zhang, H.; Humayun, M.; Fu, Y.; Xu, X.; Xue, X.; Wang, C. Achieving highly efficient pH-universal hydrogen evolution by Mott-Schottky heterojunction of Co2P/Co4N. J. Chem. Eng. 2023, 454, 140230. [Google Scholar] [CrossRef]
  9. Sun, H.; Li, L.; Humayun, M.; Zhang, H.; Bo, Y.; Ao, X.; Xu, X.; Chen, K.; Ostrikov, K.; Huo, K.; et al. Achieving highly efficient pH-universal hydrogen evolution by superhydrophilic amorphous/crystalline Rh(OH)3/NiTe coaxial nanorod array electrode. Appl. Catal. B Environ. 2022, 305, 121088. [Google Scholar] [CrossRef]
  10. Chen, B.; Humayun, M.; Li, Y.; Zhang, H.; Sun, H.; Wu, Y.; Wang, C. Constructing hierarchical fluffy CoO−Co4N@NiFe-LDH nanorod arrays for highly effective overall water splitting and urea electrolysis. ACS Sustain. Chem. Eng. 2021, 9, 14180–14192. [Google Scholar] [CrossRef]
  11. Lee, S.F.; Jimenez-Relinque, E.; Martinez, I.; Castellote, M. Photoelectrochemical global approach to the behaviour of nanostructured anatase under different irradiation conditions. Catal. Today. 2022, 397–399, 286–295. [Google Scholar] [CrossRef]
  12. Naatz, H.; Hoffmann, R.; Hartwig, A.; la Mantia, F.; Pokhrel, S.; Mädler, L. Determination of the flat band potential of nanoparticles in porous electrodes by blocking the substrate−electrolyte contact. J. Phys. Chem. C 2018, 122, 2796–2805. [Google Scholar] [CrossRef]
  13. Hankin, A.; Bedoya-Lora, F.E.; Alexander, J.C.; Regoutz, A.; Kelsall, G.H. Flat band potential determination: Avoiding the pitfalls. J. Mater. Chem. A 2019, 7, 26162–26176. [Google Scholar] [CrossRef] [Green Version]
  14. Sivula, K. Mott−Schottky Analysis of Photoelectrodes: Sanity Checks Are Needed. ACS Energy Lett. 2021, 6, 2549–2551. [Google Scholar] [CrossRef]
  15. Krysova, H.; Mazzolini, P.; Casari, C.S.; Russo, V.; Bassi, A.L.; Kavana, L. Electrochemical properties of transparent conducting films of tantalum-doped titanium dioxide. Electrochim. Acta. 2017, 232, 44–53. [Google Scholar] [CrossRef]
  16. Sanz-Navarro, C.F.; Lee, S.F.; Yap, S.S.; Nee, C.H.; Yap, S.L. Electrochemical stability and corrosion mechanism of fluorine-doped tin oxide film under cathodic polarization in near neutral electrolyte. Thin Solid Films. 2023, 768, 139697. [Google Scholar] [CrossRef]
  17. Li, H.; Wu, S.; Hood, Z.D.; Sun, J.; Hu, B.; Liang, C.; Yang, S.; Xu, Y.; Jiang, B. Atomic defects in ultra-thin mesoporous TiO2 enhance photocatalytic hydrogen evolution from water splitting. Appl. Surf. Sci. 2020, 513, 145723. [Google Scholar] [CrossRef]
  18. Grochowska, K.; Nedyalkov, N.; Karczewski, J.; Haryński, Ł.; Śliwiński, G.; Siuzdak, K. Anodic titania nanotubes decorated with gold nanoparticles produced by laser-induced dewetting of thin metallic films. Sci. Rep. 2020, 10, 20506. [Google Scholar] [CrossRef]
  19. Lim, Y.; Lee, S.Y.; Kim, D.; Han, M.-K.; Han, H.S.; Kang, S.H.; Kim, J.K.; Sim, U.; Park, Y.I. Expanded solar absorption spectrum to improve photoelectrochemical oxygen evolution reaction: Synergistic effect of upconversion nanoparticles and ZnFe2O4/TiO2. J. Chem. Eng. 2022, 438, 135503. [Google Scholar] [CrossRef]
  20. Giannakopoulou, T.; Papailias, I.; Todorova, N.; Boukos, N.; Liu, Y.; Yu, J.; Trapalis, C. Tailoring the energy band gap and edges’ potentials of g-C3N4/TiO2 composite photocatalysts for NOx removal. Chem. Eng. J. 2017, 310, 571–580. [Google Scholar] [CrossRef]
  21. Sudhagar, P.; Devadoss, A.; Nakata, K.; Terashima, C.; Fujishima, A. Enhanced photoelectrocatalytic water splitting at hierarchical Gd3+:TiO2 nanostructures through amplifying light reception and surface states passivation. J. Electrochem. Soc. 2015, 162, 108–114. [Google Scholar] [CrossRef]
  22. Far, V.B.; Jafarzadeh, K.; Gugtapeh, H.S.; Mirali, S.M. A study on electrical properties of thermally grown TiO2 film at the interface of Ti/RuO2–IrO2–TiO2 anode using Mott-Schottky and electrochemical impedance spectroscopy techniques. Mater. Chem. Phys. 2020, 256, 123756. [Google Scholar]
  23. Chen, H.; Liu, G.; Wang, L. Switched photocurrent direction in Au/TiO2 bilayer thin films. Sci. Rep. 2015, 5, 10852. [Google Scholar] [CrossRef] [PubMed] [Green Version]
  24. Denisov, N.; Zhou, X.; Cha, G.; Schmuki, P. Photocurrent conversion efficiency of TiO2 nanotube photoanodes in dependence of illumination intensity. Electrochim. Acta. 2021, 377, 137988. [Google Scholar] [CrossRef]
  25. Radecka, M.; Rekas, M.; Trenczek-Zajac, A.; Zakrzewska, K. Importance of the band gap energy and flat band potential for application of modified TiO2 photoanodes in water photolysis. J. Power Sources. 2008, 181, 46–55. [Google Scholar] [CrossRef]
  26. Radecka, M.; Wierzbicka, M.; Komornicki, S.; Rekas, M. Influence of Cr on photoelectrochemical properties of TiO2 thin films. Phys. B Condens. Matter. 2004, 348, 160–168. [Google Scholar] [CrossRef]
  27. Gerischer, H. Neglected problems in the pH dependence of the flatband potential of semiconducting oxides and semiconductors covered with oxide layers. Electrochim. Acta. 1989, 34, 1005–1009. [Google Scholar] [CrossRef]
  28. Kong, D.-S.; Zhang, X.-D.; Wang, J.; Wang, C.; Zhao, X.; Feng, Y.-Y.; Li, W.-J. A photoelectrochemical study on the features of carbonate-catalyzed water oxidation at illuminated TiO2/Solution interface. J. Solid State Electrochem. 2013, 17, 69–77. [Google Scholar] [CrossRef]
  29. Van de Krol, R.; Goossens, A.; Schoonman, J. Mott-Schottky analysis of nanometer-scale thin-film anatase TiO2. J. Electrochem. Soc. 1997, 144, 1723–1727. [Google Scholar] [CrossRef]
  30. Bisquert, J. Physical electrochemistry of nanostructured devices. Phys. Chem. Chem. Phys. 2008, 10, 49–72. [Google Scholar] [CrossRef]
  31. Vafaei, M.; Mohammadi, M.R. Impact of chromium doping on physical, optical, electronic and photovoltaic properties of nanoparticle TiO2 photoanodes in dye-sensitized solar cells. New J. Chem. 2017, 41, 14516–14527. [Google Scholar] [CrossRef]
  32. Matsumoto, Y. Energy positions of oxide semiconductors and photocatalysis with iron complex oxides. J. Solid State Chem. 1996, 126, 227–234. [Google Scholar] [CrossRef]
  33. Kavan, L.; Grätzel, M.; Gilbert, S.E.; Klemenz, C.; Scheel, H.J. Electrochemical and photoelectrochemical investigation of single-crystal anatase. J. Am. Chem. Soc. 1996, 118, 6716–6723. [Google Scholar] [CrossRef]
  34. Doustkhah, E.; Assadi, M.H.N.; Komaguchi, K.; Tsunoji, N.; Esmat, M.; Fukata, N.; Tomita, O.; Abe, R.; Ohtani, B.; Ide, Y. In situ blue titania via band shape engineering for exceptional solar H2 production in rutile TiO2. Appl. Catal. B Environ. 2021, 297, 120380. [Google Scholar] [CrossRef]
  35. Sakai, N.; Ebina, Y.; Takada, K.; Sasaki, T. Electronic band structure of titania semiconductor nanosheets revealed by electrochemical and photoelectrochemical studies. J. Am. Chem. Soc. 2004, 126, 5851–5858. [Google Scholar] [CrossRef]
  36. Ohtani, B.; Prieto-Mahaney, O.O.; Li, D.; Abe, R. What is Degussa (Evonik) P25? Crystalline composition analysis, reconstruction from isolated pure particles and photocatalytic activity test. J. Photochem. Photobiol. A Chem. 2010, 216, 179–182. [Google Scholar] [CrossRef] [Green Version]
  37. Nazeeruddin, M.K.; Kay, A.; Rodicio, I.; Humphry-Baker, R.; Muller, E.; Liska, P.; Vlachopoulos, N.; Grätzel, M. Conversion of light to electricity by cis-X2Bis(2,2′-bipyridyl-4,4′-dicarboxylate)ruthenium(II) charge-transfer sensitizers (X = Cl, Br, I, CN, and SCN) on nanocrystalline TiO2 electrodes. J. Am. Chem. Soc. 1993, 115, 6382–6390. [Google Scholar] [CrossRef]
  38. de Jongh, P.E.; Vanmaekelbergh, D. Trap-limited electronic transport in assemblies of nanometer-size TiO2 particles. Phys. Rev. Lett. 1996, 77, 3427–3430. [Google Scholar] [CrossRef]
  39. El-Deen, S.S.; Hashem, A.M.; Abdel Ghany, A.E.; Indris, S.; Ehrenberg, H.; Mauger, A.; Julien, C.M. Anatase TiO2 nanoparticles for lithium-ion batteries. Ionics 2018, 24, 2925–2934. [Google Scholar] [CrossRef]
  40. Masood, M.H.; Haleem, N.; Shakeel, I.; Jamal, Y. Carbon dioxide conversion into the reaction intermediate sodium formate for the synthesis of formic acid. Res. Chem. Intermed. 2020, 46, 5165–5180. [Google Scholar] [CrossRef]
  41. Slavkova, Z.; Kostadinova, O.; Avdeev, G.; Petkova, T. Structure and thermal behaviour of lithium sodium sulphate. In Advanced Nanotechnologies for Detection and Defence against CBRN Agents; Petkov, P., Tsiulyanu, D., Popov, C., Kulisch, W., Eds.; Springer: Cham, The Netherlands, 2017; pp. 87–93. [Google Scholar]
  42. Lee, K.-T.; Lu, S.-Y. Porous FTO thin layers created with a facile one-step Sn4+-based anodic deposition process and their potential applications in ion sensing. J. Mater. Sci. 2012, 22, 16259–16268. [Google Scholar] [CrossRef]
  43. He, J.; Du, Y.-E.; Bai, Y.; An, J.; Cai, X.; Chen, Y.; Wang, P.; Yang, X.; Feng, Q. Facile formation of anatase/rutile TiO2 nanocomposites with enhanced photocatalytic activity. Molecules 2019, 24, 2996. [Google Scholar] [CrossRef] [Green Version]
  44. Rodriguez-Navarro, C.; Doehne, E.; Sebastian, E. How does sodium sulfate crystallize? Implications for the decay and testing of building materials. Cem. Concr. Res. 2000, 30, 1527–1534. [Google Scholar] [CrossRef] [Green Version]
  45. Sequeda-Pico, I.N.; Joya-Herrera, L.M.; Meléndez, A.M.; Ospina, R.O.; Henao Martínez, J.A.; Niño-Gómez, M.E. Enhanced photoelectrochemical performance of iron and carbon self-doped TiO2 photoanodes modified with nitrogen. Thin Solid Films. 2018, 653, 326–332. [Google Scholar] [CrossRef]
  46. Beranek, R. (Photo)electrochemical methods for the determination of the band edge positions of TiO2-based nanomaterials. Adv. Phys. Chem. 2011, 2011, 786759. [Google Scholar] [CrossRef] [Green Version]
  47. Bukackova, M.; Marsalek, R. Interaction of BSA with ZnO, TiO2, and CeO2 nanoparticles. Biophys. Chem. 2020, 267, 106475. [Google Scholar] [CrossRef] [PubMed]
  48. He, H.; Cheng, Y.; Yang, C.; Zeng, G.; Zhu, C.; Yan, Z. Influences of anion concentration and valence on dispersion and aggregation of titanium dioxide nanoparticles in aqueous solutions. J. Environ. Sci. 2017, 54, 135–141. [Google Scholar] [CrossRef] [PubMed]
  49. Wen, D.; Ding, Y. Formulation of nanofluids for natural convective heat transfer applications. Int. J. Heat Fluid Flow. 2005, 26, 855–864. [Google Scholar] [CrossRef]
  50. Gumy, D.; Morais, C.; Bowen, P.; Pulgarin, C.; Giraldo, S.; Hajdu, R.; Kiwi, J. Catalytic activity of commercial of TiO2 powders for the abatement of the bacteria (E. coli) under solar simulated light: Influence of the isoelectric point. Appl. Catal. B 2006, 63, 76–84. [Google Scholar] [CrossRef]
  51. Cheng, Y.; Jiang, S.P. Advances in electrocatalysts for oxygen evolution reaction of water electrolysis—From metal oxides to carbon nanotubes. Prog. Nat. Sci. Mater. Int. 2015, 25, 545–553. [Google Scholar] [CrossRef] [Green Version]
  52. Ghernaout, D. Advanced oxidation phenomena in electrocoagulation process: A myth or a reality? Desalin. Water Treat. 2013, 51, 7536–7554. [Google Scholar] [CrossRef]
  53. Singh, P.; Sharma, K.; Hasija, V.; Sharma, V.; Sharma, S.; Raizada, P.; Singh, M.; Saini, A.K.; Hosseini-Bandegharaei, A.; Thakur, V.K. Systematic review on applicability of magnetic iron oxides-integrated photocatalysts for degradation of organic pollutants in water. Mater. Today Chem. 2019, 14, 100186. [Google Scholar] [CrossRef]
  54. Bard, A.J.; Parsons, R.; Jordan, J. Standard Potentials in Aqueous Solution; Marcel Dekker, Inc.: New York, NY, USA; Basel, Switzerland, 1985. [Google Scholar]
  55. Prolo, C.; Estrada, D.; Piacenza, L.; Benítez, D.; Comini, M.A.; Radi, R.; Álvarez, M.N. NOx2-derived superoxide radical is crucial to control acute Trypanosoma cruzi infection. Redox Biol. 2021, 46, 102085. [Google Scholar] [CrossRef]
  56. Lv, X.; Lam, F.L.-Y.; Hu, X. Developing SrTiO3/TiO2 heterostructure nanotube array for photocatalytic fuel cells with improved efficiency and elucidating the effects of organic substrates. Chem. Eng. J. 2022, 427, 131602. [Google Scholar] [CrossRef]
  57. Sheikhmohammadi, A.; Asgari, E.; Nourmoradi, H.; Fazli, M.M.; Yeganeh, M. Ultrasound-assisted decomposition of metronidazole by synthesized TiO2/Fe3O4 nanocatalyst: Influencing factors and mechanisms. J. Environ. Chem. Eng. 2021, 9, 105844. [Google Scholar] [CrossRef]
  58. Koppenol, W.H.; Stanbury, D.M.; Bounds, P.L. Electrode potentials of partially reduced oxygen species, from dioxygen to water. Free Radic. Biol. Med. 2010, 49, 317–322. [Google Scholar] [CrossRef]
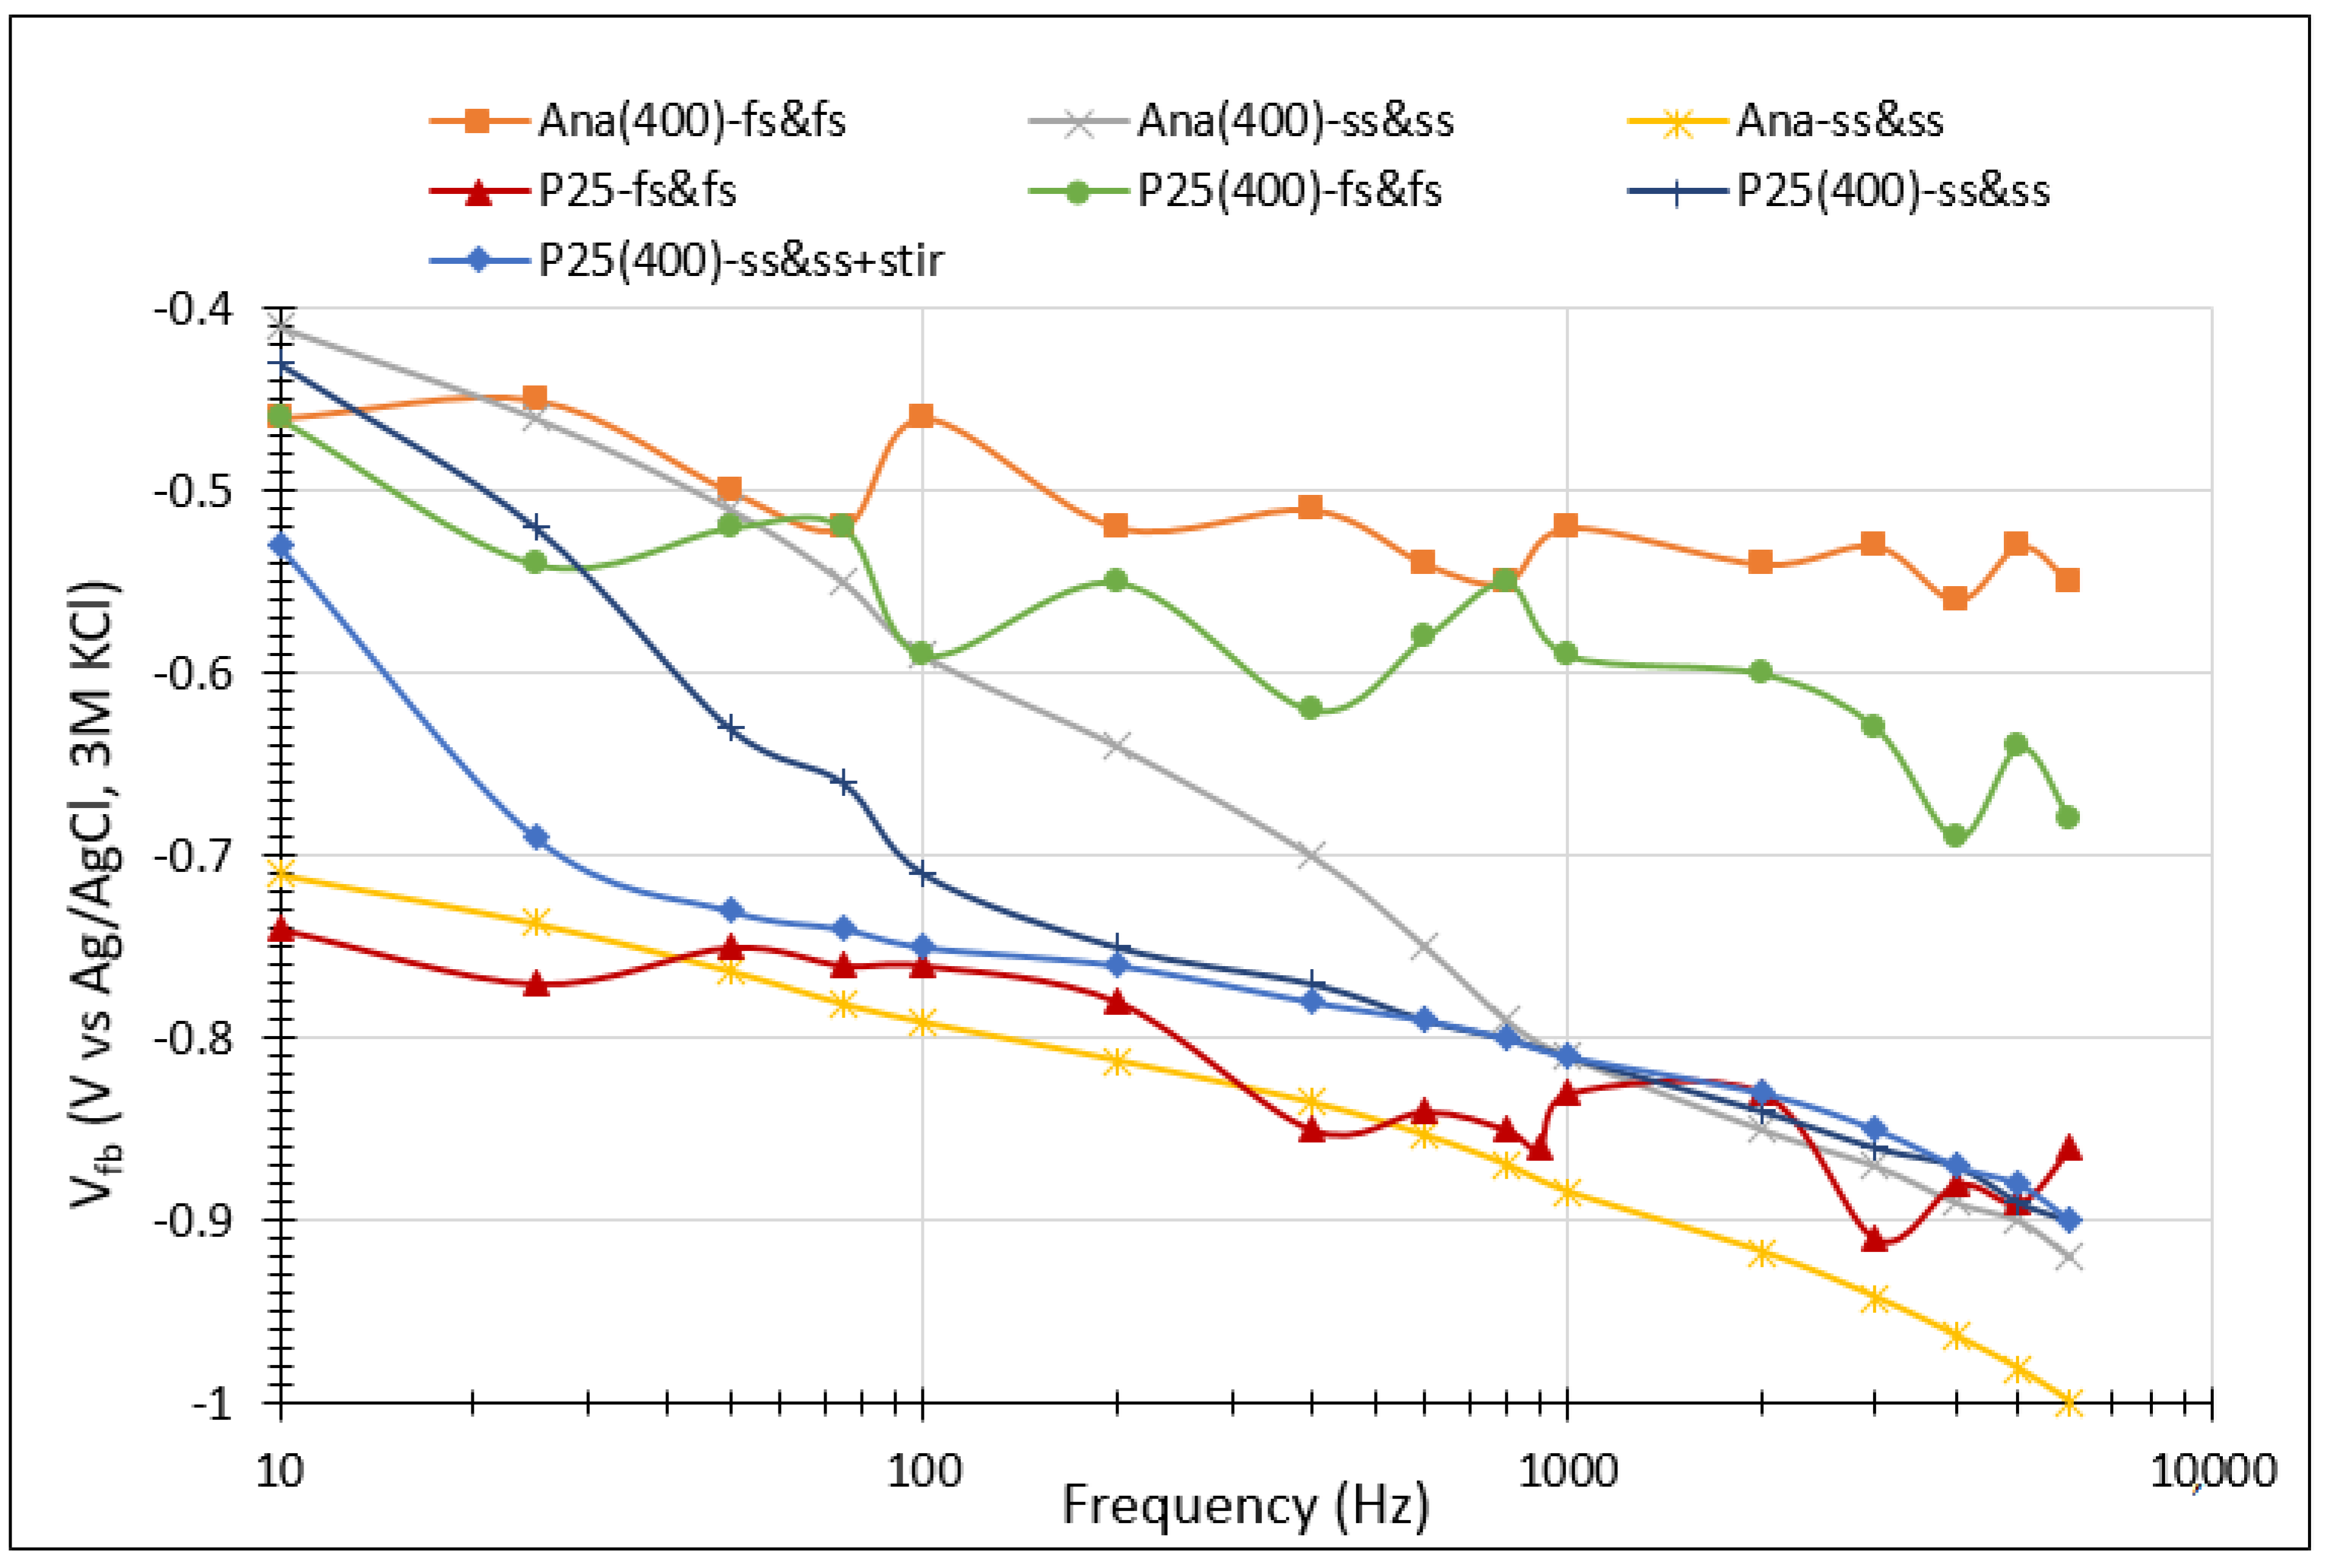
Figure 1. (a) Mott–Schottky plot of nano-compact P25(400) thin-film coated on FTO in a 0.2 M Na2SO4 solution at pH 6.5 at a frequency of 400 Hz. (b) Schematic diagram of constructing the band-edge position via MS-SF analysis.
Catalysts 13 01000 g001
Figure 2. Thermogravimetric analysis of as-received anatase and P25.
Catalysts 13 01000 g002
Figure 3. (a) Particle size distribution measured by laser diffraction. (b) Side morphology revealing the thickness of nano-compact-P25 thin film. Top morphology revealing particle sizes of nano-compact thin films of (c) P25, (d) P25(400), (e) Ana, and (f) Ana (400).
Catalysts 13 01000 g003aCatalysts 13 01000 g003b
Figure 4. Flat-band potential(Vfb) as a function of a frequency range from 10 to 6000 Hz for nano-compact Ana, Ana(400), P25, and P25(400) thin film in 0.2 M Na2SO4 at pH 6.5 in the laboratory light.
Catalysts 13 01000 g004
Figure 5. XRD pattern of nano-compact (a) Ana(400)-ss&ss and (b) P25(400)-ss&ss + stir thin film.
Catalysts 13 01000 g005aCatalysts 13 01000 g005b
Figure 6. (a) SEM images of the nano-compact P25(400)-ss&ss + stir thin film. (b) The EDS mappings of the elements of Ti (pink), O (green), Na (purple), and S (blue). (c) The full EDS spectrum of the right SEM image of (a) at ×5000.
Catalysts 13 01000 g006aCatalysts 13 01000 g006b
Figure 7. Intensity at XRD peak [111] of thenardite Na2SO4 to estimate the amount of thenardite Na2SO4 salt deposited on the TiO2 surface.
Catalysts 13 01000 g007
Figure 8. (a) Flat-band potential (Vfb) of nano-compact Ana(400)-ss&ss thin film versus time under UV, laboratory light, and dark. (b) Intensity at XRD peak [111] of thenardite Na2SO4 salt to estimate the amount of thenardite Na2SO4 salt deposited on Ana(400)-ss&ss thin film under UV, laboratory light, and dark. (c) SEM images of nano-compact Ana(400)-ss&ss thin film under UV and the magnification of thenardite Na2SO4 microstructure at ×5000. (d) the EDS mappings of the element of Ti (pink), O (green), Na (purple), and S (blue), and (e) the full EDS spectrum of the right SEM image of (c) at ×5000.
Catalysts 13 01000 g008aCatalysts 13 01000 g008b
Figure 9. pH effect on flat-band potential (Vfb) of nano-impact Ana(400)-ss&ss thin film in laboratory light.
Catalysts 13 01000 g009
Figure 10. Plot of (F(R )·hʋ)1/2 and hʋ for obtaining band gap energies (Eg) of Ana(400), Ana, P25(400), and P25 powder.
Catalysts 13 01000 g010
Figure 11. (a) ΔE of nano-compact Ana(400)-fs&fs, Ana(400)-ss&ss, Ana-ss&ss, P25-fs&fs, P25(400)-fs&fs, P25(400)-ss&ss, and P25(400)-ss&ss + stir thin film coated on FTO, as a function of a frequency range from 10 to 6000 Hz in the laboratory light. (b) ΔE of nano-compact Ana(400)-ss&ss thin film under different irradiation sources. (c) ΔE of nano-compact Ana(400)-ss&ss thin film under different pH solutions in the laboratory light.
Catalysts 13 01000 g011
Figure 12. (a,b) show schematic diagram of band-edge positions of nano-compact Ana(400), Ana, P25(400), and P25 thin film under different electrochemical conditions obtained via MS-SF analysis, together with the pH-indicated standard potentials for water splitting, as well as superoxide radical anion and hydroxyl radical generation.
Catalysts 13 01000 g012aCatalysts 13 01000 g012b
Table 1. The sample’s label and its description in the determination of a suitable frequency used in the MS-SF analysis.
Sample’s LabelDescription
Ana(400)-fs&fsAnatase calcined at 400 °C, fresh sample, and fresh solution for each frequency tested
Ana(400)-ss&ssAnatase calcined at 400 °C, same sample, and same solution throughout the test
Ana-ss&ssAnatase in as-received, same sample, and same solution throughout the test
P25-fs&fsP25 in as-received, fresh sample, and fresh solution for each frequency tested
P25(400)-fs&fsP25 calcined at 400 °C, fresh sample, and fresh solution for each frequency tested
P25(400)-ss&ssP25 calcined at 400 °C, same sample, and same solution throughout the test
P25(400)-ss&ss + stirP25 calcined at 400 °C, same sample, and same solution plus solution stirring by magnet throughout the test
Table 2. Mean of flat-band potential(Vfb) calculated over a range of frequencies between 10 and 6000 Hz.
Mean of VfbStandard Deviation, σUpper Limit of Vfb at +1σLower Limit of Vfb at −1σRange of Frequency (Hz) Corresponding to Vfb ± 1σ
Ana(400)- fs&fs−0.516±0.035−0.481−0.551200–3000
Ana(400)-ss&ss−0.709±0.172−0.538−0.88175–3000
Ana-ss&ss−0.856±0.091−0.765−0.94575–3000
P25-fs&fs−0.823±0.055−0.768−0.877200–2000
P25(400)-fs&fs−0.584±0.063−0.521−0.647100–3000
P25(400)-ss&ss−0.749±0.137−0.611−0.88650–4000
P25(400)-ss&ss + stir−0.781±0.092−0.689−0.87225–4000
Disclaimer/Publisher’s Note: The statements, opinions and data contained in all publications are solely those of the individual author(s) and contributor(s) and not of MDPI and/or the editor(s). MDPI and/or the editor(s) disclaim responsibility for any injury to people or property resulting from any ideas, methods, instructions or products referred to in the content.

